|
Electric Power Development Co., Ltd. (J-POWER) is a Japanese power generation and transmission company. Its core business involves generating electricity through hydro, thermal, wind, geothermal, and biomass power plants, as well as nuclear power construction. The company also operates transmission and substation infrastructure to provide power transmission services to nine general transmission and distribution utilities in Japan, excluding Okinawa Electric Power. J-POWER engages in overseas power generation projects and related energy solutions, including investments in gas cogeneration and biomass utilization. Additional activities include coal sales, telecommunications, and other services leveraging the group's operational resources. The company was established in 1952 under the Power Development Promotion Act and fully privatized in 2004. Summarised from the annual report, fiscal year ended Mar 2026 |
Industry Utilities - Independent Power Producers | Homepage jpower.co.jp |
| Sector Utilities | IR page jpower.co.jp/ir | |
|
Tags
hydroelectric power, thermal power, wind power, geothermal power, biomass energy, nuclear power, power transmission, overseas energy projects, coal sales, energy solutions, J-POWER, Okinawa Electric Power, Oma Nuclear Power Plant, Kishu Hachinozawa Wind Farm, Kiyokawa Thermal Power Plant, Nagoya Substation, Onikoube Geothermal Power Plant
|
Press page — |
Metrics
| Valuation | |
|---|---|
| Market cap | ¥ 702.883B |
| Market cap (USD) | $ 4.393B |
| P/E | 13.60 |
| PEG | — |
| P/BV | 0.44 |
| P/S | 0.54 |
| P/OCF | 2.78 |
| P/FCF | 23.19 |
| Dividend yield | 2.5% |
| Turnover / mcap | — |
| Returns | |
|---|---|
| ROE | 3.9% |
| ROI | 2.3% |
| ROIC | 2.8% |
| Profit margin | 5.0% |
| Growth | |
|---|---|
| Revenue growing | No |
| Profits growing | No |
| Revenue up 3y | No |
| Revenue up 5y | No |
| Earnings growth 3y (net profit CAGR) | -19.8% |
| Quality | |
|---|---|
| Profitable | Yes |
| Margin expanding | No |
| Buying back stock | No |
| Diluting (TTM) | No |
| Debt/Equity | — |
| Podcast bulls (TTM) | Sign up |
| Podcast bears (TTM) | Sign up |
| Podcast sentiment (TTM) | Sign up |
| Podcast sentiment % (TTM) | Sign up |
| News sentiment (TTM) | 0 |
| Quality score | -27.8% |
| Insiders | |
|---|---|
| Buys, 1w | Sign up |
| Buys, 1m | Sign up |
| Buys, 1y | Sign up |
| Sells, 1w | Sign up |
| Sells, 1m | Sign up |
| Sells, 1y | Sign up |
Sign up to see this company's insider trades
| Figure | FY 2026 | FY 2025 | FY 2024 | FY 2023 | FY 2022 | FY 2021 | FY 2020 | FY 2019 | FY 2018 | FY 2017 | FY 2016 | FY 2015 | FY 2014 | FY 2013 |
|---|---|---|---|---|---|---|---|---|---|---|---|---|---|---|
| Revenue | 1.182T | 1.317T | 1.258T | 1.842T | 1.085T | 909.144B | 913.775B | 897.366B | 856.252B | 744.402B | 780.072B | 750.627B | 706.835B | 656.056B |
| Net profit | 58.537B | 92.469B | 77.774B | 113.689B | 69.687B | 22.304B | 42.277B | 46.252B | 68.448B | 41.429B | 40.081B | 43.206B | 28.694B | 29.808B |
| Free cash flow | 46.881B | 126.415B | 138.181B | 10.97B | -6.902B | 8.663B | 9.725B | 42.414B | 61.494B | 7.291B | 5.29B | — | — | — |
| Figure | FY 2026 | FY 2025 | FY 2024 | FY 2023 | FY 2022 | FY 2021 | FY 2020 | FY 2019 | FY 2018 | FY 2017 | FY 2016 | FY 2015 | FY 2014 | FY 2013 |
|---|---|---|---|---|---|---|---|---|---|---|---|---|---|---|
| Share price | 4.338K | 2.539K | 2.5K | 2.124K | 1.741K | 1.936K | 2.167K | 2.693K | 2.686K | 2.597K | 3.55K | 4.043K | 2.913K | 2.481K |
| Price performance 12m | 0.71 | 0.02 | 0.18 | 0.22 | -0.1 | -0.11 | -0.2 | 0 | 0.03 | -0.27 | -0.12 | 0.39 | 0.17 | — |
Filed figures
Lines the statements and their notes report beside the headline figures, read from the filings' XBRL as filed (no restatement applied), with figures computed from one filing's own lines. Cash-flow lines carry their cash direction: an outflow is negative. Each period links to its filing; a figure's period, report date and tag are in its tooltip.
| Figure | Mar 2017 | Mar 2018 | Mar 2019 | Mar 2020 | Mar 2021 | Mar 2022 | Mar 2023 | Mar 2024 | Mar 2025 | Mar 2026 |
|---|---|---|---|---|---|---|---|---|---|---|
| Balance sheet detail | ||||||||||
| Trade receivables (JPY) | 78.8B | 91.4B | 84.7B | 80.5B | 66.1B | 157B | 255B | 192B | 217B | 217B |
| ↳ YoY growth | +18.8% | +16.0% | -7.4% | -5.0% | -17.8% | +137.3% | +62.7% | -24.9% | +13.5% | -0.1% |
| ↳ 5y CAGR | -0.1% | +14.8% | +22.8% | +17.7% | +22.0% | +26.8% | ||||
| Borrowings, current (JPY) | 25B | 16.8B | 15.3B | 15B | 29B | 98.2B | 10.7B | 8.03B | 8.13B | 8.27B |
| Borrowings, non-current (JPY) | 1.39T | 1.43T | 1.47T | 1.47T | 1.55T | 1.55T | 1.67T | 1.66T | 1.65T | 1.67T |
| Bonds payable (JPY) | 495B | 555B | 615B | 605B | 655B | 706B | 774B | 729B | 653B | 679B |
| Lease liabilities (JPY) | 353M | 368M | 1.11B | 2.22B | 2.48B | 2.24B | 1.7B | 1.21B | 2.04B | 1.91B |
| Cash and deposits (JPY) | 117B | 130B | 121B | 159B | 190B | 223B | 342B | 279B | 309B | 397B |
| Net debt (borrowings + leases - cash) (JPY) | 1.29T | 1.32T | 1.36T | 1.33T | 1.39T | 1.42T | 1.34T | 1.39T | 1.35T | 1.28T |
| Cash flow detail | ||||||||||
| Operating cash flow (JPY) | 115B | 160B | 148B | 159B | 168B | 128B | 156B | 254B | 250B | 224B |
| Purchases of property, plant and equipment (JPY) | -108B | -98.8B | -106B | -150B | -159B | -135B | -145B | -116B | -124B | -177B |
| Change in receivables (cash effect) (JPY) | -13.4B | -10.8B | 6.21B | 5.82B | 14.2B | -10.3B | -47.3B | 37B | -9.7B | 4.35B |
| Change in inventories (cash effect) (JPY) | -5.5B | -5.12B | -1.32B | 3.93B | 4.41B | -16B | -44.4B | 31.4B | 9.4B | -4.78B |
| Change in payables (cash effect) (JPY) | -6.48B | -2.14B | 3.39B | 322M | -24M | 12.2B | 18.3B | -13.5B | 11.5B | -6.3B |
| Dividends paid (cash effect) (JPY) | -12.8B | -12.8B | -13.7B | -13.7B | -13.7B | -13.7B | -14.6B | -17.4B | -19.2B | -18.1B |
| Share buybacks (cash effect) (JPY) | — | — | — | — | — | — | — | — | 0.00 | -20.5B |
| Interest paid (cash effect) (JPY) | -30.2B | -28.5B | -26.1B | -25.7B | -23.2B | -21.5B | -26.2B | -34.3B | -32.9B | -31.8B |
| Income taxes paid (cash effect) (JPY) | -20.3B | -19.2B | -23.8B | -17.5B | -13.1B | -45.4B | -21.7B | -32.8B | -21.9B | -51.5B |
| Operating cash flow before change in receivables (JPY) | 129B | 171B | 142B | 153B | 154B | 139B | 203B | 217B | 260B | 220B |
| Free cash flow (OCF - PPE - intangibles) (JPY) | 7.29B | 61.5B | 42.4B | 9.73B | 8.66B | -6.9B | 11B | 138B | 126B | 46.9B |
| Income detail | ||||||||||
| Research and development expense (JPY) | 5.87B | 17.2B | 15.3B | 16.1B | 15.6B | 8.5B | 10.3B | 7.7B | 7B | 9.4B |
| ↳ 5y CAGR | +31.1% | +7.7% | -9.8% | -12.8% | -15.3% | -9.6% | ||||
| Total comprehensive income (JPY) | 62B | 92.3B | 34.2B | 33.6B | 19.6B | 129B | 195B | 160B | 157B | 125B |
| Comprehensive income to owners (JPY) | 53.1B | 76.3B | 23.9B | 24.1B | 15.1B | 121B | 177B | 149B | 140B | 108B |
| Segments | ||||||||||
| Power Generation · Segment revenue (JPY) | — | — | — | — | — | — | — | 876B | 967B | 866B |
| ↳ YoY growth | +10.5% | -10.5% | ||||||||
| Transmissionand Transformation · Segment revenue (JPY) | — | — | — | — | — | — | — | 49.6B | 50.5B | 49.9B |
| ↳ YoY growth | +1.8% | -1.2% | ||||||||
| Reported | Jun 29, 2017 | Jun 28, 2018 | Jun 27, 2019 | Jun 26, 2020 | Jun 25, 2021 | Jun 29, 2022 | Jun 29, 2023 | Jun 25, 2025 | Jun 24, 2026 | Jun 24, 2026 |
Sign up to see institutional holdings
Sign UpPodcast Mentions
Sign up to see podcast mentions and sentiment
Sign UpTimely disclosures published on TDnet, newest first, titles as filed in Japanese. The link opens the disclosure on TDnet. Filings with EDINET (periodic reports, extraordinary reports, offerings, holding and buy-back reports), newest first, titles as filed in Japanese. The link opens the filing on EDINET. Press releases from the company's own website, newest first.
シリーズ第2弾は大学を飛び出し、奥只見ダムへ
2026年10月30日
電源開発株式会社
電源開発株式会社(以下、J-POWER、本社:東京都中央区、代表取締役社長 社長執行役員:加藤 英彰)は、新CM「TAの池田さん」シリーズ「ダム篇」「遊覧船篇」をWebにて先行公開します。なお、テレビCMは、J-POWERグループの提供番組「音のソノリティ~世界でたった一つの音~ 」(日本テレビ系列 毎週日曜20:54~)などで、11月1日より放送を開始します。併せて、新CMと連動したWeb限定の動画も公開します。

舞台はJ-POWER奥只見ダム。現地で撮影
今回の新CMでは、池田 エライザさん演じるティーチング・アシスタント(TA※)の池田さんと、山時 聡真さん演じる大学生・山時くんが、大学のフィールドワークでJ-POWER奥只見ダム(所在地:新潟県魚沼市、福島県南会津郡檜枝岐村)を訪れ、事業について理解を深めていく様子を描いています。
前作に引き続き、J-POWERへの深い愛着を持つ池田さんが大学のフィールドワーク先として選んだのは、J-POWERの水力発電設備である奥只見ダム。池田さんはフィールドワークの最中も、学生たちにJ-POWERとその事業の魅力を語りかけます。
実際に電気をつくり、届ける現場を舞台にした「ダム篇」「遊覧船篇」の2篇を通じて、J-POWERグループの事業をより身近に感じ、関心を持っていただくきっかけとなれば幸いです。
新CMは「ダム篇」「遊覧船篇」の2本をそれぞれ15秒、30秒版で制作し、J-POWER公式YouTube
にて公開しています。
- 大学院に在籍する学生が、学部生の授業などで大学教員をサポートし、授業の補助(実験・実習など)を行う制度およびその役割のこと。
 ※新CMの一場面
CMクリエイティブディレクターは「福里 真一さん」が担当
今回の新CM「TAの池田さん」シリーズは、トヨタ自動車の「こども店長」やサントリーBOSS「宇宙人ジョーンズ」シリーズなど、これまで2,000本以上ものCMを手掛けてきた福里真一さんに、クリエイティブディレクターを務めていただきました。
福里 真一さん
 ワンスカイ クリエイティブディレクター/CMプランナー
1968年鎌倉生まれ。一橋大学社会学部卒業後、1992年電通入社。2001年より「ワンスカイ」所属。代表作:トヨタ自動車「こども店長」、富士フイルム「お正月を写そう」、トミー・リー・ジョーンズ主演によるサントリーBOSS「宇宙人ジョーンズ」、ユニクロ「LifeとWear」など。親しみのわくCMを、数多くつくりだしている。
2001年にクリエイターオブザイヤーを最年少受賞。そのほか、日テレCM大賞、JAA広告賞(経済産業大臣賞)など数々の賞を受賞している。
「TAの池田さん」キャスト紹介
池田 エライザさん
 1996年4月16日生まれ、福岡県出身。
2009年、ファッション誌「ニコラ」の第13回ニコラモデル・オーディションでグランプリを受賞。2011年、映画「高校デビュー」で俳優デビューを果たす。俳優業にとどまらず、映画監督、歌手など幅広いジャンルで活躍。2020年には、自身が原案・初監督を務めた映画「夏、至るころ」が公開。NHKプレミアムドラマ「舟を編む〜私、辞書つくります〜」(2024年2月)では主演を務めた。近年では、Netflixシリーズ「地面師たち」(2024年)、TBS日曜劇場「海に眠るダイヤモンド」(2024年)、映画『リライト』(2025年)、Netflixシリーズ「九条の大罪」(2026年)、映画「九条の大罪」(2027年)に出演。
山時 聡真さん
 2005年6月6日生まれ。東京都出身。
5歳から芸能活動をスタート。2016年、映画『ゆずの葉ゆれて』で俳優デビュー。2023年、宮崎駿監督のアニメ映画『君たちはどう生きるか』では主人公・眞人の声を担当。近年の出演作は映画『蔵のある街』主演(2025)、『90メートル』主演(2026)、『ブルーロック』(2026)、 テレビドラマ『ちはやふるーめぐりー』(日本テレビ系/2025)、『時すでにおスシ!?』(TBS系/2026)など。第18回TAMA映画賞最優秀新進男優賞を受賞。待機作に映画『高校生家族』(2027年1月8日公開)がある。
新CM特設サイトを公開
新CMの公開にあわせ、特設サイト
も公開します。「ダム篇」「遊覧船篇」に加え、新CMと連動したWeb限定の特別動画「TAの池田さん課外授業 奥只見ダム編」を掲載します。
特別動画では、新CMの舞台となった奥只見ダムを訪れた池田さんと山時くんの様子を通じて、J-POWERグループの水力発電をはじめとした事業を、より分かりやすく知っていただける内容となっています。

 図1 「Cアプリ」イメージ画像
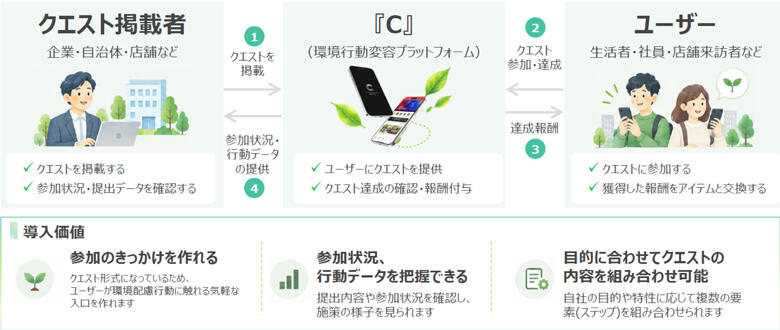 図2 「Cアプリ」のサービス全体像
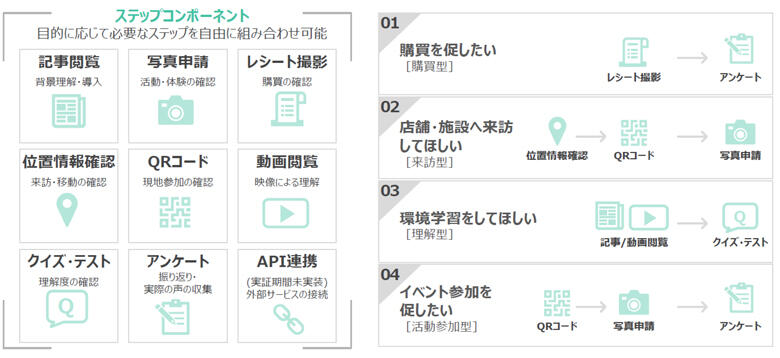 図3 クエストの設計例
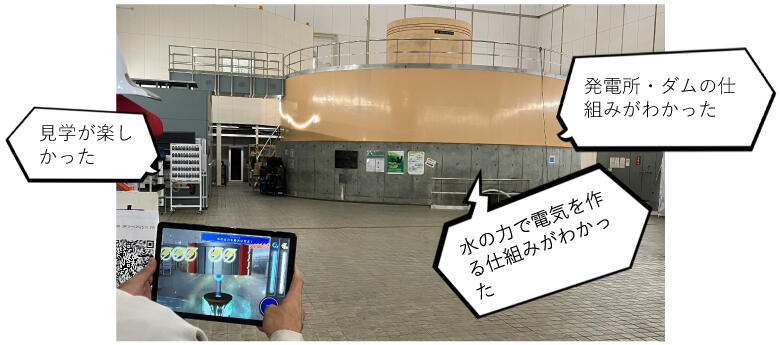
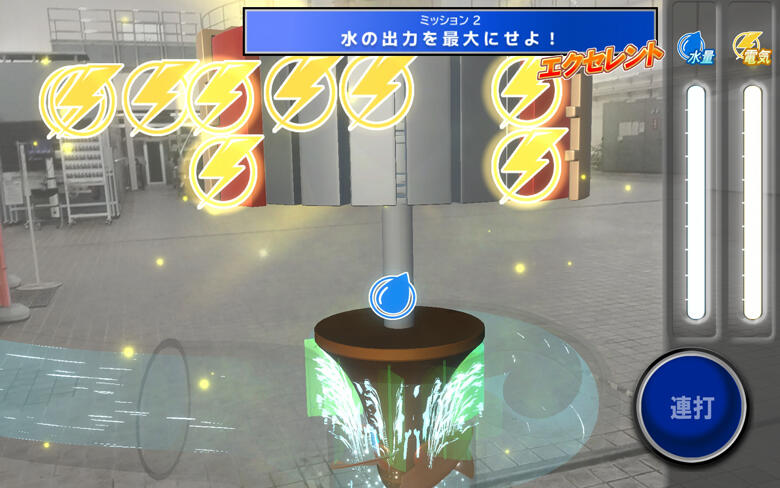 4. 設備を"コントロールする"体験
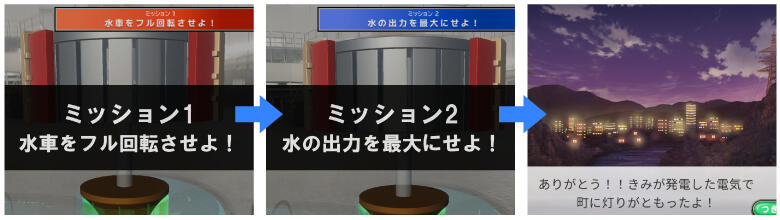 7. 子どもから大人までわかりやすい設計
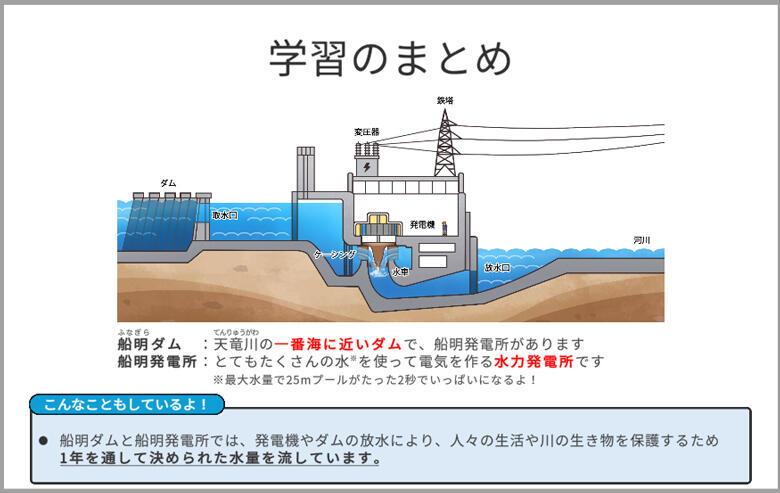



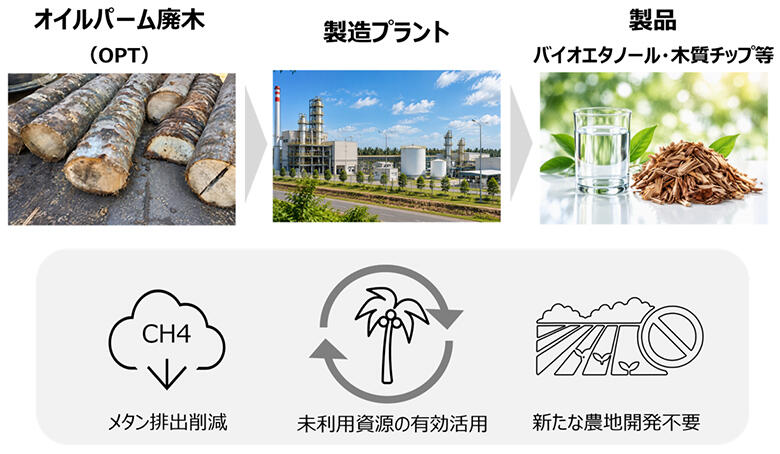 図:本事業の工程(イメージ図)
Prompts
Click prompts to add them under the company line, click again to take one out, then copy the result into your AI chat. Shared by Asian Century Stocks and Uncovered Thai Stocks. Thank you.
ETFs Holding Electric Power Development Co., Ltd.
Exchange-traded funds whose newest published daily portfolio holds one of the company's listings, largest weight first.
| ETF | Weight in ETF | Shares | Market value | As of |
|---|---|---|---|---|
| AVDV | 0.26% | 1,951,600 | $ 50.461M | Nov 16, 2026 |
| AVDS | 0.12% | 16,800 | $ 434.385K | Nov 16, 2026 |
| AVIV | 0.07% | 59,100 | $ 1.528M | Nov 16, 2026 |
| AVDE | 0.05% | 402,500 | $ 10.407M | Nov 16, 2026 |
| DFIS | 0.03% | 60,900 | $ 1.555M | Nov 12, 2026 |
| DFAI | 0.02% | 120,900 | $ 3.087M | Nov 12, 2026 |
| DFIC | 0.01% | 66,900 | $ 1.708M | Nov 12, 2026 |
| DFAX | 0.01% | 48,700 | $ 1.244M | Nov 12, 2026 |