|
Hokkaido Electric Power Company, Incorporated is a utility company operating in the power generation and retail electricity sectors. The company manages a group of subsidiaries and affiliates, with its core business conducted through Hokkaido Electric Power Network, which handles general transmission and distribution as well as power generation on remote islands. Other group entities engage in power generation, transmission, retail electricity sales, and information and communication services. The Hokkaido Electric Power Group includes specialized subsidiaries such as Hokuden Eco Energy, Hokuden Service, and Hokkaido General Communication Network, which provide engineering, service, and telecommunications support. Recent additions to the group include Yuni J, established in November 2025, and Ishikari Bay Offshore Wind, a joint venture for offshore wind energy established in September 2025. The company also maintains an affiliate relationship with Hokuden Torifuku Farm, established in August 2025. These entities collectively support the company's operations in the Hokkaido region, focusing on energy infrastructure and related technical services. Summarised from the annual report, fiscal year ended Mar 2026 |
Industry Utilities - Regulated Electric | Homepage hepco.co.jp |
| Sector Utilities | IR page hepco.co.jp/corporate/ir/ir.html | |
|
Tags
power generation, electricity retail, transmission and distribution, offshore wind energy, telecommunications, energy engineering, Hokkaido Electric Power Network, Hokkaido Electric Power Engineering, Tomakomai East Call Center, Hokuden Eco Energy, Hokuden Service, Hokkaido General Communication Network, Hokuden Information Technology, Hokuden Associates, Ishikari LNG Wharf, Hokkaido Record Management, Yuni J, Hokuden Torifuku Farm, Ishikari Bay Offshore Wind
|
Press page — |
Metrics
| Valuation | |
|---|---|
| Market cap | ¥ 234.507B |
| Market cap (USD) | $ 1.466B |
| P/E | 12.21 |
| PEG | — |
| P/BV | 0.47 |
| P/S | 0.26 |
| P/OCF | 4.13 |
| P/FCF | -1.14 |
| Dividend yield | 2.9% |
| Turnover / mcap | — |
| Returns | |
|---|---|
| ROE | 10.0% |
| ROI | 4.2% |
| ROIC | 5.1% |
| Profit margin | 5.1% |
| Growth | |
|---|---|
| Revenue growing | No |
| Profits growing | No |
| Revenue up 3y | No |
| Revenue up 5y | No |
| Earnings growth 3y (net profit CAGR) | — |
| Quality | |
|---|---|
| Profitable | Yes |
| Margin expanding | No |
| Buying back stock | No |
| Diluting (TTM) | No |
| Debt/Equity | — |
| Podcast bulls (TTM) | Sign up |
| Podcast bears (TTM) | Sign up |
| Podcast sentiment (TTM) | Sign up |
| Podcast sentiment % (TTM) | Sign up |
| News sentiment (TTM) | 0 |
| Quality score | -22.2% |
| Insiders | |
|---|---|
| Buys, 1w | Sign up |
| Buys, 1m | Sign up |
| Buys, 1y | Sign up |
| Sells, 1w | Sign up |
| Sells, 1m | Sign up |
| Sells, 1y | Sign up |
Sign up to see this company's insider trades
| Figure | FY 2026 | FY 2025 | FY 2024 | FY 2023 | FY 2022 | FY 2021 | FY 2020 | FY 2019 | FY 2018 | FY 2017 | FY 2016 | FY 2015 | FY 2014 | FY 2013 |
|---|---|---|---|---|---|---|---|---|---|---|---|---|---|---|
| Revenue | 855.983B | 902.053B | 953.784B | 888.874B | 663.414B | 740.79B | 748.468B | 752.238B | 733.05B | 702.776B | 724.111B | 692.925B | 630.34B | 582.99B |
| Net profit | 43.998B | 64.218B | 66.201B | -22.193B | 6.864B | 36.155B | 26.72B | 22.357B | 16.549B | 8.793B | 21.276B | 2.938B | -62.972B | -132.819B |
| Free cash flow | -103.016B | -42.539B | 62.191B | -105.329B | 24.55B | 51.544B | -25.777B | -14.717B | -45.642B | -80.432B | -49.119B | — | — | — |
| Figure | FY 2026 | FY 2025 | FY 2024 | FY 2023 | FY 2022 | FY 2021 | FY 2020 | FY 2019 | FY 2018 | FY 2017 | FY 2016 | FY 2015 | FY 2014 | FY 2013 |
|---|---|---|---|---|---|---|---|---|---|---|---|---|---|---|
| Share price | 1.068K | 761.86 | 839.08 | 484.11 | 484.11 | 505.06 | 468.11 | 635.84 | 696.93 | 842.05 | 942.86 | 944.99 | — | — |
| Price performance 12m | 0.4 | -0.09 | 0.73 | 0 | -0.04 | 0.08 | -0.26 | -0.09 | -0.17 | -0.11 | -0 | — | — | — |
Filed figures
Lines the statements and their notes report beside the headline figures, read from the filings' XBRL as filed (no restatement applied), with figures computed from one filing's own lines. Cash-flow lines carry their cash direction: an outflow is negative. Each period links to its filing; a figure's period, report date and tag are in its tooltip.
| Figure | Mar 2017 | Mar 2018 | Mar 2019 | Mar 2020 | Mar 2021 | Mar 2022 | Mar 2023 | Mar 2024 | Mar 2025 | Mar 2026 |
|---|---|---|---|---|---|---|---|---|---|---|
| Balance sheet detail | ||||||||||
| Trade receivables (JPY) | 57B | 67.6B | 76.5B | 88.9B | 102B | 138B | 169B | 187B | 215B | 190B |
| ↳ YoY growth | -6.6% | +18.6% | +13.2% | +16.2% | +15.0% | +35.3% | +22.4% | +10.3% | +14.9% | -11.2% |
| ↳ 5y CAGR | +10.9% | +19.4% | +20.2% | +19.5% | +19.3% | +13.3% | ||||
| Borrowings, current (JPY) | 52.4B | 73.3B | 72.4B | 85B | 49.9B | 44.5B | 44.5B | 44.5B | 44.5B | 44.5B |
| Borrowings, non-current (JPY) | 1.12T | 1.14T | 1.15T | 1.16T | 1.22T | 1.22T | 1.26T | 1.19T | 1.22T | 1.4T |
| Bonds payable (JPY) | 612B | 630B | 670B | 610B | 690B | 710B | 754B | 679B | 723B | 859B |
| Cash and deposits (JPY) | 88B | 116B | 71.7B | 57.5B | 83.8B | 88.9B | 89.9B | 111B | 156B | 185B |
| Net debt (borrowings + leases - cash) (JPY) | 1.08T | 1.1T | 1.15T | 1.19T | 1.19T | 1.18T | 1.22T | 1.13T | 1.11T | 1.26T |
| Cash flow detail | ||||||||||
| Operating cash flow (JPY) | 67.1B | 107B | 114B | 103B | 137B | 102B | -574M | 176B | 126B | 115B |
| Purchases of property, plant and equipment (JPY) | -148B | -153B | -129B | -128B | -85B | -77.8B | -105B | -114B | -168B | -218B |
| Change in inventories (cash effect) (JPY) | — | — | -898M | 5.92B | 5.22B | -6.07B | -55B | 24.1B | 1.37B | 8.84B |
| Dividends paid (cash effect) (JPY) | -4.71B | -2.82B | -2.81B | -5.18B | -3.45B | -6.53B | -2.77B | -3.17B | -6.53B | -6.54B |
| Share buybacks (cash effect) (JPY) | -3.25B | -8M | -47.6B | -4M | — | — | — | — | — | — |
| Interest paid (cash effect) (JPY) | -15.2B | -14.5B | -12.5B | -11.3B | -10.5B | -9.69B | -9.35B | -12.2B | -10.3B | -13.8B |
| Income taxes paid (cash effect) (JPY) | -3.86B | -557M | -2.14B | -5.19B | -6.69B | -6.93B | -1.43B | 533M | -21.8B | -26.3B |
| Free cash flow (OCF - PPE - intangibles) (JPY) | -80.4B | -45.6B | -14.7B | -25.8B | 51.5B | 24.6B | -105B | 62.2B | -42.5B | -103B |
| Income detail | ||||||||||
| Research and development expense (JPY) | 2.35B | 2.35B | 2.35B | 2.34B | 2.42B | 2.51B | 2.35B | 2.28B | 2.24B | 2.45B |
| ↳ 5y CAGR | +1.3% | +1.4% | 0.0% | -0.6% | -0.8% | +0.2% | ||||
| Total comprehensive income (JPY) | 10.9B | 15.9B | 19B | 24.3B | 46.1B | 3.14B | -24.7B | 78.8B | 80.6B | 73.1B |
| Comprehensive income to owners (JPY) | 10.4B | 15.4B | 18.9B | 23.7B | 45.7B | 2.55B | -25.1B | 77.8B | 79.1B | 71.6B |
| Segments | ||||||||||
| Hokkaido Electric Power · Segment revenue (JPY) | — | — | — | — | 670B | 598B | 780B | 862B | 788B | 736B |
| ↳ YoY growth | -10.7% | +30.4% | +10.5% | -8.5% | -6.6% | |||||
| Hokkaido Electric Power Network · Segment revenue (JPY) | — | — | — | — | 268B | 268B | 348B | 314B | 321B | 323B |
| ↳ YoY growth | -0.2% | +29.8% | -9.8% | +2.4% | +0.5% | |||||
| Reported | Jun 29, 2017 | Jun 27, 2019 | Jun 26, 2020 | Jun 26, 2020 | Jun 29, 2022 | Jun 29, 2022 | Jun 29, 2023 | Jun 27, 2024 | Jun 24, 2025 | Jun 23, 2026 |
Sign up to see institutional holdings
Sign UpPodcast Mentions
Sign up to see podcast mentions and sentiment
Sign UpTimely disclosures published on TDnet, newest first, titles as filed in Japanese. The link opens the disclosure on TDnet. Filings with EDINET (periodic reports, extraordinary reports, offerings, holding and buy-back reports), newest first, titles as filed in Japanese. The link opens the filing on EDINET. Press releases from the company's own website, newest first.
 |
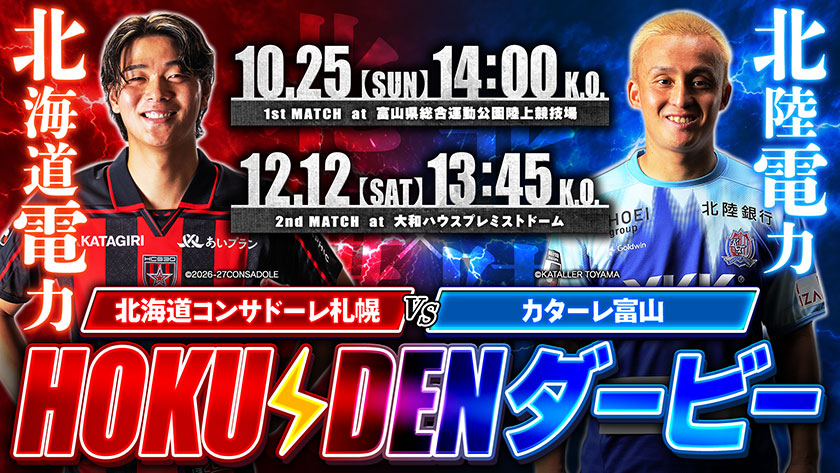
| 勝敗予想 | 各対象試合について、次のいずれか1つを選択* 北海道コンサドーレ札幌の勝利* カターレ富山の勝利* 引き分け | |
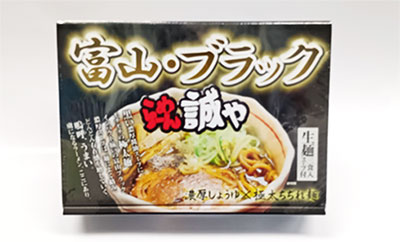
| 景品・当選者数 | 各対象試合の勝敗予想を的中させた有効応募者の中から抽選で各試合100名(合計200名)に、地域の特産品(ご当地ラーメン)および両電力会社のキャラクターグッズ等を組み合わせた景品をプレゼントします。【地域の特産品(ご当地ラーメン)】* 北海道コンサドーレ札幌が勝利した場合: 北陸電力提供「富山・ブラック らーめん誠や(生麺3食入り)」
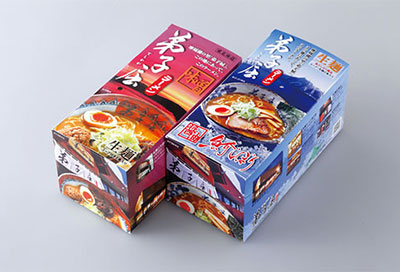
 * カターレ富山が勝利した場合: 北海道電力提供「弟子屈ラーメン 味噌 生麺・魚介しぼり醤油 生麺(各2食入り)」
 * 引き分けの場合: 両電力会社選定の特産品を50名ずつ(計100名)にプレゼント ※引き分けの場合、景品の種類はお選びいただけません。 | |
| 応募規約 | 応募資格、注意事項などの詳細は、「HOKUDENダービー 勝敗予想キャンペーン」応募規約をご確認ください。
Prompts
Click prompts to add them under the company line, click again to take one out, then copy the result into your AI chat. Shared by Asian Century Stocks and Uncovered Thai Stocks. Thank you.
ETFs Holding Hokkaido Electric Power Company, Incorporated
Exchange-traded funds whose newest published daily portfolio holds one of the company's listings, largest weight first.