(開示事項の経過) 投資有価証券の売却に関するお知らせ
Bull 0
Bear 0
Other
9432
Fiscal year ends March
Quarters are offset from the calendar — Q1 is Apr–Jun
|
NTT, Inc. is a telecommunications and information technology services group operating through three main business segments: Comprehensive ICT, Global Solutions, and Regional Communications. The Comprehensive ICT segment provides mobile phone services, optical broadband, financial services, and enterprise solutions through subsidiaries including NTT Docomo, NTT Docomo Business, NTT Docomo Solutions, Docomo Finance, and Sumishin SBI Net Bank. The Global Solutions segment offers consulting, IT solutions, system and software development, maintenance support, and data center services via NTT Data Group, NTT Data, NTT DATA, Inc., NTT Ltd., Dimension Data Holdings, NTT America, NTT Europe, and NTT Global Data Centers. The Regional Communications segment delivers optical services, enterprise communications, and fixed-line telephone services through NTT East Japan and NTT West Japan. The group also operates real estate and energy businesses through subsidiaries such as NTT Urban Solutions, NTT City Development, NTT Facilities, and NTT Anode Energy. Summarised from the annual report, fiscal year ended Mar 2026 |
Industry Telecom Services | Homepage group.ntt |
| Sector Communication Services | IR page group.ntt/en | |
|
Tags
mobile telecommunications, broadband internet, enterprise it solutions, data centers, system integration, financial services, real estate development, energy services, NTT Docomo, NTT Docomo Business, NTT Docomo Solutions, Docomo Finance, Sumishin SBI Net Bank, NTT Data Group, NTT Data, NTT DATA Inc., NTT Ltd., Dimension Data Holdings, NTT America, NTT Europe, NTT Global Data Centers EMEA, NTT Global Data Centers Americas, NTT Global Networks, NTT Managed Services Americas Intermediate Holdings, Spectrum Holdings, NTT America Holdings II, Dimension Data Commerce Centre, NTT DATA Americas, NTT DATA Services Holdings, NTT DATA Services, NTT Data International, NTT DATA Europe & Latam, NTT DATA EUROPE, NTT East Japan, NTT West Japan, NTT Urban Solutions, NTT City Development, NTT Facilities, NTT Anode Energy, Green Power Investment, NTT Finance
|
Press page group.ntt/jp/newsrelease |
Metrics
| Valuation | |
|---|---|
| Market cap | ¥ 15.511T |
| Market cap (USD) | $ 96.947B |
| P/E | 14.82 |
| PEG | — |
| P/BV | 1.49 |
| P/S | 1.03 |
| P/OCF | 28.01 |
| P/FCF | -18.45 |
| Dividend yield | 3.1% |
| Turnover / mcap | — |
| Returns | |
|---|---|
| ROE | 9.6% |
| ROI | 10.1% |
| ROIC | 11.4% |
| Profit margin | 7.2% |
| Growth | |
|---|---|
| Revenue growing | Yes |
| Profits growing | No |
| Revenue up 3y | Yes |
| Revenue up 5y | Yes |
| Earnings growth 3y (net profit CAGR) | -5.1% |
| Quality | |
|---|---|
| Profitable | Yes |
| Margin expanding | No |
| Buying back stock | No |
| Diluting (TTM) | No |
| Debt/Equity | — |
| Podcast bulls (TTM) | Sign up |
| Podcast bears (TTM) | Sign up |
| Podcast sentiment (TTM) | Sign up |
| Podcast sentiment % (TTM) | Sign up |
| News sentiment (TTM) | 23 |
| Quality score | 21.1% |
| Insiders | |
|---|---|
| Buys, 1w | Sign up |
| Buys, 1m | Sign up |
| Buys, 1y | Sign up |
| Sells, 1w | Sign up |
| Sells, 1m | Sign up |
| Sells, 1y | Sign up |
Sign up to see this company's insider trades
| Figure | FY 2026 | FY 2025 | FY 2024 | FY 2023 | FY 2022 | FY 2021 | FY 2020 | FY 2019 | FY 2018 | FY 2017 | FY 2016 | FY 2015 | FY 2014 | FY 2013 |
|---|---|---|---|---|---|---|---|---|---|---|---|---|---|---|
| Revenue | 14.409T | 13.705T | 13.375T | 13.136T | 12.156T | 11.944T | 11.899T | 11.88T | 11.8T | 11.391T | 11.541T | 11.095T | 10.925T | 10.701T |
| Net profit | 1.037T | 1T | 1.28T | 1.213T | 1.181T | 916.181B | 855.306B | 854.561B | 909.695B | 800.129B | 737.738B | 518.066B | 585.473B | 521.932B |
| Free cash flow | -840.814B | 276.675B | 311.046B | 398.609B | 1.323T | 1.281T | 1.189T | 709.199B | — | — | — | — | — | — |
| Figure | FY 2026 | FY 2025 | FY 2024 | FY 2023 | FY 2022 | FY 2021 | FY 2020 | FY 2019 | FY 2018 | FY 2017 | FY 2016 | FY 2015 | FY 2014 | FY 2013 |
|---|---|---|---|---|---|---|---|---|---|---|---|---|---|---|
| Share price | 157.28 | 144.97 | 179.91 | 3.968K | 3.549K | 2.847K | 2.57K | 4.721K | 4.913K | 4.764K | 2.42K | 3.692K | 2.803K | 2.048K |
| Price performance 12m | 0.08 | -0.19 | -0.95 | 0.12 | 0.25 | 0.11 | -0.46 | -0.04 | 0.03 | 0.97 | -0.34 | 0.32 | 0.37 | — |
Filed figures
Lines the statements and their notes report beside the headline figures, read from the filings' XBRL as filed (no restatement applied), with figures computed from one filing's own lines. Cash-flow lines carry their cash direction: an outflow is negative. Each period links to its filing; a figure's period, report date and tag are in its tooltip.
| Figure | Mar 2017 | Mar 2018 | Mar 2019 | Mar 2020 | Mar 2021 | Mar 2022 | Mar 2023 | Mar 2024 | Mar 2025 | Mar 2026 |
|---|---|---|---|---|---|---|---|---|---|---|
| Balance sheet detail | ||||||||||
| Trade receivables (JPY) | — | 4.02T | 4.39T | 3.5T | 3.53T | 3.6T | 4.19T | 4.82T | 4.88T | 5.55T |
| ↳ YoY growth | +9.2% | -20.2% | +0.9% | +2.0% | +16.1% | +15.1% | +1.3% | +13.7% | ||
| ↳ 5y CAGR | +0.8% | +1.9% | +6.9% | +9.4% | ||||||
| Lease liabilities (JPY) | — | — | — | 532B | 748B | 845B | 920B | 1.12T | 1.16T | 1.21T |
| Cash and deposits (JPY) | 925B | 895B | 946B | 1.03T | 936B | 835B | 794B | 983B | 1T | 1.92T |
| Intangible assets (JPY) | — | 1.59T | 1.63T | 1.69T | 1.77T | 1.95T | 2.12T | 2.51T | 2.48T | 2.87T |
| Right-of-use assets (JPY) | — | — | — | 447B | 640B | 695B | 719B | 915B | 974B | 1.02T |
| Cash flow detail | ||||||||||
| Operating cash flow (JPY) | 2.92T | 2.54T | 2.41T | 3T | 3.01T | 3.01T | 2.26T | 2.37T | 2.36T | 1.49T |
| Purchases of property, plant and equipment (JPY) | — | — | -1.7T | -1.81T | -1.73T | -1.69T | -1.86T | -2.06T | -2.09T | -2.33T |
| Change in receivables (cash effect) (JPY) | — | -396B | -338B | 211B | 24.1B | 828M | -525B | -318B | -71.3B | -635B |
| Change in inventories (cash effect) (JPY) | — | -44.8B | 1.57B | 59.9B | -64.3B | -86.6B | -141B | -51.8B | -86.2B | -137B |
| Dividends paid (cash effect) (JPY) | — | -271B | -314B | -355B | -358B | -397B | -420B | -417B | -437B | -434B |
| Share buybacks (cash effect) (JPY) | — | -236B | -258B | -501B | -250B | -254B | -511B | -200B | -202B | -205B |
| Interest paid (cash effect) (JPY) | — | -45.5B | -39.4B | -49.8B | -41.9B | -47.9B | -67.2B | -88.7B | -140B | -210B |
| Operating cash flow before change in receivables (JPY) | — | 2.94T | 2.74T | 2.78T | 2.98T | 3.01T | 2.79T | 2.69T | 2.44T | 2.12T |
| Free cash flow (OCF - PPE - intangibles) (JPY) | — | — | 709B | 1.19T | 1.28T | 1.32T | 399B | 311B | 277B | -841B |
| Income detail | ||||||||||
| Research and development expense (JPY) | — | 209B | 211B | 225B | 233B | 248B | 253B | 255B | 269B | 279B |
| ↳ 5y CAGR | +3.9% | +3.8% | +3.6% | +3.7% | ||||||
| Total comprehensive income (JPY) | — | 1.27T | 1.11T | 970B | 1.56T | 1.49T | 1.41T | 2.1T | 1.12T | 1.77T |
| Comprehensive income to owners (JPY) | — | 950B | 826B | 743B | 1.28T | 1.37T | 1.27T | 1.96T | 1.03T | 1.72T |
| Segments | ||||||||||
| Data Communications Business · Segment operating income (JPY) | — | 123B | 148B | 131B | 139B | — | — | — | — | — |
| Global Solutions Business · Segment operating income (JPY) | — | — | — | — | 147B | 211B | 266B | 310B | 324B | 488B |
| Integrated ICT Business · Segment operating income (JPY) | — | — | — | — | 1.06T | 1.07T | 1.09T | 1.14T | 1.02T | 942B |
| Long Distance And International Communications Business · Segment operating income (JPY) | — | 90.6B | 100B | 104B | 146B | — | — | — | — | — |
| Mobile Communications Business · Segment operating income (JPY) | — | 987B | 1.01T | 855B | 913B | — | — | — | — | — |
| Other Business · Segment operating income (JPY) | — | 98.7B | 85.6B | 90.9B | 64.8B | — | — | — | — | — |
| Others Real Estate Energy And Others · Segment operating income (JPY) | — | — | — | — | 56.4B | 72.5B | 89.2B | 59.8B | 55.8B | -1.57B |
| Regional Communications Business · Segment operating income (JPY) | — | 352B | 361B | 388B | 420B | 440B | 420B | 438B | 295B | 307B |
| Reported | Jun 28, 2017 | Jun 26, 2019 | Jun 26, 2019 | Jun 24, 2020 | Jun 27, 2022 | Jun 27, 2022 | Jun 21, 2024 | Jun 21, 2024 | Jun 20, 2025 | Jun 16, 2026 |
Sign up to see institutional holdings
Sign UpPodcast Mentions
Sign up to see podcast mentions and sentiment
Sign UpTimely disclosures published on TDnet, newest first, titles as filed in Japanese. The link opens the disclosure on TDnet. Filings with EDINET (periodic reports, extraordinary reports, offerings, holding and buy-back reports), newest first, titles as filed in Japanese. The link opens the filing on EDINET. Press releases from the company's own website, newest first.


 令和8年台風第25号の影響により被災された地域のお客さまに対する電話料金等の取り扱いについて(千葉)



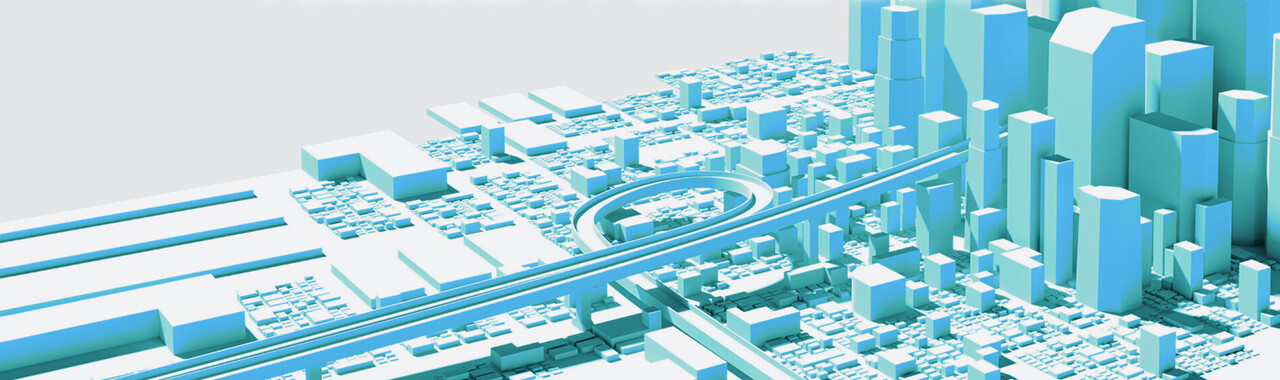

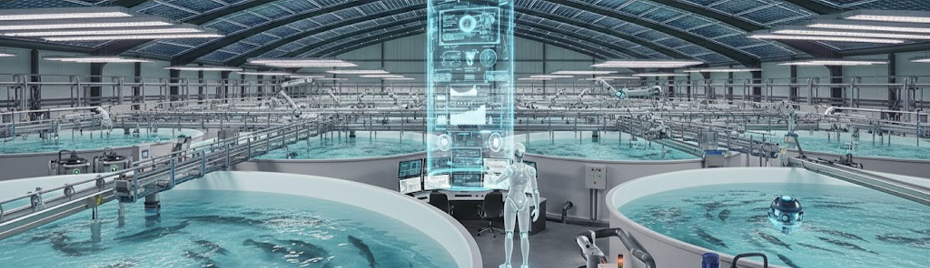












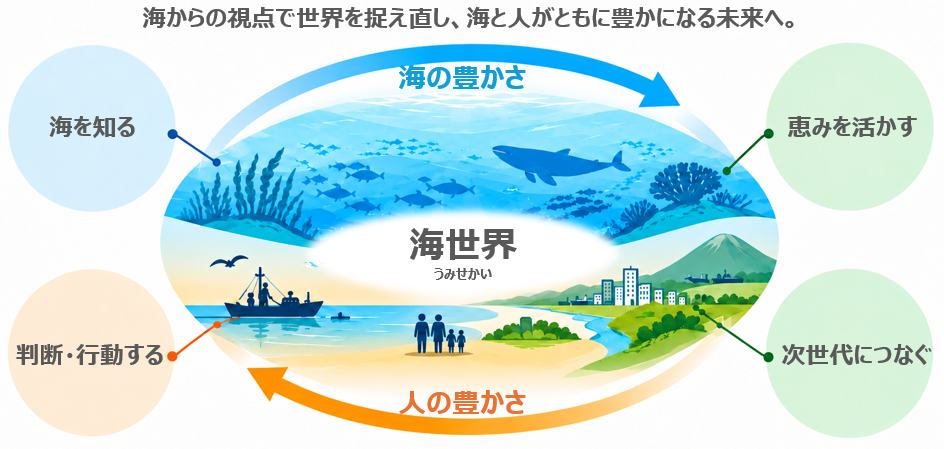 図1 海世界の概念図
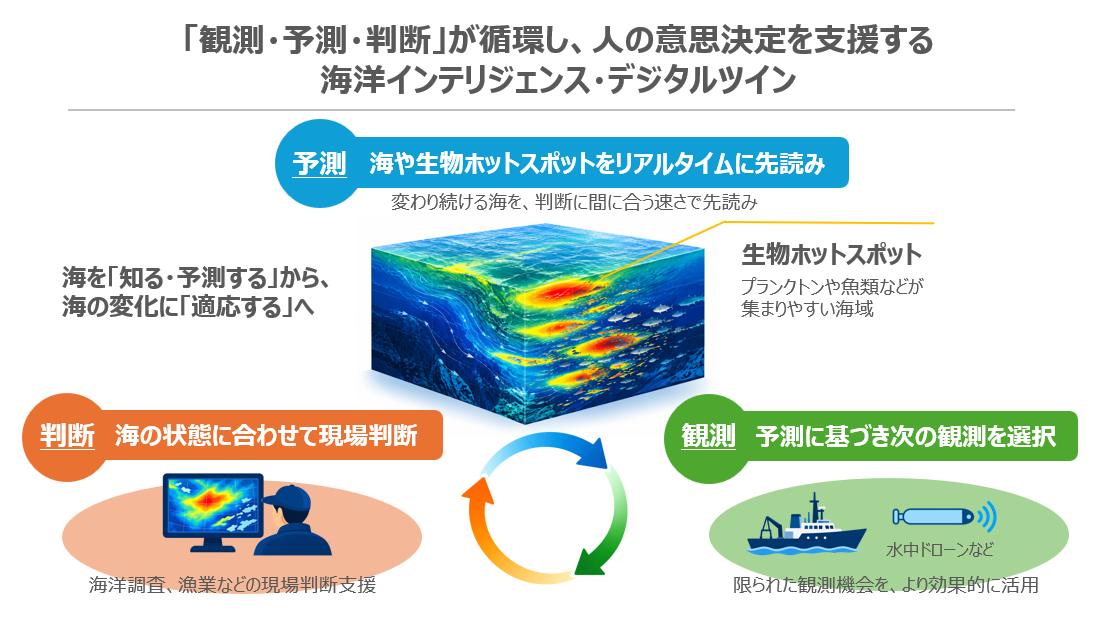 図2 海洋インテリジェンス・デジタルツインの概念図
 写真1 共同研究に参画する3機関の代表者









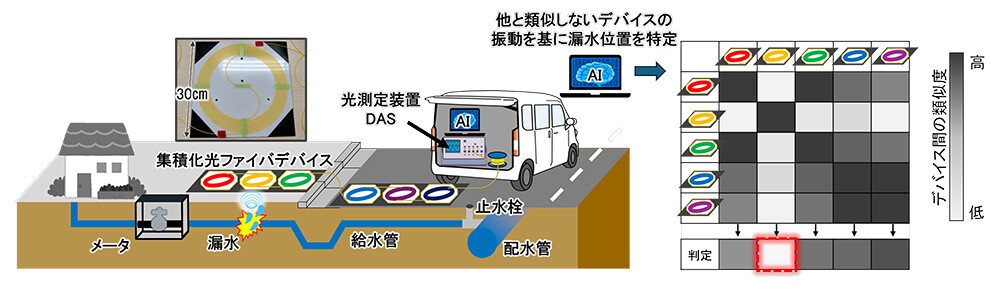 図1. 光ファイバセンシングを活用した漏水位置特定システム
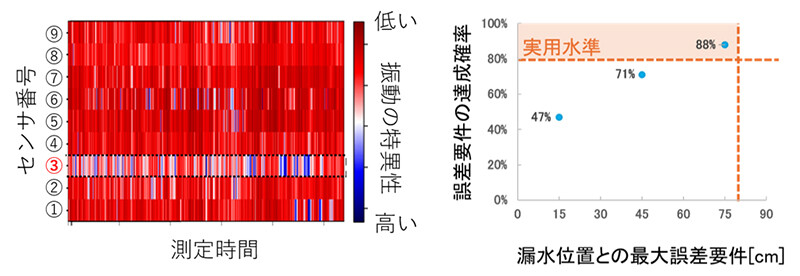 図2. 解析結果の例(左:振動の特異性解析、右:誤差要件に収まる確率)

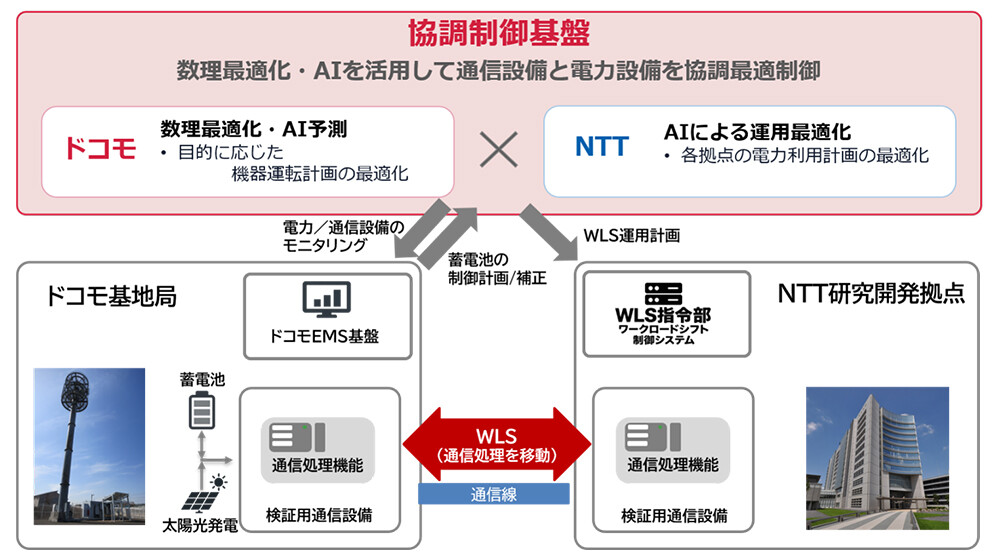 図1 本実証の構成
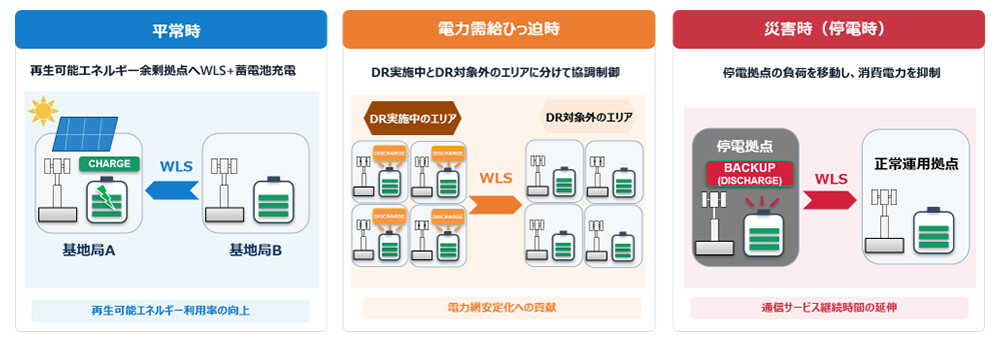 図2 協調最適化技術の適用イメージ

Prompts
Click prompts to add them under the company line, click again to take one out, then copy the result into your AI chat. Shared by Asian Century Stocks and Uncovered Thai Stocks. Thank you.
NTT, Inc. (ticker 9432), listed in Japan.
Copied
Company History
Name and ticker changes, and re-registrations under a new regulatory id. When a ticker stopped being used is not recorded, so former tickers are undated.
| Date | Change | Detail |
|---|---|---|
| Jul 24, 2025 | Acquired | Acquired Ntt Data Group Corporation (EDINET code E04911). Its filings from before the deal are on its own company page, not shown here. |
ETFs Holding NTT, Inc.
Exchange-traded funds whose newest published daily portfolio holds one of the company's listings, largest weight first.
| ETF | Weight in ETF | Shares | Market value | As of |
|---|---|---|---|---|
| IVSI | 0.43% | 38,032 | $ 33.916K | Jun 30, 2026 |
| RFDI | 0.35% | 608,900 | $ 583.24K | Jul 31, 2026 |
| AVIV | 0.23% | 4,537,400 | $ 4.788M | Nov 16, 2026 |
| GEW | 0.19% | 261,057 | $ 281.893K | Aug 31, 2026 |
| AVDE | 0.12% | 22,544,700 | $ 23.79M | Nov 16, 2026 |
| NTSI | 0.10% | 569,500 | $ 508.091K | Jun 30, 2026 |
| DFAI | 0.10% | 17,437,500 | $ 18.266M | Nov 12, 2026 |
| DFSI | 0.07% | 805,300 | $ 843.576K | Nov 12, 2026 |
| AVSD | 0.04% | 156,100 | $ 164.724K | Nov 16, 2026 |
| DFIC | 0.03% | 4,549,900 | $ 4.766M | Nov 12, 2026 |
| DFAX | 0.02% | 2,753,800 | $ 2.885M | Nov 12, 2026 |