|
Iino Kaiun Kaisha, Ltd. operates in three main business segments: ocean shipping, domestic and coastal shipping, and real estate. In ocean shipping, the company engages in vessel operation, leasing, chartering, management, shipping brokerage, and agency services. Key subsidiaries in this segment include Azalea Transport S.A. for vessel leasing, Iino Marine Service Co., Ltd. for vessel management, and Iino Enterprises Co., Ltd. for shipping brokerage. The domestic and coastal shipping segment involves vessel operation, leasing, and management, primarily through Iino Gas Transport Co., Ltd. The real estate segment focuses on building leasing, management, and related services, supported by Iino Biltex Co., Ltd. for building management, Iino Media Pro Co., Ltd. for real estate-related businesses, and IKK Holding Ltd. for overseas real estate operations. The group consists of the parent company, 66 consolidated subsidiaries, 8 equity-method affiliates, and 9 non-consolidated related companies. Summarised from the annual report, fiscal year ended Mar 2026 |
Industry Marine Shipping | Homepage iino.co.jp |
| Sector Industrials | IR page iino.co.jp | |
|
Tags
ocean shipping, coastal shipping, vessel leasing, vessel management, shipping brokerage, building leasing, real estate management, Azalea Transport S.A., Iino Marine Service Co. Ltd., Iino Enterprises Co. Ltd., Iino Gas Transport Co. Ltd., Iino Biltex Co. Ltd., Iino Media Pro Co. Ltd., IKK Holding Ltd.
|
Press page iino.co.jp/kaiun/news |
Metrics
| Valuation | |
|---|---|
| Market cap | ¥ 184.259B |
| Market cap (USD) | $ 1.152B |
| P/E | 8.94 |
| PEG | — |
| P/BV | 1.09 |
| P/S | 1.31 |
| P/OCF | 6.60 |
| P/FCF | -5.17 |
| Dividend yield | 3.5% |
| Turnover / mcap | — |
| Returns | |
|---|---|
| ROE | 10.1% |
| ROI | 5.1% |
| ROIC | 3.8% |
| Profit margin | 12.1% |
| Growth | |
|---|---|
| Revenue growing | No |
| Profits growing | No |
| Revenue up 3y | No |
| Revenue up 5y | No |
| Earnings growth 3y (net profit CAGR) | -12.1% |
| Quality | |
|---|---|
| Profitable | Yes |
| Margin expanding | No |
| Buying back stock | No |
| Diluting (TTM) | No |
| Debt/Equity | — |
| Podcast bulls (TTM) | Sign up |
| Podcast bears (TTM) | Sign up |
| Podcast sentiment (TTM) | Sign up |
| Podcast sentiment % (TTM) | Sign up |
| News sentiment (TTM) | 27 |
| Quality score | -11.1% |
| Insiders | |
|---|---|
| Buys, 1w | Sign up |
| Buys, 1m | Sign up |
| Buys, 1y | Sign up |
| Sells, 1w | Sign up |
| Sells, 1m | Sign up |
| Sells, 1y | Sign up |
Sign up to see this company's insider trades
| Figure | FY 2026 | FY 2025 | FY 2024 | FY 2023 | FY 2022 | FY 2021 | FY 2020 | FY 2019 | FY 2018 | FY 2017 | FY 2016 | FY 2015 | FY 2014 | FY 2013 |
|---|---|---|---|---|---|---|---|---|---|---|---|---|---|---|
| Revenue | 127.295B | 141.866B | 137.95B | 141.324B | 104.1B | 88.916B | 89.179B | 84.843B | 81.334B | 83.32B | 94.843B | 100.177B | 96.701B | 86.021B |
| Net profit | 15.391B | 18.367B | 19.745B | 22.681B | 12.526B | 7.655B | 3.788B | 4.685B | 4.243B | 3.885B | 3.659B | 5.213B | 4.92B | 1.166B |
| Free cash flow | -34.147B | -3.827B | 17.428B | 13.595B | 3.284B | -11.588B | -4.632B | -9.227B | -8.731B | -7.692B | -5.134B | — | — | — |
| Figure | FY 2026 | FY 2025 | FY 2024 | FY 2023 | FY 2022 | FY 2021 | FY 2020 | FY 2019 | FY 2018 | FY 2017 | FY 2016 | FY 2015 | FY 2014 | FY 2013 |
|---|---|---|---|---|---|---|---|---|---|---|---|---|---|---|
| Share price | 1.751K | 997.13 | 1.227K | 1.004K | 826.11 | 530.14 | 310.08 | 372.91 | 508.98 | 486.96 | 446.94 | 636.03 | 516.91 | 691.97 |
| Price performance 12m | 0.76 | -0.19 | 0.22 | 0.22 | 0.56 | 0.71 | -0.17 | -0.27 | 0.05 | 0.09 | -0.3 | 0.23 | -0.25 | — |
Filed figures
Lines the statements and their notes report beside the headline figures, read from the filings' XBRL as filed (no restatement applied), with figures computed from one filing's own lines. Cash-flow lines carry their cash direction: an outflow is negative. Each period links to its filing; a figure's period, report date and tag are in its tooltip.
| Figure | Mar 2017 | Mar 2018 | Mar 2019 | Mar 2020 | Mar 2021 | Mar 2022 | Mar 2023 | Mar 2024 | Mar 2025 | Mar 2026 |
|---|---|---|---|---|---|---|---|---|---|---|
| Balance sheet detail | ||||||||||
| Trade receivables (JPY) | 6.85B | 6.74B | 6.54B | 7.01B | 7.54B | 20.2B | 21.1B | 23.9B | 23.6B | 18.7B |
| ↳ YoY growth | -9.9% | -1.5% | -3.1% | +7.2% | +7.6% | +167.9% | +4.4% | +13.4% | -1.5% | -20.6% |
| ↳ 5y CAGR | -0.2% | +24.1% | +25.6% | +29.6% | +27.4% | +19.9% | ||||
| Borrowings, current (JPY) | 25.2B | 30.1B | 38.8B | 34.9B | 26.7B | 23.3B | 34.2B | 33.5B | 48.6B | 25.5B |
| Borrowings, non-current (JPY) | 82.6B | 85B | 79.1B | 91.4B | 105B | 97.6B | 80.5B | 85.3B | 72.1B | 116B |
| Bonds payable (JPY) | — | — | — | — | 5B | 5B | 5B | — | — | — |
| Lease liabilities (JPY) | 188M | 1.85B | 6.63B | 6.38B | 5.15B | 4.97B | 4.73B | 4.94B | 2B | 1.38B |
| Cash and deposits (JPY) | 10.7B | 10.5B | 9.83B | 14.2B | 13.3B | 11.7B | 14.5B | 17.9B | 11.6B | 14.1B |
| Intangible assets (JPY) | 634M | 594M | 579M | 551M | 529M | 634M | 274M | 3.23B | 3.66B | 3.9B |
| Net debt (borrowings + leases - cash) (JPY) | 97.3B | 106B | 115B | 118B | 124B | 114B | 105B | 106B | 111B | 129B |
| Cash flow detail | ||||||||||
| Operating cash flow (JPY) | 11.1B | 12.1B | 14.5B | 13.1B | 19.3B | 15.8B | 35.3B | 29.4B | 30.7B | 29.9B |
| Purchases of property, plant and equipment (JPY) | -18.8B | -20.8B | -23.8B | -17.7B | -30.9B | -12.5B | -21.7B | -12B | -34.6B | -64B |
| Change in receivables (cash effect) (JPY) | 746M | 103M | 209M | -471M | -531M | -3.41B | -692M | -1.05B | 504M | 1.98B |
| Change in inventories (cash effect) (JPY) | -412M | -333M | -503M | 161M | -215M | -1.49B | 192M | -1.41B | 993M | -1.83B |
| Change in payables (cash effect) (JPY) | -1.09B | 180M | 259M | -237M | 635M | 2.78B | 603M | 40M | -332M | 3.18B |
| Dividends paid (cash effect) (JPY) | -1.11B | -1.11B | -1.06B | -1.59B | -1.37B | -2.85B | -5.49B | -6.66B | -5.92B | -6.02B |
| Share buybacks (cash effect) (JPY) | 0.00 | -3.2B | 0.00 | 0.00 | 0.00 | 0.00 | -1M | -1M | -1M | 0.00 |
| Interest paid (cash effect) (JPY) | -2.05B | -1.71B | -1.62B | -1.48B | -1.27B | -1.12B | -1.09B | -1.14B | -1.24B | -1.53B |
| Income taxes paid (cash effect) (JPY) | -90M | -274M | -307M | -184M | -368M | -522M | -449M | -1.93B | -2.3B | -2.33B |
| Operating cash flow before change in receivables (JPY) | 10.3B | 12B | 14.3B | 13.6B | 19.8B | 19.2B | 36B | 30.5B | 30.2B | 27.9B |
| Free cash flow (OCF - PPE - intangibles) (JPY) | -7.69B | -8.73B | -9.23B | -4.63B | -11.6B | 3.28B | 13.6B | 17.4B | -3.83B | -34.1B |
| Income detail | ||||||||||
| Total comprehensive income (JPY) | 4.61B | 4.78B | 4.81B | 1.94B | 7.78B | 14.5B | 24.9B | 28.2B | 19.5B | 18.7B |
| Comprehensive income to owners (JPY) | 4.62B | 4.72B | 4.76B | 1.94B | 7.82B | 14.5B | 24.9B | 28.2B | 19.4B | 18.8B |
| Segments | ||||||||||
| Oceangoing Shipping · Segment revenue (JPY) | — | — | — | — | — | — | — | — | 118B | 102B |
| ↳ YoY growth | -12.8% | |||||||||
| Oceangoing Shipping · Segment operating income (JPY) | — | — | — | — | — | — | — | — | 13.2B | 8.79B |
| Real Estate · Segment revenue (JPY) | — | — | — | — | — | — | — | — | 13.1B | 14.2B |
| ↳ YoY growth | +8.2% | |||||||||
| Real Estate · Segment operating income (JPY) | — | — | — | — | — | — | — | — | 3.46B | 4.35B |
| Regional Shipping · Segment revenue (JPY) | — | — | — | — | — | — | — | — | 11.3B | 10.8B |
| ↳ YoY growth | -5.1% | |||||||||
| Regional Shipping · Segment operating income (JPY) | — | — | — | — | — | — | — | — | 454M | 303M |
| Reported | Jun 28, 2017 | Jun 27, 2018 | Jun 26, 2019 | Jun 25, 2020 | Jun 25, 2021 | Jun 28, 2022 | Jun 28, 2023 | Jun 26, 2024 | Jun 23, 2026 | Jun 23, 2026 |
Sign up to see institutional holdings
Sign UpPodcast Mentions
Sign up to see podcast mentions and sentiment
Sign UpTimely disclosures published on TDnet, newest first, titles as filed in Japanese. The link opens the disclosure on TDnet. Filings with EDINET (periodic reports, extraordinary reports, offerings, holding and buy-back reports), newest first, titles as filed in Japanese. The link opens the filing on EDINET. Press releases from the company's own website, newest first.


 / 飯野海運公式チャンネル - IINO Channel




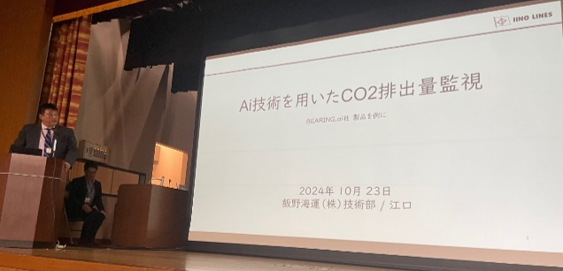


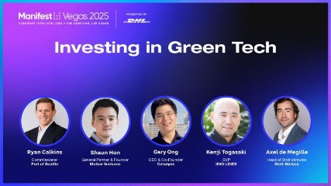
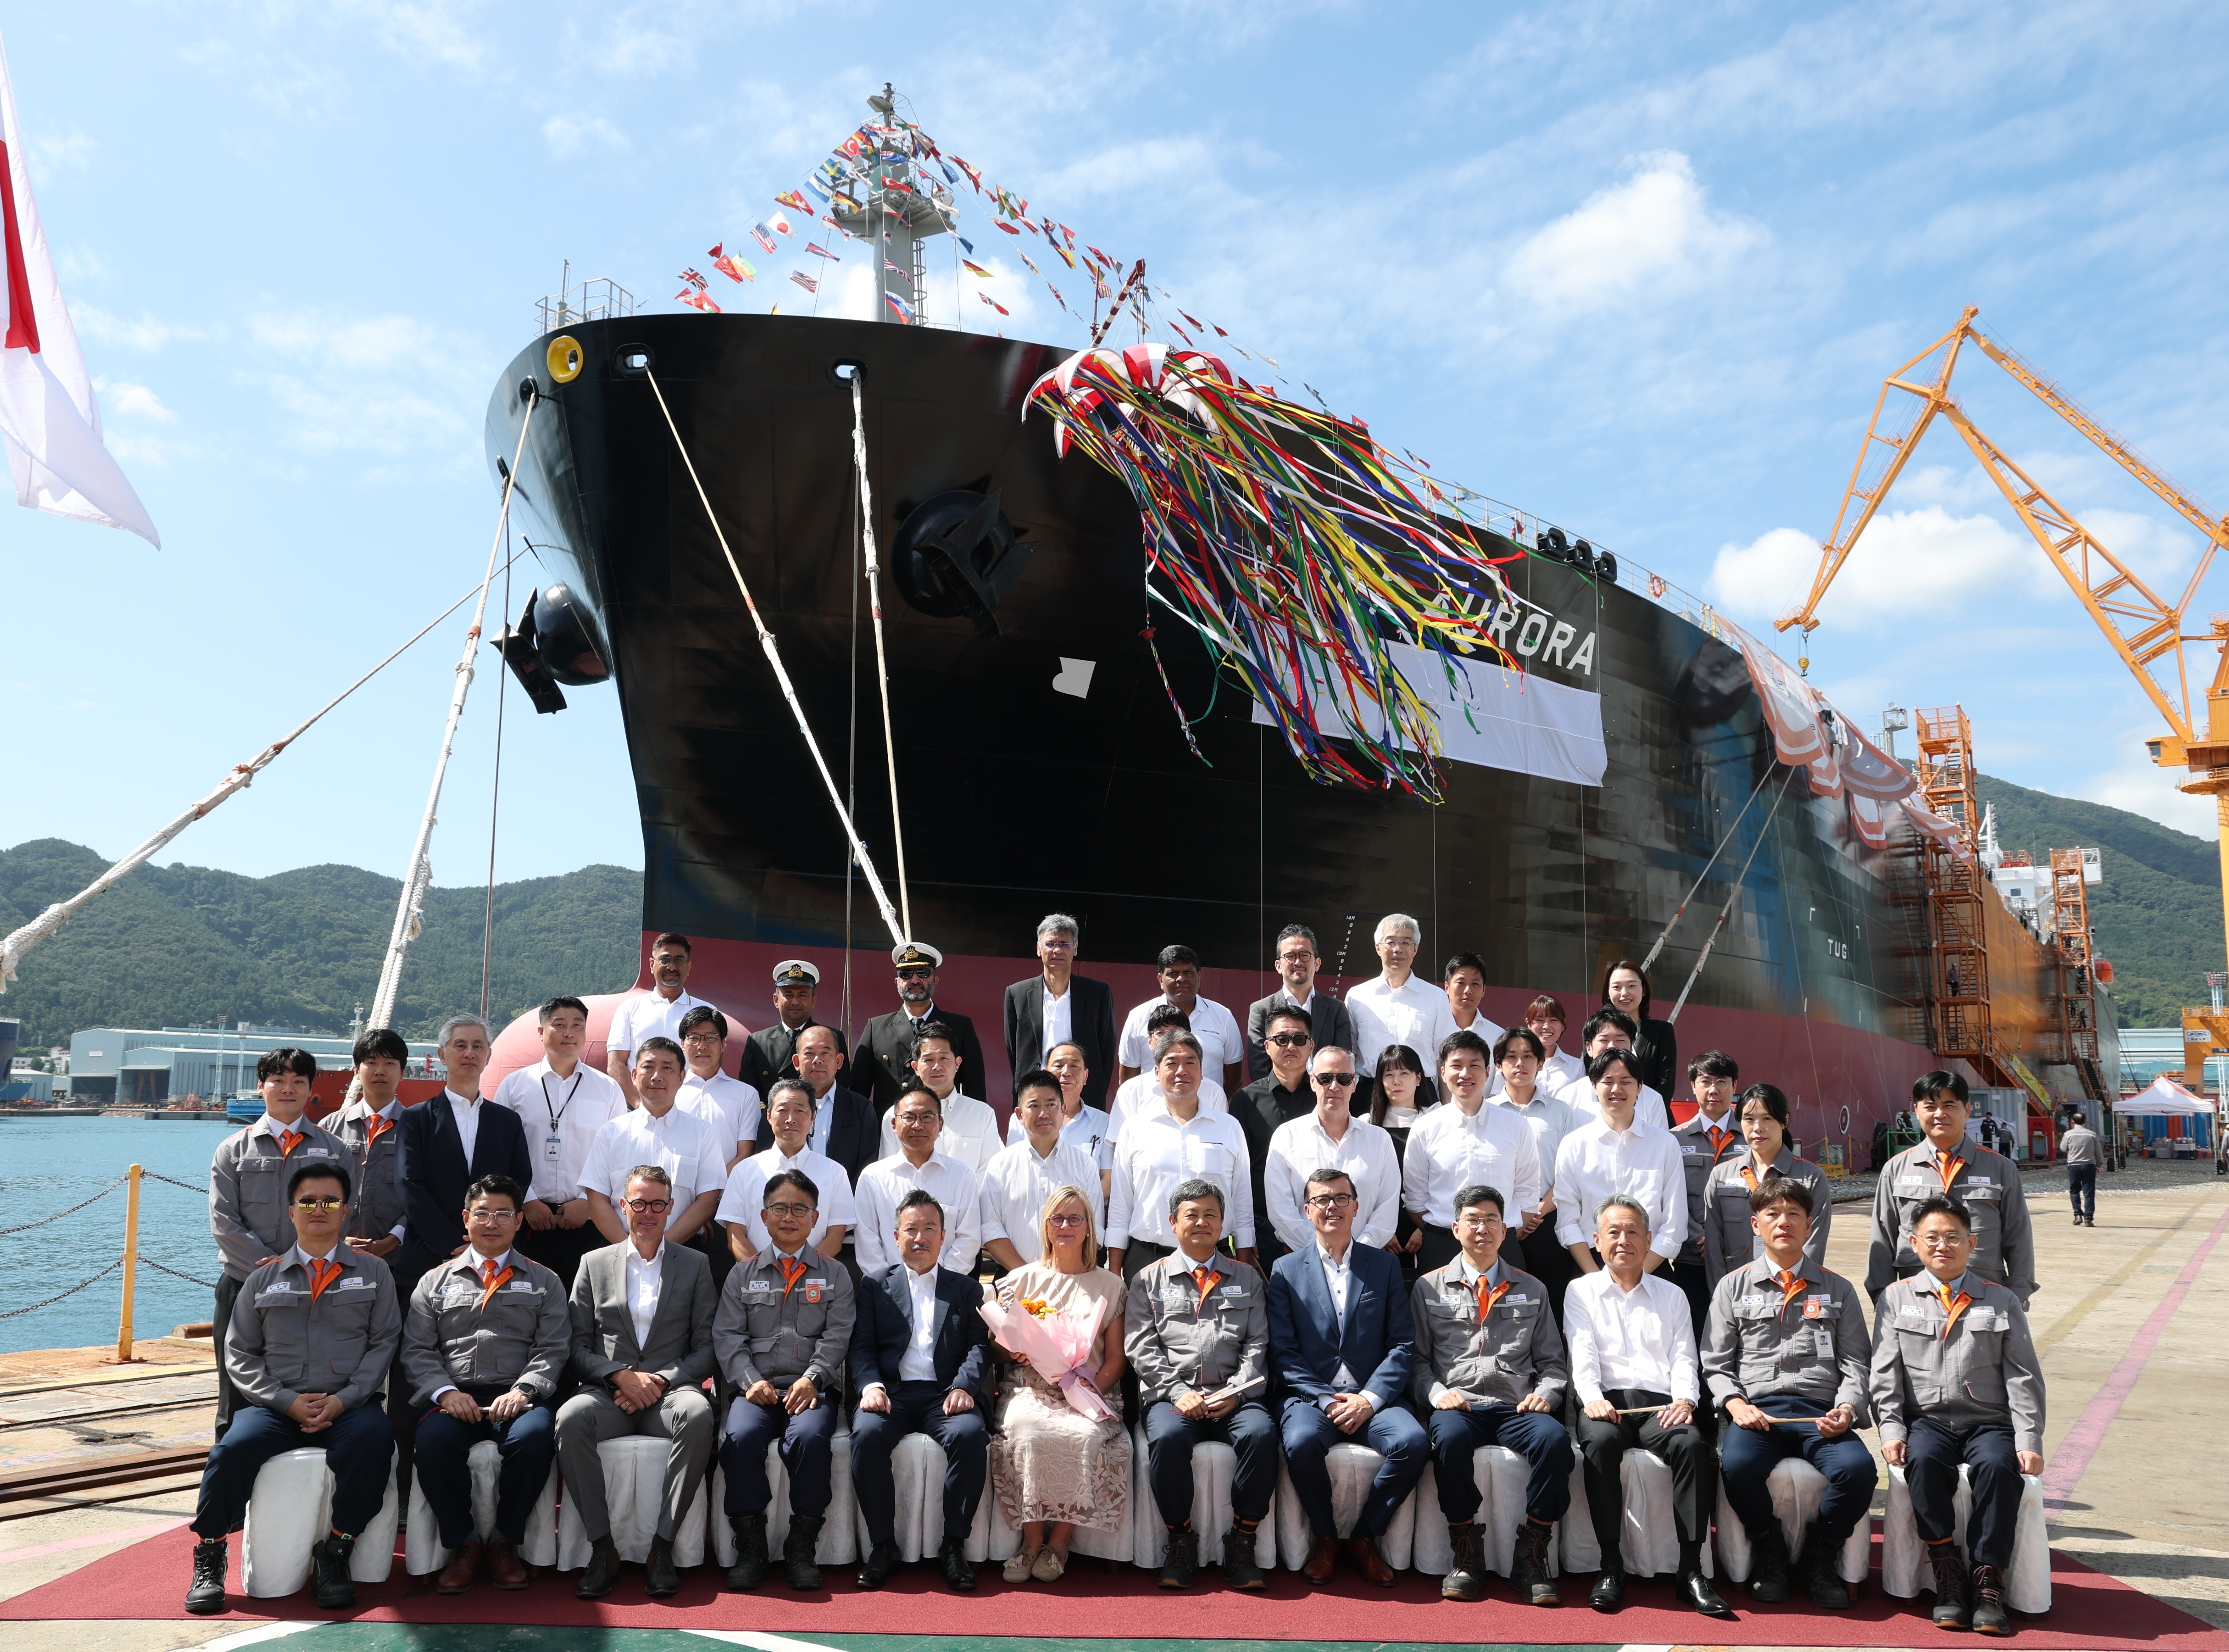 命名式の様子
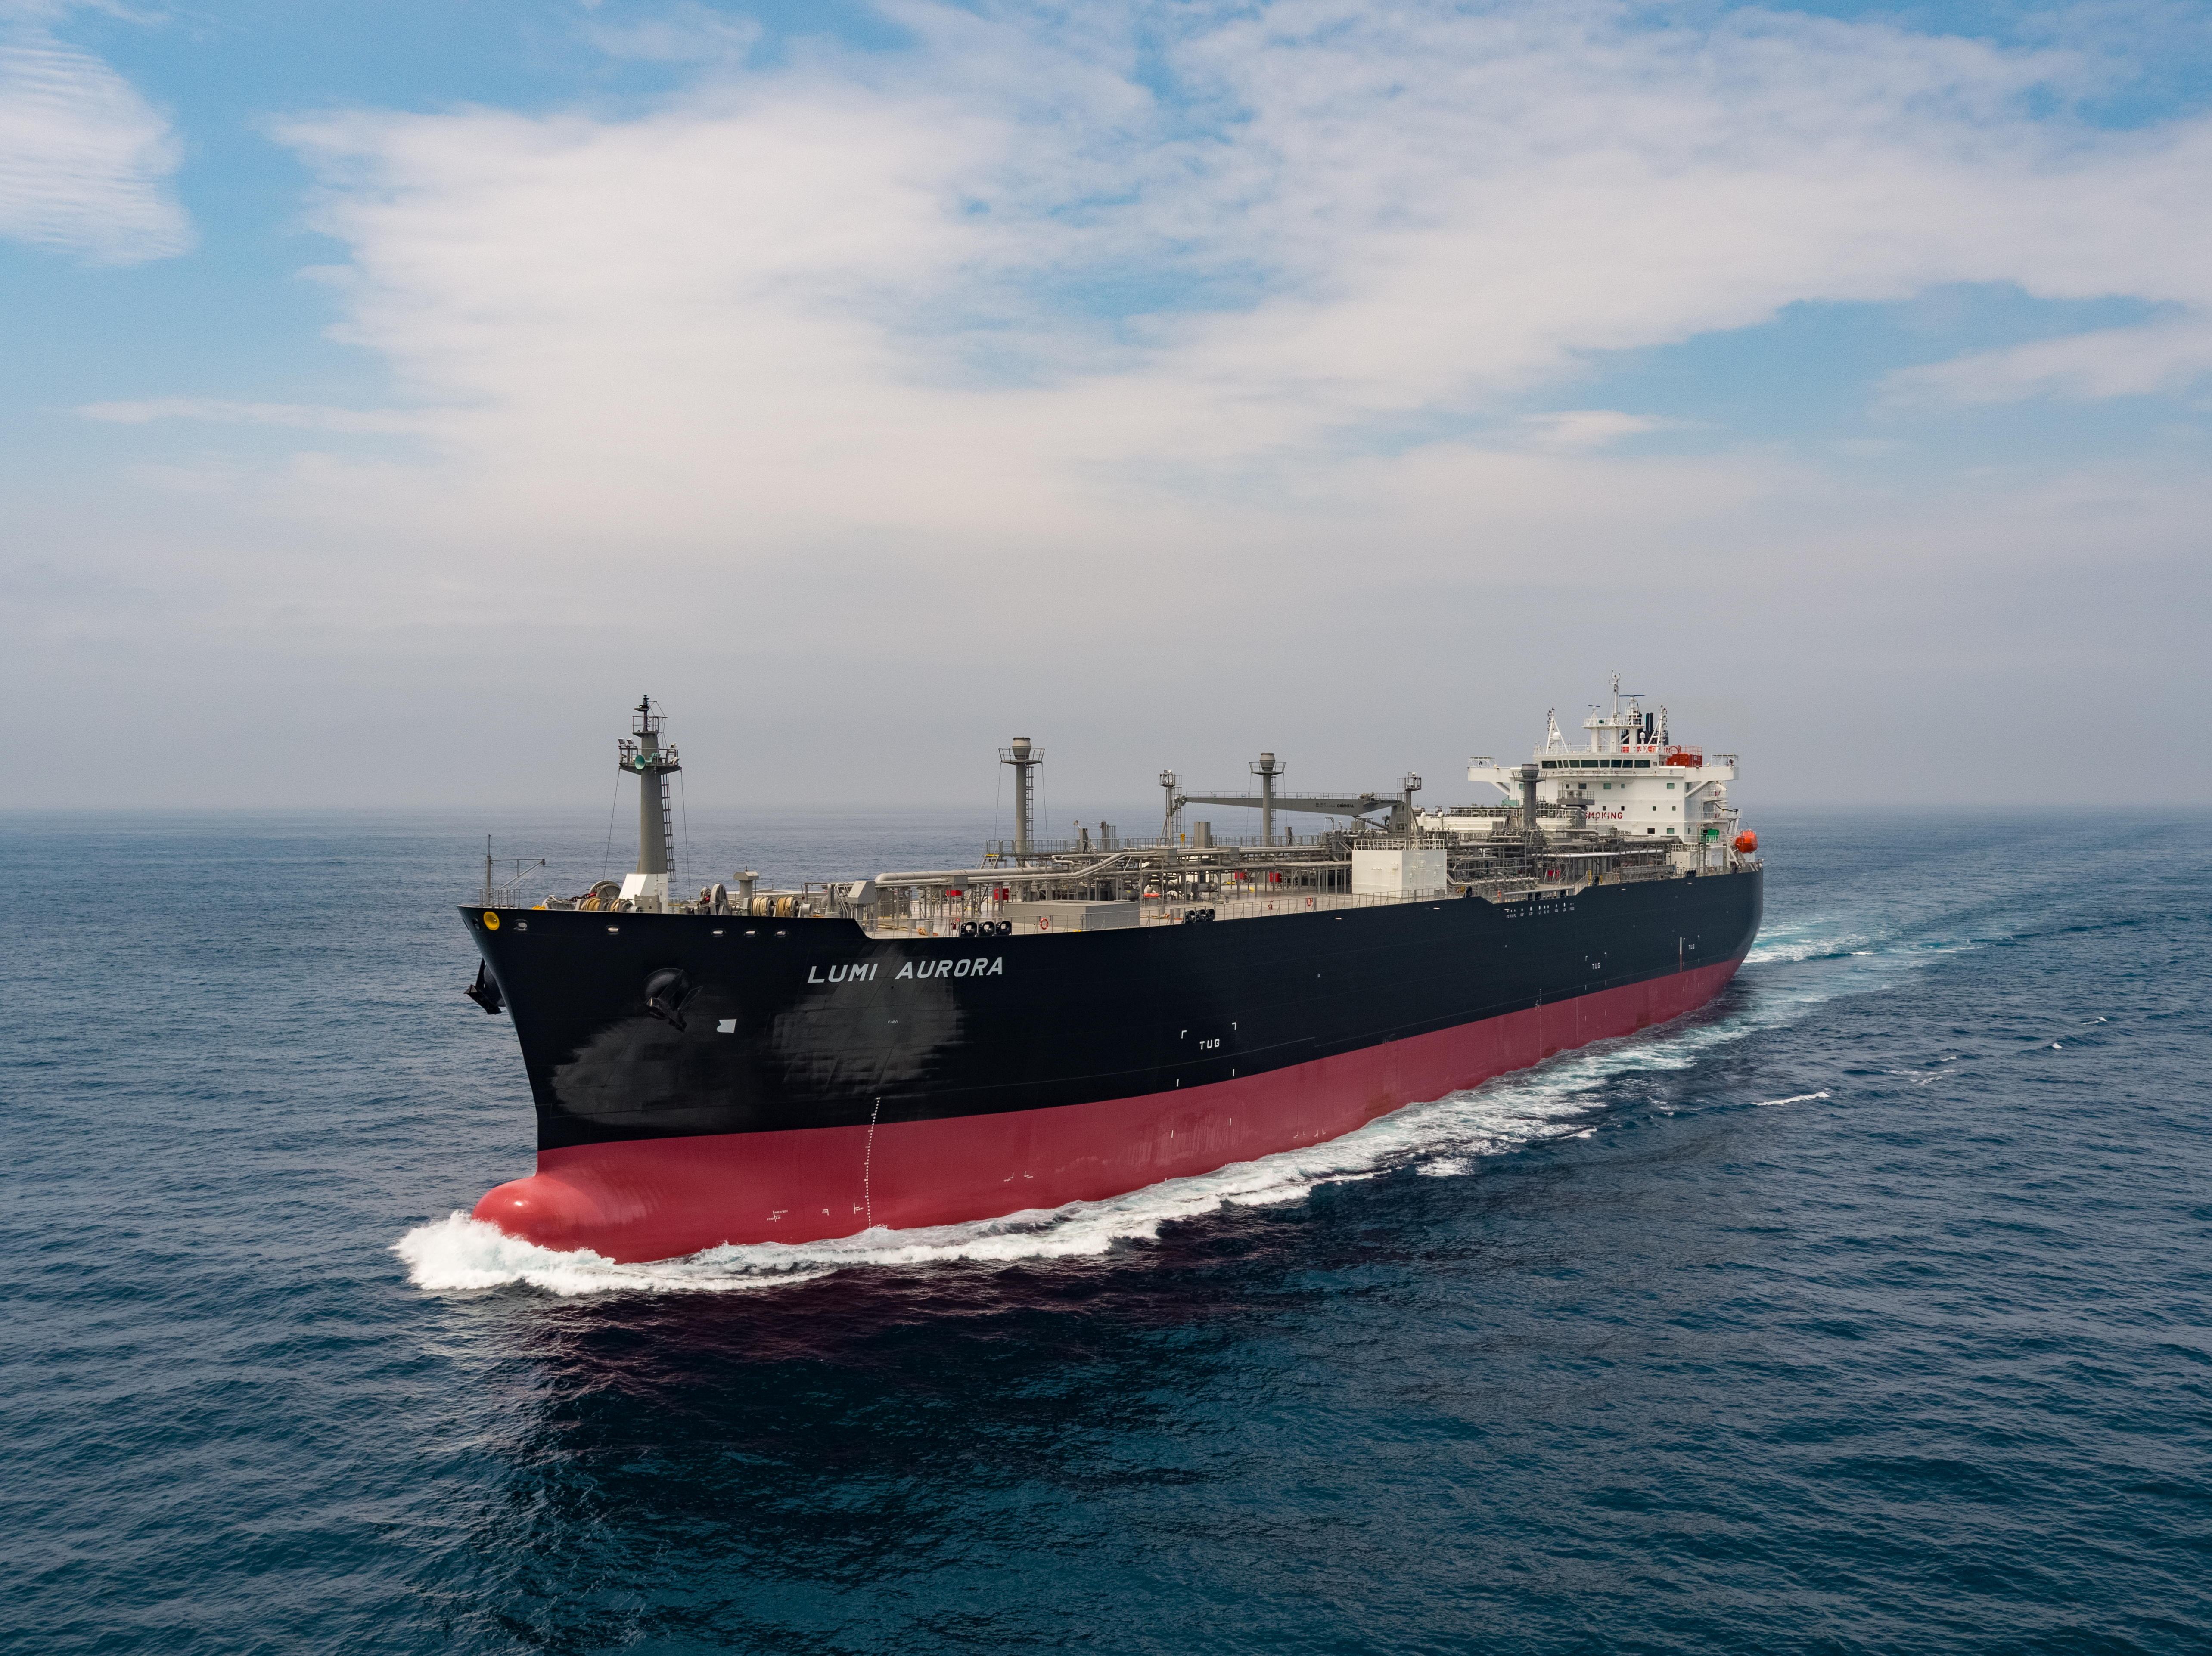 LUMI AURORA
 同市では住みやすく安全で活力のある漁村づくりを推進し、持続可能な水産振興を図るための取組みを実施しています。本プロジェクトは、徳山下松港に面する海域において、トラフグやタコといった水産資源に加え、藻場・干潟などブルーカーボン・オフセットの拡大も含めたブルーエコノミーの創出に取組むことを目的としています。当社はこのプロジェクトの中でも、大島干潟を拠点にブルーカーボン生態系であるアマモ等の創出・拡大に取り組むブルーカーボン推進事業に賛同し、支援しています。


 当社は、企業による持続可能性への取組みが従来にも増して求められている中、サステナビリティに重点を置いた経営をより一層強化しています。今回のシルバー評価は、これまでの当社グループの取組みが評価された結果として取得したものと認識しております。全てのステークホルダーの持続可能な未来に向け、今後もサステナビリティへの取組みを推進してまいります。
 明日7月1日に、127回目の創業記念日を迎えるにあたり、役職員の皆様に一言ご挨拶申し上げます。
 当社は、本方法論の開発などを通じて、カーボン市場の発展に寄与するとともに、今後も国内外の関係機関との連携を強化し、海運業の脱炭素化および持続可能な社会の実現に向けた取り組みを推進していきます。
Prompts
Click prompts to add them under the company line, click again to take one out, then copy the result into your AI chat. Shared by Asian Century Stocks and Uncovered Thai Stocks. Thank you.
ETFs Holding Iino Kaiun Kaisha, Ltd.
Exchange-traded funds whose newest published daily portfolio holds one of the company's listings, largest weight first.
| ETF | Weight in ETF | Shares | Market value | As of |
|---|---|---|---|---|
| AVDV | 0.12% | 2,246,000 | $ 22.668M | Nov 16, 2026 |
| DISV | 0.10% | 520,458 | $ 5.292M | Nov 12, 2026 |
| AVDS | 0.03% | 10,300 | $ 103.952K | Nov 16, 2026 |
| DFIS | 0.03% | 143,400 | $ 1.458M | Nov 12, 2026 |
| DXIV | 0.02% | 5,900 | $ 59.996K | Nov 12, 2026 |
| DFIC | 0.01% | 162,800 | $ 1.655M | Nov 12, 2026 |
| AVDE | 0.01% | 125,300 | $ 1.265M | Nov 16, 2026 |
| DFAX | 0.01% | 94,000 | $ 955.872K | Nov 12, 2026 |
| DFAI | 0.01% | 112,000 | $ 1.139M | Nov 12, 2026 |