2026.5.14 2026年3月期 決算説明会資料 セイノーホールディングス株式会社(9076) Copyright© 2026 SEINO HOLDINGS CO., LTD. All Rights Reserved. 目次 01 2026年3月期決算概要 02 輸送事業について 03 2027年3月期業績予想 04 企業価値向上に向けて Appendix 2…
2026.5.14
2026年3月期
決算説明会資料
セイノーホールディングス株式会社(9076)
Copyright© 2026 SEINO HOLDINGS CO., LTD. All Rights Reserved.
目次
01
2026年3月期決算概要
02
輸送事業について
03
2027年3月期業績予想
04
企業価値向上に向けて
Appendix
2
Copyright© 2026 SEINO HOLDINGS CO., LTD. All Rights Reserved.
本日お伝えしたいこと
【連結:増収・増益】売上高は10%増、営業利益は25%増と好調に推移し、過去最高となりました。
業績予想比では、輸送事業の不足分を連結全体で補えたことで、想定通りの着地が出来ました。
【輸送事業:32%増益】特積みでは、単価の上昇幅は前年比で緩やかになったものの、単価改善は
継続し3.7%の伸長となりました。また、運行便の効率化により費用増加を抑制できたことに加え、
MDロジスの通年効果もあり、前年比32%の増益と連結業績に貢献しました。
【ROE5%を回復】ROEは5.6%と0.9ptの改善、EPSも36%上昇しました。
また、年間配当はDOE4%の104円(期末配当61円)と、2円の増配を予定しております。
【業績予想:増収・増益】中東情勢の影響については不確実性が高いため業績予想には織り込んで
おりませんが、輸送事業の物量・単価成長などにより、3期連続の増収・増益を計画しております。
【ロードマップ2028】ROEは5%を回復したものの、ROE8%達成に向けては引き続き収益構造改革が
必要と認識しております。ロードマップ2028の実現に向け、取り組みを推進してまいります。
3
Copyright© 2026 SEINO HOLDINGS CO., LTD. All Rights Reserved.
01
2026年3月期決算概要
Copyright© 2026 SEINO HOLDINGS CO., LTD. All Rights Reserved.
4
Copyright© 2026 SEINO HOLDINGS CO., LTD. All Rights Reserved.
連結売上・営業利益
<MDロジス連結効果>
売上
1,192.6億円
営業利益
売上高
376億円
8,129億円
前年比
+10.3%
前年比
+25.8%
(前年同期比 +96.3%〔+585.0億円〕)
(業績予想比 +3.1%)
営業利益
57.1億円
(前年同期比 +110.3%〔+29.9億円※〕)
※前期の取得関連費用6億円を含む
(業績予想比
+7.4%)
★2025年3月期第3四半期より連結化
400
8,000
350
300
営業利益率も
4.1% ⇒ 4.6%
250
7,000
へ上昇
8,129
200
376
150
7,373
6,000
298
234
100
6,428
50
5,000
(億円)
5
0
24.3
25.3
26.3
(億円)
24.3
25.3
26.3
Copyright© 2026 SEINO HOLDINGS CO., LTD. All Rights Reserved.
P/L:増収・増益
MDロジスの連結効果に加え特積みの伸長により増収・増益
ROEは5.6%と5%を回復し、年間配当は2円の増配
(単位:百万円)
25.03
26.03
前年比
売上高
737,377
812,965
+10.3%
売上総利益
86,614
97,797
+12.9%
(粗利益率)
11.7%
12.0%
+0.3pt
販売管理費
56,730
60,192
+6.1%
業績予想比
▲0.1%
売上高
前年比 +10.3%
MDロジスの連結通年効果(585億円)に加え、輸送事
業の特積みでの適正運賃収受の進展による単価上昇な
どもあり755億円の増収
営業利益
前年比 +25.8%
営業利益
37,605
+25.8%
(MDロジス除く)
前年比 +17.4%
+0.0%
MDロジスの連結通年効果(30億円※)に加え、輸送事業で
の売上増加や、運行便の効率化により費用増加を抑制した
ことなどもあり77億円の増益(※前期の取得関連費用6億円を含む)
4.1%
4.6%
+0.5pt
親会社株主に帰属する
当期純利益
19,253
23,638
+22.8%
+7.4%
E P S (円)
115.41
157.00
+36.0%
+6.5%
ROE
4.7%
5.6%
+0.9pt
+0.2pt
年間配当金(中間配当43円含む)
102円
104円
+2.0%
+2.0%
(営業利益率)
6
29,883
(MDロジス除く)
前年比 +2.5%
当期純利益
前年比 +22.8%
(MDロジス除く)
前年比 +24.6%
営業利益の増加に加え、固定資産処分損が19億円減少
したことや、退職給付信託返還益21億円の計上なども
あり、当期純利益は43億円の増益
(MDロジス連結通年効果:2億円)
Copyright© 2026 SEINO HOLDINGS CO., LTD. All Rights Reserved.
事業の概要:輸送事業は増収増益
(単位:百万円)
売上高
営業利益
(前年比)
【業績予想比】
(前年比)
【業績予想比】
26.3 事業概況
KPI
特積前年同期比
売上高
輸送事業
630,890
(+13.9%)
【▲0.2%】
27,425
(+32.2%)
【▲4.4%】
各重量・距離帯での単価改善により3.7%の単価上昇となったことに、
MDロジス連結通年効果が加わり767億円の増収
【MDロジス除く前年同期比:+3.7% 182億円の増収】
売上高
110,346
(▲4.3%)
【▲1.8%】
6,917
(▲3.4%)
【+10.7%】
99.4% (西濃運輸:一般+ミニ)
(グループ: 99.6%)
kg単価 103.7% (西濃運輸:一般)
(グループ:103.1%)
ロジスティクス 前年同期比
営業利益
増収に加え、運行便の効率化により費用増加を抑制したことに、MD
ロジス連結通年効果が加わり66億円の増益
【MDロジス除く前年同期比:+24.8% 43億円の増益】
自動車販売事業
物量
売上
136.0%(発送運賃除く)
貸切前年同期比
売上
107.7%(西濃運輸 )
新車販売台数前年同期比
乗用車は、メーカーの供給面の影響が続いたことや、環境性能割の廃
乗用車
止に伴う登録の後ろ倒しなどの外的要因もあり、販売台数が減少。
15,742台(94.4%)
トラックは、バックオーダーで好調であった前年からの反動減や、モ
デルチェンジ前の狭間期によるメーカーの生産計画の影響もあり減収。
営業利益
トラック
2,022台(80.1%)
新車の粗利率の上昇や、中古トラックの販売増、整備等の拡大による
増益もあり、減益幅が改善
物品販売事業
不動産賃貸事業
その他
7
40,926
(+5.5%)
【+7.1%】
2,456
(+4.3%)
【+2.4%】
28,345
(+5.8%)
【▲1.2%】
1,314
(+12.4%)
【+11.4%】
1,810
(+4.6%)
【+4.0%】
2,270
(+24.1%)
【+22.8%】
介護用品を中心とした家庭紙販売が引き続き好調であったことから、
増収・増益
期中の新規賃貸や賃料改定などにより増収・増益
情報サービス、管工事業、人材派遣業などが好調であったことにより
増収・増益
Copyright© 2026 SEINO HOLDINGS CO., LTD. All Rights Reserved.
連結営業利益の増減要因(前年比)
輸送事業は、適正運賃収受の進展などによる売上拡大が、傭車・外注費等の費用増加を上回り、
MDロジスの連結効果を除いても43億円の増益、連結営業利益は77億円の増益
(MDロジスの連結影響が大きいため、売上高・営業費用より除外し、MDロジス連結効果に計上しております)
(単位:百万円)
売上高前年増減(管理会計)
営業費用前年増減(▲表示は費用の増加)
輸送事業
※1 その他・調整
貸切
燃料費
傭車・
外注費
ロジスティクス
(運賃除く)
運行便の
効率化
特積み
LOM・COLD
国際
※2 その他調整
物量
単価
SC
▲1,133
+7,941
+767
差引
▲10,419
+3,754
+814
▲1,425
LOM・COLD ▲2,680
国際
▲612
その他
▲9,282
+18,254
人件費
減価
償却費
その他・
調整
賃借リース
その他・調整
▲620
▲1,114
MDロジス
連結効果
輸送事業
以外の
事業損益
連結
調整額
※3
差引
▲7,127
前期 MDロジス
取得関連費用 632
▲13,935
4,317 (MD ロジス連結効果 を除く)
輸送事業
6,681
25.03
営業利益
8
※1 便宜上、輸送事業全体の売上増減額から、特積み・貸切・ロジスティクスを差引した数字を、輸送事業その他・調整に記載しております。
※2 ※1の数値より、LOM(ラストワンマイル)・COLD(コールドチェーン)、国際による影響額を差引した数値を記載しております。
※3 MDロジス連結効果は、売上高・費用とも計上せず、利益差額のみ記載しております。
26.03
営業利益
Copyright© 2026 SEINO HOLDINGS CO., LTD. All Rights Reserved.
輸送事業の営業費用
(MDロジスを除く)
売上増加(3.7%)に対し、運行便の効率化などにより、
費用増加(3.0%)を抑制したことも営業増益に寄与
(単位:百万円)
25.03
26.03
前年比
人件費
192,159
194,254
+2,094
(+1.1%)
燃料費
17,814
16,985
▲828
(▲4.7%)
減価償却費
傭車料・取扱手数料・外注費
19,870
194,272
20,387
+516
(+2.6%)
204,692
+10,419
(+5.4%)
コメント
人員増減(3月末時点) 正社員
臨時雇用
▲0.2%
▲7.2%
建物及び構築物
車両及び運搬具
ソフトウェア
その他
+409
▲128
+139
+96
LOM・COLDでの増加
国際での増加
LOM・COLD・国際以外の増加(※)
+2,680
+612
+7,127
※運行便の効率化(減便)による2,155百万円の費用抑制後
9
その他
54,498
56,804
+2,305
(+4.2%)
賃借・リース料の増加
賃借・リース料以外の増加
+620
+1,685
営業費用合計
478,616
493,124
+14,507
(+3.0%)
MDロジスを除く売上増加
+18,254
(+3.7%)
Copyright© 2026 SEINO HOLDINGS CO., LTD. All Rights Reserved.
キャッシュ・フロー
フリー・キャッシュ・フローのプラスが、
財務キャッシュ・フローを上回り現金同等物は67億円の増加
(単位:百万円)
営業活動による
キャッシュ・フロー
26.03
52,746
前年比
56,590
増減要因
+3,844
税金等調整前四半期純利益の増加(+9,109)
棚卸資産の増減額(▲4,130)
仕入債務の増減額( +3,769)
法人税等の支払額の増加(▲5,838)
退職給付信託返還金(+4,000)
投資活動による
キャッシュ・フロー
▲70,875
▲33,422
+37,453
定期預金の払戻預入による増減(+3,711)
投資有価証券売却による収入(▲5,446)
連結範囲変更を伴う子会社株式取得による支出(+37,646)
財務活動による
キャッシュ・フロー
19,952
▲16,571
▲36,523
借入金の増減額(▲76,512)
自己株式取得による支出(+40,748)
配当金の支払額(+1,601)
フリー・キャッシュ・フロー
▲18,129
23,168
+41,297
現金及び現金同等物に係る
換算差額
153
113
▲40
現金及び現金同等物の増減
1,976
6,709
+4,733
現金及び現金同等物の
期首残高
75,378
77,354
+1,976
77,354
84,064
+6,710
現金及び現金同等物の期末残高
10
25.03
Copyright© 2026 SEINO HOLDINGS CO., LTD. All Rights Reserved.
バランスシート
ユーロ円転換社債が株式に転換したことで、
有利子負債が減少し、自己資本は増加
2025年3月末
現預金
85,121
固定資産
537,260
有形固定資産
424,887
流動資産 229,784
負債 318,798
現預金
87,822(+2,700)
有利子負債
101,376
(▲24,579)
負債 347,269
有利負債
125,956
固定資産
560,282
純資産
423,571
有形固定資産
434,113
(+9,225)
自己資本
396,995
自己資本比率
51.5%
11
(単位:百万円)
総資産 790,066百万円 (+19,225)
総資産 770,840百万円
流動資産 233,579
2026年3月末
(単位:百万円)
純資産
471,267
自己資本
443,559
(+46,564)
自己資本比率
56.1%
Copyright© 2026 SEINO HOLDINGS CO., LTD. All Rights Reserved.
設備投資
(単位:百万円)
26.03 設備投資の主な内訳
45,000
土地
1,614百万円
•
西濃運輸(愛知県日進市)
41,370
40,000
その他
8,240
36,451
35,000
8,457
30,000
車両
10,228
25,000
9,064
20,000
15,000
建物
20,690
17,316
10,000
5,000
0
12
土地
2,212
1,614
25.03
26.03
1,489百万円
建物
17,316百万円
•
西濃運輸(岡山支店新築)
2,511百万円
•
西濃運輸(市川支店新築)
3,941百万円
•
西濃運輸(横浜支店新築)
1,859百万円
•
西濃運輸(名古屋北支店新築)
3,647百万円
•
TCN岐阜※(カローラ高山店新築移転) 219百万円
•
TCN岐阜※(研修センター 新築)
267百万円
※自動車販売事業
車両
9,064百万円
•
西濃運輸(999台)
•
セイノースーパーエクスプレス
(104台)
•
MDロジス(53台)
•
四国西濃(48台)
その他
8,457百万円
•
西濃運輸(省力機器他)
•
西濃運輸(ソフトウェア)
5,935百万円
507百万円
396百万円
288百万円
2,074百万円
1,541百万円
Copyright© 2026 SEINO HOLDINGS CO., LTD. All Rights Reserved.
配当金について
今期配当は104円、DOE4.0%配当を継続
• 24.03期より、配当方針をDOE4.0%に変更し、充実した株主還元を実施
• 26.03期の配当金は、通期104円(中間43円・期末61円)と2円の増配を予定
1株当たり配当金(円)とDOEの推移
4.0%
4.0%
4.0%
通期
104円
2.3%
1.2%
100
1.2%
102
104
56
27
29
21.03
22.03
23.03
期末
61円
中間
43円
24.03
25.03
26.03
(予定)
13
Copyright© 2026 SEINO HOLDINGS CO., LTD. All Rights Reserved.
02
14
輸送事業について
Copyright© 2026 SEINO HOLDINGS CO., LTD. All Rights Reserved.
輸送事業|特積み
kg単価の推移(22年度同期比)
ロードマップ2028 開始以降、kg単価は着実な右肩上がりを継続
(集計:西濃運輸
一般便)
110.2%
110.5%
109.0%
109.7%
107.0%
107.5%
103.9%
105.6%
101.9%
101.2%
102.1%
101.6%
1Q
2Q
3Q
24年3月期
15
4Q
1Q
2Q
3Q
25年3月期
4Q
1Q
2Q
3Q
4Q
26年3月期
Copyright© 2026 SEINO HOLDINGS CO., LTD. All Rights Reserved.
輸送事業|特積み
重量・距離帯別の分析(西濃運輸)
物量(4-3月)
重量・距離帯別領域
計画 99.5% 通期日当り物量 99.4%
重い
・通期日当り物量は99.4%と計画(99.5%)にわずかに未達
②
重量
・4Qは99.8%まで回復し、地帯①・③も持ち直し傾向と
③
なったが、通期では伸び悩んだ
・高重量・短距離帯(地帯②)が下支えとなり、
①
全体を押し上げた
軽い
近い
距離
(集計:一般+ミニ)
遠い
(集計:一般)
重量・距離帯別前年比(4-3月)
重量帯/距離帯
日当り物量
kg単価
①300kg以下/500km以下
98.7%
103.4%
②300kg超/500km以下
100.4%
104.2%
98.6%
103.9%
99.4%
103.7%
③500km超
全体
16
単価(4-3月)
計画 104.5% 通期kg単価実績 103.7%
・価格競争の激化により、物量とのバランスを重視
・適正運賃収受により22年度比kg単価は堅調に推移
・物量は前年並みを維持する中、各重量・距離帯での
単価改善により、全体単価は前年比+3.7%と上昇
Copyright© 2026 SEINO HOLDINGS CO., LTD. All Rights Reserved.
輸送事業|ロジスティクス
ロジスティクスの状況
ロジスティクス|売上高 (管理会計)
MDロジス連結効果もあり売上は大幅増加
前期開設施設の稼働率が上がり売上増加に寄与
175万㎡
床面積
182万㎡(MDロジス45万㎡含む)
4.0%増
(単位:百万円)
・MDロジスの連結効果が通年で寄与
MDロジス除く
130万㎡
136万㎡
・前期開設した拠点の空き坪への顧客誘致により稼働率が向上し、
売上増に寄与
5.2%増
MDロジス
34,511
MDロジス※
17,020
59,864
(102.8%増)
物流倉庫
MDロジス以外
MDロジス以外
(9.4%増)
MDロジス以外
MDロジス以外
MDロジス※
・ノンアセットでお客様の成り代わりとして場内倉庫業務を受託
将来にわたり持続的なロジスティクスサービスを提供
(6.3%増)
発送収入
26,604
82,650
MDロジス
・今期稼働した新拠点の開設効果による売上増
36.0%増
30,103
28,309
54,913
81,389
46,877
42,844
事業拡大の要因
・「施設の老朽化」「マテハン設備の更新負担」「従業員の高齢化」
などお客様の物流業務の自社運営に対する将来リスクを払拭
50.5%増
52,546
(97.5%増)
※ 2025年3月期第3四半期より連結化
下期のみの実績となります。
25.3
17
26.3
合計
114,778
42.9%増
164,039
+49,261
(MDロジス除く
71,153
8.2%増
76,981
+5,828)
Copyright© 2026 SEINO HOLDINGS CO., LTD. All Rights Reserved.
輸送事業|貸切
貸切事業の状況
貸切|売上高(西濃運輸:管理会計)
当社の強みである積合せ貸切とハコベルのデジタルマッチン
グを活用しつつ、営業・配車機能の強化および協力会社ネッ
トワークの拡充により、前年比7.7%の増収を達成。
35,000
(単位:百万円)
貸切市場環境
・労働時間規制による輸送力低下輸送力不足
➤ネットワーク拡大で吸収
・緊急輸送・スポット輸送のニーズの増加
➤集中配車センター化(専任化)
7.7%増
30,000
当社の取組み
25,000
・6エリア8拠点で貸切専用の配車センターを稼働
・専任担当が対応することで、即応力を高め受注拡大を実現
・27年3月期は全18エリアへの配車センター設置予定
20,000
15,000
28,127
30,286
全国車両供給ネットワーク
即時マッチング(デジタル)
10,000
ハコベル連携
リアルタイム化
×
全国の車両ネットワーク
メガエキス(積合せ貸切)
貸切集中配車センター
×
標準化・高速対応
5,000
“No.1貸切プラットフォーム”へ
0
25.03
18
26.03
Copyright© 2026 SEINO HOLDINGS CO., LTD. All Rights Reserved.
輸送事業|特積み
運行便の効率化(西濃運輸)
運行便の効率化
単位:億円
通期で21.5億円の効率化効果(延べ38,700便)
・低積載の定期便を中心とした効率化
20
→ 通期累計は定期便延べ29,900便の効率化
17.0
21.5
→ 特定曜日の運休、大型連休時、祝日の運行体制変更
により、延べ8,800便を効率化
10
10.6
・集約の推進、再編
→ 中継輸送専門店、ロジ施設の夜間活用、
5.7
小規模店の母店集約
0
1Q
19
・物量波動に合わせた効率化
上期
3Q
通期
Copyright© 2026 SEINO HOLDINGS CO., LTD. All Rights Reserved.
輸送事業
2026年3月期期初の想定⇒実績
期初の想定
1.単価:利益寄与 37億円
実績
4Q累計 103.7%
単価想定:104.5%
・前期から取り組んでいる3年周期の運賃改定のターゲットや、個建契約荷主の運賃改定をなど、
適正運賃収受の取り組みを継続する。
2.物量想定
4Q累計 99.4%
物量想定:99.5%
・米国関税問題の影響が見えない部分が多く、国内経済の先行きが不透明であることから、
現時点では、物量は若干の減少を想定
3.MDロジスの通年寄与:利益寄与 19億円
4Q累計 23.6億円
・24年10月より連結化、今期連結業績に通年寄与
通期連結影響額売上 549億円営業利益 19億円
4.ロジスティクスの拡大:利益寄与 10億円
前期先行投資回収(利益寄与)
・売上拡大により先行投資のキャッチアップを図るとともに、新たな成長に繋げるための投資も進める。
今期は4拠点(自社3:賃借1)を開設し、5.6万㎡の床の確保を進める。
5.コストコントロール :利益寄与 20億円
運行便の効率化(費用抑制)
・物量に相関した運行体制の構築として、集約の推進・再編、近距離便の見直しを進めるなど、
コストコントロールを進めることで、運行便全体の積載効率を高め混載差益を創出する。
20
4Q累計 10億円
4Q累計 21.5億円
Copyright© 2026 SEINO HOLDINGS CO., LTD. All Rights Reserved.
03
21
2027年3月期業績予想
Copyright© 2026 SEINO HOLDINGS CO., LTD. All Rights Reserved.
2027年3月期業績予想(通期)
(単位:百万円)
825,500
812,965
+12,534
輸送事業
639,800
630,890
+8,909
自動車販売事業
112,000
110,346
+1,653
物品販売事業
41,700
40,926
+773
不動産賃貸事業
2,500
2,456
+43
その他
29,500
28,345
+1,154
+1.5% 【輸送事業】
<特積み(西濃運輸)>
+1.4%
物量 101.5%(日当り)
単価 102.8%(一般)
+1.5%
日数 99.3%
+1.9% <(参考)日ノ丸西濃連結除外影響>
+1.8% (26.03期単体決算実績)
売上
5,813百万円
+4.1%
営業利益 120百万円
営業利益
41,400
37,605
+3,794
+10.1%
輸送事業
31,840
27,425
+4,414
自動車販売事業
6,440
6,917
▲477
物品販売事業
1,340
1,314
+25
【自動車販売事業】
+16.1% <新車販売台数>
乗用車 16,770台(106.5%)
▲6.9%
トラック 2,104台(104.1%)
+1.9%
不動産賃貸事業
1,850
1,810
+39
+2.2%
その他
2,080
2,270
▲190
▲8.4%
調整額
▲2,150
▲2,133
▲16
経常利益
41,800
37,264
+4,535
+12.2%
親会社に帰属する
当期純利益
27,500
23,638
+3,861
+16.3%
売上高
22
第3四半期までは好調に推移しているものの、
27.03
26.03
増減額
増減率
特積みの物量・単価が想定に届いていないこともあり、業績予想は据え置き
コメント
(予想)
(実績)
(前年)
(前年)
EPS 169.08円(+12.08円)
ROE 6.1%
(+0.5pt)
Copyright© 2026 SEINO HOLDINGS CO., LTD. All Rights Reserved.
2027年3月期設備投資予想
(単位:百万円)
27.03 設備投資の主な内訳
45,000
39,100
40,000
36,451
35,000
土地
9,000
その他
8,457
車両
9,064
建物
18,000百万円
•
西濃運輸(市川支店新築工事)
•
西濃運輸(岡山支店新築工事)
•
西濃運輸(名古屋南支店新築工事)
30,000
25,000
12,000
車両
12,000百万円
•
西濃運輸 (961台)
•
MDロジス(83台)
•
セイノースーパーエクスプレス
(82台)
20,000
15,000
10,000
建物
17,316
0
3,926百万円
5,817百万円
2,053百万円
9,000百万円
783百万円
578百万円
3,100百万円
1,700百万円
土地
土地
1,614
26.03
23
その他
9,000百万円
•
西濃運輸(省力機器他)
•
西濃運輸(ソフトウェア)
18,000
5,000
100百万円
100
27.03
Copyright© 2026 SEINO HOLDINGS CO., LTD. All Rights Reserved.
コーポレート・ベンチャー・キャピタル出資先への出向制度開始
04
24
企業価値向上に向けて
Copyright© 2026 SEINO HOLDINGS CO., LTD. All Rights Reserved.
ロードマップ3年経過の進捗状況
国内経済が不安定な情勢も、当社グループにおいてはロードマップ2028に基づき着実に成長。
一方で、ROE8%達成に向けては時間を要しているものの、
資本効率を意識した経営管理により、引き続き中長期的なROEの改善を目指していきます
ROE/EPS推移
輸送事業売上推移
8.0%
210
ROE(左軸)
700,000
オーガニック
EPS(右軸)
M&A
利益率
輸送事業
CAGR9.9%
600,000
7.0%
6.0%
129,114
157.00
69,575
500,000
5.0%
140
5.0%
5.6%
400,000
4.0%
4.6%
4.0%
4.3%
3.7%
300,000
3.0%
3.2%
70
501,776
200,000
2.0%
470,237
前中期計画
100,000
ロードマップ2028
25
474,701
1.0%
26.03
25.03
24.03
23.03
22.03
0
21.03
0.0%
484,551
0
0.0%
23.03
24.03
25.03
26.03
(単位:百万円)
Copyright© 2026 SEINO HOLDINGS CO., LTD. All Rights Reserved.
再掲
ロードマップ2028~逆ROEツリー~
ロードマップ2028に基づきロジスティクス事業と貸切事業の推進を加速させます
ROE改善のドライバー
1
特積み事業の着実な成長
2
ロジスティクス事業の成長
3
貸切事業の成長
4
M&A・オープンイノベーション
売上高成長
年率4%水準の
オーガニック成長
+M&A
ROE8.0%以上
利益率改善
1
特積み事業の効率化を通じた収益性向上
2/3
高収益のロジスティクス・貸切事業の
構成比拡大
5
DOE4.0%以上の配当と継続的な自己株
式の取得
経済価値と
社会価値の両立
営業利益率5.8%水準へ
営業利益年率
10%以上の成長
EPS年率
15-20%の成長
資本政策
自己資本比率を適正水準へ
26
Copyright© 2026 SEINO HOLDINGS CO., LTD. All Rights Reserved.
当社の現状の強み・基盤と課題
ロードマップ2028の進捗を踏まえ、改めて当社の強み・基盤と課題を整理。
使命に対する実行力および基盤の強化に向け、課題解決の施策を進めていきます
強み・基盤
使命
「価値創造/輸送立国」
現状の課題
ガバナンス
社会価値と経済価値の両方を志向する明確な
経営ビジョン
変革をけん引する外部人材の登用・活用
体制の未整備
アドバイザリーボードなど、外部知見による
企業価値向上の議論基盤
戦略
ROE・ROA・ROICを軸に、資本効率や資本市
場を意識した経営へ転換
組織設定
事業領域拡大、M&A、新規領域拡張にも積極
的な戦略
従業員や保有資産を重視してきた経営基盤
27
戦略を企画立案する機能が十分でない組織
運営
規律・基準
成長投資および資本戦略における財務規律
の考え方が未熟
運用体制
輸送事業のビジネスモデル毎の財務情報の
可視化・運用体制の整備途上
事業管理の高度化およびグループ運営見直し
の推進
これまでの安全性を重視した財務運営とこれ
からの成長投資を支える資金調達の土台
機能と統括範囲が異なる組織割りと、
グループシナジーの推進に向けた統括体制
プロセス
経営基盤
(組織資産・人的資産・顧客資産・
物的資産・金融資産)
当
社
組
織
を
再
編
次世代経営人財・デジタル人材の育成・
採用
Copyright© 2026 SEINO HOLDINGS CO., LTD. All Rights Reserved.
輸送事業の成長戦略を推進する6つの戦略部および
デジタル戦略室を設置
非連続な成長につなげるべく、6つの戦略部およびデジタル戦略室を設置。輸送事業の主要領域ごとに
戦略企画機能を強化することで、グループ横断での企画立案や施策展開を推進し、
新たなサービス創出と事業全体の効率化ならびにシナジー拡大を図っていきます
【戦略部門】
特積み(O.P.P.)戦略部
貸切戦略部
ロジスティクス戦略部
コールド戦略部
ラストワンマイル戦略部
国際戦略部
[新設]
[新設]
[従来の事業部を改組]
[従来の推進チームを改組]
[従来の推進チームを改組]
【戦略部門の主な役割】
28
中長期バックキャストからの戦略立案
グループシナジー創出
事業会社の効率化
Copyright© 2026 SEINO HOLDINGS CO., LTD. All Rights Reserved.
輸送事業ポートフォリオによる成長戦略と収益構造転換
輸送事業の戦略マトリクス
【高収益×高市場成長】重点拡大領域
市場成長性
高
ロジスティクス戦略部
•
デジタル活用による省人化・最適化を通じたオペレーションの高度化および付加価値の創出
•
M&A等を活用した機能拡張・事業領域拡張による非連続成長の実現
【高収益×低市場成長】
コールド
ラストワンマイル
ロジスティクス
国際
シェア拡大領域
貸切戦略部
•
プラットフォームの拡大による配車最適化・積載率向上・オペレーション効率の最大化
•
ロジスティクス戦略と連携した高付加価値輸送サービスの提供および収益単価の向上
収益性
低
高
【低収益×高市場成長】
貸切
低
29
円の大きさ:売上規模
国際戦略部、コールド戦略部、ラストワンマイル戦略部
•
グループシナジーの見直し・高度化によるコスト構造改革および収益基盤の再構築
•
成長領域における勝ち筋の明確化と収益化を前提とした投資の選別・集中
【低収益×低市場成長】
特積み
成長領域
効率化領域
特積み(O.P.P.)戦略部
•
グループおよび同業他社との連携によるネットワーク最適化および積載率向上
•
管理会計の高度化による路線別・顧客別収益性の可視化と不採算領域の是正
Copyright© 2026 SEINO HOLDINGS CO., LTD. All Rights Reserved.
業界横断の連携強化を通じたお客様への価値創出により
Team Green Logistics構想の具現化へ
重点施策
Team Green Logistics
の目指す姿
Green
特積み
無形資産強化
同業他社との連携によるネットワーク最適化および積載率向上
P31
• 九州西濃運輸とJPロジスティクスの共同配送モデル開始
P32
• TGL山陰設立
デジタル戦略
P41
•
One Stop/Green
貸切
•
デジタルプラットフォームの拡大
P33
ロジスティクス
•
• 運送事業者向けのサービス拡大
Support/One Stop
人財戦略
デジタル活用による省人化・可視化・最適化を通じたオペレーション
の高度化および付加価値の創出
30
自社データ基盤の構築、
強化
業界横断のプラット
フォームへ拡張
グループ横断成長に向け
たデジタル支援
P43
•
•
P35
• AZ-COM丸和HDと業務提携開始
P36
• サプライチェーンDXコンサルティングの高度化
P37
• ロジスティクスの価値提供事例
P40
• AIエージェントの構築
•
採用、育成強化
新技術、他社連携による
課題解決の取り組み推進
業界貢献につながる取り
組みの展開
Copyright© 2026 SEINO HOLDINGS CO., LTD. All Rights Reserved.
特積み/ O.P.P.
九州西濃運輸とJPロジスティクスによる
新たな共同配送モデル開始
物流業界の生産性向上と持続可能なインフラ維持を目指し、JPロジスティクスと連携して、
九州西濃運輸延岡営業所(宮崎県)にてアセット(拠点)を共同利用し、配達エリアの分担を開始
Before
延岡市
エリア
九州西濃運輸
延岡営業所
日向市
エリア
【 2024年4月~九州エリアにて5つの地域で共同配送を開始】
総走行距離 111,600km/年の削減効果
約72.0t-CO₂のCO₂排出量削減
JPロジスティクス
日向支店
【新たな共同モデル 】
After
九州西濃運輸
延岡営業所
JPロジスティクス
延岡支店として併用
31
延岡営業所におけるアセットを共同利用し、当社グループが延岡市、
延岡市
エリア
日向市
エリア
JPロジスティクスが日向市とエリア分担し、効率化を実現
総走行距離 +23,400km/年の削減効果見込み
約+15.6t-CO₂のCO₂排出量削減見込み
Copyright© 2026 SEINO HOLDINGS CO., LTD. All Rights Reserved.
特積み/ O.P.P.
TGL山陰設立により過疎化が進む地域の物流効率化へ
2026年4月より、当社子会社である日ノ丸西濃運輸と福山通運の子会社である
山陰福山通運の共同株式移転により合弁会社「TGL 山陰株式会社」を設立
セイノーHD
50.0%
福山通運
50.0%
合弁会社 TGL山陰株式会社(持分法適用関連会社)
セイノーHDと福山通運が合弁会社を設立し、その傘下で両社子会社が事業を推進する
体制を構築し、連携を強化するための枠組み。
合弁会社が戦略・運営を統括し、各子会社が強みを活かして営業連携や業務効率化を
進めることで、高品質かつ安定的な物流サービスの提供を目指していく。
本取り組みにより地域物流基盤の強化と、今後のさらなる連携拡大につなげていく。
代表取締役社長藤本誠(日ノ丸西濃運輸社長)
代表取締役副社長堀耕司(山陰福山通運社長)
100%
100%
日ノ丸西濃運輸
山陰福山通運
【期待するシナジー】
共同配送・運行の推進による積載効率の向上
拠店・施設・システム等の共同活用
共同購入および調達の推進
今後の共同配送スキーム一部事例
大田共同配送モデル
Before
After
日ノ丸西濃運輸
大田営業所
日ノ丸西濃運輸
大田営業所
山陰福山通運
大田支店
大田配送
一部エリア
山陰福山通運
大田支店
大田配送
一部エリア
合弁会社設立は既存事業の再編および効率化を目的とするものであり、両社の連結業績に与える影響は軽微です
32
Copyright© 2026 SEINO HOLDINGS CO., LTD. All Rights Reserved.
貸切
ハコベルは業界の課題解決に向け、更なる価値提供を展開します
マッチング事業により拡大してきた貸切プラットフォームにおいて、人手不足・効率化につながる
ソリューションを運送会社へも提供することで、課題を抱える物流業界の課題解決を加速します
ハコベルにおけるロードマップ
荷主
短期
中期
長期
セイノーグループシナジーの
実現による成長加速
顧客・運送会社向けの
サービス領域の拡大と
ワンストップでの提供
業界標準化・
オープンパブリック
プラットフォームの実現
ハコベル運送パートナーネットワーク
23.03
26.03
提供余地が多分にある運送会社に対して
約1.5万社
約
万社
(66%増)
2.5
人材採用支援サービス「ハコベルキャリア」
登録事業者数
約4.3万台
33
8.0
運送業務支援システム「トラックマネージャー」
などソリューションを拡大
約
万台
(86%増)
登録車両台数
Copyright© 2026 SEINO HOLDINGS CO., LTD. All Rights Reserved.
貸切
セイノーグループはデジタル技術を活用し
お客様・中小運送事業者の課題解決を目指します
これまでアナログでの業務が多かったお客様・運送事業者へデジタル化を推進することで
双方の課題解決に貢献
お客様が物流を自社化する場合も
物流DXシステムを提供
運送事業者の経営・業務支援に
つながるサービスを提供
倉
庫
業
務
輸送依頼
・業務委託
お
客
様
最適な輸送等
課題解決の提案と
実行
課題解決内容
・持続的、安定的な物流基盤
・ワンストップまたは
デジタル化での手間削減
34
物
ロ流
ジの
の省
セ人
化
イ・
ノ最
ー適
化
輸送依頼
輸送依頼
貸
切
輸
送
貸切を中心とした
運送事業者ネットワーク
実運送
輸送手配
デジタル・AIを活用した
最適化マッチング
混
載
輸
送
運
中送
小事
企業
業者
課題解決内容
・効率的な経営
・車両稼働率の向上
・法令遵守かつ適正化
Copyright© 2026 SEINO HOLDINGS CO., LTD. All Rights Reserved.
ロジ/ O.P.P.
AZ-COM丸和HDと業務提携により物流業界の効率化や
物流基盤の強靭化を目指します
2026年4月22日にAZ-COM丸和ホールディングスと物流機能及び経営資源を相互に活用する業務提携を締結
「共創」を通じ以下の実現を目指す
・物流ネットワークの最適化
・従業員の幸福の追求
使命
経営理念
輸送立国:物流を超えて、お客様に喜んで頂ける最高の
サービスを常に提供し、国家社会に貢献する
“お客様第一義”を基本に、サードパーティ・ロジスティクス業界の
No.1企業を目指し、同志の幸福と豊かな社会づくりに貢献する。
TGL構想:『Team Green Logistics』共に創り 未来に貢献する
「同音同響の経営」:同じ目的目標を持った同志全員が衆知を集め経営に参画する
両社の経営資源を相互に活用し、物流機能の連携による新たなサービス創出やサプライチェーン最適化、人手不足の解決につなげていく考え
物流機能・
ネットワークの連携
物流サービス・
事業モデルの共創
営業基盤・業界
ネットワークの連携
経営基盤・ノウハウ
の共有と高度化
IT/DX分野の相互活用
・共創体制の構築
今後、ロジスティクス戦略部およびラストワンマイル戦略部を中心に先方と検討チームを組成、
連携内容の具体化および実行に向けた取り組みを推進していきます
現時点における2027年3月期の業績への具体的な影響額については未定ですが、公表すべき事項が生じた場合には速やかに開示いたします
35
Copyright© 2026 SEINO HOLDINGS CO., LTD. All Rights Reserved.
ロジ/ On behalf
デジタルツイン活用による
サプライチェーンDXコンサルティングの高度化
デジタルツイン技術を活用し、物流・サプライチェーン全体の可視化と最適化を実現するコンサルティング
サービスを強化し、お客様の物流における戦略的意思決定の高度化を支援します
【デジタルツイン活用の内容】
【提供価値】
物流ネットワーク(拠点・輸送・在庫)をデジタル上に再現
可視化とシミュレーションに基づく意思決定支援
実績データに基づき、複数シナリオ(拠点再配置・輸送・在庫)
拠点・輸送・在庫を一体で捉えた全体最適設計
を事前検証
実行可能なコンサルティングの提供
需要変動や制約条件を織り込んだシミュレーションを実施
【シミュレーションによる効果事例】
物流診断サービス
診断件数
物流コスト最適化やリードタイム短縮
拠点リスクシミュレーションとレジリエンス強化
シミュレーション活用による施策実行前のリスク可視化
戦略立案から実行までの一体化による施策実現性の向上
サービス開始24年9月以降の実績
340件 うち、成約件数 66件
デジタルツインとは、現実世界で集めたデータをもとに、コンピューター上の仮想空間でリアル空間を再現する技術
36
Copyright© 2026 SEINO HOLDINGS CO., LTD. All Rights Reserved.
ロジ/ On behalf【事例】
SUBARUとの協業による自動車部品物流の高度化
SUBARUのバッテリーEVの自動車部品トラック輸送において、新たに協業を開始。
自動車部品輸送の集約と長距離混載輸送を組み合わせることで、長距離輸送の高効率化を図ります
【提供価値】
【取り組み内容】
中京地区(豊川支店)を起点とした集約・混載輸送モデルを構築
積載率向上による輸送コスト・効率の改善
長距離幹線輸送における積載効率を最大化
ドライバー不足の緩和
SUBARUが幹線輸送を一元管理し、物流全体の最適化を実現
部品メーカーの物流負担軽減
積載効率向上により
50
約
%
車両台数削減
今後、必要な地域にも同様のビジネススキームの展開を目指す
Before
自動車部品
メーカー
部品メーカーが個別に貸切輸送し、直接納入
各部品
メーカー手配
After
拠点集約+混載輸送により輸送を一体最適化
自動車部品
メーカー
SUBARU×西濃運輸
手配
豊川支店
部品メーカー近郊
での荷物集約
37
群馬県
工場
Copyright© 2026 SEINO HOLDINGS CO., LTD. All Rights Reserved.
ロジ/ On behalf【事例】
日本出版販売の成長戦略を強化する物流ソリューションの提供
日本出版販売の競争力を高める基盤づくりのための物流再構築プロジェクトにおいて、
セイノー情報サービスが効率化と多角化を同時に実現
提供ソリューション
【取り組み内容】
作業員管理
倉庫管理(WMS)
【提供価値】
複数物流拠点の集約と全社で統一できる物流基盤の構築
多品種小ロット物流の高効率化・データリアルタイム管理
WMS(SLIMS)×RMS×ASRSによる自動化
ヒューマンエラー抑制による品質向上
拠点増設や事業拡大に柔軟に対応できるクラウド基盤
省人化と柔軟なオペレーションの実現
ロボットマネジメント
【主要成果】
生産性:約 3 倍
(出荷明細処理能力90行/時 → 300行/時)
棚卸誤差率:ゼロ(ASRS対象エリア)
月間処理能力:70万行規模にも対応
繁忙期・人員変動への耐性向上(即戦力化)
物流×データ×自動化を軸に持続可能なロジを支え、
お客様の成長戦略を強化する物流の価値創造企業へ進化
ASRS:倉庫内の保管・入出庫・ピッキング作業などを自動化する自動倉庫(Automated Storage and Retrieval System)
38
Copyright© 2026 SEINO HOLDINGS CO., LTD. All Rights Reserved.
ロジ/ On behalf【事例紹介】
Point Mobile Japanの事業成長を支えるワンストップ3PL
日本市場参入に伴う物流供給網構築に対し、国際輸送~循環物流までワンストップ3PLサービスを提供。
他社では難しい一貫受託体制の設計力と伴走支援によりお客様の物流パートナーへ
提供ソリューション
アウトソーシング
【取り組み内容】
【提供価値】
国際輸送/通関/倉庫/全国配送/循環物流を統合した3PL
約4か月で物流基盤を構築し、迅速な市場参入を実現
マネジメントセンターによる窓口一元化
全国配送網による安定供給と運用負荷軽減
キッティング・保守を含めた業務設計・運用支援
問い合わせの一元化により顧客体験・信頼性を向上
【ポイント】
国際輸送から循環物流まで一貫提供できる統合力
実運用を前提とした具体的な設計・提案力
国内完結型のサービス体制による“日本品質”の実現
物流×保守×運用支援の統合により、顧客の事業成長を支える
「インフラ機能」としてのポジションを確立
39
Copyright© 2026 SEINO HOLDINGS CO., LTD. All Rights Reserved.
ロジ/ On behalf
物流業界初のAIエージェントの構築
AIが物流現場の状況を分析・予測し、最適な意思決定と改善アクションを自動化することで、
お客様の管理業務の大幅な効率化と物流全体の最適化に貢献することを目指します
ロジスティクスエージェントのイメージ
持続可能かつ戦略的な物流運営を
実現する次世代の知的パートナー
知見・環境データ
定型/非定型
出荷・入庫データ
画像・映像
現場の勘・知見
センサー
現場の判断や
行動を
支援・代行
現場への指示
日本のマクロ物流コスト54.2兆円※に対し、
物流管理コストの削減だけでなく、
ムリ・ムダ・ムラを削減することにより
物流コストの最適化を実現を目指します
※2024年度物流コスト調査報告書(JILS)より
運用マニュアル
アクティビティ
(人)
可視化・表示
ロボット・設備
進化イメージ
現場AI
2025-2026
Level 1-2
現場力の強化
作業支援から判断支援や異常検知へ
40
実行型
エージェント
2027-2030
Level 3-4
実務の再設計
判断から行動までの自動化
マルチロジスティクス
エージェント
2031-2035
Level 5-6
組織を越えるマネジメント
ネットワーク協調と全体最適
Copyright© 2026 SEINO HOLDINGS CO., LTD. All Rights Reserved.
デジタル戦略/目指す姿
自社データ基盤の構築・強化し
業界横断のプラットフォームへ拡張
分散したオペレーションデータ統合によって、当社グループ内の意思決定とサービスを高度化し、
データ基盤を荷主・同業・パートナーをつなぐ業界の標準プラットフォーム化することを目指します。
「物流データプラットフォーマー」へ進化し、輸送立国を支える社会インフラへ
各種オペレーションデータ
荷主企業
統合データ基盤
需要・在庫・出荷予測の連携
輸配送 / TMS
同業他社
① 集約
② 加工・標準化
③ 活用
倉庫 / WMS
共同輸配送・空車マッチング
パートナー輸送会社
車両・運行・運賃の標準化
通関・国際輸送
データ集積
(データレイク)
データ資産化
可視化・分析
AI/機械学習
在庫・庫腹のリアルタイム共有
公的機関・自治体
外部・荷主システム
ITガバナンス・セキュリティ/クラウドファースト
ステップ1:自社データ基盤の構築
41
倉庫・物流不動産
災害時BCP・統計連携
ステップ2:業界横断プラットフォーム
Copyright© 2026 SEINO HOLDINGS CO., LTD. All Rights Reserved.
デジタル戦略/全体像
戦略部・事業会社と連携し
グループ横断での成長をデジタルで支援
分散したオペレーションデータを統合し、
グループ横断でデータ資産をフル活用することで新たなビジネス拡張へ
デジタル戦略室の範囲
特
積
み
貸
切
ロ
ジ
ス
テ
ィ
ク
ス
コ
ー
ル
ド
ラ
ス
ト
ワ
ン
マ
イ
ル
国
際
金
融
新規
物流データを活用した新規ビジネスの開発
既存
BPR+Data+AIによるムダの削減と効率化
横断
データの統合によるグループ総合力の見える化
グループ横断での有形無形資産のシェアリングと活用
効果
Data+AI / Applications+BPR / ITガバナンス
42
意思決定の高度化
経営・現場のデータドリブン化
オペレーション最適化
手配業務プロセスのAI化
お客様向け新サービス
可視化・シミュレーション
サステナビリティ対応
CO₂・エネルギー可視化
Copyright© 2026 SEINO HOLDINGS CO., LTD. All Rights Reserved.
再掲
人的資本戦略
~Well-beingの実現=経営理念の実現~
経営理念(幸福の三本柱)にもとづく取り組みにより、
グループ全体でWell-being実現を目指しています
強みを支える無形資産・有形資産
人的資本戦略
従業員のWell-beingを高めることが定着の向上や
採用のアドバンテージにもつながると考える。
グループ従業員
エンゲージメント・
経営理念「会社を発展させ、従業員を幸福にする」
定着率の向上
定着向上
理念・企業文化の浸透
Well-being
実現の効果
採用力向上
Well-beingの実現 ~エンゲージメントの向上~
BtoBトラック輸送No1の実績
多様な輸送ネットワーク
豊富な物流データ
物流ITシステム
スタートアップとの協業体制
一体感の醸成に寄与する
企業スポーツ
43
個人の成長
Well-being
実現の土台
従業員の
一体感の醸成
Copyright© 2026 SEINO HOLDINGS CO., LTD. All Rights Reserved.
人財戦略/人財育成
AIを伴走者として、理念に則り自律的に考え・行動できる人財を
グループ全体で育てます
経営理念の実現に向け、従業員一人ひとりの行動変容を促進するため、理念・行動指針を
「理解」から「実践」へと転換するAI活用型研修制度を構築し、グループ全社に展開
Before
After
【 Web研修の課題】
【 AI研修のメリット】
講師・上司の対応可能な時間・人数に限界がある
24時間365日必要なときにすぐ、質の高いフィードバックが受けられる
受け身になりやすくモチベーション維持の難しさ
AIとの対話を通じて、自ら考え・学ぶ習慣が身につく
疑問があっても質問できず、理解が曖昧なまま進んでしまう
いつでも気軽に問いかけ、納得するまで対話できる
知識は得られても、実際の業務での活かし方がわからない
業務に近い場面でフィードバックを受け、実践力として定着する
受講の完了が確認できても、本当に理解できているかが見えない
対話の内容から一人ひとりの理解度や課題を把握できる
AI研修コンテンツ事例
・理念の浸透
・マネジメント強化
・コンプライアンス教育
・収支マネジメント強化
期待される効果
実行力の向上
理念の浸透
組織強化
等
自主性の向上
スピードアップ
セイノーグループの理念を体現し、
実践できる真のリーダーを育成
44
Copyright© 2026 SEINO HOLDINGS CO., LTD. All Rights Reserved.
人財戦略/人的資産
セイノーグループを支える多様な人財
戦略の実現に向け、当社グループでは多様な人財の採用および高度化を推進しています
25年にベトナム出身の「特定技能」
外国人ドライバーが2名入社。
内1名は当社初となる「路線乗務社員」と
して単独乗務を開始。
また26年4月よりインド出身5名、
ネパール出身2名のドライバーも採用
45
「2025年度全国販売会社サービス技術
MDロジスのチームが国際的なサプライ
コンクール」において、岐阜日野自動車
チェーンマネジメント競技会「Global
の2名が、新人・特定技能部門で
PRO Challenge 2025」にて世界第 2 位
最優秀賞をダブル受賞
(物流企業では第 1 位)を受賞
Copyright© 2026 SEINO HOLDINGS CO., LTD. All Rights Reserved.
人財戦略/新技術活用による取り組み
国内初、特積み幹線での「自動運転中継輸送」を実証
【取り組み内容】
【成果】
長距離中継輸送において、一部区間にレベル2自動運転
自動運転を組み込んだ一連のオペレーションの成立性を確認
トラックを組み込み、一連の輸送オペレーションを検証
ドライバー拘束時間を除き、関東―関西間相当の行程を24時間
高速道路上の無人運転と一般道での有人運転を切り替える
以内で完結可能であることを実証
「切替拠点」に立ち寄り、実運用を想定した運行手順を確認
レベル4自動運転の実現を見据え、運行モデルの実効性を検証
従来の運行イメージ
労働時間の制約により
輸送能力にも限界あり
Aさん
神奈川県
店所
1泊後復路運行
将来的には1日1往復の運行が可能となり、輸送能力の向上
(従来比の2倍)が見込まれることを確認
兵庫県
店所
【今後の方針】
自動運転はドライバーの拘束時間の短縮や日帰り運
行の実現につながり、働き方の柔軟性向上と輸送能
力向上の両面に貢献。
1泊後往路運行
また将来的には中部―九州間などの長距離輸送にお
Bさん
本取り組みイメージ
いて、労働時間の制約により難しかったリードタイ
兵庫県
店所
神奈川県
店所
ム短縮などサービス向上にもつなげていく方針。
24時間以内に完了
46
Copyright© 2026 SEINO HOLDINGS CO., LTD. All Rights Reserved.
人財戦略/他社連携での取り組み
企業横断型中継輸送の実証、働き方の柔軟性向上へ
【成果】
【実証内容】
実輸送現場におけるドライバー交替方式の企業横断型
中継輸送の実施
ガイドラインおよび運行ルールに基づく運用の実効性
と支障の検証
知見の蓄積と課題整理を通じた社会実装に向けたルール
・体制の検討
神奈川
厚木支店
大阪
堺支店
静岡
浜松支店
Aさん
日帰り勤務
ドライバー交替
47
るドライバーの拘束時間のサイクルを短縮。日帰り勤務が可能で
あることを確認
オペレーションの実現性:事前のルール統一とシステム活用によ
り、異なる企業間であっても安全な車両交換と運行管理が可能で
あることを確認
ならびに新たな人財の参画促進につながる見込み
【社会実装に向けての今後のポイント】
Bさん
Bさん
日帰り勤務
神奈川
藤沢支店
大阪
堺支店
Aさん
日帰り運行の確立:中継輸送スキームにより、長距離運行におけ
これにより、日帰り運行を通じた労働環境の改善、定着率の向上、
西濃運輸・福山通運の実証イメージ
Aさん
Bさん
荷役・配送の役割分担の再設計
中継対象車両の要件整理と運転環境整備
拠点運用設計と中継距離の最適化
各社の貨物・運行情報の連携
責任分界とリスクマネジメント体制の明確化
Copyright© 2026 SEINO HOLDINGS CO., LTD. All Rights Reserved.
人財戦略/業界貢献につながる取り組み
当社グループのみならず業界全体の人財に関する
課題に対しても価値提供します
ハコベルキャリアの提供
batonによる実証
「ハコベルキャリア」によって、ドライバーを中心とした業界経験者の
ドライバーの健康データと運転データを統合・分析し、健康起因
キャリア構築を支援。業界内での健全な人材移動を実現することで業界
リスクを早期に把握することで、現場オペレーションと連動した
外への人材流出を防ぎ、人手不足問題解決への貢献を目指しています。
予防型の安全運行モデル確立を目指す共同研究型の実証に参加。
転職相談・登録
求人依頼
求人の
紹介
48
人材の紹介
健康管理データとデジタコ運転データの相関分析を実施
非接触バイタルセンシングとAIによる日常的な健康状態の可視化
分析結果を運行管理に反映し、事故リスク低減につなげる検証
物流業界における予防型安全管理モデルの社会実装を視野に検討
Copyright© 2026 SEINO HOLDINGS CO., LTD. All Rights Reserved.
おわりに
ロードマップの進捗については、国内経済が不安定な状況下でも着実に成長しているものの、
ROE8%達成に向けては時間を要しております。
今回、輸送事業を戦略マトリクスに整理しておりますが、6つの戦略部を新たに設置し、
それぞれの領域において、中長期からのバックキャストによる非連続を含めた戦略立案から
事業成長と収益構造の転換を図るとこで、ROE8%の達成に向けて取り組んでまいります。
TGL山陰の設立をはじめとした過疎地域における新たな枠組みや、AZ-COM丸和HDとの業務提
携を通じ、TGL構想の具現化に努めてまいります。
引き続き、中長期目線で輸送業界のあり方について、あるべき姿を追求しながら、自社の成長に
つなげてまいります。
49
Copyright© 2026 SEINO HOLDINGS CO., LTD. All Rights Reserved.
Appendix
50
Copyright© 2026 SEINO HOLDINGS CO., LTD. All Rights Reserved.
営業費用(連結)
MDロジスの連結もあり営業費用は増加(9.6%)したものの、
費用増加を上回る売上増加(10.3%)により営業利益は増加
(単位:百万円)
51
25.03
26.03
前年同期比
コメント
人件費
233,898
250,472
+16,573
(+7.1%)
MDロジス連結影響
MDロジス以外での増加
13,348
3,225
燃料費
18,423
17,820
▲603
(▲3.3%)
MDロジス連結影響
MDロジス以外での増加
246
▲849
減価償却費
24,134
26,472
+2,338
(+9.7%)
MDロジス連結影響
MDロジス以外での増加
1,674
691
傭車料・取扱手数料・外注費
222,714
259,598
+36,884
(+16.6%)
MDロジス連結影響
MDロジス以外での増加
26,464
10,419
その他
208,323
220,995
+12,671
(+6.1%)
MDロジス連結影響
商品仕入原価の減少
賃借・リース料の増加(MDロジス除く)
13,979
▲3,174
698
営業費用合計
707,494
775,360
+67,865
(+9.6%)
連結売上増加率 10.3%
Copyright© 2026 SEINO HOLDINGS CO., LTD. All Rights Reserved.
輸送事業|特積み
特積み:物量・単価の状況
下期は回復基調(100%)となったものの、
前年通期が高水準の中、通期伸長率は103.7%に
通期では計画には届かなかった
とどまるも、着実な積み上げを継続
日当たり物量(前年同期比)
(集計:西濃運輸
kg単価(前年同期比)
26.3期通期
計画 99.5%
一般+ミニ便)
(集計:西濃運輸
26.3期通期
計画 104.5%
一般便)
107%
105.0%
110%
105.4%
105.0%
104.0%
103.9%
102.4%
100.0%
98.8%
98.9%
96.4%
100.2%
102.6%
99.8%
103.0% 102.8%
98.5%
101%
通期実績
103.7%
95%
通期実績
99.4%
80%
1Q
2Q
3Q
25年3月期
52
4Q
1Q
2Q
3Q
26年3月期
4Q
95%
1Q
2Q
3Q
25年3月期
4Q
1Q
2Q
3Q
4Q
26年3月期
Copyright© 2026 SEINO HOLDINGS CO., LTD. All Rights Reserved.
2027年3月期業績予想第2四半期(中間期)
単位:百万円
25.09
(実績)
増減額
(前年)
増減率
(前年)
コメント
+1.7% 【輸送事業】
<特積み(西濃運輸)>
+1.1%
物量 100.6%(日当り)
単価 102.8%(一般)
+6.3%
日数 99.0%
+0.4% <(参考)日ノ丸西濃連結除外影響>
(26.03期中間期単体決算実績)
+2.9%
売上
2,871百万円
営業利益 58百万円
+1.0%
405,500
398,559
+6,940
輸送事業
312,200
308,925
+3,274
自動車販売事業
58,000
54,579
+3,420
物品販売事業
20,400
20,326
+73
不動産賃貸事業
1,250
1,215
+34
その他
13,650
13,512
+137
営業利益
19,400
18,101
+1,298
輸送事業
14,000
12,201
+1,798
自動車販売事業
3,900
4,187
▲287
+7.2% 【自動車販売事業】
+14.7% <新車販売台数>
乗用車 8,590台(104.1%)
▲6.9%
トラック 1,286台(121.7%)
物品販売事業
620
721
▲101
▲14.0%
不動産賃貸事業
920
894
+25
+2.9%
その他
1,100
1,241
▲141
▲11.4%
調整額
▲1,140
▲1,145
+5
経常利益
19,900
18,495
+1,404
+7.6%
親会社に帰属する
四半期純利益
12,400
10,757
+1,642
+15.3% EPS 76.27円(+4.16円)
売上高
53
26.09
(予想)
Copyright© 2026 SEINO HOLDINGS CO., LTD. All Rights Reserved.
本資料に記載されている業績見通し等の将来に関する記述は、当社が現在入手して
いる情報及び合理的であると判断する一定の前提に基づいており、実際の業績等は
様々な要因により大きく異なる可能性があります。
お問合せ先
セイノーホールディングス株式会社
〒503-8501 岐阜県大垣市田口町1番地
TEL:0584-82-5023
FAX:0584-82-5043
http://www.seino.co.jp/seino/shd/
E-mail:[email protected]
54
Copyright© 2026 SEINO HOLDINGS CO., LTD. All Rights Reserved.



 (新しいウィンドウで開きます)
 (新しいウィンドウで開きます)
 (新しいウィンドウで開きます)
 (新しいウィンドウで開きます)

 (新しいウィンドウで開きます)
 (新しいウィンドウで開きます)
 (新しいウィンドウで開きます)
 (新しいウィンドウで開きます)



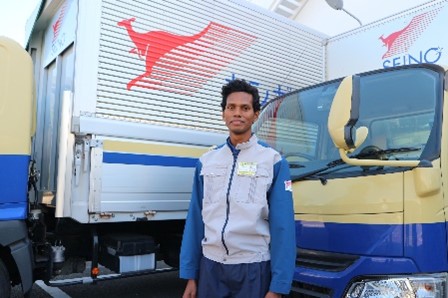 岐阜支店 ニコラス・パンダンさん
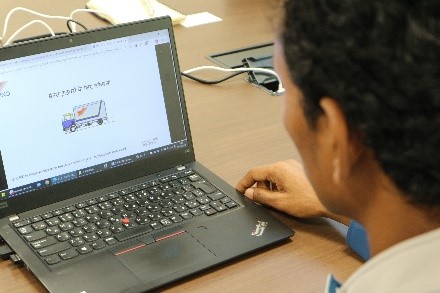
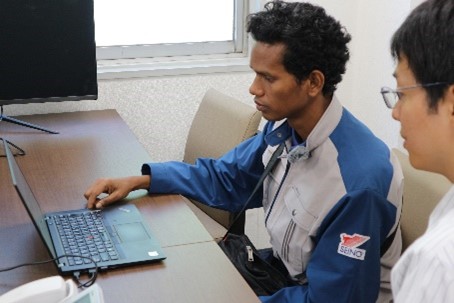 ヒンディー語のマニュアルを確認する様子