KONOIKE GROUP Integrated Report 2026 統合報告書 2026 CONTENTS Chapter 1 Chapter 3 Chapter 4 What is KONOIKE How we do Data 2 私たちのルーツ 24 Ⅰ 事業戦略 104 財務ハイライト 4 私たちの事業 26 鉄鋼本部 106 事業状況・経営成績等の分析 5 実績紹介 29…
KONOIKE GROUP
Integrated
Report
2026
統合報告書 2026
CONTENTS
Chapter 1
Chapter 3
Chapter 4
What is KONOIKE
How we do
Data
2
私たちのルーツ
24
Ⅰ 事業戦略
104
財務ハイライト
4
私たちの事業
26
鉄鋼本部
106
事業状況・経営成績等の分析
5
実績紹介
29
エンジニアリング本部
108
連結財務諸表
6
私たちの強み
32
生活産業本部
117
会社情報
7
私たちのブランド
35
食品プロダクツ本部
8
TOP MESSAGE
38
メディカル本部
41
空港本部
44
国際統括本部
47
Ⅱ 財務・資本政策
49
Ⅲ 経営基盤強化
Chapter 2
Where we go
51
59
特別座談会人的資本経営
事業環境認識
12
重要課題(マテリアリティ)
63
技術
14
中期経営計画2027
73
環境
インド事業特集
79
ガバナンス
「第二の創業地」
インドで拓く、
KONOIKEグループの成長戦略
インド事業特集
人
11
16
16
人材戦略と現場での新たな挑戦DNA
特別座談会人的資本経営
59
KONOIKE GROUP Integrated Report 2026
HISTORY
OF KONOIKE
私たちのルーツ
140年以上受け継がれる「人」と「絆」のDNA
現場から、すべてが始まった̶
1880
1900
1880年、
「鴻池組」の名のもと、労務供給・運輸業を開始しました。淀川河
口域の伝法を拠点に、度重なる水害からの復旧工事に携わるなかで、地域
の人々を束ね、力を結集して難局を乗り越えていきました。こうした現場で
培われたのが、人と人との信頼を礎に仕事を成し遂げる姿勢です。大きな
転機となったのが、1898年に着工した淀川改良工事です。大量の労働力の
確保が課題となるなか、長年築いてきた人脈と信頼を活かして多くの人々を
集め、約16kmに及ぶ工区を請け負いました。困難な工事にも誠実かつ愚直
に向き合い、5年をかけて新淀川の開削を完遂。その後、1917年の大洪水
でも復旧工事に尽力しました。人を束ねる統率力と、最後までやり遂げる
責任感は、今日のKONOIKEを支える精神として脈々と受け継がれています。
〜創業の地で生まれた鉄鋼関連事業の礎〜
「鴻池運輸」の創業〜「人」と「絆」のDNA〜
鉄鋼関連事業への進出
KONOIKEグループ創業の地である大阪の伝法に誕生した
民間初の鋳鋼所において、190 0年に原材料の搬出入、
構内運搬などを受注したことが鉄鋼関連事業の原点とな
りました。製鉄産業の発展とともに機械据え付けや重量物
の特殊運搬へと役割を広げる中で、現場で 信頼に応え
る姿勢が、新たな仕事を切り拓く力となっていきました。
1945
産業の発展とともに
事業の裾野を拡大
〜戦後の混乱を乗り越え事業領域を拡大〜
19 45年、鴻池運輸株式会社を設立しました。終戦後、
混乱する社会の復興需要を捉え、工場内運輸や食品関連
事業へ進出。さらに1963年には大阪―和歌山間の輸送を
開始するなど、新たな事業領域へ挑戦し、戦後の高度成長
とともに事業の裾野を広げていきました。
出所:国土交通省淀川河川事務所
2
KONOIKE GROUP Integrated Report 2026
信頼されるたびに
挑戦する現場は増えた
1900
鉄鋼関連事業
1951
1939
生活関連事業
食品関連事業
1984
国際物流事業
2018
1991
空港関連事業
1994
メディカル関連事業
エンジニア
リング関連事業
3
KONOIKE GROUP Integrated Report 2026
BUSINESS
私たちの事業
いま、社会のあらゆる現場へ ̶
運輸だけではない「鴻池運輸」
国際物流
鉄鋼
エンジニアリング
空港
フォワーディングの深い知見とネットワ
ークで、お客さまのグローバルな挑戦を
サポートします。
120年以上にわたり大手鉄鋼メーカーさ
まの製鉄所内の業務を担い、生産現場
の変革を支えています。
製鉄所で培った技術をもとに、高品質
なエンジニアリングサービスを展開して
います。
おもてなしと安全を両立する現場力で、
日本の空の玄関口を支えています。
食品
生活
国内物流
メディカル
食品メーカーさまの生産工程における
あらゆる業務フローを担い、最適化に
貢献しています。
化学品・ガス・自動車・住宅関連など多様
なメーカーさまの現場で、現場力と技術
力を活かした支援を展開しています。
多様な業界の現場で、最適な物流オペ
レーションを設計・実行しています。
医療サプライチェーンの最前線で、安全
と効率を両立するサービスを提供してい
ます。
4
CASE実績紹介
STUDIES
KONOIKE GROUP Integrated Report 2026
現場を知るから、解決できる。
メディカル事業
01
空港事業
02
物流業の枠を超えて、
医療現場の課題解決に挑む
空港全体の運営を支える
横断的サービス
病院内の物品管理に物流で培った「効率化」のノ
空港では、旅客対応から航空機の誘導・搭降載、
の一括管理・供給により、医療従事者が本来の業
広い業務を一貫して担っています。さらに、空港カ
ウハウを活かし、院内物流(SPD)を構築。物品
務に専念できる環境づくりを支えてきました。現
在は、医薬品関連業務、手術室支援、内視鏡洗
浄、医療機器メーカーのインプラント等の入出庫
・保管・配送まで領域を拡大。病院内外をつなぐ
医療サプライチェーン全体を支え、医療の品質向
上と経営効率化の両立に貢献しています。
食品事業
03
現場課題の可視化と
改善プロセス
飲料工場では、製造ラインの安定稼働を支えてい
機内食搭載などのグランドハンドリングまで、幅
ます。例えば、稼働データの取得・分析を通じて設
ウンター業務や多言語対応など、利用者に寄り添
まで踏み込み、制御プログラムや運用条件を見直
や技能実習、特定技能、インターンシップにも取
ました。
さらに、設備の稼働前後に発生していた待
ら、航空会社・空港運営会社・利用者をつなぎ、
負担の軽減を実現。
設備本来の能力を引き出し、
よ
うサービスも展開。近年は海外人材の採用・育成
り組み、多様な人材とデジタル技術を融合しなが
空港全体の円滑な運営を支えています。
備停止の要因を可視化。
設備構造や制御の仕組み
すことで、
設備停止率を0.55%から0.35%へ改善し
機時間や作業負荷も見直し、生産性の向上と現場
り安定した生産体制の構築につなげています。
5
KONOIKE GROUP Integrated Report 2026
STRENGTHS
私たちの強み
現場に入り込み、
課題を解決し続ける請負業務
KONOIKEグループの事業の中核を担うのが、お客さまのバリューチェーンに深く入り込み業務を請け負う「請負業務」です。
長期にわたる関係のなかでナレッジやノウハウを蓄積し、業務効率化やコスト削減につなげることで、単なる委託先にとどまらない深い信頼関係を築いています。
請負と派遣の違い
業務全体の最適化を支援する請負サービス
「請負」と「派遣」には大きな違いがあります。派遣は“人材”を提供するだけで、
KONOIKEグループは、創業以来培ってきた現場力とノウハウを最大限に活かし、
現場の指揮命令や管理は受け入れ先企業が担います。一方、鴻池運輸の「請負」は
物流・生産・サービスのあらゆる工程で請負サービスを提供しています。例えば製造
特徴です。私たちは自ら現場のリーダーシップを取り、作業指示や人材育成、安全
業界・業種を問わず多様な現場に携わっています。ただ作業を代行するだけで
、“業務そのもの”を引き受け、現場のマネジメントや改善も含めて主体的に担うのが
管理、品質向上まで一貫して責任を持ちます。こうした現場主導の取り組みを積み
重ねることで、日々の業務改善や生産性向上、コスト削減を実現しています。
派遣会社
派遣
請負
人材を提供する
業務そのものを引き受け、成果に責任を持つ
人材を派遣
受け入れ先企業
(お客さま)
鴻池運輸
受け入れ先企業
(お客さま)
現場での資材供給や検査、病院での器材管理や清掃、空港での手荷物搬送など、
なく、現場で気づいた課題を即座に改善提案につなげ、業務品質の向上や新たな
価値創造に挑戦。お客さまの現場力を底上げし、事業成長のパートナーとして貢献
しています。
例:食品(飲料工場)
における事例
原料配送
原料受入
パッケージング
鴻池運輸が主体的に実施
労務管理
採用業務・コスト
指揮命令
労務管理
採用業務・コスト
指揮命令
派遣会社
派遣会社
受け入れ先企業
鴻池運輸
鴻池運輸
鴻池運輸
受け入れ先企業の業務の一部を支援
業務全体を最適化し、成果・価値を創出
出荷・配送
保管・ピッキング
原料受入から製品の出荷・配送に至るまで、物流だけでなく生産工程の請負業務を
行っています。
6
KONOIKE GROUP Integrated Report 2026
BRAND
私たちのブランド
KONOIKEグループ ブランド体系
ブランドプロミス
私たちの
約束
期待を超えなければ、
仕事ではない
私たちの
ブランド
企業理念
私たちの
使命
「人」と「絆」を大切に、
社会の基盤を革新し、
新たな価値を創造します
KONOIKE 2030 VISION
2030年ビジョン
私たちの
目標
行動指針
私たちの
覚悟
KONOIKEグループが2030年に目指す姿
技術で、人が、高みを目指す
先端テクノロジーを使いこなす次世代のKONOIKEスピリットで、
お客さまと社会の課題解決を図る「現場のあり方」を進化させていきます。
人
仕事
自分
命を守る覚悟は、あるか
情熱を、燃やしているか
昨日を、超えているか
7
Chapter 1
Chapter 2
Chapter 3
Chapter 4
What is KONOIKE
Where we go
How we do
Data
TOP MESSAGE
KONOIKE GROUP Integrated Report 2026
はじめに
株主・投資家の皆さまには、平素より格別のご理解と
ご支援を賜り、厚く御礼申し上げます。
KONOIKEグループは140年以上にわたり、
「人」と
技術で未来を拓き
人と絆が
現場を進化させる
「絆」
を大切にしながら、
お客さまの現場に入り込み、
お困
りごとに向き合い、任された仕事をやり遂げてきました。
現場を知り、課題を見つけ、改善を積み重ねる力。
それが、
お客さまからの信頼と、
私たちの競争力の源泉です。
一方、労働力人口の減少や技術革新、地政学リスク、
サ
プライチェーンの不確実性、お客さまの課題の高度化な
ど、当社を取り巻く事業環境は大きく変化しています。な
かでも日本企業にとって人手不足は、採用を強化するだ
けでは解消できない、事業の持続性に関わる構造的な課
題です。人材一人ひとりがより高い付加価値を生み出せ
るよう、安全性・生産性・品質を高め、業務のあり方や事業
の仕組みそのものを変えていく必要があります。私が経
営において重視しているのは、守るべきものと変えるべき
ものを明確にすることです。守るべきは、
「人」
と
「絆」
を起
代表取締役会長兼社長執行役員
鴻池忠彦
点に現場で価値を生み出すKONOIKEらしさ。変えるべ
きは、
その現場力を発揮する方法です。
これまでの成功体
験に安住することなく、現場力をより安全に、
より強く、
よ
り広く活かせる会社へアップデートしていきます。
8
Chapter 1
Chapter 2
Chapter 3
Chapter 4
What is KONOIKE
Where we go
How we do
Data
中期経営計画2027の
初年度を振り返って
中期経営計画2027の
達成に向けて
KONOIKE GROUP Integrated Report 2026
エネルギー関連工事の受注を拡大し、元請化、人材育成、
社内外連携を通じて、売上成長と収益性向上を両立させ
ます。
これらの施策を積み上げ、2028年3月期の営業利益
2026年3月期からスタートした中期経営計画2027で
中期経営計画の2年目にあたる2027年3月期は、営業
は、
「成長投資と人・技術・ICTへの基盤投資で、従業員の
利益210億円を見込んでいます。中国便の減便による空
幸せと企業価値の最大化を実現する」を基本方針に掲げ
港関連の影響に加え、インドの鉄鋼事業では民営化に伴
ています。事業戦略、財務・資本政策、経営基盤強化を
う発注方法の変更により、業務縮小と単価低下が見込ま
一体で進め、
2028年3月期に売上高4,100億円、
営業利益
れます。営業利益は一時的に減益となりますが、外部環境
260億円、営業利益率6.3%、ROE10%以上、海外営業利
の変化を正面から受け止め、将来の収益基盤を強化する
益33億円を目指す計画です。
ための転換局面と捉えています。
260億円という目標の達成につなげていきます。
2030年ビジョンの
実現に向けて
2030年ビジョン
「技術で、人が、高みを目指す」
は、単な
る技術導入のスローガンではなく、人の力・現場力と技術
初年度の2026年3月期は、得意先における一部生産ラ
空港事業では、需要回復時に即応できる人員体制を整
インの休止や航空貨物取扱量の減少など、厳しい事業環
え、中国便以外の路線・航空会社での新規業務や、便数変
境の影響を受けました。
売上高は3,555億円となり計画に
動に左右されにくい周辺業務領域の拡大を進めていま
現場力が高くても、熟練者の経験や勘に依存し、個人の
は届きませんでしたが、インド・カナダ子会社の連結効
す。需要の回復を待つだけではなく、外部環境の変化に強
能力に頼ったままであれば、事業の拡大や人材の交代に
果、空港関連における国際旅客便の復便、各事業での取
い収益構造へ転換することが重要です。
対して再現性を確保できません。一方で、技術を導入する
の活用をかけ合わせ、安全性・生産性・品質を高め、提供
価値と収益力を向上させることを目指しています。
扱量増加や適正単価の収受などにより、営業利益は期初
インドの鉄鋼スラグ処理事業では、既存の国営製鉄所
こと自体が目的になれば、機械やシステムが増えても現
予想の220億円を上回る227億円となり、過去最高を更
への依存から脱却し、
民間製鉄所への拡販、
マイニング事業
場で使いこなすことができません。当社が取り組むのは、
新しました。
への展開、
日本で培った技術・ノウハウの移転を進めます。
現場に蓄積された判断や技能を可視化し、データや標準
外部環境の影響を受けながらも収益性を維持・向上で
一時的に減益となりますが、顧客基盤と業務領域を広げ、
として組織に蓄積することです。
これは、
当社の知的資本
きたのは、
これまで進めてきた事業領域の多様化、適正価
持続的な成長軌道へ戻すための構造改革に取り組みます。
を強化し、国内外で展開できる競争力へ変える取り組み
格の実現、海外事業の拡大が一定の成果を上げた結果だ
空港事業とインドの鉄鋼スラグ処理事業が踊り場を迎
と捉えています。特に海外事業では、北中米の冷凍冷蔵倉
える一方で、北中米では冷凍冷蔵倉庫の増設・新設によっ
現場力の変革は、当社自身の能力を高めるだけで完結
庫事業やインド事業が成長に寄与し、
インドの鉄鋼スラグ
て保管能力を拡大し、既存の顧客基盤と現地経営の強み
するものではありません。
これまで当社は、
「運ぶ」
「保管
処理事業では、増産と生産性向上により想定を上回る成
を活かして収益力を高めます。国内では、エンジニアリン
する」
「請け負う」
といった機能を通じて、お客さまの個別
果を上げました。
グ事業において製鉄所構外の大型配管工事や建築設備・
の業務や工程を支えてきました。今後は、
これらの機能を
でもあります。
9
Chapter 1
Chapter 2
Chapter 3
Chapter 4
What is KONOIKE
Where we go
How we do
Data
KONOIKE GROUP Integrated Report 2026
組み合わせ、
お客さまの事業全体を起点に、
物流や生産の
変化に対応できる人材を育成していきます。海外事業に
くい事業構造を構築し、継続的にキャッシュを生み出す力
流れに潜む課題を捉え、
解決策の設計から実行、定着まで
おいても、現地で事業を動かし、パートナーとの信頼関係
を高めることが不可欠であると考えています。
を一貫して担うことで、事業成果の向上につなげていき
を築き、収益責任を担える人材の育成が不可欠です。
ます。
この転換によって、受託業務の効率化にとどまらず、課
題解決型の高付加価値サービスを拡大します。現場のノ
ウハウと新技術を組み合わせるKOMBO活動や、AI技術
と物流現場の運営ノウハウを融合したサービスは、その
人が成長し、現場の再現性と提案力が高まり、利益が増
さいごに
える。
その循環を実現してこそ、人的投資を企業価値につ
なげたといえます。
成長投資
具体例です。知見やノウハウをグループ内で共有し、他の
KONOIKEグループの現場力を次の成長に向けて進
化させるために、現場で培った経験やノウハウを、データ
や新たな技術と掛け合わせ、社会やお客さまの変化に応
えられる事業基盤をつくります。そして、そこから生まれ
お客さまや拠点でも活用できる事業モデルへ育てる。現
中期経営計画2027では人的投資に加え、成長投資480
場力を起点にサービスの価値を高め、信頼関係を築き、利
億円を計画しています。地域はインド・北中米、事業は空
益率と成長の再現性を高める。
この能力変革と事業変革
港・メディカル・エンジニアリングといった、将来の収益性
KONOIKEグループの原点は、
「『人』
と
『絆』
を大切に、
こそが、
現場力を企業価値へと転換する道筋です。
とキャッシュ創出力を高める分野に重点的に配分してい
社会の基盤を革新し、新たな価値を創造します」
という企
きます。
ここで重要なのは投資額の大きさではなく、投資
業理念にあります。環境が変わり、事業のかたちが変わっ
がどのような成果を生み、資本効率の向上に結びついた
ても、
この理念が示す方向は変わりません。人と人との信
かを検証することです。
頼を大切にし、絆を力に変え、社会に必要とされる価値を
人的投資
る価値を持続的な利益に結びつけ、企業価値としてお示
ししていくことが、
私の責任だと考えています。
人材は、現場力と顧客価値を生み出す、
当社にとって最
投資後の検証については、低収益拠点の利益改善や撤
も重要な経営資本です。
中期経営計画2027では、
2026年
退の判断を進めてきました。今回から事業継続性審議会
3月期から2028年3月期までの3年間で、200億円以上の
を通じて、ROIC、EBITDA、利益規模などの観点から、事
株主・投資家の皆さまをはじめ、
すべてのステークホル
人的投資増額を計画しています。初年度の2026年3月期
業の継続・再建・撤退を含めた判断を行い、経営資源の最
ダーの皆さま方におかれましては、引き続き温かいご支
には、
ベースアップ26億円、教育費用8億円の計34億円を
適配分を一層進めていきます。
援とご理解を賜りますようお願い申し上げます。
投じました。
投資によって生まれた利益は、次の成長投資と人的投
この投資は、人材の確保・定着を図る処遇改善はもちろ
資に振り向けるとともに、安定的・継続的な株主還元にも
んのこと、教育研修を通じて、現場運営を担う人材に加
つなげます。成長投資と株主還元を両立するために、一時
え、経営、技術、
グローバル、高度専門の各分野で、事業の
的な利益に固執するのではなく、環境変化に左右されに
創造する。
その積み重ねによって、持続的な企業価値の向
上を実現してまいります。
10
Chapter 1
Chapter 2
Chapter 3
Chapter 4
What is KONOIKE
Where we go
How we do
Data
KONOIKE GROUP Integrated Report 2026
事業環境認識
私たちは今、
ある地域の地政学的リスクが全世界に波及し、温暖化といった地球規
模の課題への対応が求められると同時に、生成AIのような革新的なデジタル技術が
2030年に向けて、
瞬く間に世界へ広がるという、
グローバル化とデジタル化の時代に生きています。そ
の結果、産業構造や働き方は急速に変化し、不確実性の高い時代を迎えています。
そ
不確実性が増大するとともに、
のなかで、
お客さまや社会の課題もますます複雑化しており、各企業には、
いかにお客
変化が激しく先行き不透明な
さまの課題解決とサステナブルな社会の発展に貢献していくかが問われています。
KONOIKEグループの事業を考えるうえで、特に重要なのは「人」に関わる事業環
状況が続く
境の変化です。
日本国内では生産年齢人口の減少が進み、人手不足は一層深刻化す
ると見込まれます。
そのなかで事業を発展させるためには、従業員や求職者から選ば
れる会社であり続けること、
そして人口減少下にあっても社会を支え続ける会社であ
●
地政学リスクとそれに起因する影響の増大
ることが欠かせません。そのためには、個々の強みを生かせる働き方を追求し続ける
●
地球温暖化や脱炭素社会への移行といった環境問題
ことや、私たちが培ってきた固有の技術とデジタルツールなどの新技術を組み合わ
●
AI エージェントなど技術革新のさらなる進展
せ、
さらなる生産性向上を実現していくことが重要です。
また、脱炭素社会への移行に代表されるように、社会課題には地球規模のものもあ
ります。社会・経済のサステナビリティが確保されなければ、
その上に成り立つ事業の
持続可能性も維持できません。企業には、事業を通じて社会的責任を果たすことが一
層求められています。
このように、不確実性の高い環境の中で多様な課題への対応が迫られる今、限られ
た経営資源をどの課題に重点的に投じるのか。
すなわち、KONOIKEグループにとっ
ての
「重要課題
(マテリアリティ)」
が問われています。
人手不足の加速による
生産性向上が急務
●
新技術・技術革新による産業構造の変化
●
残業規制・価値観多様化等による働き方の変化
●
生産年齢人口減少等による労働力不足、国内市場縮小
11
Chapter 1
Chapter 2
Chapter 3
Chapter 4
What is KONOIKE
Where we go
How we do
Data
KONOIKE GROUP Integrated Report 2026
重要課題(マテリアリティ)
KONOIKEグループが目指す姿を示す企業理念、
および前ページの事業環境認識を踏
例えば「安全・品質」
の場合、維持・向上を通じてお客さまとの取引拡大という機会につ
まえ、
サステナビリティに関するリスクと機会を整理しました。
そのうえで、KONOIKEグ
ながる一方、事故やトラブルの頻発により
「安全・品質」
が損なわれれば、信頼関係を失う
ループの持続的成長と企業価値向上を実現するうえで、対応すべき重要課題(マテリアリ
リスクにも直結します。
ティ)
を特定しました。
重要課題
(マテリアリティ)
には、
リスクと機会の両面があります。
STEP 1
重要課題(マテリアリティ)
の識別は、
以下の過程を経て実施されました。
STEP 2
STEP 3
重要課題
(マテリアリティ)
の特定
キーワードの抽出
リスクと機会の特定
GRI
(Global Reporting Initiative)
スタンダード・
各事業部門より3〜4名程度プロジェクトメ
Step2の内容を踏まえ、サステナビリティ委
SASBスタンダード等の国際ガイドライン、
お
ンバーを募集。ワークショップ形式で自由討
員会・取締役会で複数回の検討を行い、企業
よび各ESG 評価機関(MSCI・FTSE等)が公
議を行い、各事業部門にとって重要なサステ
理念・2030年ビジョンとの一貫性を考慮した
表する評価項目を参考に、重要課題の候補と
ナビリティ要素、
リスク・機会の抽出、および
項目の絞り込み、具体的な指標への落とし込
なるキーワードをリストアップ
重要度評価を実施
み等を実施し、
「重要課題(マテリアリティ)」
を特定
また、上記を経て特定された重要課題(マテリアリティ)
は、
サステナビリティ委員会お
よび正副委員長会議にて、定期的に取り組みの進捗を確認し、経営環境の変化に応じた
見直し等の審議を行っています。また、審議の内容は取締役会にも定期的に報告し、
取締役会の管理・監督を受けることとしています。
12
Chapter 1
Chapter 2
Chapter 3
Chapter 4
What is KONOIKE
Where we go
How we do
Data
KONOIKE GROUP Integrated Report 2026
2026年3月期重要課題(マテリアリティ)指標実績
分類
重要課題
安全・品質
人と絆を
大切にする
お客さまとの信頼関係の基盤
安定的な生産・流通・サービス提供プロセスを下支え
する
「安全・品質」
の維持・向上
人
「従業員とその家族の幸せ」
の追求
(人権・ダイバーシティ、当社グループ事業の根幹にある「人」に関し、多様な
人材の採用・登用、処遇改善、職場環境改善、教育・
人的資本開発)
学習機会の提供
パートナーシップ・
地域との共存
社会の基盤を
革新し、
新たな価値を
創造する
主な取り組み
社会課題解決に
貢献する
サービスの提供
技術革新・DX
140年以上の歴史を支える
「絆」
お客さまや取引先との協働、適正な取引関係を通じ
た新たな価値創造、持続可能なサービス提供体制
の維持・構築
● 地域貢献活動
●
グローバルな社会基盤の革新
自動化・機械化や他社との協業を通じた取り組みによ
る人手不足の解決への貢献
● 当社グループの技術・
ノウハウの活用による海外のイ
ンフラ整備・経済成長への貢献
●
「技術で、人が、高みを目指す」
の具現化
●
●
●
新技術を活用した新規ソリューション・サービスの開発
高付加価値物流サービス
新技術を活用した教育・労働負荷軽減
指標
休業度数率
(件/100万h)
労災度数率
(件/100万h)
自動車事故率
(件/100万km)
お客さまからの表彰件数
安定的な人材の採用
● 新卒
・キャリア採用人数/年
● 外国人労働者(特定技能)期末在籍者数
従業員の処遇改善
従業員研修費用
従業員研修時間
女性管理職比率
障がい者雇用率
男性育児休暇取得率
ウェルビーイング改善※1
● サーベイスコア
(良好度)
● サーベイスコア
(注意度)
● サーベイスコア
(モラール・組織の状態)
人権DDサーベイの実施
一次協力会社評価に基づく訪問社数
単価改定・契約見直しに伴う協力会社への還元額
各事業所における社会貢献活動実績
● 活動件数
(件)
● 活動工数
(人時)
自治体との災害関連協定締結件数
海外事業売上高・営業利益
(億円)
海外インフラプロジェクトへの参画件数
グローバル人材育成プログラムの受講人数
(累計)
新統合物流システム展開拠点数
生成AIを活用した業務改革数
現場への技術導入実績件数
現場への技術導入に向けたPoC件数
鴻池技術研究所イノベーションセンター(技研IC)での
技術検証件数
技術資本ライブラリ登録数
25/3期実績
26/3期実績
0.24
2.22
0.37
145件
0.31
2.84
0.41
98件
0.17
1.37
0.11
‑
107・471人/年
234人
‑
6.6億円
20.2時間/人
4.2%
2.60%
70.5%
119・499人/年
304人
26.2億円
7.7億円
19.3時間/人
4.8%
2.52%
96.4%
190・‑人/年
600人
200億円以上
(3ヵ年)
7.1億円
20.5時間/人
5.9%
2.75%
100.0%
4.11
3.23
4.31
‑
460社
15.5億円
4.12
3.25
4.29
4.30
522社
23.4億円
4.16
3.21
4.75
‑
288件
1,192人時
15件
274件
1,678人時
18件
‑
‑
‑
517億円
18億円
19件
27人
6/45拠点
‑
24件
38件
554億円
27億円
23件
69人
14/45拠点
7件
20件
44件
780億円
33億円
‑
128人
38/45拠点
ユースケース2件/年
45件
68件
28/3期目標
‑
‑
9件
13件
18件
779件
959件
‑
35.2%
30.7%
28.0%
20%
744人
7,930人
100%
‑
‑
脱炭素・循環型社会への移行・適応
気候変動
事業活動の基盤
ガバナンス・
コンプライアンス
●
省エネ・省資源、新技術導入によるCO2削減業務効率化を
通じた排出原単位削減
● 低炭素輸送・
モーダルシフトの取り組み
CO2排出量削減率
(19/3期比)
企業価値向上に資するガバナンス・
コンプライアンス体制の整備
取締役会の実効性向上支援における諸施策実施率
コンプライアンス関連研修の受講人数
鴻池手帳/経営品質宣言カタリバ※2参加人数
「公明正大」
な企業風土の確立
※1 ウェルビーイング改善
パーソル総合研究所によるウェルビーイングサーベイのスコア
サーベイスコアはパーソル社の全国平均に対する7段階評価で測定した当社スコアの平均値
・良好度:社員のはたらく幸せ実感(高数値ほど良好)
・注意度:社員のはたらく不幸せ実感(低数値ほど良好)
・モラール:当社の組織の状態(集団の士気)
(高数値ほど良好)
取り組みの推進
(進捗管理)
261人
‑
※2 鴻池手帳/経営品質宣言カタリバ
当社グループにおいて、従業員が少人数のグループで集まって互いの意見を語り合う場(ワークショップ)
を指す呼称
13
Chapter 1
Chapter 2
Chapter 3
Chapter 4
What is KONOIKE
Where we go
How we do
Data
KONOIKE GROUP Integrated Report 2026
中期経営計画2027
KONOIKEグループでは、2030年ビジョンに掲げる
「技術で、人が、高みを目指す」
の
推進にあたっては、
「事業戦略」
「財務・資本政策」
「経営基盤強化」
の3項目を重点領域と
実現に向けた具体的な道筋として、2026年3月期から2028年3月期を対象とする
「中期
して定めました。
これらを相互に連動させながら事業の成長力を高めるとともに、将来
経営計画2027」を策定しました。本計画では「成長投資と人・技術・ICTへの基盤投資
にわたる競争力の確保と持続的な企業価値の向上を目指し、各種施策を着実に進めて
で、従業員の幸せと企業価値の最大化を実現する」
ことをテーマとし、中期経営計画の
います。
テーマ
成長投資と人・技術・ICTへの基盤投資で、
従業員の幸せと企業価値の最大化を実現する
海外事業
非財務目標
❷ 国内事業の成長加速
注力地域(インド、北中米)
の成長加速
サービス分野(メディカル・空港)
の強化
複合ソリューション含む物流3領域の戦略
(一般・定温・戦略アカウント物流)
●
●
Ⅰ
事業戦略
P24
財務目標
国内事業
❶ 海外事業拡大
●
経営指標(2028年3月期)
売上高
既存事業分野での保全/メンテナンス領域の拡大
KOMBO※活動による生産性向上と事業モデル変革
● 事業継続性評価による収益構造の変革
億円
260
億円
人
●
●
Ⅱ
財務・資本政策
P47
Ⅲ
経営基盤強化
営業利益率
「財務安定性・成長投資の確保」
と
「株主還元の充実」
❶ 人材戦略の強化
❷ 技術・ICT戦略の強化
P49
※KOMBO:KONOIKE advanced proposal by the COMBO of solution Know-how and new technology
❸ 内部統制の強化
環境※2
CO2
排出量
28
%削減
(2019年3月期比)
営業利益
❸ 事業構造の改革
4,100
ROE
海外営業
利益※1
6.3
%
10
%以上
33
億円
技術
経営戦略に基づく
人材の確保・育成の推進
従業員の
ウェルビーイング向上
技術革新・DXによる
自動化・省力化
労働環境改善による
「安全」
の絶えざる追求
※1 海外営業利益=海外拠点営業利益ー本社費用賦課分
※2 対象範囲は単体および国内連結会社の
エネルギー起源Scope1,2
14
Chapter 1
Chapter 2
Chapter 3
Chapter 4
What is KONOIKE
Where we go
How we do
Data
KONOIKE GROUP Integrated Report 2026
中期経営計画2027
初年度(2026年3月期)
の振り返り
初年度は、米国の輸入関税引き上げや日中関係の悪化、
中東情勢の緊迫化など、先行き不透明な事業環境のもとでのスタートとなりました。
そのなかで、
インド子会社の連結化
効果に加え、
国内事業における取扱量の増加などが業績を押し上げ、
営業利益は227億円、
営業利益率6.4%となり、
過去最高益を更新しました。
非財務目標である
「環境」
「人」
「技術」
についても、
サステナビリティ委員会、人材戦略委員会、技術戦略委員会が中心となって施策を推進し、一定の成果につなげることができ
ました。
今後も、
KPIに基づく進捗管理とモニタリングを通じて、取り組みの実効性を高めていきます。
中計達成に向けた具体的な取り組み
中期経営計画2027では、
「海外事業拡大」
「国内事業の成長加速」
「事業構造の改革」
を事業戦略の重点領域としています。
1年目の成果を踏まえ、各領域で取り組む施策を具体化し、個別事業での実行と成果の横展開を進めます。
❶ 海外事業拡大
P16~
❷ 国内事業の成長加速
P38~
❸ 事業構造の改革
P29~
今後大きな経済成長が期待されるインドと、収益性の高い冷
中長期的な成長が期待できるメディカル事業・空港事業を成
凍冷蔵倉庫事業などを行う北中米を注力地域として成長投
長のけん引役と位置付ける。
また物流においても経営資源の
化を目指す。
また生産性向上を目指しKOMBO活動を実践し
資を継続する。
最適化を図り、
お客さまの価値創造パートナーを目指す。
ていくほか、収益構造も引き続き変革を行う。
海外営業利益
サービス分野(メディカル・空港)売上高
【保全 /メンテナンス】
● 製鉄所構外の大型配管工事、
建築設備・エネルギー関連工事、
保全・メンテナンス領域を拡大する
2026年3月期27億円
2028年3月期(計画)
33億円
【インド】
● インドの鉄鋼スラグ処理事業では、
増産・生産性向上を進める
● 鉄道コンテナ輸送と自動車鉄道輸送で増強した輸送能力の
稼働率向上と収益安定化を進める
【北中米】
● 冷凍冷蔵倉庫の増設・新設を進め、
保管能力と複合サービス
を拡大する
● パッケージングデザイン事業では、
自動車関連顧客を開拓する
2026年3月期456億円
2028年3月期(計画)
580億円
【サービス分野】
● メディカル事業では、
病院事業で滅菌サービスの高度化推進を、
洗浄・物流センター事業で立地を活かした顧客層の拡大を狙う
● 空港は、
人員の採用・育成に力を入れるとともに、新規路線・
航空会社の業務獲得、
周辺サービスを拡大する
【物流】
● 一般・定温・戦略アカウントの3領域に分け、
組織再編と経営
資源の最適化を進める
保全やメンテナンスの機能強化により、既存事業の付加価値
【KOMBO活動】
● 現場のノウハウと技術・ICTを組み合わせ、
新たなサービスの
創出を目指す
【事業継続性評価】
● 事業継続性審議会のもと、
低収益拠点の継続・再建・撤退の
判断を行い、経営資源の最適化に着手
15
Chapter 1
Chapter 2
Chapter 3
Chapter 4
What is KONOIKE
Where we go
How we do
Data
KONOIKE GROUP Integrated Report 2026
INDIA
インド事業
特集
「第二の創業地」インドで拓く、
KONOIKEグループの成長戦略
当社は、成長著しいインドを
「第二の創業地」
と位置づけ、中期経営計画の柱の一つである
「海外事業の成長加速」を担う重要市場の一つと捉えています。
本特集では、
インド進出のあゆみをたどりながら、各事業の現在地と今後の成長可能性をご紹介します。
現地のポテンシャルに着目し、
段階的に事業領域を拡大
開始
インド進出のあゆみ
鉄鋼事業
生活関連事業
はGDP規模で世界第3位の経済大国になると見込まれています。粗鋼や自動車
の生産規模も世界有数で、さまざまな産業が成長を続けています。
鉄道輸送事業
当社はインドで、メディカル、鉄道輸送、鉄鋼、エンジニアリングなど幅広い
メディカル事業
事業を展開しています。現地の経済成長を取り込みながら、売上高を2026年3
伸ばす計画です。
事業拡大
エンジニアリング事業
インドは14億人超の人口を擁し、世界で最も人口の多い国です。2030年代に
月期の155億円から、2028年3月期に210億円、2031年3月期に300億円まで
16
フォワーディング事業
2007年
インド事業の検討開始
事業化調査
(F/S)
2012年
2013年
2016年
2024年
2025年
2026年
INDIA
Chapter 1
Chapter 2
Chapter 3
Chapter 4
What is KONOIKE
Where we go
How we do
Data
KONOIKE GROUP Integrated Report 2026
インド事業特集
01 全体概要
Q
これまでのインド進出のあゆみについて教えてください
A
1993年に日系物流企業として初めて進出したベトナムで、私は先兵として
駐在しました。2007年には次なる成長市場としてインドに狙いを定め、事業
進出の土台づくりに携わりました。その後、各事業本部がビジネス機会を模
索し、2012年には国際統括本部がフォワーディング事業を、2013年にはメ
ディカル本部が医療データベース事業を立ち上げるなど、複数の事業を展開
してきました。
インドでは人口や経済成長の可能性がある一方で、制度、政治、インフラ
などの複雑な事業環境を見極める必要があり、現地の市場や商習慣を理解
し、事業を推進できる人材の確保が課題でした。そこで現在は、KIPL ※がイ
営業本部副本部長
ンド事業を横断的に統括し、現地視察や事業立ち上げをサポートしていま
インド統括/Konoike India Pvt. Ltd.
す。鉄鋼、生活産業、エンジニアリングなど、各事業本部による事業展開を
Managing Director
既に開始しています。
蓮實一洋
※KIPL: Konoike India Pvt. Ltd.
Q
これからのインド展開について教えてください
日本でのビジネスモデル
請負
当社はインドを「第二の創業地」と位置づけ、国内で培ってきた事業運営の
知見や技術・ノウハウを現地に展開し、自律的に成長できる事業へと育てるこ
とを目指しています。
「来たれ、インドに」の精神のもと、今後は空港や食品な
どの、国内事業のうち未進出領域での事業化も図っていきます。
また、事業本部の枠を超えたインド発の新たな取り組みとして、日本語・技
鉄鋼
複合ソリューション事業
A
能教育を行い、育成した人材を日本に受け入れていきます。そして日本で学ん
と人の両面で現地社会に根ざしながら、インドの成長とあゆみをともにし、関
国際物流
係するすべての人々の幸せに貢献することが私の使命だと思っています。
エンジニアリング
物流
インドでのビジネスモデル
エンジ/メンテ
鉄鋼
P18〜
国際
P20〜
生活産業(食品)
生活産業(生活)
メディカル
食品プロダクツ
メディカル
エンジニアリング
生活産業(生活)
P22〜
メディカル
P23〜
空港
国内物流
だ知識・経験をインドの拠点でも発揮していただきたいと考えています。事業
17
生活産業(物流)
空港
生活産業(定温)
国際
● インドで展開済みの事業
● インドで展開を狙う事業
● 日本のみ
食品プロダクツ
INDIA
Chapter 1
Chapter 2
Chapter 3
Chapter 4
What is KONOIKE
Where we go
How we do
Data
02 鉄鋼事業
KONOIKE GROUP Integrated Report 2026
18
インド事業特集
STEEL BUSINESS
持続可能な製鉄プロセスを、
日本の現場力で支える
主な事業の内容
・国営製鉄所8拠点で事業を展開する、
業界有数の事業基盤
資源循環の中核として、
持続可能な製鉄プロセスの実現に貢献
・日本で培った安全・品質・生産性向上のノウハウを現場へ移植
製鉄過程で 発生する高炉・製鋼スラグやスクラップを回
〈鉄鋼事業のポイント 〉
・民間製鉄所、鉱山、設備メンテナンスへ広がる大きな成長余地
収・加工し、セメント原料や製鉄用材料として再資源化する業
務を担っています。資源の有効活用を促進し、持続可能な製
鉄プロセスの実現に向けた重要な役割を果たしています。
インドにおける鉄鋼事業の強み
鉄鋼事業におけるインド進出のあゆみ
1.国営製鉄所内の強固な事業基盤
日本企業初の
国営企業買収で基盤を確立
全土の国営製鉄所8拠点でスラグ・スクラップ処理
を受託し、約2,500名規模の現場体制を構築。長年の
操業実績とお客さまの信頼が、新たな業務を広げる
基盤となっています。
2.日本で培った安全・品質の現場力
日本の製鉄所内請負で 培った安全管理、設備保
デリー
2025年1月、インド国営企業FSNLの
民営化入札で日本企業として初めて落札
し、完全子会社化。約40年にわたり鉄鋼
業を支えた技術・人材・顧客基盤を獲得
ムンバイ
しました。
ベンガルール
全、作業効率化のノウハウを現場へ移植。設備投資と
現場改善を重ね、高品質で安定した操業と収益性の
向上も実現しています。
FSNL の主要事業拠点
INDIA
Chapter 1
Chapter 2
Chapter 3
Chapter 4
What is KONOIKE
Where we go
How we do
Data
KONOIKE GROUP Integrated Report 2026
インド事業特集
02 鉄鋼事業
IT化と設備投資による収益力の向上
19
高成長を続ける民間製鉄所への展開
TOPICS
買収後の経営統合プロセス(PMI)では、事務のIT化を重点的に進め、
増産や新設計画が続く民間製鉄所への拡販を進めています。
毎月決算による迅速できめ細かなマネジメント体制を構築しました。現場
既に新規案件を受注し、2027年1月からの稼働を予定。日本国内で
への積極的な設備投資によって作業効率も高め、2026年3月期は当初
取引のある製鉄メーカーとの連携も活かし、スラグ・スクラップ処
計画を大きく上回る業績を達成。買収後の早い段階から、収益改善の
理やO&M(オペレーション&メンテナンス)など、新たな案件の獲
成果が表れています。
得を目指します。
今後の事業方針
日本の現場力で、成長市場の中核を担う
当社の取引先である国営製鉄所の粗鋼生産量は、インド市場全体の約20%にとどまり、
石炭の選別・破砕、運搬、設備メンテナンスへの参入です。スケールが大きく継続性の高い
事業拡大の余地は大きく残されています。この成長を取り込むため、国営製鉄所に依存
鉱山業務を、新たな安定収益基盤へ育てます。第三に、既存顧客である国営製鉄所の
した収益構造から脱し、三つの柱で事業を展開します。第一に、増産や新設計画が相次ぐ
深耕です。作業効率を高めながら、他工程や設備メンテナンスへと業務範囲を広げます。
民間製鉄所への展開です。日本国内で取引のある製鉄メーカーとの連携を軸に、スラグ・
日本の請負事業で培った技術と現場力を移植し、三つの柱をバランスよく育てることで、
スクラップ処理に加え、O&M業務の受注を目指します。第二に、鉱山における鉄鉱石や
インド鉄鋼市場の拡大を持続的な利益成長につなげていきます。
鴻池とFSNLの経験を組み合わせ、単なる作業請負にとどまらない価値を提供
インドでは街の至るところで建設工事が進み、製鉄所でも新高炉の建設や既存設備の能力増強が相次ぐなど、旺盛な需要と成長
の勢いを日々実感しています。こうしたなか、鉄鋼生産の拡大に伴い、スラグ・スクラップ処理の重要性は一段と高まっています。
現地のお客さまからは、効率性に加え、環境配慮や資源リサイクルの観点から、より高度で安定した作業への期待が寄せられてお
り、鴻池運輸が日本で培ってきた安全管理や操業、再資源化の知見への関心の高さを感じています。実際に現場では、操業の安定
やスラグからの金属回収率向上への期待の声もあり、こうした期待は今後の受注拡大にもつながると見ています。
FSNLが約40年にわたり培ってきた現地での操業経験や顧客基盤と、鴻池運輸が日本で培ってきた知見を組み合わせることで、
単なる作業請負にとどまらないサービスの提供が可能となり、インド事業が中長期的に大きく広がっていく可能性を感じています。
鉄鋼本部
児谷 さん
INDIA
Chapter 1
Chapter 2
Chapter 3
Chapter 4
What is KONOIKE
Where we go
How we do
Data
KONOIKE GROUP Integrated Report 2026
インド事業特集
03 鉄道事業
主な事業の内容
・西岸主要港と北インドを結ぶ、
1,300km規模の大量輸送網
・自社貨車21編成とカーキャリア45台による一貫輸送体制
・自動車・内国貨物・新規ルートへ広がる輸送需要を獲得
KONOIKEグループで自社完結する
国際複合一貫輸送を提供
西岸主要3港とデリー近郊を結ぶ鉄道コンテナ輸送(CTO)と、
自動車メーカーの工場から各地の消費地へ完成車を運ぶ鉄道自動
車完成車輸送(AFTO)を展開。広大なインドにおける長距離・大
量輸送のニーズに、環境負荷の低い鉄道輸送で応えています。
インドにおける鉄道事業の強み
鉄道事業におけるインド進出のあゆみ
- 現地ネットワークを活かした強固な連携
現地有力パートナーとの合弁設立で事業参入
民間初のインランドコンテナデポを運営し、インド国鉄や税関と強いつな
2016年10月、有力企
がりを持つACTL社との合弁事業により、広大なインド市場における確実で
業 AC TL社と合弁会社
安定した鉄道輸送ネットワークを構築しています。
JKTIを設立。AC TL社
- 鉄道・陸送を融合した一貫物流体制
鉄道による長距離・大量輸送に、自社保有のカーキャリア45台などによる
陸送を組み合わせ、出発地から到着地までをカバー。
「ファーストマイルから
ラストマイルまで」を自社で完結する高品質な一貫輸送体制が強みです。
の事業基盤と当社の物
流ノウハウを融合し、翌
年に鉄道コンテナ輸送
を開始しました。
RAILWAY BUSINESS
ファーストマイルからラストマイルまで、
インドの長距離輸送を担う
〈鉄道事業のポイント 〉
20
INDIA
Chapter 1
Chapter 2
Chapter 3
Chapter 4
What is KONOIKE
Where we go
How we do
Data
KONOIKE GROUP Integrated Report 2026
インド事業特集
03 鉄道事業
自社貨車増強による収益力の飛躍的向上
インド全土を網羅する完成車輸送網の拡大
TOPICS
コンテナ輸送(CTO)では、自社貨車
自動車完成車輸送(AFTO)では、自
を13編成に増強し、他社との共同運行か
社貨車8編成を保有し、1編成で270〜
ら単独運行への移行を実現しました。さ
300台、月間平均約9,300台を輸送して
らに、貨物専用鉄道(DFC)への接続と
います。北部デリーから南部・西部を結
コンテナのダブルスタック(2段積み)化
ぶ長距離ルートなど、自動車メーカーの
により、1編成で最大180TEUの大量輸
旺盛なニーズに応えてネットワークを拡
送が可能に。輸送効率と収益力を大きく
大。復荷貨物の獲得によって収益性も向
高めています。
上しています。
今後の事業方針
内国貨物獲得と
大型車対応で高収益化を実現
自動車工場
各ディーラー
直近の貨車投資で強化した収益基盤を活かし、さら
なる事業拡大を進めます。コンテナ輸送(CTO)では、
カーキャリア
輸送
現在の輸出入貨物中心の取り扱いから領域を広げ、空
自社カーキャリア 45 台所有
コンテナの自社調達を進めることで、インド国内を循
環する内国貨物の往復輸送獲得に注力します。
自動車完成車輸送(AFTO)では、所得水準の向上
出発駅
鉄道輸送
到着駅
に伴い、自動車需要が二輪から四輪へ、小型車から大
型乗用車へとシフトする変化を成長機会と捉えます。
大型乗用車を効率よく積載できる背高貨車を調達し、
高付加価値な大型車輸送の商圏を確保します。これら
の施策を通じて収益力をさらに高め、2031年3月期に
は営業利益率8〜10%の高収益モデルを目指します。
21
カーキャリア
輸送
カープール
自走搬入
●ラッシング
脱ラッシング
自走搬出
●カープール
ストックヤード
●
●
●
●
●
●
ファーストマイルからラストマイルまでの輸送をご提供
カープール
出荷
INDIA
Chapter 1
Chapter 2
Chapter 3
Chapter 4
What is KONOIKE
Where we go
How we do
Data
KONOIKE GROUP Integrated Report 2026
インド事業特集
04 都市ガス・エンジニアリング事業
CITY GAS ENGINEERING BUSINESS
運営・保全ノウハウと施工力で、
インドの大気汚染対策を支える
・政策の追い風を受ける都市ガス市場へ早期参入
〈都市ガス・エンジニアリング事業のポイント 〉
22
・Vertex社への出資により、設計から施工・保全までを一貫対応
・案件情報への早期アクセスと施工力を組み合わせ、継続受注へ
事業内容
運ぶ
都市ガスの普及を、現場で支える
つくる・
切り替える
守る
大気汚染対策を背景に、インド政府は石炭・石油から天然ガスへの燃料転換を推進
しています。当社は2024年、日系4社で都市ガス事業者Think Gas社へ出資し、事業
基盤を築きました。CNG(圧縮天然ガス)ステーション向けには、高圧容器をトラック
で運ぶカスケード輸送のトライアルを経て、本格稼働へ移行。都市ガスの普及に伴い
ガス導管の敷設
CNGの
カスケード輸送
継続的に生まれるガス導管の敷設、産業用燃料転換工事、供給設備の保全など、周辺
需要の獲得を進めています。
今後の事業方針
継続的なインフラ需要を取り込み、案件獲得から収益化の好循環へ
2026年1月、設計から試運転までを担うVertex社の株式49%を取得し、インドの施工力を強化しました。Think
Gas社との連携で産業向けの燃料転換案件へ早期にアクセスし、Vertex社の技術力と当社の品質・安全管理を組み
合わせて受注へつなげます。その実績を次の配管・設備工事や保全へ展開し、案件獲得から収益化、さらなる受注
へ続く好循環を構築。将来は製鉄所や日系企業の設備工事にも領域を広げ、成長基盤を確立します。
供給設備の保全
産業用
燃料転換工事
INDIA
Chapter 1
Chapter 2
Chapter 3
Chapter 4
What is KONOIKE
Where we go
How we do
Data
KONOIKE GROUP Integrated Report 2026
23
インド事業特集
05 メディカル事業
急成長する医療市場で、
医療インフラの安全性向上に貢献
〈 メディカル事業のポイント 〉
・医療器材・病院・医師の独自データベースで市場を可視化
・院内7病院、院外1拠点を軸とする滅菌サービス体制
事業内容・今後の方針
データベース構築から滅菌サービスまで、安全な医療環境を支える
ループ化し、日本で培った滅菌ノウハウを移植しました。院外滅菌センターを核に同モデルを主要5都市へ広げ、安全な医療環境を支えます。
グループの技術力と蓄積された現地の知見で、より安全なインドの未来を築く
「वस ध
ु व
ै क टु म
ु ्बकम ्(The world is one family.)」インドに古くから伝わるこの思想は、KONOIKEグ
ループとSPD Indiaの協業を象徴しています。互いの文化や伝統は異なっていても、医療の質を高め、患者の命
を守りたいという想いは一つです。
インドの人口は14億人を超え医療ニーズが急速に高まる中、院内感染予防への意識も高まっているため、
安全で標準化された滅菌サービスへの需要は大きく伸びると感じています。SPD Indiaが築いた病院との信
頼関係や現場力に、KONOIKEグループが日本で培った滅菌技術、品質管理、人材教育のノウハウを組み合
わせることが強みです。私たちの使命は、滅菌サービスの提供にとどまりません。医療従事者への啓発やベ
ストプラクティスの推進を通じて、感染予防の文化を根付かせ、より安全なインドの未来を築いていきます。
SPD India Healthcare Pvt. Ltd.
Hiteshさん
MEDICAL BUSINESS
人口増加と所得向上に伴い、医療ニーズは急速に拡大しています。Carna社では医療データベースや進出支援を展開。2024年にSPD India社をグ
Chapter 1
Chapter 2
Chapter 3
Chapter 4
What is KONOIKE
Where we go
How we do
Data
KONOIKE GROUP Integrated Report 2026
Ⅰ. 事業戦略
KONOIKEグループでは“期待を超えなければ、仕事ではない”という約束を掲げてい
ます。
これは、
ただ目の前の仕事をこなすだけでなく、
その仕事を通じてお客さま、
ひいて
値を生み出してきました。
この姿勢・考え方は時代が移り、社会が変わっても変化する
ことはありません。
は社会に何か一つでもこれまでにない新しい価値を提供したいという私たちの姿勢で
これからもお客さまのニーズに合わせて、請負・物流・エンジニアリング/メンテナンス
す。これまでも“運輸”を超えるサービスを提供するなかでお客さまや社会の潜在的な
のサービスを組み合わせることにより、KONOIKEグループ独自の幅広いソリューショ
ニーズを捉え、
複合的にソリューションを提供することで社会の基盤を革新し、新しい価
ンを提供していきます。
売上高構成比(分野別)
売上高構成比(地域別)
鉄鋼本部
国際統括本部
576.11億円(16%)
670.28億円(19%)
中国
ASEAN
116.20億円
161.52億円
インド
155.26億円
生活産業
(定温)
213.25億円(6%)
生活産業
(物流)
351.87億円(10%)
空港本部
国内売上
エンジニアリング本部
総売上
3,555
億円
(2026年3月期)
141.79億円(4%)
生活産業
(食品)
363.60億円(10%)
生活産業
(生活)
237.22億円(7%)
北中米
121.05億円
85.4%
海外売上
14.6%
日本
3,109.02億円
303.05億円(9%)
食品プロダクツ本部
メディカル本部
153.17億円(4%)
544.87億円(15%)
※地域別売上高には内部取引消去等による調整額が含まれます。
当該調整額は、国内△70.94億円、海外△36.57億円であり、
本グラフでは表示を省略しています。
24
Chapter 1
Chapter 2
Chapter 3
Chapter 4
What is KONOIKE
Where we go
How we do
Data
KONOIKE GROUP Integrated Report 2026
業態比率イメージ
(売上)
業態
事業分野
複合ソリューション事業
国内物流事業
国際物流事業
請負
物流
エンジニアリング
メンテナンス
●
●
●
鉄鋼
P27
エンジニアリング
P30
生活産業(食品)
P33
●
●
●
生活産業(生活)
P33
●
●
●
食品プロダクツ
P36
●
●
●
メディカル
P39
●
●
空港
P42
●
生活産業(物流)
P33
●
生活産業(定温)
P33
●
国際
P45
請負
エンジニアリング
メンテナンス
物流
●
●
●
●
●
事業ポートフォリオの状況(分野別)
ROIC
● 複合ソリューション事業
● 国内物流事業
食品プロダクツ
生活産業(食品)
空港
● 国際物流事業
鉄鋼
エンジニアリング
全社
メディカル
国際
※円の大きさは売上高の大きさを表す
売上高成長率は該当年度の過去3年を平均して算出
生活産業(物流)
生活産業(定温)
生活産業(生活)
売上高成長率
25
Chapter 1
Chapter 2
Chapter 3
Chapter 4
What is KONOIKE
Where we go
How we do
Data
鉄鋼本部
KONOIKE GROUP Integrated Report 2026
国内事業の転換とグローバル展開による持続的成長
自動化・高付加価値化で競争力強化と人材課題に対応
複合ソリューション事業
鉄鋼業務
ビジネスモデル・強み
大手鉄鋼メーカーの製造現場において、原材料工程から製品出荷工程までの一連業務を受託。
長年の現場密着型オペレーションを通じて、生産効率と品質向上に資する包括的支援体制を構築。
鉄鋼のサプライチェーンと当社の業務範囲
製鉄所
原材料工程
原料輸送
●
鉄鉱石、石炭などの原料ヤード整理
搬送機器(ベルトコンベア)の
保守とこぼれ落ちた原料の回収
●
●
原材料や溶融物の運搬
●
連続鋳造設備およびタンディッシュ整備
スクラップ、
製鋼スラグ、
地金(金属塊)の回収と輸送
バキューム車や高圧洗浄機を
使用した設備や周辺の清掃
付帯業務
構内輸送
●
●
倉庫・出荷工程
製品工程
製銑・製鋼工程
スラブ、
ブルーム、
ビレットの検査、
表面手入れ、
出荷管理
●
出荷輸送
●
圧延後の鉄鋼製品の管理
鋼板加工
(切断、研削、表面検査、矯正など)
●
クレーン運転
(天井クレーンなど)
鋼板(コイル)の梱包
●
クレーン運転
●
車両や船への積込み
●
鉄鋼製品の輸送
●
リサイクル業務
設備メンテナンス
●
●
製鉄所内の設備のメンテナンス業務、予防保全
●
製鉄過程で発生する副産物の再資源化
本部の強み
1
100余年にわたる製造現場での
経験を活かした現場遂行力
2
全国ネットワークによる
機動的なサービス提供力
3
お客さまニーズの変化に
応える柔軟な課題解決力
4
現場主導の改善文化による
持続的な価値創出力
26
Chapter 1
Chapter 2
Chapter 3
Chapter 4
What is KONOIKE
Where we go
How we do
Data
KONOIKE GROUP Integrated Report 2026
鉄鋼本部
市場環境予測
中期経営計画2027
日本とインドと世界の粗鋼生産量
戦略
出所:世界鉄鋼協会Webサイト
経済産業省「2030年度におけるエネルギー需給の見通し」
一般社団法人日本鉄鋼連盟「日本鉄鋼連盟長期温暖化対策ビジョン
『ゼロカーボンスチールへの挑戦』」
(百万トン)
日本
300
140.8
150
87.0
100
84.0
●
DXによる業務効率化と一人あたりの収益性向上を通じ、
労働力不足と収益力の課題を同時に解決
1年目の取り組み
250
149.4
国内市場の縮小を機に、海外事業(インド)
を軸に、
中長期的な収益基盤を確立
300.0
インド
200
●
2025年度の鉄鋼関連事業は、国内外で事業基盤の強化を進めた一年となりました。国内では鹿島地区における鉄源1系
165.0
80.6
90.0
±10.0
統休止など粗鋼生産減少の影響を受け、厳しい事業環境が続きましたが、現場改善や適正単価の収受を通じて収益確保に
努めました。一方、
インドでは
「スラグ・スクラップ処理会社」FSNL Private Ltd.を連結化し、
スラグ処理量の増加や生産性
向上により業績拡大を実現しました。
さらに、
日本で培った地金破砕設備「スチールバスター」
をFSNLへ導入し、安全性と
50
0
2023
(百万トン)
2,500
2,000
2024
2025
2030 (年度)
(見通し)
世界
1,904
1,885
1,850
作業効率の向上を実現するなど、国内の現場力・技術力を海外へ展開する取り組みを推進しました。国内外の知見を融合
することで、持続的な成長に向けた事業基盤の強化を着実に進めています。
2,100
1,500
成果(売上高・成長率)
1,000
500
0
売上高推移
2023
2024
2025
2030 (年度)
(見通し)
(百万円)
60,000
50,000
日本国内の粗鋼生産量は成長は望めず、今後は高付加価
40,000
値化にシフトしていきます。
これに対応すべく生産性や作
30,000
業品質の向上はより一層要求されます。一方、
インドでは
20,000
人口増加を背景に都市化やインフラ投資、
自動車・建設分
10,000
野の拡大が続いており、2030年に粗鋼生産能力3億トン
0
を目指すなど、
今後の成長市場として期待されています。
ROIC・売上高成長率の推移
57,611
51,530
52,385
ROIC
2026年3月期
2025年3月期
※円の大きさは売上高の大きさを表す
※売上高成長率は該当年度の過去3年を
平均して算出
2024年
3月期
2025年
3月期
2026年
3月期
売上高成長率
27
Chapter 1
Chapter 2
Chapter 3
Chapter 4
What is KONOIKE
Where we go
How we do
Data
KONOIKE GROUP Integrated Report 2026
鉄鋼本部
TOPICS
Steel Division
Tech TeamによるFSNL各拠点の
FSNL Private Ltd.(以下
「FSNL社」
)の完全子会社
現場調査と分析活動
容と作業量、設備・人員の配置状況と作業能率、各
化後、FSNL社全8拠点の現場での詳細な作業内
現場が抱える課題を現地で調査・分析すべく、Tech
Teamを結成しました。
Tech Teamは鹿島で長年、資源リサイクルとスラ
グ・スクラップ処理に携わってきた軍司、和歌山でス
ラグ処理に携わってきた児谷、インドの産業・工業
に精通したインド出身のボーサレの3人で活動して
います。
Tech Teamでの現場調査・分析は経営活動における
判断材料のひとつとなる重要なものです。書類上の
データだけでは実態はつかめません。現地へ赴き、
実際に動いてる現場を見て、担当者へヒアリングす
ることで実態をつかむことができます。調査におい
て言葉の壁による苦労や、作業管理の考え方や文
化・風土の違いに戸惑うこともありますが、
FSNL社の
方々とコミュニケーションを積極的に取り、
良い関係
性を築かせていただきながら日々活動しています。
Tech TeamとFSNL社のメンバー
28
Chapter 1
Chapter 2
Chapter 3
Chapter 4
What is KONOIKE
Where we go
How we do
Data
エンジニアリング本部
複合ソリューション事業
エンジニアリング業務
KONOIKE GROUP Integrated Report 2026
既存事業の収益力強化とつなげる力で
新規事業領域を拡大
~つなげる力で新しい流れを生み出す~
ビジネスモデル・強み
プラント施工・設備メンテナンス・電気計装・非破壊検査・技術者派遣等、多様なサービスを提供しています。
また、全国に製作工場を持つ拠点を有し、製作して~施工まで一式請負のソリューションを提供できる体制を実現しています。
全国各地の自社製作工場を拠点に
ソリューション提供できる
体制を実現
プラント工事、
メンテナンス等に
関わるサービスを幅広く提供
プラント系業務
土木・建築系業務(一部エリア)
機械器具設置工事
一般製缶・鋼構造物製作、据付
プラント配管工事
設備メンテナンス
機械整備
土木・建築・営繕工事
上下水道工事
自社製作工場
プラント機械・鋼構造物・塔槽類・
配管・ダクト…等
検査・測定業務
電気系業務
非破壊検査
(RT・UT・MT・PT・デジタルX線)
環境測定(騒音)
資格者派遣
電気・計装設計
技術者派遣
遠隔監視業務
富山県射水市
茨城県鹿嶋市
愛知県名古屋市
和歌山県和歌山市
発電設備
上下水道施設
福岡県北九州市
本部の強み
1
施工管理技士から熟練技能者まで、幅広い人材をそろえ、多様なニー
ズにお応えします。品質・安全・効率を徹底追求し、現場ごとの最適な
施工方法を提案。柔軟な対応力と確かな技術で、お客さまの期待を
超えるサービスを提供します。
2
全国各地に拠点を構え、多く
の協力会社と強固なネット
ワークを構築しております。
3
設計施工だけでなく、施工後
のメンテナンスを組み合わせ
たワンストップのサービスを
提供しています。
29
Chapter 1
Chapter 2
Chapter 3
Chapter 4
What is KONOIKE
Where we go
How we do
Data
KONOIKE GROUP Integrated Report 2026
エンジニアリング本部
市場環境予測
中期経営計画2027
名目民間企業設備投資額の推移
戦略
(兆円)
●
既存事業領域での存在価値を高め、
サービスの領域を拡大
(工事一括管理・案件拡充等)
●
リピーターのお客さまとの関係性を強化し、継続的な受注を獲得
(元請工事・深耕化・社内協業等)
●
リソースの拡充による顧客対応力の強化と新たな事業機会の創出
(M&A・新規取引先および協業先の拡大等)
150
126.8
120
1年目の取り組み
国内粗鋼生産量の減少による影響を受けるものの、
当本部が目標としていた❶元請化によるエンジニアリングフィーの獲
得❷受注案件の大型化による管理効率改善により増益で推移、損益だけであれば2030年ビジョンの目標をクリアする結
90
果となった。一方で技術者の採用環境については厳しさが増しており、
キャリア採用・社内人材のスキルチェンジを強力に
出所:内閣府
「四半期別GDP速報
(2025年10-12月期2次速報値)
:
実額-名目季節調整系列」
(2026年3月)
60
推進するとともに、M&Aによる体制強化を図る。
'10 '11 '12 '13 '14 '15 '16 '17 '18 '19 '20 '21 '22 '23 '24 '25(年)
国内の設備投資は回復基調が続いており、その影響を受
けてプラント工事・メンテナンス市場およびエンジニアリ
ング業界も拡大傾向にあります。
この堅調な市場環境を
成長機会と捉え、既存設備の維持・更新に加え、EPC(工
事一括管理・元請工事)を含むトータルサービスを展開
成果(売上高・成長率)
売上高推移
(百万円)
12,000
など新たな需要への対応を強化しています。
また、既存顧
9,000
客との信頼関係を深めながら、元請としての提案力や社
6,000
内連携を強化し、継続的な受注拡大と顧客価値の向上を
通じて、持続的な成長、競争力の強化および収益機会の拡
大を目指します。
14,853
15,000
し、再生可能エネルギーや脱炭素関連、原子力設備分野
ROIC・売上高成長率の推移
14,179
12,447
ROIC
2026年3月期
2025年3月期
※円の大きさは売上高の大きさを表す
※売上高成長率は該当年度の過去3年を平均して算出
3,000
0
2024年
3月期
2025年
3月期
2026年
3月期
売上高成長率
30
Chapter 1
Chapter 2
Chapter 3
Chapter 4
What is KONOIKE
Where we go
How we do
Data
KONOIKE GROUP Integrated Report 2026
エンジニアリング本部
TOPICS
Engineering Division
元請施工への取り組み
当社エンジニアリング部門は製鉄所構内では元請
事業者として既に多くの実績を積み重ねてきまし
たが、構外では一次下請案件が中心であり、八幡営
業所としては元請事業者への成長を目標としてき
ました。元請事業者としての受注拡大を目指し、新
規顧客の開拓や提案活動の強化を進めてまいりま
したが、
4月の事業連携推進部との統合により営業
活動を強化、念願かなって某リゾート開発案件の一
部工事を元請として受注することができました。詳
細設計は当社の専門部門が担当し、施工管理につ
いては当営業所が担当する体制のもと、現在は施工
計画の作成など準備を進めています。本案件は、構
外における元請事業者への第一歩となる重要なプ
ロジェクトです。施工を通じて得られた知見や実績
を基盤に、
さらなる受注機会の創出と事業領域の拡
大を図ることで、本部全体の競争力向上につなげて
いきます。
八幡営業所のメンバー
31
Chapter 1
Chapter 2
Chapter 3
Chapter 4
What is KONOIKE
Where we go
How we do
Data
生活産業本部
複合ソリューション事業
国内物流事業
KONOIKE GROUP Integrated Report 2026
複合ソリューション事業の領域拡大に果敢に
チャレンジし、新たな価値創出を目指す
食品業務、生活業務
物流業務、定温業務
ビジネスモデル・強み
さまざまな産業分野のお客さまの製造請負、保全工事、調達から市場までの物流サービスを提供。空調機改装部門ではK-MVS*による
独自のサービスを提供しています。定温物流では、全国配送ネットワークを構築しお客さまのニーズに応えています。
*K-MVS(Konoike-Multi Vendor System)
:
空調機改装のテクノロジーとロジスティクスを掛け合わせた
KONOIKEグループ独自のサービス
普遍的なビジネスモデル
原材料
半製品
当本部の請負領域
調達物流(保管・輸配送)
製品の生産
製品物流(保管・輸配送)
消費者
お客さま
お客さまの輸送・生産(工事・保全含む)
に関わる業務を受託
空調・エネルギー部門
定温物流部門
業務用空調機の改装・塗装・点検・部品供給、太陽
光発電等のPPA事業を主体とした再生可能エネ
ルギーサービス
自社およびパートナー会社の全国16拠点
による定温ネットワーク展開、冷凍・冷蔵
品の配送業務
食品・構内部門
一般物流・流通部門
食品メーカー、住設機器・化学・ガス等の工場内に
おける製造請負・資材供給・物流・設備保全・高級
輸入自動車新車整備センターにおける点検・整備
およびメーカー・ディーラーへのメカニックサポート
量販店・CVSセンター運営・衣料品・日用品・
雑貨等の保管・配送、産業用ガス等のロー
リー輸送
本部の強み
1
K-MVSを活用した空調施工の省力化・効
率化:各メーカー部材の集約・プレ加工によ
り、建設現場での輸送・荷受け・組立の工数
を減らせます。
2
国内11の自社冷凍冷蔵センターに加え、乳
業を中心とした冷蔵車両を保有する8拠点
により、冷凍冷蔵食品の共同配送サービス
を国内に展開しております。
3
小型トラックから大型・トレーラー・特殊
車両(ローリー、
ユニック、
セルフローダー
等)
を国内に約1,000台保有。多種多様な
輸配送に加え、設置・据付などのお客さま
ニーズにも対応しております。
32
Chapter 1
Chapter 2
Chapter 3
Chapter 4
What is KONOIKE
Where we go
How we do
Data
KONOIKE GROUP Integrated Report 2026
生活産業本部
市場環境予測
中期経営計画2027
産業別就業者数の予測
戦略
出所:ヒューマンリソシア
「建設技術者・技能工の2030年の未来予測(2023年版)」
●
(人)
2,700,000
建設技能工の需要数(推計)
必要人数
必要人数
2,600,000 2,485,071人
2,500,000
2020年
37,591人
不足
2,400,000
建設技能工数(推計)
2,582,838人
2022年
41,698人
不足
就業者数
2,541,140人
就業者数
2,447,480人
2,300,000
必要人数
空調機を中心とした建築現場への省施工提供、工程に合わせた適正部材の提供、
部品の保管・輸送。
K-MVSを活かし業界のリーディングカンパニーを目指し業容を拡大する
2,576,583人
●
堅調に推移する定温(冷凍)市場に対し、倉庫・ネットワーク配送の基盤充実で成長を目指す
2030年
●
請負事業はDX化・生産性向上による業務効率化推進と新規深耕化で事業拡大を図る
●
一般物流部門は、
自社車両の増強、
お客さま間の共同輸送を実現し事業拡大を図る
●
海外事業への進出:インドにおける空調・ガス関連事業、
ASEAN諸国への空調機改装事業の拡大を図る
179,121人
不足
就業者数
2,397,462人
(年度)
2020 2021 2022 2023 2024 2025 2026 2027 2028 2029 2030
1年目の取り組み
建設業の需要は堅調である一方、建設技能工の人手不足
空調・エネルギー部門は、改装業務獲得と保全工事の増加、食品・構内部門は、請負業務の生産増、定温物流部門は、新規
は加速し、2030年には約18万人の不足と試算されてい
業務の獲得と冷凍冷蔵食品の取扱量増、一般物流・流通部門は、
アパレル・オフィス用品の取扱量増、
また、各部門の適正
ます。人手不足を背景とした供給制約が足かせとなってお
単価の収受に加え、倉庫・配送業務の効率化、適正人員配置によるコスト低減を図り、
中期経営計画1年目は順調に推移い
り、着工の遅れや選別受注による工事の先送りなどが生
たしました。
じています。
今後も建設業の就業者数の減少が見込まれ、業務⽤空調
機据付現場の生産性向上・労働負荷軽減・環境負荷軽減
がこれまで以上に求められています。
当社は、
市場の課題を解決すべく、
K-MVS主要拠点として
成果(売上高・成長率)
売上高推移
ROIC・売上高成長率の推移
(百万円)
120,000
106,821
111,316
116,596
ROIC
「テクノロジス®︎幕張」
を2024年2月に稼働させました。
生活産業(生活)
2026年3月期
2025年3月期
100,000
生活産業(食品)
2026年3月期
2025年3月期
空調機メーカー、サブコン、空調機代理店向けに、空調機
80,000
生活産業(物流)
2026年3月期
2025年3月期
生活産業(定温)
2026年3月期
2025年3月期
を中心とした建築現場への施工の省力化提供、工程に合
60,000
わせた適正部材の供給、部品の保管・輸送を実現しまし
40,000
た。
このサービスにより、お取引先さまより高い評価を得
ており、今後も変化する市場環境に対応し、事業を成長さ
せてまいります。
食品
食品
物流
20,000
0
物流
2024年
3月期
2025年
3月期
2026年
3月期
定温
生活
定温
※円の大きさは売上高の大きさを表す
※売上高成長率は該当年度の過去3年を平均して算出
生活
売上高成長率
33
Chapter 1
Chapter 2
Chapter 3
Chapter 4
What is KONOIKE
Where we go
How we do
Data
KONOIKE GROUP Integrated Report 2026
生活産業本部
TOPICS
Consumer Industries Division
中期経営計画2027の実現に向けて
中期経営計画の1年目の取り組み
当営業所では中期経営計画1年目として、2024年
11月稼働の群馬県藤岡市の倉庫と2025年3月稼働
の同所自動倉庫を核に、
外資系消費財メーカーさま
の保管・出荷を支える物流体制を構築しました。藤
岡の倉庫では約6,000坪・15,000PL、自動倉庫は
約25,000PLの在庫保管能力を有しており、近隣2
工場の製造能力最大化と得意先顧客への安定供給
の実現に取り組んでまいりました。さらに近隣2工
場と各倉庫を結ぶ専用トレーラー12台が、月間29
日・24時間体制で稼働し、製造と物流を切れ目なく
つなぐサプライチェーンの仕組みを得意先と協業し
て構築しました。
中期経営計画2年目に向けての取り組み
北関東・信越地区への出荷業務拡大を見据え、安
全・品質を基盤に、人材育成と現場改善(作業効率
化・生産性向上)を重ねながら、営業所運営の改善
を追求して達成を図りたいと考えております。
群馬藤岡営業所のメンバー
34
Chapter 1
Chapter 2
Chapter 3
Chapter 4
What is KONOIKE
Where we go
How we do
Data
食品プロダクツ本部
複合ソリューション事業
食品プロダクツ業務
KONOIKE GROUP Integrated Report 2026
「顧客満足」
から
「顧客感動」
へ
~競合を意識した相対的価値から、唯一無二の絶対的価値を
構築することで感動をもたらす事業本部へ変わる~
ビジネスモデル・強み
飲料生産工場における生産工程オペレーション、設備メンテナンス業務、検査・資材・原料受け入れ等の業務請負、工場併設倉庫・配送センターにおける保管荷役、
原料・資材・製品トラック輸配送等の物流業務全般を担うことで、お客さまがコア業務に専念できるサービスを提供しています。
物流業務
当社の業務範囲
配送センター
配送
入出庫管理
流通加工他
資材メーカー
得意先
顧客
製品一次輸送
資材輸送
原料メーカー
生産関連請負業務
倉庫関連請負業務
飲料生産工場
製造委託メーカー
工場併設倉庫
配送
海外原料メーカー
産廃処理業者
入出庫管理
流通加工他
製造オペレーター資材管理、
品質管理、設備メンテナンス業務
本部の強み
1
請負・物流業務全般を一貫し
て担い、お客さまがコア業務
に専念できるサービスを提供
2
多機能型の倉庫を全国に整備
し、さまざまな業界の物流工
程に応じたサービスを展開
3
現場での豊富な自動化・DX化
事例で培った提案力
4
設備保全・メンテナンス技術
の強みを活かした高付加価
値の保全業務を提供
35
Chapter 1
Chapter 2
Chapter 3
Chapter 4
What is KONOIKE
Where we go
How we do
Data
KONOIKE GROUP Integrated Report 2026
食品プロダクツ本部
市場環境予測
中期経営計画2027
名目民間企業設備投資額の推移
戦略
(兆円)
●
150
個のスキルアップとイキイキ前向きな職場づくり
「人・組織(仕組み)
・風土」
の観点で基盤事業を盤石化
●
126.8
120
●
お客さま・社会・従業員を取り巻く環境変化への対応
●
生産から物流に至る多様な資産(人、設備、
ノウハウ)
と新技術の活用
1年目の取り組み
請負事業では、本部内で培ってきた設備保全・メンテナンス技術を強みとして、高付加価値の保全業務を提供しておりま
90
す。加えて、国内大手飲料メーカーとの信頼関係を70年以上にわたり構築してきた知見と現場対応力をもとに業務範囲を
60
出所:内閣府
「四半期別GDP速報
(2025年10-12月期2次速報値)
:
実額-名目季節調整系列」
(2026年3月)
広げてまいりました。物流事業においても同様に、
自動化・効率化・業務改善に関する積極的な提案を通じて、私たちの強
'10 '11 '12 '13 '14 '15 '16 '17 '18 '19 '20 '21 '22 '23 '24 '25(年)
みを活かした業務展開に取り組んでおります。
こうした取り組みを積み重ねることで、事業環境の変化に応じた対応力と強
固な事業基盤を築きながら、着実に業務を展開してまいりました。
製造業における設備投資の動向は増加傾向が続き、直近
では100兆円規模に達しています。今後も設備のメンテナ
ンス業務に対する需要はさらに高まっていくと考えられ
ます。
こうした環境のなかで当社は既存業務で培った強み
を活かし、得意先ライン更新時の自動化・省人化が進むな
か、高付加価値の保全業務へシフトしていくことと、工場
成果(売上高・成長率)
売上高推移
ROIC・売上高成長率の推移
(百万円)
60,000
請負派遣の獲得(他飲料、包材メーカー等)
をすすめ、新し
50,000
い価値を追求します。
40,000
50,875
52,957
54,487
ROIC
2026年3月期
2025年3月期
※円の大きさは売上高の大きさを表す
※売上高成長率は該当年度の過去3年を
平均して算出
30,000
20,000
10,000
0
2024年
3月期
2025年
3月期
2026年
3月期
売上高成長率
36
Chapter 1
Chapter 2
Chapter 3
Chapter 4
What is KONOIKE
Where we go
How we do
Data
KONOIKE GROUP Integrated Report 2026
食品プロダクツ本部
TOPICS
Food Products Division
設備保全・メンテナンス技術の
労働人口の減少、自動化・省力化の推進、労働環境
の改善が課題としてある中で、食品プロダクツ本部
強みを活かした高付加価値の
の保全の拡大・人材育成・新技術導入・営業支援を
保全業務の提供
業革新部が発足しました。保全業務の拡大、新技術
横断的に進めるため、東日本支店と西日本支店に営
の導入と展開、新たな顧客獲得などに取り組んでい
ます。
2019年から、
「保全業務の拡大」
として、営業革新部
ではオーバーホール関連の保全プロジェクトを開
始しています。保全人材育成や、安全教育の拠点で
あるくにたちトレーニングセンター(KTC)を活用
した事前講習、理解度評価、現場前教育を進めてお
り、新規参加者の教育面でのフォローと、安全・品質
向上を狙っています。
設備保全・メンテナンス技術の強みを活かして、外
販の保全業務を広げています。これからも現場の
保全力を上げ、
業容拡大につなげていきます。
営業革新部のメンバー
37
Chapter 1
Chapter 2
Chapter 3
Chapter 4
What is KONOIKE
Where we go
How we do
Data
メディカル本部
KONOIKE GROUP Integrated Report 2026
事業基盤の強化・拡充に向けた取り組みを通じ、
国内・海外での医療サービスの品質向上・効率化に貢献
複合ソリューション事業
メディカル業務
ビジネスモデル・強み
医療サプライチェーンの川上・川中である、
メーカー・卸向けの輸送業務、
洗浄メンテナンスサービス、
物流センター運営等の請負業務に加え、
川下では医療機関向けの院内での滅菌他各種
業務請負などのサービスを展開。
医療サプライチェーン全体に対する輸送やメンテナンス、
物流センター運営、
各種院内業務などの幅広いサービス展開で、
あらゆるニーズに応えています。
メディカル分野での職域について
医療サプライチェーン全体にサービスを提供する
「Hospital Logistics」
を展開
医療機関向けサービス
医療用医薬品・医療機器メーカー╱卸向けサービス
メーカー物流センター
卸支店・販売店舗
卸物流センター
医療機関
院外滅菌センター
●
配送業務
当社の
業務範囲
センター運営・
調達物流
医療機器
● 製造業
● 修理業
● 入出庫保管
● 洗浄・
メンテナンス
● 輸入業務
医療サプライ
チェーン
配送業務
● 無人納品
● ルート配送
センター運営
● センター設計
● 運営
(業務委託)
メーカー物流
院内請負業務
院内滅菌業務
SPD運営業務
● 手術室支援業務
● 内視鏡洗浄業務
● 院内物流業務
● 物品販売
医療機器洗浄
メンテ工場
●
●
卸物流
院外滅菌業務
学校健診機器管理
● 耐久試験サービス
●
検体・ワクチン
輸送業務
貸出医療機器洗浄・メンテ
医療機器製造業
● 物品管理/物流業務
● デモ機器の管理・
メンテ
●
●
●
●
院内物流
検体輸送
ワクチン輸送
院外物流
本部の強み
1
医療サプライチェーンの川上
から川下まで、あらゆる業務効
率改善に応えます。
2
全国10カ所の滅菌センターを
活用し、医療機関の業務負担
軽減に寄与します。
3
医療機関内での一次洗浄不要
に伴う医療器材等の滅菌事業
拡大を見込みます。
4
医療機器洗浄メンテ工場では
整形貸出用医療機器や人工関
節等への多様なサービスが可
能です。
38
Chapter 1
Chapter 2
Chapter 3
Chapter 4
What is KONOIKE
Where we go
How we do
Data
KONOIKE GROUP Integrated Report 2026
メディカル本部
市場環境予測
中期経営計画2027
患者数の変動の見込みと、
看護師等医療関連要員市場について
戦略
国内
●
九州・関西・関東での新規深耕化
●
メディカル・ロジスティクスの拡充
(医療機器輸送への取り組み加速)
●
業務効率改善に向けた提案の展開(センター業務・院内業務)
120,000
●
医療機関向け物販事業の拡大
90,000
●
事業規模拡大および新領域へのチャレンジのためのM&Aの推進
外来・入院患者動向見込み
(千人)
総人口
10,000
8,000
126,146
うち65歳以上
(高齢者)
123,262
120,116
入院患者
116,639
36,027
36,962
36,529
150,000
112,837
6,000
4,000
(千人)
60,000
39,285
37,732
2,000
0
30,000
1,211
1,329
1,387
1,422
1,429
2020
実績
2025
予想
2030
予想
2035
予想
2040
予想
0
(年度)
出所:厚生労働省国立社会保障・人口問題研究所
「厚生労働省患者調査」
「日本の将来推計人口」
、
2018
2025
●
●
インドでのメディカルビジネスの
確立と拡大
Carnaにて日系の医療機器メーカー
や公的機関のコンサルティング事業
獲得により業容拡大
SPDIにてデリー首都圏以外の
遠隔地への事業エリア拡大
鴻池運輸営業所では、一部の日曜稼働獲得や新規配送獲得に取り組むとともに、
センター内の多能工化や適正配置強化
などによる生産性向上に注力しました。
鴻池メディカルでは、
医療機関からの使用済み器材の院外搬出時の一次洗浄義務が
撤廃されたことを受けて、院外滅菌需要の拡大に対応すべく体制づくりを進めました。
またお客さまからの単価改定獲得、
インドのCarna Medical Database社では、
積極的な展示会活動や公的機関への事業提案強化に取り組み、
コンサルティン
2040
需要面・供給面
実績・人口構造
実績・人口構造 (参考)
実績
を勘案した就業者数
を踏まえた
を踏まえた
(推計)
必要人員
(推計) 必要人員
(推計) (経済成長と労働参加
が進むケース)
(推計)
医療・福祉分野
826万人
の就業者数
940万人
1,070万人
974万人
総就業者数に
占める割合
14-15%
18-20%
16%
12%
1年目の取り組み
●
派遣社員直傭化による労務費削減、
東京物流営業所第2センターの庫内充足等により売上拡大と利益改善を進めました。
医療・福祉分野の就業者数の見通し
(年)
海外
グ事業の獲得につなげました。
SPD India Healthcare社では、
調達先見直し等で原価圧縮を進めるとともに、
新エリアであ
るアッサム州進出を果たしました。
成果(売上高・成長率)
出所:厚生労働省
「第195回労働政策審議会職業安定分科会資料」
売上高推移
少子高齢化で総人口は減少局面にあるものの、高齢者人
(百万円)
口とともに、入院患者数は増加が続く見込みです。
これに
伴い、医療福祉系就業者の必要人員の増加も見込まれま
す。手術室周辺業務を展開する当社は、手術件数の増加
20,000
15,000
ROIC
14,026
14,773
15,317
5,000
スへの期待が高まると考え、サービス供給力の強化と生
0
2026年3月期
2025年3月期
※円の大きさは売上高の大きさを表す
※売上高成長率は該当年度の過去3年を
平均して算出
10,000
と、医療従事者の業務委託拡大を背景に医療関連サービ
産性の向上を進め、
事業拡大に努めます。
ROIC・売上高成長率の推移
2024年
3月期
2025年
3月期
2026年
3月期
売上高成長率
39
Chapter 1
Chapter 2
Chapter 3
Chapter 4
What is KONOIKE
Where we go
How we do
Data
KONOIKE GROUP Integrated Report 2026
メディカル本部
TOPICS
Medical Division
インドでのメディカルビジネスの
基盤強化と拡大
Carna Medical Database社は、2013年にインドで医
療関連サービスを提供すべく、鴻池運輸とメディアス
ホールディングス社の合併会社として設立されました。
インド全国の医療データベースを収集作成して以来、
日
印両政府、各公共団体や医療関連機関と良好な関係を
構築してまいりました。現在では、医療関連にとどまら
ず食品業界を含めた日本企業のインド進出を支援すべ
く、現地調査・コンサルティング支援、輸出入・販売等を
行う他、海外駐在員とその家族に安心を提供する健康
相談事業等業容拡大を進めています。
その他、
2024年には現地滅菌会社 SPD India Healthcare
社を連結グループ化しました。
デリー近郊では院内5病院
と院外約200病院と受託契約締結しています。2026年
からは北東部アッサム州2病院でも院内滅菌を開始し
ました。
さらにデリー以外の主要都市にも院外滅菌セン
ターを展開予定です。
Carna Medical Database社のメンバー
40
Chapter 1
Chapter 2
Chapter 3
Chapter 4
What is KONOIKE
Where we go
How we do
Data
空港本部
複合ソリューション事業
空港業務
KONOIKE GROUP Integrated Report 2026
1
すべての働く人の満足度を高めることでお客さまに対し
最高のサービスを提供する組織を構築する
2
空港グランドハンドリング会社としてステータスを確立する
(国内主要空港で旅客・ランプ・貨物のトータルサービスを提供)
ビジネスモデル・強み
当社グループは、航空会社、
グランドハンドリング会社、航空貨物会社、空港会社に対し、空港の基幹業務から周辺業務まで幅広いサービスを提供しています。
直接受託と協業受託の双方を組み合わせ、空港運営を多面的に支えることが当社グループの特長です。
01 ランプ
航空機誘導
搭降載
機内清掃
ロードコントロール
(重量バランス管理)
旅客手荷物
02
03 旅客業務
01
搭乗手続き
ラウンジ
航務サービス
到着出発ゲート
03
機内食・機内用品等セッティング
02 貨物上屋
貨物受託
輸出ビルドアップ
輸入解体
搬送
1 航空会社向け
(直接受託)
空港案内業務
2 グランドハンドリング会社向け(協業受託)
3 航空貨物
(上屋)会社向け
4 空港会社向けのみ
本部の強み
1
空港全体を俯瞰する
運営品質
2
多様な受託形態に
応える現場対応力
3
多国籍人材の戦力化と
安定供給力
4
教育・DXによる
現場進化
41
Chapter 1
Chapter 2
Chapter 3
Chapter 4
What is KONOIKE
Where we go
How we do
Data
KONOIKE GROUP Integrated Report 2026
空港本部
市場環境予測
中期経営計画2027
訪日外国人
戦略
(千人)
16,000
中国人
中国人以外
15,000
14,000
12,000
10,000
10,537 10,980 10,132
11,032 10,683
●
既存空港事業の伸長:安全・品質・人材を担保に旺盛な航空需要に応えていく
●
事業領域の拡大:グループの人材、情報、営業力を活かし、
業務の幅を広げていく
●
空港に関連する新事業の創出:新空港への進出、空港内事業者のお困り事の解決
8,000
1年目の取り組み
6,000
既存空港事業では、2025年11月に鹿児島空港でグランドハンドリング業務を開始しました。地元採用に加え、既存拠点
4,000
で経験を積んだ人材を関係会社間で機動的に配置することで、円滑な立ち上げと地域雇用の創出を実現しています。事業
2,000
0
(年度)
2025
Q1
2025
Q2
2025
Q3
2025
Q4
2026
Q1
※2030年の政府目標6,000万人より、
第一四半期分1,500万人として表記。
訪日外国人数「日本政府観光局
(JNTO)」
より
2030
Q1
政府目標
領域の拡大では、成田空港で手荷物自動預け機の案内業務を受託し、空港会社向け業務へ領域を拡張しました。
さらに、
KSKY社のラウンジ業務は2年目を迎え、関西国際空港内でのプレゼンスを高めています。市場環境が大きく変化する中で
も、人材教育と多国籍人材の戦力化を進め、着実に事業基盤を強化しています。
訪日需要は、国・地域別には変動を伴うものの、全体では
底堅く推移しています。足元では中国需要に弱さがみら
れる一方、その他地域からの来訪が全体を下支えしてお
り、政府目標も踏まえると中期的な拡大余地は大きいと
みています。
当本部は、需要国と受託領域の分散を進める
とともに、教育・訓練を継続し、次の需要拡大局面に備え
ています。
成果(売上高・成長率)
売上高推移
ROIC・売上高成長率の推移
(百万円)
35,000
30,305
30,000
25,000
20,000
27,034
ROIC
2026年3月期
2025年3月期
空港
※円の大きさは売上高の大きさを表す
※売上高成長率は該当年度の過去3年を平均して算出
20,165
空港
15,000
10,000
5,000
0
2024年
3月期
2025年
3月期
2026年
3月期
売上高成長率
42
Chapter 1
Chapter 2
Chapter 3
Chapter 4
What is KONOIKE
Where we go
How we do
Data
KONOIKE GROUP Integrated Report 2026
空港本部
TOPICS
Airport Headquarters
成田空港における手荷物自動預け機の
これまで航空会社スタッフが担っていた手荷物預
案内業務新規受託について
い、
お客さまご自身で機器を操作いただく場面が増
かり業務は、成田空港におけるセルフ化の進展に伴
えています。
そのため、私たちには、操作に不慣れな
お客さまにも安心してご利用いただけるよう、丁寧
で分かりやすいサポートが求められています。現場
では、臨時便を含むフライト状況に応じた柔軟な
人員配置に加え、多様な路線や旅客の国籍に対応
する多言語スタッフの配置など、
さまざまな工夫を
重ねてきました。その結果、スムーズな誘導ときめ
細かな支援が可能となり、待ち時間の短縮にもつ
ながっています。お客さまに空港での滞在時間をよ
り有効にお使いいただけることは、私たちにとって
大きなやりがいです。今後も成田空港のファストト
ラベル推進に寄与し、セルフ化が進む空港であって
も、これまで培ってきた接客力を活かし、誰もが安
心して利用できるサービスを提供していきます。
空港ターミナルサービスのメンバー
43
Chapter 1
Chapter 2
Chapter 3
Chapter 4
What is KONOIKE
Where we go
How we do
Data
国際統括本部
KONOIKE GROUP Integrated Report 2026
「成長」
「投資」
「技術」
を軸に、
グローバル事業を
牽引・推進し、高い付加価値を提供します。
国際物流事業
国際業務
ビジネスモデル・強み
地域の特性に合わせ、
フォワーディング(輸出入)、ロジスティクス(輸送・倉庫)、
コントラクト(請負)、エンジニアリング(据付工事)、パッケージ&トレーディング(梱包・商流)という5
つの事業セグメントを設定し、事業をより明確化し、ターゲットとする業界を設定して、
グローバル成長に向けて取り組んでいます。
2%
6%
中国
中国
China
161億円
88%
売上高
インド
Japan
India
16%
インド
売上高
60億円
北中米
日本
4%
3%
100%
7%
ASEAN
2%
North and
13
Central America
日本
売上高
292億円
ASEAN
16%
60%
売上高
64%
● ロジスティクス事業(輸送・倉庫)
売上高
● エンジニアリング事業
116億円
● コントラクト
(請負)
● パッケージ&トレーディング事業
※売上高は単純合算(内部取引控除前)
本部の強み
1
北中米
121億円
● フォワーディング
(輸出入)
37%
43%
長年のフォワーディング営業
で培った海外事業の経験と自
社アセットを組み合わせた質
の高いサービス
7%
%
30%
1%
1%
2
各国、各地域において、積極的
に投資を行い、当社の強みを
活かせる物流サービス
3
次世代フォワーディングシス
テムを駆使した当社ネット
ワーク独自の付加価値の高
いサービス
4
通関・AEOに関する知識、貿
易実務経験、海外をフィール
ドに多種多様な経験を積ん
だ人材
44
Chapter 1
Chapter 2
Chapter 3
Chapter 4
What is KONOIKE
Where we go
How we do
Data
KONOIKE GROUP Integrated Report 2026
国際統括本部
市場環境予測
中期経営計画2027
インド、北中米、ASEANの成長加速
戦略
インド鉄道貨物輸送市場
米国冷凍冷蔵倉庫市場
出所:Mordor Intelligence
「インド鉄道貨物輸送市場」
出所:Mordor Intelligence
「米国冷凍冷蔵倉庫市場」
(年)
2025
2026
2031
CAGR
市場規模
225億米ドル
243億米ドル
356億米ドル
8.0%
(年)
2025
2026
2031
CAGR
市場規模
524億米ドル
556億米ドル
738億米ドル
5.8%
自動車部品パッケージング市場
ASEANコールドチェーン物流市場
出所:Towards Packaging
「自動車部品包装市場規模」
出所:Mordor Intelligence
「ASEANコールドチェーン物流市場」
(年)
2025
2026
2036
CAGR
市場規模
99億米ドル
103億米ドル
160億米ドル
4.5%
(年)
2025
2026
2031
CAGR
市場規模
188億米ドル
200億米ドル
244億米ドル
4.9%
インド、北中米、ASEANにおける成長の加速
●
インド
鉄道事業の収益力向上(貨車の増強による輸送能力の拡大)
●
北中米
❶冷凍冷蔵倉庫事業の拡大(新規倉庫建設中)
❷自動車業界をメインに梱包+物流+エンジニアリング、
複合ソリューションを組み合わせたモデルの確立
●
域内における食品コールドチェーン事業の拡大
(ベトナム・タイでの定温倉庫投資および輸送車両の増強)
ASEAN
1年目の取り組み
中計1年目は、注力地域であるインド、北中米、ASEANにおいて成長投資と事業基盤強化を進めました。インドでは鉄
道輸送能力の拡大、北中米では冷凍冷蔵倉庫事業の拡大とデザインパッケージングを含む複合ソリューションの展開、
インド
(鉄道輸送事業)
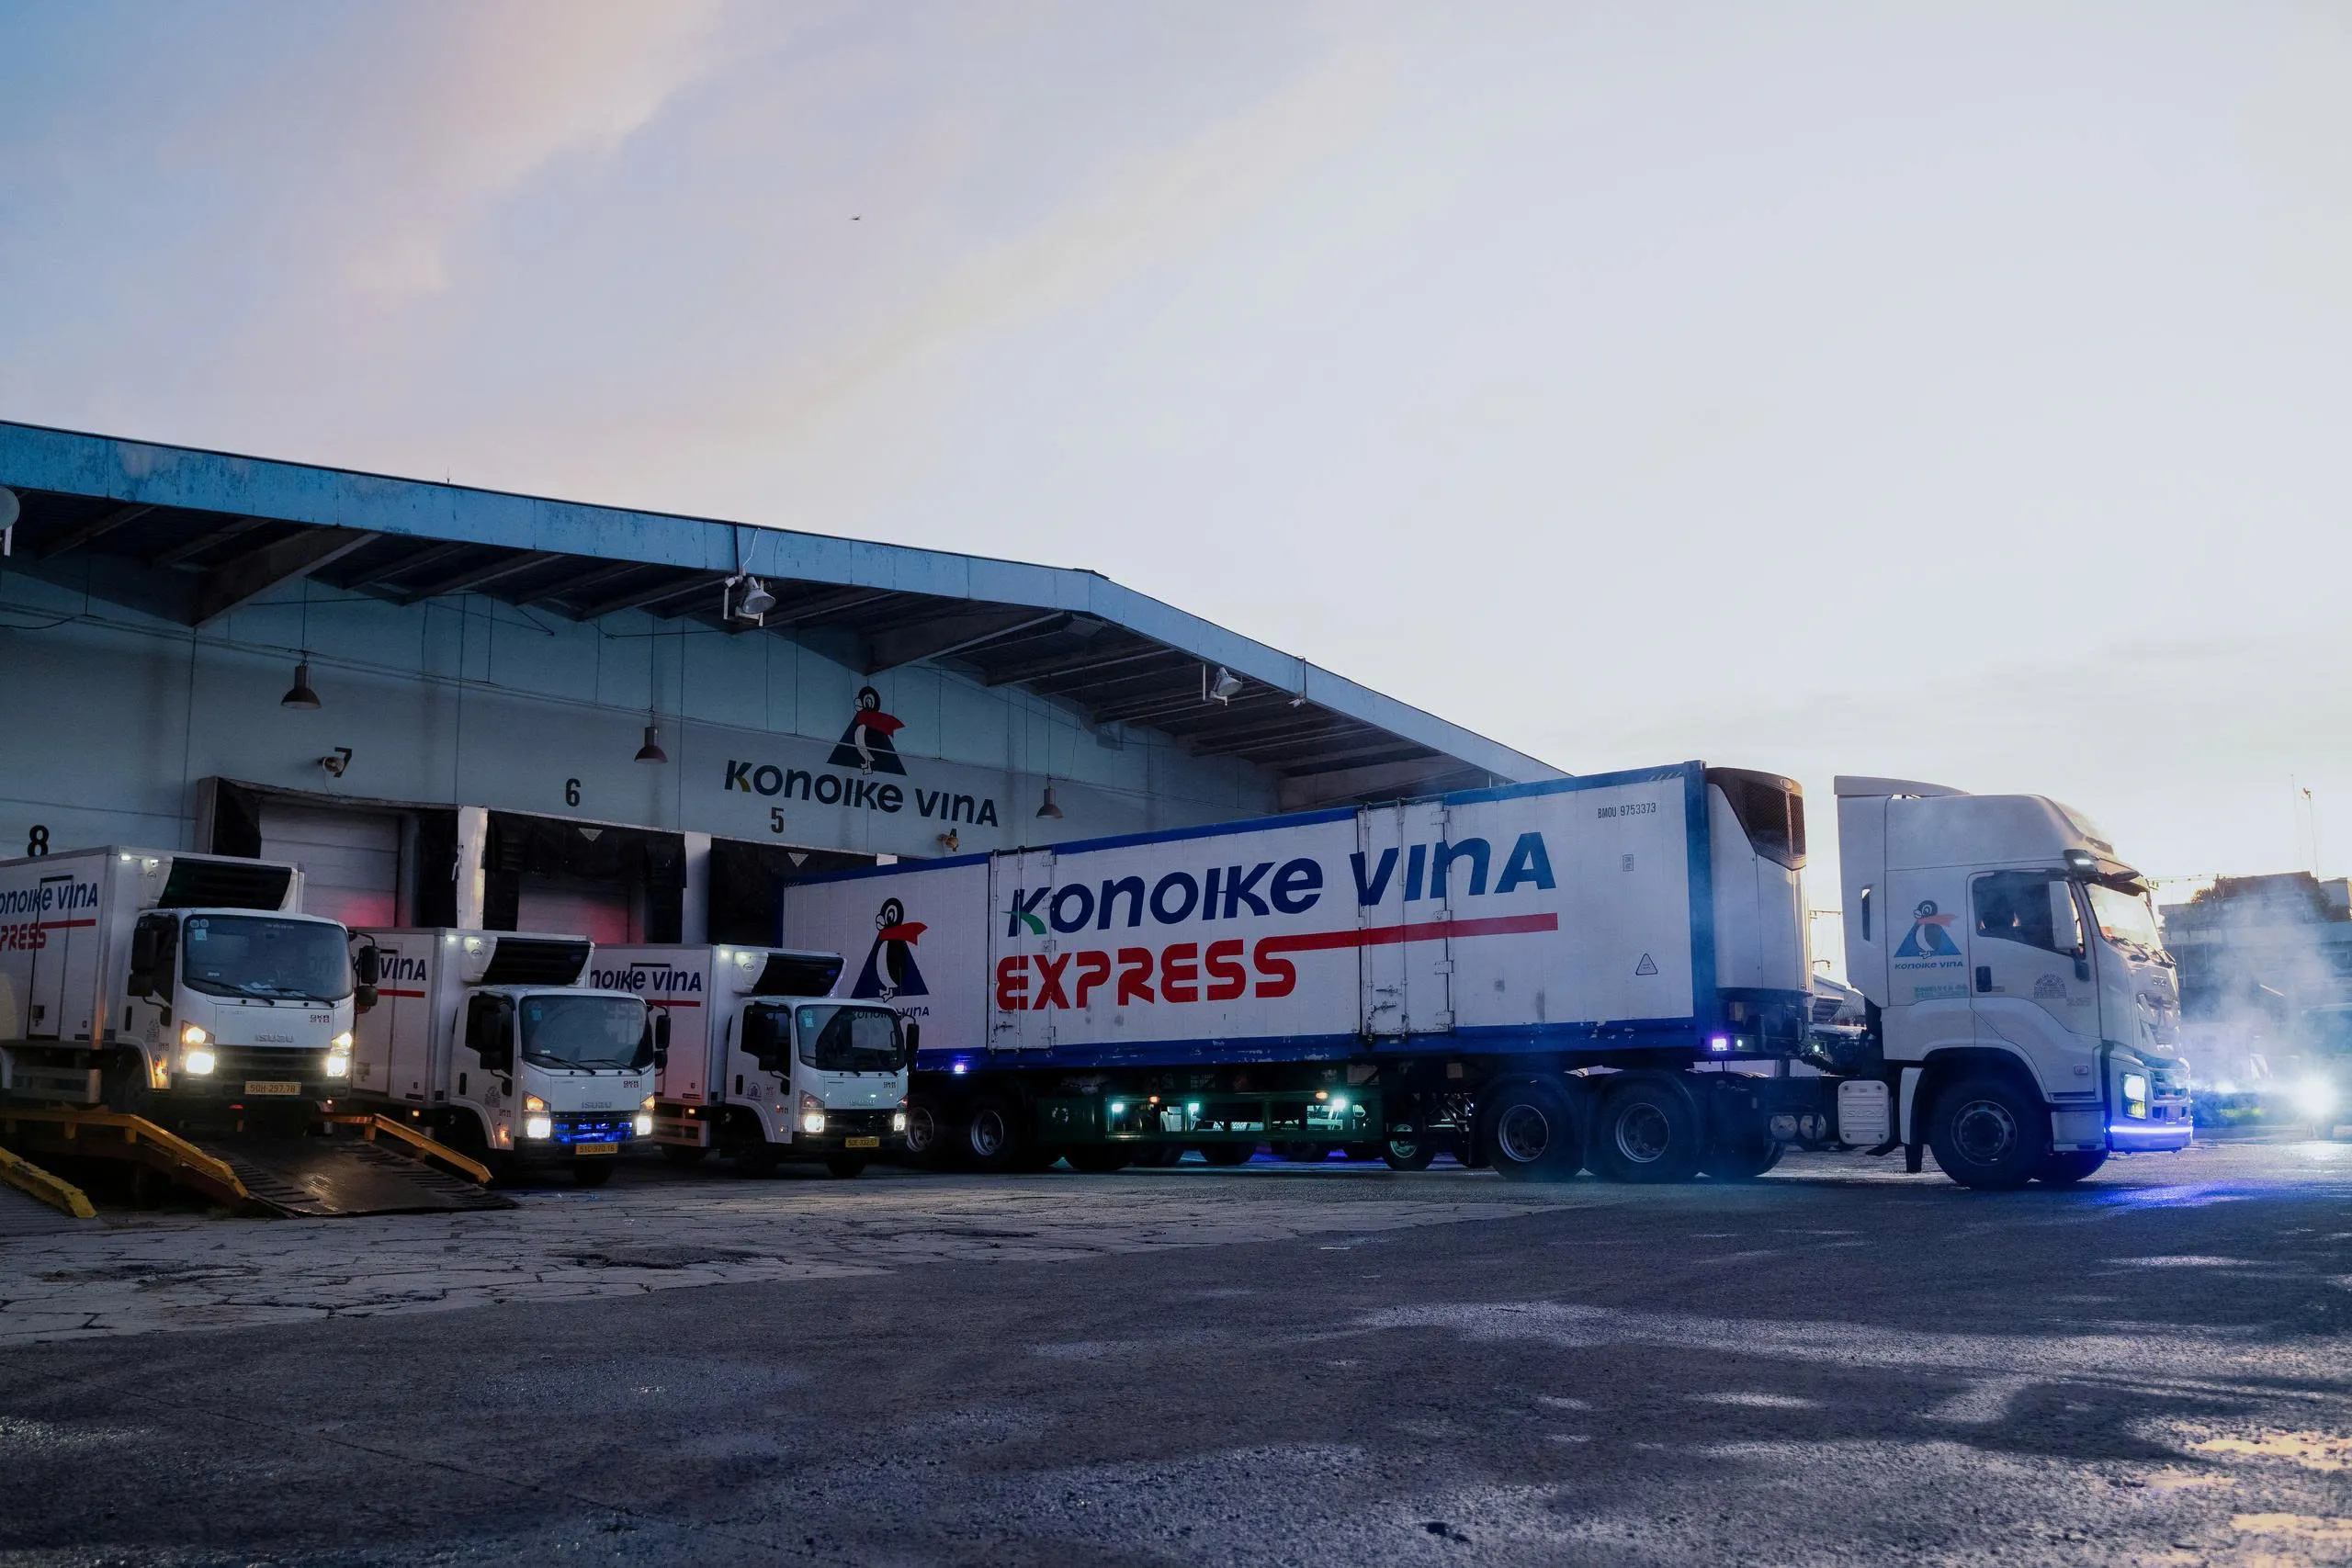
ASEANでは食品定温物流網の拡充に取り組みました。特にベトナムでは、南北を結ぶ定温幹線輸送「KONOIKE VINA
自動車販売台数世界第3位の市場規模、人口ボーナスを
EXPRESS」
の取扱量拡大を背景に、2026年7月に南部ホーチミンに自社定温倉庫を開設しました。今後も定温物流インフ
背景として中長期的な力強い高成長を見込んでいます。
ラへの継続的な投資を進め、保管と輸送を一体化したワンストップ体制の構築を進めてまいります。
現在は、
コンテナ輸送用車両13編成、
自動車輸送用車両
8編成を擁しており、新規輸送ルートの拡大と輸送効率の
向上を推し進めていきます。
北中米
堅調な人口の増加を背景に、国内で消費される食品の需
要は生活必需品として底堅く推移する見通しです。定温倉
庫が扱う輸入食品は足元の庫腹量も堅調で、成長市場を
捉えた投資計画を推進し、
設備の充実を図っていきます。
ASEAN
成果(売上高・成長率)
売上高推移
ROIC・売上高成長率の推移
(百万円)
80,000
60,000
71,600
ROIC
67,028
59,136
2026年3月期
2025年3月期
※円の大きさは売上高の大きさを表す
※売上高成長率は該当年度の過去3年を平均して算出
40,000
20,000
民間消費の拡大が小売市場の成長を支え、今後もさらな
る経済成長が期待されています。
ベトナムおよびタイにお
いて拡大する内需を取り込むべく、定温倉庫や定温輸送
への成長投資を進め、高品質なコールドチェーンサービ
スの拡充を通じて事業基盤の強化を図っていきます。
0
2024年
3月期
2025年
3月期
2026年
3月期
売上高成長率
45
Chapter 1
Chapter 2
Chapter 3
Chapter 4
What is KONOIKE
Where we go
How we do
Data
KONOIKE GROUP Integrated Report 2026
国際統括本部
TOPICS
International Headquarters
ベトナム定温幹線輸送
(南北定期便)の拡大
南北幹線輸送
「KONOIKE VINA EXPRESS」
は、
ベ
トナム国内の南北を結ぶ定温輸送サービスとして、
当社のASEAN戦略を支える中核事業の一つです。
本サービスは日系物流企業として当社のみが展開
する独自性の高い事業であり、当社の強みとなって
います。地域ごとに異なる商習慣や道路事情、納品
条件に柔軟に対応しながら、安定した輸送品質の維
持と輸送効率の向上を追求しており、特に温度管理
の徹底、GPSを活用した動態管理、拠点間の情報連
携強化により、高品質で信頼性の高いサービス体制
を構築してきました。
今後は、拡大するベトナムの食品需要を取り込むべ
く、国内各地への定温倉庫の戦略的な配置を推進
するとともに、それぞれの拠点をハブとして南北幹
線輸送(南北定期便)
でつなぐことで、ベトナムでは
まだ確立されていないコールドチェーンを構築し、
ベトナムの食品物流を支える社会インフラとしての
プラットフォームへ進化させてまいります。
Konoike Vinatrans Logistics社のメンバー
46
Chapter 1
Chapter 2
Chapter 3
Chapter 4
What is KONOIKE
Where we go
How we do
Data
KONOIKE GROUP Integrated Report 2026
Ⅱ. 財務・資本政策
資本コスト
中計1年目の評価
中期経営計画2027の1年目となる2026年3月期は、海外事業
PBR
の拡大や国内での取扱量増加などにより売上高3,555億円、営
PBR1倍
業利益227億円と増収増益を確保し、営業利益率も6.4%まで
2026.03.31
PBR 1.05倍
高まり、
収益力は着実についてきていると認識しています。
一方で、ROEは9.3%と目標の10%以上には一歩届いておら
ず、最終年度の資本効率目標達成に向け、引き続き中期経営計
画2027の事業戦略である
「海外事業の拡大」
「国内事業の成長
加速」
「事業構造の改革」に注力するとともに、あらゆる施策を
2021.03.31
PBR 0.66倍
2022年3期
2023年3期
2024年3期
2025年3期
2026年3期
PBR:時価総額
(自己株式調整後)
÷株主資本等合計(前期有報)
により算出
着実に実行してまいります。
ROE10%以上を達成するための取り組み
当社は株主資本コストを9%程度と推定しており、ROE10%
以上の安定的な達成が重要と考えています。そのため、中期経
ROE/PER
15
ROE
(%)
PER(倍)
営計画2027の達成に向け、海外ではインド・北中米への重点投
資を進め、国内ではメディカル・空港のサービス分野の強化や
10
9.5
エンジニアリング事業の拡大を進めます。
また、事業継続性評価
7.7
やKOMBO活動を通じ収益力・生産性を向上させ、
自己資本比
7.5
率・DEレシオの目標を踏まえた財務運営、配当性向40%以上と
10.2
10.1
10.0
8.9
10.3
9.3
8〜 9 %
7.1
当社が認識する株主資本コスト
5
執行役員財務経理本部本部長
する株主還元およびIR活動の充実等にも取り組み、資本コスト
を上回る資本効率の持続的な創出を目指します。
中西義人
0
2022年 3月期
2023年 3月期
2024年 3月期
2025年 3月期
2026年 3月期
47
Chapter 1
Chapter 2
Chapter 3
Chapter 4
What is KONOIKE
Where we go
How we do
Data
KONOIKE GROUP Integrated Report 2026
キャッシュアロケーション
中期経営計画2027でお示ししたキャッシュアロケーションについては、
1年目であ
キャッシュアロケーションの実績
複合ソリューション
る2026年3月期に営業キャッシュ・フローは248億円を確保し、
おおむね計画どおりに
項目
進捗しております。
投資キャッシュ・フローにつきましても、
有形固定資産の取得を主
体に162億円支出し、
将来の成長に向けた投資を着実に実行することができました。
配当も年間110円へ引き上げを行い、
株主還元と成長投資にバランスよく取り組めた
と考えております。
中期経営計画2027にて策定したキャッ
シュアロケーション計画に基づき、引き
続き成長投資を計画的に進め、資本コス
トを上回る資本効率の実現を目指すこと
中期経営計画2027
DEレシオ
する現預金回転期間1.2カ月程度・DEレ
自己資本比率
定性と成長投資余力の確保との両立を図
るという最適な財務バランスの実現に向
け、今後も取り組んでまいります。
新リース基準
40〜45%
キャッシュ
アウト
成長投資
現行基準:45〜50%
格付け
A以上(JCR)
※2027年4月開始予定の新リース会計基準適用
に伴い、
550億円の使用権資産
(リース資産)
および
リース負債が計上されると仮定
株主還元
株主還元につきましては、各事業年度の業績、財務体質の強化、中長期事業戦略等を総合的に勘
▲34億円
▲200億円
21億円
10億円
71億円
200億円
エコイノベーション 構築物等 14億円
九州産交運輸車両等
6億円
鴻池運輸 システム投資
5億円
▲71億円
▲240億円
北中米:Konoike-General, Inc.
土地・建設仮勘定
▲65億円
▲280億円
▲15億円
▲200億円
61円
55円
▲62億円
▲190億円
▲35億円
▲35億円
180億円
●
株主還元
2025年3月期期末配当
2026年3月期中間配当
●
有利子負債の増減
27%
30%
目指すことを原則としております。中期経営計画2027では、連結配当性向を従来の30%以上から
ます。引き続き企業価値のさらなる向上に向け、人的資本への投資、成長投資、株主の皆さまへの
36%
41%
配当性向
40%以上
110
96
案して、内部留保の充実を図りつつ、継続的・安定的かつ業績・収益状況に対応した配当の実現を
40%以上へ引き上げ、2026年3月期は年間110円の配当とし、2027年3月期も同額を予想してい
51億円
●
手元資金活用
負債返済等
配当性向
(連結)
物流センター
流通センター
Vertex Konoike Engineers Pvt. Ltd.
Ehrhardt Konoike Solutions GmbH.
M&A
26/3期
実績
730億円
鴻池運輸
鴻池運輸
設備投資
その他
(ご参考)
中計2027
3年累計
248億円
うち人的投資
維持強化
投資
国際物流
26億円
8億円
ベースアップ
●教育費用
●
リース投資/負債
1.2カ月程度
0.8以下
格付けA以上の各指標を達成し、財務安
営業キャッシュフロー
現預金回転期間
で、中期経営計画2027にて財務目標と
シオ0.8以下・自己資本比率40~45%・
キャッシュ
イン
補足(主な内容)
国内物流
65
一株あたり
配当金
(円)
42
還元にバランスよく取り組んでまいります。
2023年3期
2022年3期
2024年3期
2025年3期
2026年3期
2028年3期計画
48
Chapter 1
Chapter 2
Chapter 3
Chapter 4
What is KONOIKE
Where we go
How we do
Data
KONOIKE GROUP Integrated Report 2026
Ⅲ. 経営基盤強化
サステナビリティ
サステナビリティ・ガバナンス推進体制図
私たちKONOIKEグループは企業理念に
「『人』
と
『絆』
を
取締役会
監査役会
大切に、社会の基盤を革新し、新たな価値を創造します」
を掲げ、
これを
「私たちの使命」
としています。
サステナビリ
ティを巡る課題に取り組む際にも、
この理念の実践を通じ
て、お客さま・従業員・株主・地域社会といったKONOIKE
グループを取り巻く多様なステークホルダーの幸福と安
サステナビリティ
委員会
全で安心な社会の実現を目指します。その実現に向け、当
社はサステナビリティ委員会、内部統制委員会、人材戦略
内部統制
委員会
委員会、技術戦略委員会を設置しており、中長期的な視点
正副委員長会議
で「人」
と
「技術」に関わる課題へ迅速に対応することで、持
続的成長を支える経営基盤を強化してまいります。
ガバナンス
連携
内部統制委員会では、
内部統制部会や経営品質協議会な
内部統制
部会
リスク
マネジメント
部会
情報
セキュリティ
部会
環境部会
どの機能を一元化しており、経営監視機能のさらなる強化
を図っています。サステナビリティ委員会と同様に取締役
会の諮問機関と位置づけており、取締役会からの諮問への
答申に加え、討議・検討内容を定期的に報告します。取締役
会での質疑や指摘は再び委員会に共有され、今後の取り組
みや活動に反映される仕組みとしています。
本社営業部門・管理部門
内部
監査室
各支店・関係会社(国内・海外)
人材戦略
委員会
技術戦略
委員会
49
Chapter 1
Chapter 2
Chapter 3
Chapter 4
What is KONOIKE
Where we go
How we do
Data
KONOIKE GROUP Integrated Report 2026
各委員会における活動
サステナビリティ委員会
(委員長:コーポレート部門担当兼サステナビリティ担当役員)
サステナビリティを巡る課題に対応することを目的として、取締役会の諮問機関とし
て設置しています。
本委員会のもとに以下の3部会を設置しています。
リスクマネジメント部会(部会長:総務本部本部長)
経営環境の変化に対応するため、
定期的にリスクアセスメントを実施し、
対象リスクを選
定しています。
リスク所管部門を決定するとともに、
評価指標
(統制目標)
の設定の他、
取り
組み状況のモニタリングを実施するなど、
リスク低減に向けて活動しています。
内部統制委員会
新設
(委員長:代表取締役会長兼社長執行役員)
KONOIKEグループの内部統制の構築・運用の推進や内部統制上の課題対応、
およびコンプラ
イアンス状況の把握によるコンプライアンス違反の未然防止・再発防止策の実効性向上を図るこ
とを目的として、
取締役会の諮問機関として設置しています。
人材戦略委員会
新設
(委員長:人材開発本部本部長)
KONOIKEグループの企業価値向上に向け、
事業の全社最適かつグローバルな観点に立った中長
期成長戦略の策定・遂行の強化を図ることを目的として、
取締役会の諮問機関として設置しています。
人材に関する戦略および中長期課題解消・解決取り組みに関する事項は次の4点です。
情報セキュリティ部会(部会長:ICT推進本部本部長)
情報セキュリティ基本方針および関連する諸規程を整備するとともに、
情報セキュリティ
全般に対し、
人的・物理的・技術的対策の検討と、
実態把握・予防措置・検出・緊急事態へ
の対応を行っています。
また、
配下の情報セキュリティ対策推進チームにより、
具体的な
❶ 採用:人手不足への対応
❸ 配置:新たな人材マネジメントの構築
❷ 育成:事業戦略に連動した人材育成
❹ 定着:働きやすい職場環境づくり
対策、
定期的な見直し、
改善、
教育を実施し、
情報セキュリティを維持・発展させていくた
めのマネジメントサイクル
(PDCA)
を推進しています。
技術戦略委員会
新設
(委員長:技術革新本部本部長)
環境部会(部会長:経営品質本部本部長)
環境関連法規の遵守および環境保全活動の状況について評価し、
各種改善施策を議論、
立案、
実施することにより、
法令遵守・環境負荷低減への対応を図っています。
当社グループの企業価値向上に向け、
事業の全社最適かつグローバルな観点に立った中長期
成長戦略に必要な技術戦略策定・遂行を図ることを目的として、
取締役会の諮問機関として設置
しています。
AI、
IoT、
ビッグデータ、
ロボット等の革新的な技術に対応するとともに、
技術革新本部、
ICT推
進本部が連携して技術全般の中長期ロードマップの策定と課題解決に向けた取り組みを推進し
ていきます。
50
Chapter 1
Chapter 2
Chapter 3
Chapter 4
What is KONOIKE
Where we go
How we do
Data
人
person
KONOIKE GROUP Integrated Report 2026
基本的な考え方
KONOIKEグループは、持続的な企業価値向上の原動力は「人」であると考えています。2030年ビジョンの実現に向
け、中期経営計画2027では、処遇改善や教育・訓練を中心に3カ年で200億円規模の人的投資増額を進め、働き方改革
の再加速、採用の強化や人事制度改革とあわせて、一人ひとりの能力を最大限に引き出す人的資本経営を推進していま
す。2025年4月に取締役会の諮問機関として設置した人材戦略委員会のもと、事業戦略に即した人材育成とウェルビー
イング向上を両輪で進め、多様な人材が安心して挑戦し学び続けられる環境づくりを加速させることで、強い現場と中
長期的な成長を支える人材基盤の強化に取り組んでいます。
中期経営計画KPI
総合職社員採用計画
専門職社員採用計画
3年以内離職率
200億円の人的投資増額実現に向けて
新卒
50名
キャリア
30名
新卒
140名
総合職
5.0%
専門職
20.2%
男性育休取得率
40.0%
女性管理職比率
10.0%
障がい者雇用率
2.75%
ウェルビーイングサーベイスコア
コーチング累計受講者数
幸福度
4.16
注意度
3.21
組織・モラール
4.75
560名
3カ年累計
161
24
18
処遇改善
計
億円
教育研修
計
億円
定年延長
計
億円
51
人
Chapter 1
Chapter 2
Chapter 3
Chapter 4
What is KONOIKE
Where we go
How we do
Data
KONOIKE GROUP Integrated Report 2026
2030年に向けた施策
経営戦略に基づく人材育成の推進
従業員の働き甲斐向上
事業戦略に即した事業系人材育成
企業理念の浸透
2030年ビジョンにかかげた構想から必要人材をバックキャストし、
事業戦略に応
車座で対話する
「カタリバ」
によるインナーブランディング活動に加え、
グループ全
じた採用や育成などの人材戦略を進めています。
グループ全体の人材ポートフォ
社員に配布しているKONOIKE手帳に掲載した“KONOIKE PHILOSOPHY”の
リオを整備し、
将来を担う経営人材や専門人材の育成を強化します。
読み合わせなどを通じて、
企業理念のさらなる浸透を図っています。
専門性の高いコーポレート系人材育成
従業員の幸せの追求
事業の拡大とあわせて求められる内部統制の強化に向け、
コーポレート部門
健康経営
での高度専門人材の育成を推進します。階層ごとにクリアすべき業務レベル
2023年2月に
「健康経営宣言」
を策定し、従業員のパフォーマンス向上や人材の
を記した職務基準書を活用し、到達度の可視化と計画的な育成体制を整備
安定的な確保と定着に取り組み、
2024年から2026年にかけて
「健康経営優良法人
しています。
(大規模法人部門)
」
に3年連続で認定されています。
「部門を越えた連携」
による
課題解決力・提案力の高い人材育成
エンゲージメントサーベイ
社会や働き方が多様化するなかで、
従業員一人ひとりのウェルビーイングを実現
するために、
毎年実施しているサーベイの結果分析と拠点別の改善を継続的に進
社内で行っているさまざまな業務の知見共有と部門連携を促進し、課題解決力・
め、
仕事に幸せを感じ個々の力を最大限に発揮できる企業風土を目指してまいり
提案力の高い人材を育成しています。経験を積ませるためのジョブローテーショ
ます。
ンと研修の両面から、
横断的な人材育成を進めています。
技術革新・ICT部門の専門性強化
および全社でのリテラシー向上
2026年3月期より業務のDX化推進に特化した教育プログラムを導入し、社
員のITリテラシー向上策を進めるほかに、AI企業内検索プラットフォーム
“Glean”を導入し、積極的な利活用による生産性の向上を図っています。
52
人
Chapter 1
Chapter 2
Chapter 3
Chapter 4
What is KONOIKE
Where we go
How we do
Data
KONOIKE GROUP Integrated Report 2026
経営戦略に基づく人材育成の推進
事業戦略に即した事業系人材育成
2030年ビジョンの実現に向け、2年目を迎えた
「中期経営計画2027」
では、
まず事業ごとのありたい姿と必要
人材像を整理・明確化します。社内での利活用が定着したタレントマネジメントシステムにより人材情報を可視
化し、経営人材・技術人材・グローバル人材・高度専門人材など、重点育成対象ごとの人材プールづくりを進めて
います。
また、
それぞれの人材をさらに高い能力に引き上げるための研修についても現中期経営計画から本格的
に開始し、
この3カ年で約25億円規模の
「人」への教育投資を行う計画です。一方で、
これまでのように単にお客
さまからの受注業務をやり切るサービスにとどまらず、
それ以上の価値を提供するサービスを目指し、人材育成
をサポートするためのプログラムを構築し、KONOIKEグループの事業を通じて社会課題の解決を図る発想力・
思考力・実行力の強化を図ってまいります。
海外短期研修(インド)
専門性の高いコーポレート系人材育成
2022年4月の東京証券取引所プライム市場への移行を経て、
より高い知識と統制力のあるプロフェッショ
ナル人材の育成を図っています。
とくに内部統制の強化を図るうえで不可欠な存在であるコーポレート部門
においては、部門ごとに整備した階層別の職務基準書による人材のレベルアップを図ると同時に、財務・経
理・法務・総務・人事といった各部門の社員講師による教育カリキュラムを階層別研修に取り入れ、従業員全
体の教育はもとより、部門社員の講師としての技量や質の向上も目指すことにより、担当業務のアップデート
が自然に求められる仕組みとして運営しています。一方でKONOIKEグループの事業が分かるコーポレート
人材という要件も大切にしています。高い専門性に加え、現場をよく知り、現場から頼られるコーポレート部
門を目指し、適切なジョブローテーションを図りながら人材育成を進めてまいります。
2 年次
社会課題を考える
4 年次
課題を広く捉える
6 年次
自社事業を接続する
新任副長
事業機会で捉え直す
新任所課長
事業として構想する
所課長 5 年目
横展開につなげる
53
人
Chapter 1
Chapter 2
Chapter 3
Chapter 4
What is KONOIKE
Where we go
How we do
Data
KONOIKE GROUP Integrated Report 2026
「部門を越えた連携」による課題解決力・提案力の高い人材育成
KONOIKEグループは多岐にわたる事業を展開し、それぞれの分野で豊富なノウハウを有
していますが、お客さまに提供するサービスにおいて、
これまでにない付加価値を創出・提供し
ていくためには、それぞれのノウハウをグループ内で共有・連携・活用できる組織への開発と、
高い課題解決力・提案力を持った人材の育成が必要であると考えています。
自部門の業務では
解決できないお客さまの困りごとや社会課題に対し、他部門では既に改善実績があるものや、
マーケティングや情報収集が進んでいるケースがあります。当社グループでは、日々のOJTだ
けでは不足する他部門との交流の場をさまざまな研修を通じて設け、他部門への関心を強め
全社を俯瞰的にみる力を養っています。また、同じ課題を共有することでさらに高度な解決方
法を導くことも可能になります。当社グループの多種多様な事業を人の交流を通じてシナジー
を高め、企業価値をさらに高めてまいります。
人材開発センター
技術革新・ICT部門の専門性強化および全社でのリテラシー向上
これまで業務のDX化推進を目的とした全社的なデジタル教育を通じて、社員一人ひとりの
ITリテラシー向上に継続的に取り組んでまいりました。2026年5月には、日系物流企業で初
となる社内専用のAIプラットフォーム“Glean”を導入し、社内に蓄積された多様な情報を横
断的に検索・活用できる環境を整備し、情報収集や整理、資料作成などこれまで人が行ってい
た業務を担う存在になりました。これに加え、AI習熟度に応じた研修を拡充することで、コー
ポレート部門のみならず事業本部やグループ会社を含む全社で、業務の効率化と生産性向上
を推進しています。今後は、新たな研修カリキュラムの開発を進めるとともに、現場の課題や
顧客ニーズを起点に新たな価値やサービスを構想する取り組みから得られた知見を蓄積・活
用し、人材育成と事業創出が相互に好影響を生み出す基盤づくりを進めてまいります。
外部企業による経営層向けAI活用研修
54
人
Chapter 1
Chapter 2
Chapter 3
Chapter 4
What is KONOIKE
Where we go
How we do
Data
KONOIKE GROUP Integrated Report 2026
従業員の働き甲斐向上
企業理念の浸透
企業理念の浸透については、従業員一人ひとりがその理念を自分ごととして捉え、
日々の業務の
中で実践につなげていくことが、持続的な成長と企業価値の向上の基盤になると考えています。今
後も、経営層と現場、部門や世代を越えた対話を重ねることで、理念への理解と共感を深め、
グルー
プ全体で同じ方向を目指す組織風土の醸成を進めてまいります。
また、理念を共有するだけでなく、
それぞれの職場で具体的な行動としてどう体現するかを考え、対話し、実践する循環を生み出すこ
とで、“KONOIKE BRAND”を支える意識と行動の定着を図ってまいります。
さらに理念の浸透を
一過性の取り組みに終わらせないため、研修や職場ミーティングのほか、
日々の対話の場において
も理念に立ち返る機会を継続的に設けてまいります。理念と現場の実践を結びつけることで、判断
や行動の質を高め、変化する事業環境の中でもKONOIKEらしさを発揮できる人材と組織づくり
につなげてまいります。
ワークショップ形式の
「カタリバ」
従業員の幸せの追求
健康経営
従業員が心身ともに健康であることは、生産性向上のために必要不可欠である
ウォーキングイベントへの参加を促進することで、
日常的な運動習慣の定着と従業
との考えのもと、当社グループでは定期健康診断を基軸に、従業員の健康管理に
員同士の交流を後押しし、
自己健康管理への意識向上と行動変容につなげていま
努めています。健診結果を健康保持・増進につなげるため、事後措置や保健指導に
す。当社グループの経営理念である
「『人』
と
『絆』を大切に」を健康経営においても
加え、再検査および精密検査費用の補助を実施し、疾病の早期発見にも注力して
実践し、従業員一人ひとりが生き生きと働ける職場づくりを進めてまいります。全
います。
また、2025年3月期からは健診結果管理システムを導入し、健康データの
従業員の健康意識の底上げを図るとともに、健康を支える風土の醸成にもつなげ
一元管理によるタイムリーなケアの実現に向けた環境整備を進めています。
さらに
ていきます。
55
人
Chapter 1
Chapter 2
Chapter 3
Chapter 4
What is KONOIKE
Where we go
How we do
Data
KONOIKE GROUP Integrated Report 2026
エンゲージメントサーベイ
1 目的
従業員のウェルビーイングの実現とエンゲージメント向上に向け、
ウェルビーイン
ショップを通じて現場での理解と行動変容を促し、
各組織が自律的に改善を進める
グサーベイを定期的に実施しています。
その目的は、
組織や職場ごとの現状や課題を
ことで、従業員がより働きがいを感じられる職場づくりと、継続的な組織力の向上、
可視化するとともに、
結果を分析し、
経営層や各拠点の責任者へフィードバックする
サーベイスコアの改善を図ってまいります。
ことで、
具体的な改善行動につなげることにあります。
さらに、
フィードバックワーク
2 調査結果
良好度
6
良好度
モラール
注意度
調査対象者と人数
(2026年3月期)
モラール
モラール:ウェルビーイングの前提となる
集団の士気を測定
5
4.75
4.29
4.31
4
3
2
(管理監督者のみ)、総合職社員計3,257人
専門職社員
モラール
7
ウェルビーイング:ウェルビーイングそのものの測定
設問パートと
調査目的
注意度
4.11
3.23
4.12
3.25
4.16
3.21
1
0
2025年3月期
2026年3月期
2028年3月期
(目標)
(年度)
3 重点施策
2022年より全社的なウェルビーイングサーベイを実施し、
①働く幸せ②働く不幸
を含む組織全体に浸透させることが不可欠であると捉えています。
そのため、
現在は
せ③その組織の状態、
の3指標を定期的に測定しています。
結果に基づき経営層向け
フィードバックワークショップの対象を現場組織長である所長を含む管理職層へ拡
のフィードバックワークショップを継続して行ってきました。
サーベイの活用にあたっ
大し、
現場レベルでの理解促進と行動変容につなげています。
加えて、
タレントマネジ
ては、
各組織の現状や課題を可視化するだけでなく、
結果を踏まえて改善策を検討・
メントシステムを活用し、
各組織長が自組織のサーベイ結果をタイムリーに把握し、
実行し、PDCAサイクルを回しながら継続的な改善へと結びつけていくことが重要
課題に応じた対応を進められる環境整備も推進しています。
組織が自律的かつ継続
であるとの認識を社内で共有しています。
特に、
サーベイ結果の向上には、
個別施策
的に改善を進める体制の定着も目指してまいります。
を積み重ねるだけではなく、
ウェルビーイング向上の意義や目的そのものを管理職
56
人
Chapter 1
Chapter 2
Chapter 3
Chapter 4
What is KONOIKE
Where we go
How we do
Data
KONOIKE GROUP Integrated Report 2026
人権
KONOIKEグループは、企業理念に「『人』と『絆』を大切に、社会の基盤
の影響を引き起こさないだけでなく、助長しないよう取り組みを進めてい
を革新し、新たな価値を創造します」を掲げ、
これを「私たちの使命」
として
ます。
しかしながら、当社グループにおける人権の及ぶ範囲はとても広く、
います。
この実現にあたり、事業活動において影響を受けるすべての人々の
リスクを分析のうえ設定した優先順位に基づいて順次対応を図り、2025
人権が尊重されなければならないという責務を果たす指針として、2023
年から外国人技能実習生と特定技能外国人に対して人権侵害アンケート
年に「KONOIKEグループ人権方針」を定めました。本方針に基づき、事業
調査を行いました。次年度以降も継続的にアンケート調査を行い、人権侵
活動において関係するすべての人々の人権を尊重し、あらゆる人権への負
害リスクを抑え、社会的責任を果たしてまいります。
人権デュー・ディリジェンスの実施
KONOIKEグループは、
国連の
「ビジネスと人権に関する指導原則」
に基づき、
各国・
相談できる多言語対応窓口も設置し、
人権侵害リスクの早期発見に努めています。
ま
地域の法令を遵守するとともに、
人権デュー・ディリジェンスの実効性向上に取り組ん
た、
自社の事業・サービスに関連する負の影響についても、
取引関係を通じた防止・軽
でいます。
グループ全体でeラーニングやサーベイの実施を通じて人権意識の向上と
減に努めています。
こうした取り組みを通じて課題を把握し、
改善策を講じ、
検証する
理解の浸透を図るほか、
「KONOIKEグループ人権方針」
を全役員・従業員に適用し、
PDCAサイクルを回すことで、
問題の未然防止と発生時の迅速な是正につなげ、
グルー
ビジネスパートナーにも支持と遵守を求めています。
さらに、
外国人技能実習生や特
プ全体で継続的な改善に取り組んでまいります。
定技能外国人にアンケート調査を実施、
加えて、
彼らを含む外国籍従業員が母国語で
分類
取り組み内容
人権方針の策定
2023年4月に
「KONOIKEグループ人権方針」
を策定
人権への影響評価
人権DD
予防/是正措置の開示
初期的な人権リスク評価を実施
教育・研修
人権、
ダイバーシティ、
ハラスメント等に関する年次・役職別研修を実施
社内環境・制度の構築
「健康経営優良法人2026(大規模法人部門)」
に認定
心身の健康保持増進、
ワーク・ライフ・バランス推進に向けた施策を展開
サプライチェーンの管理
技能実習生・特定技能外国人を重点対象とした人権侵害アンケート調査を実施
モニタリング
(追跡調査の実施)
従業員エンゲージメント調査を実施
外部への情報公開
Webサイト・本統合報告書等で取り組み状況を開示
苦情処理メカニズムの整備
国内で内部通報窓口である
「コウノイケ通報窓口
(ヘルプライン)
」
を設置・運用中
外国籍従業員が母国語で相談できる窓口を設置・運用中
57
人
Chapter 1
Chapter 2
Chapter 3
Chapter 4
What is KONOIKE
Where we go
How we do
Data
KONOIKE GROUP Integrated Report 2026
ダイバーシティ
KONOIKEグループは、多様な人材がそれぞれの違いを尊重し合い、能
環境整備を進めています。また、相互理解を深め、違いを認め合う対話を重
力を十分に発揮できる組織づくりをダイバーシティ推進の基本的な考え方
ねることで、誰もが安心して意見を発信し、力を発揮できる職場風土の醸
としています。性別、年齢、国籍、障がいの有無、価値観や経験の違いを個
成を重視しています。ダイバーシティを人材戦略の重要な基盤と位置づけ、
性として受け止め、多様な視点を組織の力へとつなげることが、持続的な
多様な人材が活躍することで新たな価値創造や組織の柔軟性向上につな
成長と企業価値の向上に不可欠であると考えています。そのため、働きが
げていきます。今後も、一人ひとりが自分らしく活躍できる包摂性の高い組
いと働きやすさの両立を図りながら、公平に挑戦と成長の機会が得られる
織づくりを着実に進めてまいります。
取り組み
社内研修
女性活躍推進
社内の階層別研修では、
ダイバーシティを自分事として捉えてもらうため、
各階層
女性活躍推進法に基づく行動計画の推進と、
2031年3月期に女性管理職比率
に応じた教育を実施しています。
新入社員にはアンコンシャス・バイアスの理解と実
10%以上を達成するという経営目標に向け、
2025年に取締役会の諮問機関として
践、
中堅層には障がい者雇用の目的理解と促進、
管理職層には男性の育児休業の理
設置した人材戦略委員会の傘下に
「女性活躍推進分科会」
を設置し、
さまざまな課
解と取得促進など、
それぞれの階層に適したテーマを設定し、
講義だけでなく、
ワー
題と向き合い施策を検討しています。
営業所配属の女性総合職も交えて課題や期待
クショップを通じた体験共有と気づきを重視することで、
理解の深化と行動変容に
を共有し、
職場風土や制度の見直し、
新たな施策の検討を通じて、
女性がより力を発
つなげています。
揮できる環境整備を進めています。
技能実習・特定技能
障がい者雇用
2006年から外国人技能実習生の受け入れを進め、
日本の物流管理手法を学ん
さまざまな現場やオフィスにおいて障がい者の方を安定的かつ重要な戦力として
だ実習生は延べ約1,800名にのぼります。
近年は空港グランドハンドリング分野に
雇用し、
働きがいを持って就労できる職場づくりを進めています。
個々の特性や強み
加え、
特定技能外国人についても航空、
飲食料品製造、
工業製品製造、
自動車運送
を把握し、
それぞれに適した業務を担っていただくことで力を最大限に発揮できる
業へと受け入れ分野を拡大しています。
今後も制度の変化を踏まえながら、
外国人
環境を整備しています。
また、
ユニバーサルマナー検定を役員、
管理職全員に取得さ
材がより多くの部門で活躍できる環境整備を進め、
多様性を価値創造につなげて
せ、
多様な方々へ向き合うためのマインドとアクションを体系的に学び身につけてい
まいります。
ます。
58
Chapter 1
Chapter 2
Chapter 3
Chapter 4
What is KONOIKE
Where we go
How we do
Data
特別座談会
KONOIKE GROUP Integrated Report 2026
人的資本経営
人材戦略と現場での新たな挑戦
KONOIKEグループが人的資
本経営を通じて何を目指し、
ど
のような考え方で人材の成長
を支えているのか。事業戦略と
人材戦略のつながりを、
実際に
新たな挑戦を続ける3名の声を
通じてご紹介します。
関東・北日本支店
内田さん
入社以来、
物流センターの現場に従事し、
現在は2拠点目。海外短期研修(インド)
や事業創造プログラム等、社内プロジェ
クトにも積極的に参加している。
ファシリテーター
執行役員
人材開発本部本部長
兼人材戦略担当
川田さん
メディカル本部
事業開発本部
看護師として医療現場で経験を積んだ
後、医療分野の海外支援業務等を経て当
社に入社。
現在はメディカル本部で、
スペ
シャリスト※として医療分野の事業拡大
に関わる。
鉄鋼本部の製鉄所内現場で長く経験
を積んだ後、現在は事業開発本部で、
自社の現場で培ってきた仕組みやシス
テムを他業界や海外に展開していく仕
事に携わる。
安田さん
※特定分野において高い知識・スキルを持つことを
当社内で認定された専門人材のこと
須永さん
59
Chapter 1
Chapter 2
Chapter 3
Chapter 4
What is KONOIKE
Where we go
How we do
Data
KONOIKE GROUP Integrated Report 2026
須永:入社後はお客さまの製鉄所内の現場に配属され、
安田:私は、開発途上国支援や国際協力に関わりたいと思
その後、
お客さま先への出向や本社勤務を経験しました。
い、転職を考えました。前職で企業の海外展開を支援する
現在は事業開発本部で、鉄鋼の現場で生まれた
「コノマッ
中で、
もっと現地の課題に深く向き合いたいと感じたこと
プ」
というシステムを、他業界にも展開していく仕事に携
がきっかけです。
看護師資格を活かして海外支援に関われ
わっています。
る仕事を探す中で、
インドの医療支援に取り組む当社の求
人を見つけました。
内田:入社以来、
物流センターで仕事をしてきました。
現在
は2拠点目ですが、同じ物流センターでも、扱う商品や規
須永:私は現場から本社へと異動することになりましたが、
模によって現場の動き方は異なります。
拠点の良さを活か
今の事業開発本部に来てからは、業界を限定せずに挑戦
しながら新しいやり方も取り入れ、
より働きやすい現場づ
できる面白さを感じています。鉄鋼の現場の課題を解決
くりに取り組んでいます。
川田:皆さん、それぞれ異なる経験を重ねながら、今の仕
事につながっているのですね。そもそも、
当社への入社や
川田:今回は、
それぞれ異なるバックグラウンドを持つ3名
現在の仕事に進むきっかけは何だったのでしょうか。
に集まっていただきました。
まずは現在の仕事に至るまで
の歩みを教えていただけますか。
内田:元々物流業界を志望していたわけではなく、大学時
代に興味を持っていたミャンマーに営業所がある会社を
安田:私は看護師として病院や空港のクリニックなどで働
探していて、当社を知りました。入社後は、現場の方々が
いた後、
医療分野の海外展開を支援するコンサルティング
職人気質で仕事をやり切る姿を見て、
「物流ってかっこい
会社を経験しました。
その後、
当社に入社し、
現在はメディ
い仕事だな」
と感じるようになりました。今はミャンマー
カル本部で医療事業の拡大や人材育成の仕組みづくりな
だけでなく、
インドにも魅力を感じていますし、
アフリカに
どに関わっています。
も行ってみたいと思っています。
60
Chapter 1
Chapter 2
Chapter 3
Chapter 4
What is KONOIKE
Where we go
How we do
Data
KONOIKE GROUP Integrated Report 2026
するためにつくったシステムが、今は他業界にも広がろう
内田:私にとって大きかったのは、
海外短期研修
(インド)
と
としている。
これまでの経験を活かしながら、次の可能性
事業創造プログラムです。
どちらも自分から参加したいと
特に海外で事業を展開しようとすると、
さまざまな人の
に挑戦できる環境だと感じています。
手を挙げました。
最初は、
「やりたい」
という気持ちや勢いが
協力を得ながら、一つひとつ物事を進めていく必要があり
あれば何とかなると思っていたんです。
でも、
実際に企画を
ます。部署異動によって環境が大きく変わったことも大き
川田:きっかけや歩みは三者三様ですが、
それぞれがこれ
形にしようとすると、
それだけでは足りないことに気づきま
な刺激になっていますし、
自分も新しい環境で成長してい
までの経験を活かしながら、
新たな可能性に挑戦している
した。
かなければならないと感じています。
川田:具体的には、
どんなことが必要でしたか。
安田:私は、今年度からスペシャリストとしての役割を担
ています。
ことが共通していますね。
皆さんの挑戦を後押しした社内
プロジェクトや人事制度などの取り組みについて、実際に
どのように感じていますか。
うことになりました。会社が目指す成長の方向性と、
自分
内田:責任感や、最後までやり切る力です。それから、周
の役割が重なっているのだと感じています。看護師として
りの人に目的を伝えて、一緒に動いてもらう力ですね。イ
の経験はありますが、医療制度や業界全体については、
ま
ンドでの研修では
「パッションが大事」
と学びましたが、社
だ学ぶべきことも多いので、
これからも知識を深めていき
内で企画を進める中で、パッションには勢いだけでなく、
たいですね。専門的な知識や経験を周りに伝えたり、事業
責任や忍耐も含まれるのだと実感しました。今は自分一
に活かしたりすることで、新たな価値につなげたいと思っ
人で頑張るのではなく、周りを巻き込みながら、担当する
ています。
現場をもっと活気のある職場にしていきたいと思ってい
ます。
川田:社内プロジェクトや人事制度などの取り組みが、そ
れぞれの挑戦を後押ししていることが分かりました。一方
須永:内田さんの話は、私もよく分かります。私も、事業開
で、皆さんがさらに挑戦しやすくなるために、会社として
発本部という組織横断的な立場に移ってから、
さまざまな
取り組むべきことは何でしょうか。
現場を見る機会が増えました。各現場のリーダーが熱意
を持って相談してくれる姿に触れ、物流はこうした現場の
須永:現場と本社が、お互いの仕事をもっと知ることだと
方々に支えられて成り立っているのだとあらためて実感し
思います。現場を知っている人が本社にいると、課題の伝
61
Chapter 1
Chapter 2
Chapter 3
Chapter 4
What is KONOIKE
Where we go
How we do
Data
わり方も変わりますし、本社の専門部署がどのように支
理解を深めることにもつながるのかなと思います。
えてくれるのかも見えやすくなります。私自身、本社に来
KONOIKE GROUP Integrated Report 2026
事業として成立させ、
持続的に価値を届けられる仕組みを
つくっていきたいですね。
てから、法務などいろいろな専門家に伴走してもらって、
安田:キャリア入社の立場から見ると、当社にはさまざま
内田:海外での業務には以前から挑戦したいと思っている
一人ではできないことを実現できました。
こういうつなが
な経験を持つ人を受け入れる風土があります。一方で、女
ので、
キャリアの早い段階で実現したいです。
一方で、
仕事
りが、
もっと増えるといいですね。
性や異なるバックグラウンドを持つ人が、早い段階から新
と家庭を両立しながら働くことも、
自分が目指す一つの姿
しい仕事に挑戦できる環境は、
さらに必要だと思います。
です。
同じように考えている人も多いと思うので、
自分自身
内田:たしかに現場にいると、
本社でどんな仕事をしている
男性が多い業界でもありますから、例えば女性の所長が
が一つのロールモデルになれればと思っています。
のか、
正直よく分からないことがあります。
でも、
プロジェク
もっと増え、会社として支えられるようになれたらいいで
トで他部門の方と一緒に仕事をすると
「こういうときはこの
すよね。
部署が動くんだ」
と分かるんです。そういう機会が会社の
川田:KONOIKEグループは、
「あらゆるステークホルダー
の方から選ばれる会社」
になることをテーマに人的資本経
川田:ありがとうございます。最後に、
これから挑戦したい
営に取り組んでいます。
この座談会を通じて、多種多様な
ことを一言ずつお願いします。
人材が安心して挑戦し、
学び続けられる環境を整えている
ことが少しでも伝わればと思います。
安田:スペシャリストとして、まずは現場のことをもっと
そして皆さんのように、一人ひとりが自分の経験や強み
知りたいです。その先には、病院をつくることやODA(政
を活かしながら、生き生きと仕事に取り組む姿を見て
「こ
府開発援助)のような取り組みなど、当社だからこそでき
の会社はかっこいいな、面白いな」
と感じてもらえたらう
る社会貢献にも挑戦したいと思っています。社会から当
れしいですね。
社の役割や価値をより広く認識してもらえるような仕事
に携わりたいです。
今日伺った皆さんの思いや経験を、一過性のものに終
わらせるのではなく、人材部門としてもここから具体的な
成果につなげていきたいと思います。皆さん、今日はあり
須永:国外にもアンテナを向けて、現地で何が必要とされ
ているのかを考えていきたいです。
企業や社会の課題を解
決することで、
結果として売上にもつながる。
そうした形で
がとうございました。
62
Chapter 1
Chapter 2
Chapter 3
Chapter 4
What is KONOIKE
Where we go
How we do
Data
技術
technology
KONOIKE GROUP Integrated Report 2026
基本的な考え方
「お客さまと社会の課題解決の生命線である
『現場』
と
『人』の“技術”を強化する。」KONOIKEグループ
では技術を、一般的に言う新技術やデジタル技術だけではなく、従業員個人や現場個々にあるノウハウ
や安全に関わる技術などすべてを含めて
「無形資産」
と捉えています。
この技術を強化して現場力を高め
ることが結果としてお客さまに対する提供サービスの付加価値向上、ビジネスの拡大という持続的な
成長につながると考えています。従って、技術革新本部、ICT推進本部、経営品質本部、営業統括本部な
ど関連する部門が連携して技術強化を進めています。
技術戦略委員会
前中期経営計画では、
サステナビリティ委員会
傘下の技術資本ワーキンググループにおいて、
KONOIKEグループの現場に蓄積された事業ノウ
ハウを技術資本ライブラリに取り込み、
データベー
ス化を進めるとともに、
現場における改善や新技術
の導入を推進してまいりました。
今後は技術戦略委員会において、
このデータベー
スを基に先端技術の研究や現場導入技術の標準化
などの取り組みを全社戦略と整合させながら積極
的に推進してまいります。
Step 1
前中期経営計画
技術資本ワーキンググループ
●
現場に眠る技術の吸い上げ
●
無形資産としてのKPI決定
Step 2
中期経営計画2027
技術戦略委員会
技術関連テーマやシステム投資について、
現場ニーズを踏まえて関連部門が連携し、
全社戦略と整合した取り組みを推進する。
63
技術
Chapter 1
Chapter 2
Chapter 3
Chapter 4
What is KONOIKE
Where we go
How we do
Data
取り組み
現場
効率的かつ迅速に技術・システム展開
検討テーマ
技術資本ライブラリ
1 (データベース)
2
技術革新本部
ICT推進本部等
KONOIKE GROUP Integrated Report 2026
3
現場×技術革新本部/
ICT推進本部等での
取り組み
技術戦略
委員会
●
横展開が期待できる共通技術
●
注力自動化技術、
技研ICでの実験機器
●
注力するシステム 等
事業本部
技研ICでの実証実験
注力倉庫や大型投資案件に対し、
技術・システム目線で連携
4 システム導入(新統合WMS等)
技術資本ライブラリ
KONOIKEグループでは、現場ごとに実施している自動化や省力化の取り組
みを全社で共有するためのデータベースを設置しています。このデータベース
では、ソリューションや改善作業、改善効果など、さまざまな切り口から事例を
検索できるほか、担当者同士が情報交換を行える仕組みも備えています。現在、
毎月約1,000件のアクセスがあり、積極的に活用されています。
64
技術
Chapter 1
Chapter 2
Chapter 3
Chapter 4
What is KONOIKE
Where we go
How we do
Data
KONOIKE GROUP Integrated Report 2026
技術革新
KONOIKEグループの事業競争力は「より魅力的なサービス提供」にか
イノベーションの加速」③お客さまの将来構想にも合致した技術開発の検
かっており、近年の物流・倉庫業界におけるさまざまな変化に対応してい
討などの「営業活動の一環」
としても機能させ、技術革新の最前線としてイ
く上で、“さらなる高み”を目指す現場での革新が重要であると認識してい
ノベーションを加速してまいりました。
これらの取り組みに加え、技術革新
ます。そのために、2021年3月には鴻池技術研究所イノベーションセンター
を全社に浸透させるためのリテラシー教育や、現場改善活動の展開を加速
(技研IC)を開設し、①KONOIKEグループの多岐にわたる現場を技研
するためのIE教育を実施しました。
こうして、現場と共に進めてきた改善の
ICに再現し、新技術の実効性や導入後のオペレーションの確認などを行う
取り組みが少しずつ実を結んできています。今後も現場力の強化に直結す
「実証・実験」②社内に限らず、お客さま、新技術のベンダーさまにも技研
る技術革新を進めていきます。
ICにお集まりいただき、再現現場や新技術を見ながら議論する「オープン
取り組み事例
1
フォークリフトの安全運転を
シミュレーション技術により評価
これまで生産性向上やレイアウト検証を中心に活用してきたシミュレーションを、安全性向上にも展開して
います。
フォークリフトによるパレット搬送や旋回時の荷物挙動を対象に、荷姿や高さ、旋回速度などの条件を
変えて振れ幅や転倒リスクを評価し、安定性に影響する要因を可視化しました。今後は得られた知見を作業方
法や運転条件の改善に活用し、安全対策の高度化につなげます。
65
技術
Chapter 1
Chapter 2
Chapter 3
Chapter 4
What is KONOIKE
Where we go
How we do
Data
取り組み事例
KONOIKE GROUP Integrated Report 2026
2
AI-OCRによるピッキング・検品技術の支援と拡充
物流現場では、すべての貨物にバーコード等の識別子が付与されているわけ
合・判定までを一連で支援する仕組みを開発しました。現場導入を通じて機能
ではなく、現場側で一律に付与することも難しいため、現品や帳票を目視で確
を改善・共通化し、特定の現場にとどまらず、他の現場や事業にも横展開するこ
認・照合する作業が多く残されています。こうした物流特有の条件に対し、既存
とで、幅広い業務の効率化につなげています。
のラベルや帳票の情報を活用するため、AI-OCRによる撮影・文字認識から照
検品(現品照合)
スマホアプリを開発
梱包・出荷
撮影
OCR 読み取り
DB 突合
ピッキング指示
検品
OCR
検品
66
技術
Chapter 1
Chapter 2
Chapter 3
Chapter 4
What is KONOIKE
Where we go
How we do
Data
KONOIKE GROUP Integrated Report 2026
ICT・DX
取り組み事例
1
生成AIで挑む業務変革と人材育成 ~「AI is Everywhere」をスローガンに~
当社は、
業務変革と新たな価値創造の実現に向けて、
組織横断型の
「生成AI活用プ
を設計し、各部門で活用を主導するAIアンバサダーを育成。全社的なAIリテラシー
ロジェクト」
を本格始動し、
「基盤構築」
「AI人材育成」
「ユースケース創出」
「ガバナン
向上を図るとともに、
自部門の課題解決を担う人材層の拡充を進めています。
ガバナ
ス整備」
の4本柱を同時並行で推進しています。
基盤面では、
社内ナレッジを横断検索
ンス面でも、利用者ガイドラインの整備やAIガバナンス協会への加入を通じて、安
できるAIプラットフォームを導入し、
安全かつスケーラブルに活用できる全社AI基盤
心・安全な活用体制を構築しています。
を整備しました。
あわせて、
事業・コーポレート両部門において現場起点の業務ユー
今後は
「AI is Everywhere - AIの力をすべての現場に」
を掲げ、
AIを前提とした業
スケースを内製で開発し、
定型業務の自動化や意思決定の迅速化など、
具体的な業
務プロセスの再設計と新たな価値創造に取り組み、
持続的な競争力強化と従業員の
務変革につなげています。
人材育成では、
経営層から現場までを対象にレベル別研修
ウェルビーイング向上の両立を目指します。
生成AIで挑む業務変革と人材育成
AI is Everywhere
AIの力をすべての現場に
1 基盤構築
2 AI人材育成
全社AIプラットフォーム/
横断検索・要約
4 ガバナンス整備
利用者ガイドライン/
AIガバナンス協会加入
階層別研修/
コミュニティー形成
ICT横断型
生成AI活用
プロジェクト
3 ユースケース創出
事業・コーポレート
両部門で内製開発
67
技術
Chapter 1
Chapter 2
Chapter 3
Chapter 4
What is KONOIKE
Where we go
How we do
Data
取り組み事例
KONOIKE GROUP Integrated Report 2026
2
現場の知見を全社価値へ ~新統合物流システムによる標準化とデータ活用~
当社の強みは、
現場に蓄積されたナレッジやノウハウにあります。
ICT推進本部で
タについては、
現場の稼働状況や業務進捗をリアルタイムに把握するだけでなく、
分
は、
その強みを個別拠点にとどめることなく全社の競争力へとつなげるため、
新統合
析を通じて課題の発見や改善に活用しています。
経験の有無にかかわらず、
現場担当
物流システムの機能拡充を進めています。
2026年3月期は、
現場で培われた業務知見
者一人ひとりが同じ指標に基づいて状況を的確に捉え、
自律的に判断し改善につな
や運用を標準機能として取り込み、
各拠点で横断的に活用できる基盤の整備を進め
げられる運用を推進するとともに、
より精度の高い意思決定につなげる環境整備を
ました。
これにより、
業務運用の標準化を促進するとともに、
物流倉庫全体の生産性
進めています。
今後は、
周辺システムとの連携も進め、
必要なデータを必要な時に把
向上とサービス品質の底上げを図っています。
握・活用できる環境を整備することで、
全社的なデータ活用文化の定着と、
物流現場
また、
システムに蓄積される入出庫・在庫やハンディターミナルより得られるデー
1
現場の知見・運用
拠点 A
2
の生産性・品質向上を通じた企業価値向上を目指します。
標準化
3
新統合物流システム
全社横展開
生産性向上
サービス品質向上
拠点 B
運用改善
リアルタイム
可視化・KPI 管理
拠点 C
データ基盤
現場データを蓄積・活用
現場の知の標準へ、標準を全社の力へ
68
技術
Chapter 1
Chapter 2
Chapter 3
Chapter 4
What is KONOIKE
Where we go
How we do
Data
KONOIKE GROUP Integrated Report 2026
安全品質活動体系
KONOIKEグループの安全品質活動は、年初に発表する経営品質方針に
事業所の中から、対象事業所を選定し、
ヒヤリハット活動を阻害する要因を
基づき展開します。本社の経営品質方針に基づき、各営業所で、当該年の活
4M5E分析した上で、
どうすればヒヤリハット活動が活性化するのか対策を
動を実行計画書に落とし込んだ後、SDCAのサイクルを回して活動を進めて
工程表に落とし込み、
その工程表の進捗状況の確認を含め、本社安全品質部
いきます。個別の課題が発生した場合は、解決するためのPDCAを回し、改
と各経営品質専任者・担当者が合同でWeb会議により、進捗確認を行う活
善された手順が標準化された時点で、再度SDCAに戻り、活動を回す仕組み
動を展開しました。基本的に、安全品質活動は、各本部長の指揮命令のもと、
となっています。また、上記の日常の安全活動とは別に、毎年本社安全品質
支店長、各営業所長の順に展開する体制で進めており、各支店・関係会社に
部と各経営品質専任者・担当者が一緒になり、個別課題に対する取り組みを
配置されている経営品質専任者・担当者が、経営品質本部からの個別サポー
展開しています。2026年3月期においても昨年に引き続き、
ヒヤリハット活動
トを受け、各営業所の活動支援を行っています。
の活性化をテーマに取り組みました。各経営品質専任者・担当者が管轄する
本社・支店
営業所
BAD:是正
GOOD:継続 BAD:改善
経営品質方針
支店長方針
S tandard
P
標準化
lan
計画
安全品質運輸
マネジメントシステム
安全衛生
D o
❶ 安全衛生管理体制の確立
❷ 職場小集団の活性化
❸ 安全人づくり
❹ 指差呼称確認の実践定着
❺ 職場4Sの確立
❻ 危険有害要因の排除
現場活動
品質
❼ 品質活動
運輸
❽ 運輸安全
安全衛生・品質・運輸合わせて、
8本柱にて活動
審査
安全品質運輸
マネジメント
システム
C heck
評価・確認
A ction 重点課題に
対する活動
改善
C heck
評価・確認
D o
実行
69
技術
Chapter 1
Chapter 2
Chapter 3
Chapter 4
What is KONOIKE
Where we go
How we do
Data
KONOIKE GROUP Integrated Report 2026
安全に関する取り組み
安全体感教育
個人の安全意識向上を目的に、
2020年3月期より安全体感教育を行っています。
本教育では実機を使った挟まれ体験や、
ミス防止に役立つ指差呼称の体験の他、
VR
(バー
チャルリアリティ)
を使った転倒災害体験、
フォークリフトとの擬似接触体験等を実施しています。
VR研修は特に経験の浅い若年層と事故率の高い高齢層に対し、
より現実的
な事象を通じて、
意識向上を図る目的で開始しました。
また、
業務で忙しい従業員に向けて、
各事業所へ機材を持って出張する出張体感教育も実施しています。
自動車事故防止のための取り組み
2024年3月期より、実際に起きた事例を映像で確認する危険予知トレーニン
に対応するべきか受講者一人ひとりが考えるというものです。先行して全車両に
グを実施し、一層の当事者意識を持てるよう取り組みを行っています。これは加
ドライブレコーダーの導入が完了していたことから、既に400件を超える事例が
害・被害にかかわらず、当社従業員が運転中に経験したニアミス事例の映像デー
映像で共有されており、
この教育を通じて交通事故を未然に防ぐことを狙いとし
タを教材とすることで、さまざまな状況下で危険が潜むことを理解し、
どのよう
ています。
ドライバーコンテスト
毎年KONOIKEグループのトラックドライバーコンテストを中部トラック総合研修センターにおいて開催しています。各事業所代表のドライバーが中型車、大型車、
トレーラ各部門に分かれ学科試験、点検競技、省エネ運転競技、実技競技の合計点で順位を競います。また当日は、ディーラーさま、愛知県トラック協会さまのご協力
により競技内容に即した講習会も実施されます。
70
技術
Chapter 1
Chapter 2
Chapter 3
Chapter 4
What is KONOIKE
Where we go
How we do
Data
KONOIKE GROUP Integrated Report 2026
品質に関する取り組み
お客さま満足への取り組み
品質はお客さまとの信頼関係をつくる非常に大切な要素であり、
K-QMS
(コウノ
イケ クオリティ マネジメントシステム)
活動を展開しています。
お客さま訪問によるヒアリングなど、
お客さまとのコミュニケーションの中から、
トシステムの中で進捗を確認しています。
またトラブル発生時には、
当該事業所で是
正措置、
予防措置を行った後、
社内イントラで全社に伝達・共有し、
同様のトラブルの
再発防止を行うシステムとなっています。
お客さまのニーズを探り出し、
年初目標を定めるとともに、
安全品質運輸マネジメン
内部監査員の養成
K-QMS活動では営業所間相互で内部監査を行っています。内部監査の目的は、定めたK-QMSが得意先要求や法規制に適合して構築されているか、その効果はどう
か、などといった観点から制度の運用状況を確認することです。内部監査を実施するにあたってはその知識を持った内部監査員の育成が重要となり、年1回本社安全
品質部主催の内部監査員養成研修を実施しています。
取引先との関係構築
業務遂行にあたっては、
パートナー企業さまとの協業が欠かせません。
安全・品質の
ラック輸送事業各社さまについては、
経営方針、
事業計画、
運行管理やドライバー、
車
向上について、
思いを一つにするために、
積極的なコミュニケーションを図っています。
両の管理状況、
安全活動などについて確認させていただいています。
また、
構内請負、
各営業所では、
パートナー企業さまとの協議会を設けたり、
同じテーマで安全活動を
派遣のパートナー企業さまについては、
法的常備書類や各種保険加入状況、
雇用契
行ったりするなど、
工夫をしながら一体的な活動を行っています。
加えて、
年に1回パー
約に加え、
安全衛生活動状況などの確認をさせていただいています。
2026年3月期は
トナー企業さまを訪問し、
安全活動や品質活動、
遵法の状況について情報を共有し、
お
パートナー企業さま591社を訪問しました。
互いのレベルアップを図っています。
その際に
「協力会社管理体制評価表」
に基づき、
ト
71
技術
Chapter 1
Chapter 2
Chapter 3
Chapter 4
What is KONOIKE
Where we go
How we do
Data
KONOIKE GROUP Integrated Report 2026
社内表彰制度
鴻池大賞
安全・交通・品質に関して優れた功績をあげた事業所・個人および優秀な活動を行った事業所に対しては、毎年5月の会社創立記念日に、
「鴻池大賞」
として表彰する制度
を設けています。2026年3月期については、安全部門で16件、交通部門で49件、品質部門で21件、功労部門で26件、優秀活動部門で67件、安全品質活動発表会部門で8
件、
計187件の事業所・個人が表彰されました。
表彰事例
製造ラインの停止・製品のはじかれを減らし、
安全・品質・働きやすさを高める
取り組み内容
製品によっては、
月1回・少ロットの製造計画があります。
全体への影響は少ない。
だからこそ、
トラブルを受け入れてしまう——。
山口営業所にあったそんな空気を、
「それで
はダメだ」
と変えたのが、
今回の改善活動です。
設備の動きをよく見て、
現場の違和感を言葉にし、
得意先とも相談しながら、
一つずつ確かめていきました。
STEP
01 「仕方ない」
を疑う
製造頻度が少ないから、
耐えればいい。
そんな受け止め方が当たり前になっていました。
でも、
毎回の停止や排斥処理は、
確実にオ
ペレーターの負担になっている。
まずは、
その“仕方ない”を疑うことから始めました。
STEP
02
違和感を、
原因まで追う
設備の動きを観察すると、
ラベルの装着不良をはじめ、
ラベルが斜めになったりして搬送中にズレていることが見えてきました。
長
さが短いラベルの場合、
吸着エリアに届かない。
必要な場所でエアー※が働いていない。
現象で終わらせず、
真の原因を探りました。
※ ラベル類は極薄のプラスチックでできており、
シュリンクラベラー内で排出・吸引など補助エアーを活用します
STEP
03
自分たちで、
直してみる
補助エアーを追加し、
過去の改造で残っていた部品も再利用。
得意先に提案し、
設備内の半分のヘッドで試す許可を得て、
加工・交
換まで自社で実施しました。
うまくいく保証がなくても、
できることを一つずつ試しました。
改善効果
安全品質活動発表会部門で最優秀賞を受賞した山口営業所
❶シュリンクラベラー設備の単体
稼働率95.13% → 99.46% 向上 /設備停止時間 163分 → 23分
❷製品の排斥率
0.20% → 0.04% 削減 /排斥製品を処理する作業負荷も低減
❸有効活用できる時間
型替え時間約1,320分/年削減
削減
72
Chapter 1
Chapter 2
Chapter 3
Chapter 4
What is KONOIKE
Where we go
How we do
Data
環境
environment
基本的な考え方
私たちKONOIKEグループの事業活動は経済社会に貢献する一方で、地球環境には負荷をかけていることも事
実です。
KONOIKEグループは持続可能な発展のために地球環境問題への取り組みを進めています。事業の性質上、必
然的に温室効果ガスを排出することから、
その削減に向けた努力はKONOIKEグループのすべての事業所にお
いて必須です。KONOIKEグループは京都議定書が発効した2005年に環境基本方針を策定し、環境における基
本理念と5つの行動方針を定めました。
これらをもとにそれぞれの事業所で環境目標を設定し、
その達成に向け
て取り組んでいます。
また循環型社会の一翼を担う静脈物流やリサイクル事業を行うなど、
グループの事業特性
を活かし、社会が抱える環境課題に真正面から取り組んでいます。
TCFDに基づく情報開示
KONOIKEグループは気候変動が地球環境や人類、企業活動に影響を与える重要な
課題であると認識しており、持続可能で豊かな社会の実現に貢献するためにも、地球
温暖化の緩和に向けた活動を積極的に推進しています。KONOIKEグループは2022
年6月にTCFDへの賛同を表明しました。TCFD提言に基づく情報開示では、
「ガバナン
ス」
「戦略」
「リスク管理」
「指標と目標」
の4項目が、開示推奨項目とされています。
この項
目に沿って当社グループでも取り組みを進めていくとともに、一層の情報開示の充実
化を進めてまいります。
KONOIKE GROUP Integrated Report 2026
73
環境
Chapter 1
Chapter 2
Chapter 3
Chapter 4
What is KONOIKE
Where we go
How we do
Data
KONOIKE GROUP Integrated Report 2026
ガバナンス
取締役会
サステナビリティ委員会を取締役会の諮問機関として設置し、
取締役会の監督の下、
気候変動に係る事項
を含むサステナビリティに関する課題についての討議を行っています。
また取締役会では、
同委員会の評価結果を踏まえ、
KONOIKEグループの2030年ビジョンと中期経営計
画で掲げる
「環境」
の非財務目標を策定しており、
その進捗状況についてもモニタリングを実施しています。
なお、
同委員会傘下の環境部会では、
毎四半期、
各本部の環境データをもとに本部ごとの環境取り組み状
サステナビリティ委員会
委員長:取締役会で選任
開催:年 4 回程度
その他 2 部会
環境部会
部会長:経営品質本部本部長
開催:年 4 回程度
況について情報共有し、
気候変動を含むそれぞれの課題に対する具体的な解決策を議論しています。
また、
同部会には社外有識者1名を招くなど、
公正性・客観性の確保に努めています。
環境小部会
戦略
気候変動の顕在化による事業上のリスクや機会を特定するとともに、
中長期戦略を策定しています。下表は特定したリスクと機会の概要です。
分類
影響
時間軸
対応方針
政策・
法規制
炭素税の導入等に伴う租税負担増による業績悪化の可能性
中期
自社の契約電力は25年3月期までにすべてCO2フリー電力に切り替え済み。
また、
運行効率の向上・低炭素技術の導入により排出原単位の削減努力を継続
技術
政策変化や法規制の強化に伴い、
低炭素に資する新技術導入
の必要性が高まり、
設備代替・新設コストが嵩む可能性
短・中期
急性
台風・河川氾濫等の気候変動に起因する災害が増加し、
自社
拠点が被害を受け、事業継続が危ぶまれる可能性
長期
BCPの高度化(災害対応工事、移転、停電・断水対策等)
を図る
慢性
気温上昇に伴う労働環境の暑熱化による生産性悪化および
採用困難化の可能性
長期
暑熱環境下でも労働負荷を軽減する施策(冷風機・ネッククーラー等)
を講じ、労働
衛生を維持すると同時に、技術導入・DX化による省人化も推進
資源効率
CO₂排出削減等の環境対応強化によるお客さまへの訴求力
獲得を通じた取引機会拡大の可能性(逆に、
うまく対応でき
なければ取引機会を失う可能性)
短・中期
新市場
CO₂排出削減への取り組みが進む社会において市場の拡大
が予想される事業領域・分野への進出の可能性
短・中期
移行
リスク
物理的
機会
(注)時間軸の考え方
短期:1年、
中期:3年、長期:4年以上
●
●
生産性の向上や自社施設への太陽光パネル設置等での原資創出により、普及
フェーズに達した低炭素技術は適時導入を図る
料金改定による代替コストの一部収受
運行効率の向上、製造・サービス提供プロセスの生産性向上や、
モーダルシフト・共
配の推進等
業界ごとに成長分野を見極め、機会の獲得に向けた情報収集や経営資源の拡充を
図る
74
環境
Chapter 1
Chapter 2
Chapter 3
Chapter 4
What is KONOIKE
Where we go
How we do
Data
KONOIKE GROUP Integrated Report 2026
上記で洗い出したリスク・機会項目のうち
「炭素税影響」
について、
国際エネルギー機関
(IEA)
のWorld Energy Outlook2024を参照し自社に与える影響額を試算しました。
ただし、
本分析は現時点で可能な取り組みとして試算を行ったもので、
あくまで大まかなイメージを示したに過ぎない点にご留意ください。
各ケースの説明
2030年
2050年
備考1
影響額
影響額
検討ケース
非対応(BAUケース)
▲41億円
▲58~91億円
会社目標達成ケース
▲27億円
影響なし
検討ケース
※ 上記は下記前提に基づき各年の想定CO2排出量と
備考2
備考2
の炭素価格を単純にかけ合わせて算出した数値。
炭素価格の前提(単位:円/t-CO2)
非対応(BAUケース)
概ね24/3期実績の排出原単位のまま2030年・2050年を迎え
たケース
会社目標達成ケース
会社目標(2030年:35%削減(2018年度比)、2050年カーボン
ニュートラル)
が実現できたケース
備考3
前提
2030年
2040年
2050年
STEPS※1
21,000
22,350
23,700
NZE※2
21,000
30,750
37,500
※1 Stated Policies Scenario。
WEO2024で設定されている、
既に世界で公表・実施されている政策イニシアティブなど、
各国政府の現在の計画を組み込んだシナリオ
※2 Net Zero Emissions by 2050 Scenario。
WEO2024で設定されている産業革命前からの温度上昇を1.5℃以内に抑
えるシナリオ
内容
●
2030年・2050年の業績・CO2排出量の前提
2024年3月期の当社グループ各事業におけるCO2排出量・CO2排出原単位に基づき、将来
の事業計画(2030年ビジョン)
が実現された場合の2030年度CO2排出量を算出した。
また
その時点から2050年まで日本国全体の成長率(CAGR1%)並みで当社グループが成長す
ると仮定した場合の2050年時点の売上高を算出した。
●
2030年・2050年のCO2排出量は
備考1
の各ケースの前提に従い算出。
※ 炭素価格については、
STEPSはEUの値を、
NZEは
「ネットゼロ目標を持つ先進国」
の値を1USD=150.00円で換算
リスク管理
サステナビリティ委員会
全社にわたるリスク情報は、
気候関連リスクは
「環境部会」
で、
その他のリスクは、
各部会からの情報を集約
する形で
「リスクマネジメント部会」
(部会長:全社のリスクマネジメント担当)
で把握・管理しています。
気候関連リスク・機会の識別・評価については、
まず事務局部門
(環境、
経営企画、
総務、
財務経理等)
にて、
リスクマネジメント部会
●
KONOIKEグループにとって関連の深い機会項目の洗出し、
および機会発現の時間軸、
影響度・発生確率の評
気候変動リスクも含めた、
各部会が管理するリスク・
情報の把握・管理
環境部会
●
気候変動リスクの管理
価を実施したのちに、
「環境部会」
傘下の
「環境小部会」
を通じ、
各事業部門で考えられる機会項目の抽出、
およ
び時間軸、
影響度・発生確率の評価を実施しています。
これらを事務局部門にて集約し、
グルーピング・整理作
共有
業を経て上記の一覧表に取りまとめました。
気候関連リスク・機会の管理については、
環境部会傘下の
「環境小部会」
にて、
リスクへの対応や機会獲得に関
わる各本部取り組みの進捗について定期的に報告されています。
それに応じ、
リスクや機会項目の洗替え・更新
などを継続的に実施しています。
同内容は環境部会に報告後、
リスクマネジメント部会にも報告しています。
進捗報告
その他の部会
●
分野別のリスク情報の
把握・管理
進捗管理
環境小部会
●
リスク低減の取り組み
75
環境
Chapter 1
Chapter 2
Chapter 3
Chapter 4
What is KONOIKE
Where we go
How we do
Data
KONOIKE GROUP Integrated Report 2026
指標と目標
当社グループではカーボンニュートラル実現に向け、
中期経営計画2027のCO2排
2027年3月期もこれらの取り組みを継続・拡大するとともに、
FCEV大型トラック
を5台導入の上、
幹線輸送の実証実験へ参画する等、
FCEV開発・普及のための先進
出量削減目標を28%削減
(2019年3月期比)
と掲げました。
2026年3月期は自社契約電力における100%CO2フリー電力の利用を進めるとと
的な取り組みを行ってまいります。
また全社的な環境啓蒙活動である
「KONO-ECO
もに、
環境配慮車両への更新促進、
EVトラック3台・FCEVトラック1台の導入、
バイ
活動」
を本格稼働させ、
車両の省エネ運転・節電・節水・ペーパーレスの4分野で省エ
オディーゼル燃料の導入拡大に取り組みました。
その結果、
CO2排出量は30.7%削
ネを推進することで、
ハード・ソフトの両面から脱炭素経営をさらに深化させてまい
減となり、
中期経営計画2027の削減目標を達成している状況にあります。
ります。
CO₂排出量の削減イメージ
CO₂排出量実績(単位:t-CO2e)
2026 年3月期
範囲
117,002t-CO2e
Scope1
17,641t-CO2e
Scope2
目標に対する達成度
対策をしない場合の
シナリオ
2019年3月期比30.7%削減
カーボンニュートラル
実現シナリオ
※1 GHGプロトコルに基づき算定
※2 Scope2はマーケット基準
時期
目標
2028年3月期
28%削減
(2019年3月期比)
2050年
対象
35%削減
(2019年3月期比)
鴻池運輸㈱および
国内連結子会社
削
減
・
吸
収
量
範囲
Scope1・2
再生可能
エネルギー
(基準量)
排
出
量
排出量
排出削減量
実質排出量
カーボンオフセット
CO₂排出量削減目標
2031年3月期
CO2
2019年
3月期
(基準年)
実質CO ゼロ電力への切り替え
バイオディーゼル燃料 など
●
2
●
積載効率向上
18PLトラック導入
●LEDへの切り替え など
●
省エネルギー
カーボンニュートラルを目指す
カーボン
ニュートラル
35%減
2031年
3月期
カーボン
オフセット
2050年
カーボンクレジットでの対応
森林保護活動、植樹
●アマモ育苗 など
●
●
●
EVトラック、
FCVトラック
水素エンジン
●軽油代替燃料 など
●
新技術
●
KONOIKEグループは国際的なNGOであるCDPからの調査にも回答しています。
2026年3月期は、気候変動質問書と水セキュリティ質問書へ回答しました。
76
環境
Chapter 1
Chapter 2
Chapter 3
Chapter 4
What is KONOIKE
Where we go
How we do
Data
KONOIKE GROUP Integrated Report 2026
カーボンニュートラル実現に向けて
再生可能エネルギー
KONOIKEグループでは、
再生可能エネルギーの活用を進めています。
電力では、
2022年3月期から2025年3月期までの4年間で、
135拠点すべ
ての自社設備の電力契約を実質CO2ゼロ電力へ切り替えました。その結果、
年間約23,800t-CO2eの削減効果を生み出しています。
また軽油では、
廃食油由来のバイオディーゼル燃料を導入しています。
B5燃料を国内7拠点のトラックにて、
B30燃料を空港施設内の空港内作
業車両にて使用し、
2026年3月期において69t-CO2eの削減効果を生み出しました。
併せて、
従業員の家庭から出る廃食油を回収し、
燃料の原料に
リサイクルする活動も実施しています。
今後もさらなる再生可能エネルギーの活用によるCO2排出量削減に取り組んでまいります。
省エネルギー
輸配送サービス時の省エネルギー取り組みの1つとして、
全長25mのダブル連結ト
ダルシフトを推進しています。
日本国内では東京貨物ターミナル駅
(JR貨物)
構内で稼
ラックの運行を行っています。
本取り組みはNEXT Logistics Japan株式会社と共同で実
働する
「東京レールゲート営業所」
を中心に、
24拠点にて実施しています。
海外では、
イ
施し、
現在4台導入しています。
ダブル連結トラックは大型トラック2台分の荷物を1名の
ンドにおいて西インド主要3港と北インド・デリー周辺までを結ぶ区間で鉄道によるコ
ドライバーで輸送可能なため、
トラックドライバー不足への対策につながるだけではな
ンテナ輸送
(ICD)
を実施するとともに、
自動車専用輸送車両による完成自動車の鉄道
く、
2台で輸送した場合と比較し、
年間約35%のCO2削減効果があると見込んでいます。
輸送
(AFTO)
事業も行っています。
2026年3月期には、
約89,500tのCO2排出削減効果
また、
トラックの代わりに輸送時のCO2排出量が少ない鉄道や船舶を利用するモー
を生み出しました。
77
環境
Chapter 1
Chapter 2
Chapter 3
Chapter 4
What is KONOIKE
Where we go
How we do
Data
KONOIKE GROUP Integrated Report 2026
新技術
※
CO2排出量削減への取り組みの一環として、乳業業界として初の冷蔵機能を備えた燃料電池トラック
(FCEV)
を江崎
グリコ株式会社と共同で導入し、2026年1月20日より運用を開始しました。本車両は、岐阜工場で製造した学校給食用牛
乳を地元の小学校に届けます。従来のディーゼルトラックと比較して、年間約29.9トンの二酸化炭素(CO2)
の排出削減を
見込んでいます。
※FCEVは、Fuel Cell Electric Vehicle(燃料電池電気自動車)
の略称で、
水素と酸素の化学反応によって電気を生み出し、
その電力でモーターを駆動する車両です。
排出は水のみで、CO₂やNOxなどの有害物質を排出しません。
カーボンオフセット
KONOIKEグループは大阪発祥の企業として、
2013年から大阪湾の環境保
全に取り組むNPO法人の活動に参加し、
アマモの移植活動を実施しています。
アマモは沿岸域に分布する海草の一種で、
CO2の吸収源
「ブルーカーボン」
とし
ても注目されています。
近年では沿岸域の開発によって、
アマモの群生エリア面
積が減少していることから、
当社グループの事務所や社員の自宅にて、
大阪湾か
ら採取されたアマモの種子を育苗し、
大阪湾へ移植するという活動を毎年行っ
ています。
当初は大阪本社のみの活動でしたが、
近年では活動規模を拡大し、
全
国15拠点でアマモの育苗を実施しています。
これまでに当社が移植したアマモ
は292苗にのぼり、
そのCO2吸収量は305kg‐CO2eになると試算しています。
アマモの育苗
アマモの移植の様子
サプライチェーンへの取り組み
KONOIKEグループでは、
サプライヤーエンゲージメントの取り組みとして、
2023
年3月期よりグループ各事業所における一次輸送協力会社・作業協力会社を対象に、
環境関連活動や社会全体のトレンドを含む情報共有を行う説明会およびアンケー
ト調査を実施しています。
2026年3月期では計190社に対してアンケート調査を実施し、
環境に関する規程・
方針・目標設定の有無、
エネルギー使用量・CO2排出量の算定有無等をヒアリングし
ました。
今後も協力会社との定期的なコミュニケーションを実施し、
エンゲージメント活動
を強化してまいります。
78
Chapter 1
Chapter 2
Chapter 3
Chapter 4
What is KONOIKE
Where we go
How we do
Data
KONOIKE GROUP Integrated Report 2026
基本的な考え方
ガバナンス
governance
当社は、
「『人』
と
『絆』
を大切に、社会の基盤を革新し、新たな価値を創造します」
という企
業理念を実践していくことにより、誠実に社会的責任を果たし、広く社会から信頼を得て、
継続的な企業価値向上を目指すことを重要なミッションと位置づけています。
この考え方に基づき、事業活動を通じて、
すべてのステークホルダーと良好な関係を築
き、迅速で効率的、健全かつ公正で透明性の高い経営を推進するため、経営の監督機能強
化や情報の開示に取り組むなど、適宜必要な施策を実施しています。
コーポレート・ガバナンス
体制図
(役員の指名・報酬)
監査
監査役会
取締役会
会計監査人
経営会議
連携
(内部統制の強化)
内部統制委員会
連携
社長執行役員
(最高執行責任者)
人事・報酬委員会
サステナビリティ委員会
リスクマネジメント部会
情報セキュリティ部会
環境部会
連携
内部統制推進部会
(2030年ビジョンの推進)
内部監査室
執行役員
各本部長
(業務執行責任者)
人材戦略委員会
技術戦略委員会
ロジスティクス戦略委員会
監査
業務執行部門・グループ会社
79
Chapter 1
Chapter 2
Chapter 3
Chapter 4
What is KONOIKE
Where we go
How we do
Data
ガバナンス
KONOIKE GROUP Integrated Report 2026
コーポレート・ガバナンス強化のあゆみ
2003
2006
2011
2013
2015
2017
2018
執行役員制度導入
監督と執行
の分離
2019
2021
2022
2024
2025
(年度)
社長の職位を社長執行役員に変更
取締役の任期を1年に変更
取締役の半数以上を社外取締役
1名
社外取締役
社外監査役
2名
3名
2名
人事・報酬委員会設置
統合委員会設置
(2021年11月よりサステナビリティ委員会に変更)
請負戦略委員会
各種委員会
ロジスティクス戦略委員会
内部統制委員会
人材戦略委員会
技術戦略委員会
東京証券取引所市場第一部に上場
プライム市場に移行
株式報酬型ストック・オプションの導入
(2021年に廃止)
その他
譲渡制限付株式報酬制度の導入
取締役会の構成
取締役会
人事・報酬委員会
女性
取締役会は、経営の監督と執行の分離を明確にするため、取締役8名のうち4名、監査役
4名のうち2名は社外役員で構成(2026年6月23日現在)しています。また、社外役員6名
全員を東京証券取引所の定める独立役員として届け出ています。2019年6月には取締役会
女性
社外
社外
社外
社外
独立
役員
独立
役員
独立
役員
独立
役員
答申
社外
社外
社外
社外
委員長
独立役員
独立
役員
独立
役員
独立
役員
諮問
の諮問委員会である「人事・報酬委員会」を設置し、コーポレート・ガバナンスのさらなる強
化を進めています。
取締役
(8名)
2026年3月期の出席状況
地位
代表取締役会長兼社長執行役員
(議長)
取締役専務執行役員
社外取締役
※2026年6月23日付で取締役を退任
氏名
鴻池忠彦
鴻池忠嗣
大田嘉仁
増山美佳
藤田泰介※
開催回数(回) 出席回数(回)
17
17
17
17
17
17
17
16
17
17
社長
女性
女性
社外
社外
独立
役員
独立
役員
監査役
(4名)
80
Chapter 1
Chapter 2
Chapter 3
Chapter 4
What is KONOIKE
Where we go
How we do
Data
ガバナンス
人事・報酬委員会
当社の人事・報酬委員会は、取締役会の諮問機関として設置しており、当社規程に基づき、社外取締役が半
数以上を占める構成とするとともに、委員長は社外取締役が務める体制としています。これにより、取締役、監
KONOIKE GROUP Integrated Report 2026
2026年3月期の出席状況
地位
氏名
開催回数
(回)
出席回数
(回)
社外取締役(委員長)
増山美佳
13
13
大田嘉仁
13
13
藤田泰介
13
13
鴻池忠彦
13
13
査役および執行役員の指名、ならびに取締役、執行役員の報酬決定に関する取締役会の意思決定プロセスにお
いて、独立性および客観性の確保・向上を図っています。
2026年6月23日以降は、独立社外取締役4名および社内取締役1名の計5名体制へ移行し、独立社外取締
役が大多数を占める構成へと強化しています。これにより、委員会の独立性・客観性は一層高まり、透明性およ
び説明責任を重視したガバナンス体制のさらなる充実を実現しています。
社外取締役
代表取締役会長兼
社長執行役員
※
※2026年6月23日付で取締役を退任
役員報酬制度
当社は、2021年2月12日に開催した取締役会において、取締役の個人別の報酬等の内容に係る決定方針を決議し、その後、中期経営計画2027のスタートに合わせ、2025
年6月18日に開催した取締役会において、当該方針および役員報酬制度を一部改定しています。なお、当該取締役会の決議に際しては、決議する内容について、半数以上が社
外取締役により構成され、社外取締役を委員長とする人事・報酬委員会にあらかじめ諮問し、答申を受けています。
当社の取締役および執行役員(取締役を兼任しない執行役員をいう。以下同じ。
)の個人別の報酬等に係る基本方針および決定方法は次のとおりです。
1
基本方針
取締役および執行役員の報酬制度は、当社の企業理念である「私たちの使命」(「人」と「絆」 を大切に、社会の基盤を革新し、新たな価値を創造します) を
実現するため、下記を基本方針としています。
❶ 企業理念
「私たちの使命」
の実現に貢献するものであること
❷「2030年ビジョン」
の実現に向けた優秀な経営陣の確保・維持に資すること
❸ 常に期待を超えるというチャレンジ精神を促すものであること
❹ 業績との連動性が高い設計であること
❺ 中長期的な企業価値向上のインセンティブとして、
株価連動報酬を組み入れること
❻ 従業員・株主をはじめとしたステークホルダーに対して、説明責任を果たせる透明性・公正性が担保された設計であること
81
Chapter 1
Chapter 2
Chapter 3
Chapter 4
What is KONOIKE
Where we go
How we do
Data
ガバナンス
2
KONOIKE GROUP Integrated Report 2026
報酬体系とその概要
取締役の報酬は、月例の金銭報酬(基本報酬・業績連動報酬)と非金銭報酬(譲渡制限付株式報酬)で構成し、役位、職責に応じ、当社の経営環境、業績、従業員給与の
水準、および他社水準をも考慮しながら、総合的に勘案して報酬額を決定しています。
報酬の種類
概要
金銭報酬
月例報酬
非金銭報酬
譲渡制限付株式報酬
基本報酬
役位、職責に応じた固定報酬として、毎月支給する。
業績連動報酬
事業年度ごとの業績を弾力的に報酬に反映するため、前年度の会社業績(全社業績、部門業績)
の達成度、
および中
期計画に対する個人の成果、経営への貢献度等の評価に基づく個人業績により算出した額を毎月支給する。
なお、報
酬算定の基礎となる評価指標やその値等は、取り巻く環境の変化に応じて、必要の都度、人事・報酬委員会の答申を
踏まえ、
見直しを行う。
役位、職責に応じた中長期的なインセンティブ報酬として、取締役退任時に譲渡制限が解除される譲渡制限付株式
を、社外取締役を除く取締役に対し、毎年、一定の時期に付与する。
また、執行役員の報酬制度についても、金銭報酬(基本報酬、業績連動報酬)および非金銭報酬(譲渡制限付株式報酬)で構成し、役位、職責に応じ、当社
の経営環境、業績等を総合的に勘案して報酬額を決定しています。
3
報酬の種類別の支給割合
業務執行取締役および執行役員の報酬の種類別の支給割合については、当社と
取締役会は、同委員会の答申内容を尊重し、当該答申で示された種類別の報酬
同程度の事業規模や関連する業種・業態に属する企業をベンチマークとする報酬
割合の範囲内で取締役の個人別の報酬等の内容を決定します。なお、社外取締役
水準を踏まえ、基本報酬、業績連動報酬、譲渡制限付株式報酬の比率の目安を
については、会社業績に左右されず社外の立場から客観的な意見・助言、および
5:3:2とした上で、上位の役位ほど業績連動報酬と譲渡制限付株式報酬のウ
監督・指導を行う役割に鑑み、基本報酬のみとしています。
エートが高まる構成とし、人事・報酬委員会において検討を行うこととしています。
4
業績連動報酬・非金銭報酬等に関する方針
1
業績連動報酬
2026年3月期からの中期経営計画2027のスタートにあたり、業績連動報酬の算定の基礎となる評価指標を見直し、経営目標との連動性を考慮の上、企業収益力お
よび企業価値の持続的な向上ならびに資本効率の向上をより意識した経営を実践していくことを目的として、従来の事業規模を重視した売上高に替え、ROE(自己資
本利益率)を評価指標として導入しています。
82
Chapter 1
Chapter 2
Chapter 3
Chapter 4
What is KONOIKE
Where we go
How we do
Data
ガバナンス
KONOIKE GROUP Integrated Report 2026
具体的な評価指標の内容、および報酬額の決定方法は以下のとおりです。
業績連動報酬の評価指標
評価項目
全社業績
評価指標
(2026/3期~)
指標選定の考え方
営業利益
全社の事業活動の成果として、
全社の連結営業利益の達成度を評価
ROE
自己資本に対する効率的な利益の獲得度合いを評価
当社の事業活動に対して、
株主・投資家が評価する企業価値の改善度を評価※
時価総額改善率
※事業年度期間中の当社の時価総額
(株価)
とTOPIXの平均変動率を相対評価
部門業績
営業利益
管掌部門の事業活動の成果として、
当該部門の連結営業利益の目標に対する達成度を評価
個人業績
個人別業績(査定)
中期経営計画に対する個人の取り組み状況、経営への貢献度等の個人目標に対する成果を定性的に評価
なお、個人業績については、その評価プロセスとして、事業年度ごとに代表取締
当評価については、その妥当性・透明性を担保するため、評価結果について人
役社長執行役員は、対象者との期首・期末面接により目標設定およびその成果の
事・報酬委員会に報告し意見を求めることとしています。また、代表取締役社長執
評価(対象者との面談を下位の取締役または執行役員が行う場合は、目標設定の
行役員については人事・報酬委員会が直接評価を行います。
確認と下位の面談者の一次評価を踏まえた二次評価)を行うこととしています。
業績連動報酬額の決定方法
取締役・執行役員それぞれの役位、職責に応じて基準額を定め、事業年度ごとに各評価項目の評価に応じて、基準額の0~200%の範囲内で、支給額を決定すること
としています。具体的な評価項目ごとのウエートは、次のとおりです。
評価項目
常務執行役員、執行役員
取締役社長
執行役員
取締役副社長
執行役員
取締役専務
執行役員
専務執行役員
コーポレート系
役員
事業系役員
全社業績
営業利益、ROE、
時価総額改善率
80%
70%
70%
70%
60%
30%
部門業績
営業利益
30%
個人業績
個人別業績
(査定)
20%
30%
30%
30%
40%
40%
83
Chapter 1
Chapter 2
Chapter 3
Chapter 4
What is KONOIKE
Where we go
How we do
Data
ガバナンス
2
KONOIKE GROUP Integrated Report 2026
非金銭報酬等
中長期的なインセンティブ報酬として毎期支給する譲渡制限付株式報酬について
であること等により、譲渡制限付株式の付与が困難または相当でない取締役・執行
は、社外取締役を除く取締役に対し譲渡制限付株式を付与するために支給する金銭
役員に対しては、譲渡制限付株式を付与せず、その代替として金銭報酬その他の報酬
報酬の総額は年額1億円以内とし、譲渡制限付株式として発行または処分をされる当
を支給できるものとしています。
社の普通株式の総数は年10万株以内とします。なお、非居住者(日本国外の居住者)
5
報酬等の決定の委任に関する事項
取締役の個人別の報酬額については、人事・報酬委員会の答申に基づき取締役会が決議することとしています。ただし、取締役会は、個人別の報酬額の決定にあたり代表取
締役社長執行役員にその具体的内容を委任することができ、委任を受けた代表取締役社長執行役員は、人事・報酬委員会による答申内容を尊重し、決定をしなければならな
いこととしています。
(参考:取締役および監査役の報酬等の額(2026年3月期))
報酬等の種類別の総額(百万円)
役員区分
報酬等の総額
(百万円)
金銭報酬
非金銭報酬等
月例報酬
基本報酬
業績連動報酬
対象となる
役員の数
(人)
譲渡制限付株式報酬
取締役(社外取締役を除く)
141
76
48
16
2
監査役(社外監査役を除く)
48
48
3
社外役員
62
62
5
計
253
187
48
16
10
84
Chapter 1
Chapter 2
Chapter 3
Chapter 4
What is KONOIKE
Where we go
How we do
Data
ガバナンス
KONOIKE GROUP Integrated Report 2026
取締役会の実効性評価
持続的な企業価値向上のため、2016年3月期から、取締役会の構成や運営、議論の内容やサポート体制などの評価を年1回実施し、
取締役会の機能強化を図っています。
評価概要
評価主体
各取締役・監査役による自己評価
評価手法
アンケート
回答方式
無記名方式
❶ 評価方法の検討
❷ 取締役・監査役へのアンケートの実施
● 取締役会の在り方
● 社外取締役のパフォーマンス
● 取締役会の運営
● 役員トレーニング
● 取締役会の構成
評価項目
評価プロセス
● 取締役会の議論
● 取締役会のモニタリング機能
● 社内取締役のパフォーマンス
● 取締役・監査役に対する支援体制
❸ 第三者機関による集計
● 株主
(投資家)
との対話
● 自身の取り組み
❹ 評価結果に基づく検討
● 取締役会の諮問委員会
評価結果
当社は取締役会の実効性評価にあたり、より客観的な視点を取り入れるた
一方で、中長期的な企業価値向上に資する戦略領域(DX、人材戦略、事業
め、全取締役・監査役に対し、第三者によるアンケート調査(自己評価)を実
ポートフォリオ、資本コスト等)に関する討議およびモニタリングについては、
施しました。
さらなる充実の余地があることが認識されました。
この結果、当社取締役会は、全体として実効性が確保されていると評価
今後は、定例報告の見直し等を通じて議論の質および時間配分の最適化を
されました。特に、運営面(事務局機能、審議運営、情報提供体制等)に
図るとともに、重点テーマに関する継続的な討議および重要案件のレビューを
おいては、安定的かつ高い水準が維持されていることが確認されています。
一層強化し、取締役会の監督機能のさらなる高度化に取り組んでまいります。
85
Chapter 1
Chapter 2
Chapter 3
Chapter 4
What is KONOIKE
Where we go
How we do
Data
ガバナンス
KONOIKE GROUP Integrated Report 2026
取締役会の2026年3月期の活動実績
主な議案
2026年3月期は、取締役会を17回開催しました。主な議案は、以下のとおりです。
1
諸規程の制定・改廃
7
開示(会社情報の公表)
2
組織機構の改正
8
建物・構築物、土地等の購入、賃貸借など
(例:新規拠点の設立に関するもの)
3
執行役員の選任
重要な事業計画
9
4
M&A等に関する事項
10 財務に関する事項
(例:借入金に関するもの)
5
株主総会に関する事項(例:株主総会付議議案の決定)
11 関係会社に関する事項
6
株式に関する事項
12 その他経営に関する重要な事項
主な活動内容
2025年5月度の取締役会にて、取締役会の実効性に関するアンケート結果について討議しました。その場において、今後の取締役会で、経営に関わる重要な課題に
ついてテーマを設定しました。
中期経営計画2027の進捗について
中期経営計画2027(2026年3月期~2028年3月期)の進捗を監督し、従業員の幸せと企業価値の最大化を実現するための成長投資(国・地域、業種など)と、基盤
投資(人・技術・ICT)について活発に議論されました。また成長投資に含むM&Aについても議論を深めました。
86
Chapter 1
Chapter 2
Chapter 3
Chapter 4
What is KONOIKE
Where we go
How we do
Data
ガバナンス
KONOIKE GROUP Integrated Report 2026
資本政策に関する討議について
企業価値向上の基盤となる資本政策について、現状の課題認識を詳細に分析
成長投資と株主還元の最適なバランスについては、営業キャッシュフローの配分
し、中期経営計画2027における財務戦略の方向性を討議しました。具体的には、
を前提として、成長投資の投資効率、配当性向の妥当性等、多面的に検証を行い
財務定量目標の設定根拠、キャッシュ・アロケーションの最適化方針、株主還元政
ました。これらの討議結果は中期経営計画2027の資本政策に反映されています。
策の定量目標について、資本コストを意識した議論を展開しました。
サステナビリティに関する討議について
ESG評価機関による当社グループのESG評価を踏まえ、非財務目標である「環境」
「人」
「技術」の今後の戦略について活発な議論がなされました。
マテリアリティの特定を通じて、サステナビリティにつながる施策を推進するとともに、多様なステークホルダーとのコミュニケーションを図ることで、中長期的な企業価値
向上に向けて取り組みを強化してまいります。
株主、
投資家との対話結果に関する討議について
当社グループでは、IR活動のPDCAサイクルの一環として、投資家の視点から経
て、より具体的な説明が求められていることを確認しました。
営を見直すIRフィードバックを継続的に実施し、その結果を取締役会で定期的に討
株主、投資家との対話で得られた貴重な知見を経営戦略に反映させることで、
議しています。IR活動を通じて得られた投資家からの意見として、2030年ビジョン
当社グループの変革を加速し、持続的な企業価値向上の実現に向けた取り組みを
達成に向けた成長戦略の一層の明確化、配当政策を含む株主還元のあり方につい
強化してまいります。
安全衛生の監督について
労働災害、自動車事故、品質事故について、経営品質本部長から定期的に取締役会に報告を行っています。報告では、事故・トラブルの発生状況や重点課題、再発・
未然防止策の進捗を共有しています。
取締役会では、これらの報告を踏まえ、課題への対応状況と実効性を確認し、安全・品質の継続的な向上に向けた監督を行っています
87
Chapter 1
Chapter 2
Chapter 3
Chapter 4
What is KONOIKE
Where we go
How we do
Data
ガバナンス
KONOIKE GROUP Integrated Report 2026
政策保有株式
1
基本方針
当社は、さまざまな分野においてパートナーシップを重視した事業活動を展開し
なお、個別の政策保有株式ごとに、毎年、取締役会において継続的に、保有に
ており、事業上重要なお客さまとの取引関係の維持・強化等を通じて中長期的な
伴う便益やリスクが資本コストに見合っているか等の観点から、定量的および定
企業価値の向上を図ることを目的として、政策的に株式を保有する場合がありま
性的な側面を踏まえ、保有の適否を総合的に検証し、適宜売却を行い、政策保
す。
有株式の縮減を図っています。
2
議決権行使基準
当社は、政策保有株式に係る議決権行使については、画一的に賛否を判断せず、発行会社の持続的な成長や中長期的な企業価値の向上につながるかどうかなどの観
点から、議案ごとに検討し判断しています。なお、当社は、株主価値を毀損するような議案については、肯定的な議決権の行使を行いません。
政策保有株式の縮減状況
政策保有株式売却累計額
56
連結純資産に占める政策保有株式割合
54
政策保有銘柄数
50
49
57億円
46
38億円
9.1%
0.4億円
2020年3月期
10.6 %
8億円
2021年3月期
25億円
26億円
9.0%
8.6%
2022年3月期
2023年3月期
8.6%
2024年3月期
45
6.9%
2025年3月期
63億円
41
8.1%
2026年3月期
88
Chapter 1
Chapter 2
Chapter 3
Chapter 4
What is KONOIKE
Where we go
How we do
Data
ガバナンス
マネジメント体制
KONOIKE GROUP Integrated Report 2026
(2026年6月23日現在)
取締役
1976年 4月株式会社鴻池組入社
2006年 4月株式会社三井住友銀行入行
1981年 4月当社入社
2013年 4月当社入社
1983年12月同常務取締役
2014年 7月同経営企画本部部長
1987年12月同専務取締役
2016年 4月同執行役員
1989年12月同代表取締役副社長
2017年 4月同常務執行役員
2003年 6月同代表取締役社長
2017年 6月同取締役兼常務執行役員
2018年 4月同代表取締役兼社長執行役員
2018年 4月同取締役兼専務執行役員
2021年 4月同代表取締役社長執行役員
2021年 6月同代表取締役会長兼社長執行役員
2019年 4月同取締役兼専務執行役員、
新事業開発管掌、
新事業開発本部本部長
2021年 4月同取締役専務執行役員、
海外管掌兼技術革新管掌
2026年 4月同代表取締役会長兼社長執行役員、
ICT管掌(現任)
鴻池忠彦
鴻池忠嗣
代表取締役会長兼社長執行役員
ICT管掌
代表取締役副社長執行役員
海外事業・技術・業務改革管掌兼
業務改革推進本部本部長
1986年 4月住友金属工業株式会社
2026年 6月同代表取締役副社長執行役員、
海外事業・技術・業務改革管掌兼
業務改革推進本部本部長
(現任)
2015年 4月同関東中央支店長
2012年10月新日鐵住金株式会社
(現日本製鉄株式会社)
2017年 4月同経営品質本部副本部長
和歌山製鐵所総務部長
2021年 4月同執行役員、
経営企画本部本部長
2014年 4月同大分製鐵所総務部長
2024年 4月同常務執行役員、
経営企画本部本部長
2016年 4月同関係会社部長
2025年 4月同専務執行役員、
国内事業担当兼
営業統括本部本部長
2019年 4月日本製鉄株式会社執行役員
2026年 4月同副社長執行役員、
国内事業管掌兼
営業統括本部本部長
(大阪支社長)
2021年 4月同常務執行役員
2024年 4月当社入社
2026年 6月同取締役副社長執行役員、
国内事業管掌兼
営業統括本部本部長
(現任)
同専務執行役員、
コーポレート部門担当兼
サステナビリティ担当
取締役副社長執行役員
コーポレート部門管掌兼
サステナビリティ担当
2025年 4月同取締役専務執行役員、
海外事業担当兼技術革新担当
1987年 4月当社入社
(現日本製鉄株式会社)
入社
津加宏
2022年 4月同取締役専務執行役員、
国際統括担当兼技術革新担当
2026年 4月同副社長執行役員、
コーポレート部門管掌兼
サステナビリティ担当
2026年 6月同取締役副社長執行役員、
コーポレート部門管掌兼
サステナビリティ担当
(現任)
田辺茂樹
取締役副社長執行役員
国内事業管掌兼営業統括本部
本部長
89
Chapter 1
Chapter 2
Chapter 3
Chapter 4
What is KONOIKE
Where we go
How we do
Data
KONOIKE GROUP Integrated Report 2026
ガバナンス
1978年 4月京セラ株式会社入社
1985年 4月日本銀行入行
2003年 6月同執行役員
1991年 9月 Cap Gemini Sogeti
国際マーケティング・ディレクター
2010年 6月同取締役執行役員常務
1992年11月 ジェミニ・コンサルティング・
ジャパン シニアコンサルタント
2010年12月日本航空株式会社専務執行役員
2015年12月京セラコミュニケーションシステム
株式会社代表取締役会長
1997年 6月 エゴンゼンダー株式会社入社
2004年 1月同 パートナー
2017年 4月同顧問
2016年10月増山&Company合同会社
(現任)
代表社員社長
2018年 6月当社社外取締役(現任)
2019年 9月株式会社MTG 会長
2023年12月同相談役
2017年 3月 サントリー食品インターナショナル株式会社
(現サントリービバレッジ&フード株式会社)
社外取締役(監査等委員)
(現任)
2025年 3月小林製薬株式会社取締役会長(現任)
2019年 3月 コクヨ株式会社社外取締役
2019年12月同取締役会長
大田嘉仁
増山美佳
社外取締役(独立)
社外取締役(独立)
2019年 6月当社社外取締役(現任)
2024年 6月 ウシオ電機株式会社社外取締役(現任)
1984年 4月株式会社住友銀行
(現株式会社三井住友銀行)入行
1983年 4月京セラ株式会社入社
2011年 3月日興コーディアル証券株式会社
(現 SMBC日興証券株式会社)執行役員
2016年 6月同取締役執行役員常務
2010年10月 KDDI株式会社執行役員
2018年 6月同取締役執行役員専務
コーポレート統括本部長兼 CFO
2014年 6月株式会社三井住友銀行退行
2018年 3月 SMBC日興証券株式会社
常務執行役員
2020年 6月同代表取締役執行役員副社長
コーポレート統括本部長兼 CFO
2021年 3月同顧問
2023年 6月同 エグゼクティブ・アドバイザー
2021年 7月山田コンサルティンググループ株式会社
シニアアドバイザー(現任)
2025年 6月明和産業株式会社社外取締役
(監査等委員)
(現任)
2024年 6月当社監査役
2026年 6月当社社外取締役
(現任)
2026年 6月同社外取締役(現任)
木村朋成
村本伸一
社外取締役(独立)
社外取締役(独立)
90
Chapter 1
Chapter 2
Chapter 3
Chapter 4
What is KONOIKE
Where we go
How we do
Data
KONOIKE GROUP Integrated Report 2026
ガバナンス
監査役
1986年 4月当社入社
1990年 4月当社入社
2017年 4月同中国九州支店長
2021年 4月同静岡支店長
2020年 4月同東海支店長
2023年 4月同監査役室長
2023年 4月同食品本部部長
2025年 4月同顧問
2024年 4月同顧問
2025年 6月同監査役
(現任)
2024年 6月同監査役
(現任)
田中俊一
高橋和哉
監査役(常勤)
監査役(常勤)
1989年10月太田昭和監査法人
(現 EY新日本有限責任監査法人)
入所
1998年 4月弁護士登録
2004年 9月田辺総合法律事務所入所
1993年 3月公認会計士登録
2006年 4月同 パートナー(現任)
2024年 4月公認会計士宮口亜希事務所所長
(現任)
2014年 4月防衛調達審議会委員
2024年 6月株式会社イチネンホールディングス
社外取締役
(現任)
2021年 6月当社社外監査役(現任)
2022年 3月 BASE株式会社社外監査役
2024年 6月山陽特殊製鋼株式会社社外取締役
(監査等委員)
(現任)
2023年 6月三井住建道路株式会社社外取締役
2024年 6月同社外取締役(監査等委員)
(現任)
2025年 6月宝ホールディングス株式会社
社外取締役
(現任)
2026年 6月当社社外監査役
(現任)
星千絵
宮口亜希
社外監査役(独立)
社外監査役(独立)
91
Chapter 1
Chapter 2
Chapter 3
Chapter 4
What is KONOIKE
Where we go
How we do
Data
ガバナンス
KONOIKE GROUP Integrated Report 2026
構成比率
社外取締役比率
社外取締役比率
女性役員比率
女性役員比率
%%
50.0
50.0
%%
25.0
25.0
(4名/8名)
(4名/8名)
(3名/12名)
(3名/12名)
※独立社外取締役比率50.0% (4名/8名)
※女性取締役(1名/8名) 女性監査役(2名/4名)
スキルマトリックス
役員
性別
当社における地位
企業経営・
事業経験
国際性
サステナ
ビリティ
人事・
人材開発
新事業/
M&A
鴻池
忠彦
男性
代表取締役会長兼社長執行役員
●
鴻池
忠嗣
男性
代表取締役副社長執行役員
●
津加
宏
男性
取締役副社長執行役員
●
田辺
茂樹
男性
取締役副社長執行役員
●
●
●
大田嘉仁
男性
社外取締役(独立)
●
●
●
増山美佳
女性
社外取締役(独立)
木村
朋成
男性
社外取締役(独立)
村本
伸一
男性
社外取締役(独立)
●
●
田中俊一
男性
監査役(常勤)
●
●
高橋
和哉
男性
監査役(常勤)
●
●
星
千絵
女性
社外監査役(独立)
宮口亜希
女性
社外監査役(独立)
※上記一覧表は、取締役・監査役の有するすべての知見・経験等を表すものではありません。
●
●
●
●
財務・会計
法務・
リスク
マネジメント
資本市場
●
●
●
技術・DX・
研究開発
●
●
●
●
●
●
●
●
●
●
●
●
92
Chapter 1
Chapter 2
Chapter 3
Chapter 4
What is KONOIKE
Where we go
How we do
Data
ガバナンス
KONOIKE GROUP Integrated Report 2026
社外取締役メッセージ
コロナ禍が終わり、社会は落ち着くのかと期待していましたが、ウクライナや中近東の紛争など、経営環境は不安定
な状況が続いています。その中にあっても、KONOIKEグループは、企業理念「私たちの使命:人と絆を大切に、社会の
基盤を革新し、新たな価値を創造します」をベースに作られた、2030年ビジョン「技術で、人が、高みを目指す」
という
基本方針を堅持し、成長発展を続けています。それを可能としているのは、長い歴史の中で築かれた強い一体感や経営
陣を含む全社員の絶え間ない努力であるのは間違いありません。ただ、その伝統的な強みに安住することなく、組織面
でも、技術面でも、新しいことにもっと挑戦を続け、
さらに大きな発展を遂げてほしいと願っています。
社外取締役の一人として、単に評論家的な意見を述べるのではなく、現場で起きていることを少しでも正しく理解
大田嘉仁
社外取締役(独立)
し、未来志向で経営陣や社員の方々に役立つようなアドバイスができるよう、その結果として、KONOIKEグループが
成長を続け、株主の皆さんやステークホルダーの方々の期待に応えられるよう、尽力してまいる所存です。
KONOIKEグループの強みは、
多様な事業の現場で、
お客さまが抱える困りごとに真摯に向き合い、
一つひとつ解決してきた
ことにあると考えています。
1880年の創業以来、
そうした積み重ねの中で培われ、
受け継がれてきた現場の技術や知恵、
そして
お客さまとの信頼は、
KONOIKEグループならではの大きな財産です。
取締役会では、
この強みを次の成長にどうつなげていくかを重視しながら、
中期経営計画2027の実行状況や資本効率、
企業
価値向上に向けた議論を進めています。
AIが急速に進化する今、
長年培ってきた現場力を礎に、
AIやデジタルの力をサービスの
提供方法や仕事の進め方に取り込み、
新たな価値を生み出していくことは、
大きな可能性を持つ前向きな課題です。
また、
KONOIKEグループはインドをはじめとするアジア、
アメリカ、
ヨーロッパなど、
海外でもさまざまな挑戦を続けています。
増山美佳
社外取締役(独立)
「匠の技術」
を受け継ぎながら、
異なる市場や文化の中で進化させ、
国内外の成長を担う人材を育てることも重要です。
社外取締役、
また、
人事・報酬委員会委員長として、
こうした挑戦を後押ししながら、
独立した立場だからこそ見えること、
問え
ることを大切にしたいと考えています。
KONOIKEグループが自らの強みを次の時代の価値へとつなげていけるよう、
率直で建
設的な議論を重ねてまいります。
93
Chapter 1
Chapter 2
Chapter 3
Chapter 4
What is KONOIKE
Where we go
How we do
Data
ガバナンス
KONOIKE GROUP Integrated Report 2026
社外監査役としての2年間、不正行為の再発防止の浸透と内部統制機能の強化の観点から、国内20数拠点を往査、
視察し、幅広い事業領域を持つKONOIKEグループの現場力を、
目の当たりにしました。
特に、昨年4月の内部統制委員会の設置以降、鴻池社長の陣頭指揮による役員の現場巡視の定例化、社員の「カタリ
バ」活動の活性化等により、KONOIKEフィロソフィが、現場に根付いてきていると実感しています。社員の心理的安
全性を確保し、事故防止の安全意識、
コンプライアンス意識を高めてきたことは、安全と規律を重視するKONOIKEグ
ループの土台を固めるものであります。今後は、取締役として、
これらが定着していくことを、確りと見守ります。
また、KONOIKEグループの目標、2030年ビジョン「技術で、人が、高みを目指す」の達成に向けて、きめ細かい人材
木村朋成
社外取締役(独立)
投資、成長領域・戦略分野にフォーカスした新規投資、さらに果断な研究開発を後押しすることで、中長期的な企業価
値の向上を支え、持続的な成長に資するべく、モニタリング機能を果たし、不採算事業に対するPDCAアクション機能
を高め、
より健全な監督・牽制機能の発揮に、貢献してまいります。
2026年6月の株主総会において、鴻池運輸の社外取締役に就任いたしました。
就任にあたり最初に感じたのは、KONOIKEグループが運輸事業にとどまらず、お客さまのバリューチェーンに入り込
み、多岐にわたる分野でユニークなビジネスモデルを展開していることです。今や事業の中核をなす複合ソリューショ
ン事業では、長年培ってきたお客さまとの信頼関係をベースに、さまざまな現場で社員が自ら考え、お客さまの課題解
決につながる新たな価値を創出しています。
「統合革新」という独自の事業コンセプトを支えているのは、社員一人ひとりの専門性や発想力、そして人間力であ
り、それがKONOIKEグループの強みであることは間違いありません。
「技術で、人が、高みを目指す」
というビジョンに
村本伸一
社外取締役(独立)
もあるように、人的資本への投資は今後も重要な経営課題です。
また、中期経営計画2027では、M&A200億円を含む480億円の成長投資を想定しており、その成否が中期経営計画
の達成、ひいては当社の持続的成長の鍵となります。
私は前職のKDDIにおいて、CFOとしてさまざまなM&Aや成長投資に携わった経験や、人材戦略の革新に取り組ん
だ経験があり、それらの経験を活かし当社の企業価値向上に貢献していきたいと考えています。
94
Chapter 1
Chapter 2
Chapter 3
Chapter 4
What is KONOIKE
Where we go
How we do
Data
ガバナンス
KONOIKE GROUP Integrated Report 2026
コンプライアンス
内部統制委員会
役割
内部統制委員会では、内部統制の計画立案から整備・運用状況の評価と課題
部統制委員会で検討された事項を事業部門に的確に展開していくことを目的とし
への対応といった内部統制に関する事項に加え、コウノイケ通報窓口の実績把握
て、支店長や関係会社代表らが構成員となる「内部統制推進部会」を下部機関と
と全社展開が必要な事案への対応や、各部門から報告されるコンプライアンスリ
して組織しており、グループ全体での内部統制活動・コンプライアンス活動を主導
スクを内包する案件への対応などを担っています。特に緊急性や重要性の高い
しています。
案件については個々の取締役に速やかに連携し、事案対応に当たります。また内
構成
委員長
代表取締役会長兼社長執行役員
副委員長
コーポレート担当副社長執行役員
委員
副社長執行役員、全本部長、全常勤監査役、内部監査室長
社外委員
弁護士1名、公認会計士1名
26/3期の取り組み
内部統制に関して、従来は財務経理本部長・経営品質本部長をトップとする内
員を委員長としてすべての本部長を委員とする内部統制委員会に改組し、取締役
部統制部会において業務上発生した内部統制の不備について共有し、水平展開を
会の諮問機関として位置づけました。同委員会ではいわゆる内部統制の整備・運
行うにとどまっていました。その結果2023年の不正事案が発生するに至り、2024
用・評価と課題対応等にとどまらず、コウノイケ通報窓口への通報内容等も共有さ
年4月より社長執行役員をトップとする経営品質協議会により再発防止策に取り組
れ、重要性や緊急性の高いものは速やかに取締役に報告する体制を取っており、
んできました。この再発防止の取り組みのなかで、経営幹部によるコンプライアン
潜在的なコンプライアンスリスクの回避にも努めています。
スへの関わりに不十分な点があると判断したことから、2025年4月に社長執行役
95
Chapter 1
Chapter 2
Chapter 3
Chapter 4
What is KONOIKE
Where we go
How we do
Data
KONOIKE GROUP Integrated Report 2026
ガバナンス
コンプライアンス推進体制図
株主総会
取締役会
会計監査人
監査役会
(※監査役)
(※取締役)
緊急時報告
内部統制委員会事務局
内部統制委員会
(委員長:社長執行役員)
報告
コンプライアンス統括責任者
(経営品質本部長)
指示・伝達
コンプライアンス
研修など
内部統制推進部会
報告
報告
コンプライアンス統括部署
(コンプライアンス部)
報告
指示・伝達
協働
連携
内部監査室
法律事務所
会計監査人
不正・不祥事報告制度
通報窓口
当社グループ(役職員)
通報
コウノイケ通報窓口
(ヘルプライン)
96
Chapter 1
Chapter 2
Chapter 3
Chapter 4
What is KONOIKE
Where we go
How we do
Data
ガバナンス
KONOIKE GROUP Integrated Report 2026
コンプライアンスの取り組み
KONOIKEグループは、企業理念の実践により
「お客さまと社会から信頼
され、愛される会社」
となるため、法令および社会的規範を遵守し、透明かつ
ともにKONOIKE手帳を作成し人として正しい考え方を共有するなど、グ
ループのコンプライアンス意識の向上に努めています。
公正に事業活動を遂行しなければなりません。そのために
「企業倫理規程」
また2025年5月30日に経営品質宣言を公表し、創業時の理念に立ち返る
を制定し、その遵守と実践的運用のため下位規程として
「コンプライアンス
ことに加え、50年後、100年後の未来を見据えたコンプライアンスへの思い
規程」
や
「コウノイケ通報窓口
(ヘルプライン)運用基準」
を定めて運用すると
を発信しています。
コンプライアンス社内研修
総合職社員に対しては、年次・階層研修の際にコンプライアンス教育を実施してい
誠実に向き合い良き企業市民であることを目標としています。さらにeラーニングの対
ます。その際に基本的な考え方を毎回確認することに加え、社内外の不正事例・不祥
象範囲を広げて専門職社員やグループ会社社員にも開放した上で、コンプライアンス
事事例・行政機関からの指摘事項を説明し、遵法精神の向上に取り組んでいます。ま
関連講座を開講しグループのコンプライアンス意識の向上を図っています。
た、
「倫理観・社会的価値観」や「社会的規範」に従い、すべてのステークホルダーに
海外現地法人に対する取り組み
国内と商習慣が異なる海外現地法人については、KONOIKEグループの考え方
ジメントの向上を図っています。また、マネジャー向けに「企業倫理規程」の勉強会
の浸透を図る必要があります。eラーニングによるコンプライアンス教育の実施に加
を開催し、
「安全で働きやすい職場づくり」
「企業市民としての貢献と環境への配慮」
え、コンプライアンス意識調査やエンゲージメント調査により各現地法人における職
「公正な取引」という基本的な考え方の徹底を進めています。
場の風土や社員の愛着心を測り、カタリバをはじめとした取り組みを通じてエンゲー
内部通報制度
KONOIKEグループでは、内部通報制度としてコウノイケ通報窓口(ヘルプライ
KONOIKE手帳に連絡先を記載するなど周知活動にも努め、利用件数は着実に増
ン)を設けています。社内への通報に不安を感じる場合でも安心して利用できるよ
加しています。通報内容は内部統制委員会を経て、取締役会に報告されますが、
う、社内窓口に加え、弁護士事務所を社外通報窓口として定めています。また、事
特に重要性や緊急性の高い案件については、内部統制委員会より速やかに個々の
案の内容によっては、監査役が通報を受け付けるケースもあり、その場合は担当部
取締役に報告がなされ対処に当たります。
署と連携を取り、事案の調査に当たります。利用を促すため、全社員に配付する
97
Chapter 1
Chapter 2
Chapter 3
Chapter 4
What is KONOIKE
Where we go
How we do
Data
ガバナンス
KONOIKE GROUP Integrated Report 2026
リスクマネジメント
KONOIKEグループでは、企業経営に重要な影響をおよぼすリスクを低減させるとともに、非常事態が万が一発生した場合に、迅速かつ的確な対応ができ
る危機管理体制の確立を目的として
「リスクマネジメント規程」
および
「危機管理基準」
をKONOIKEグループの基本方針として制定しています。
リスク管理体制
KONOIKEグループでは、前述の「リスクマネジメント規程」をもとに、企業価
これらのリスクに対しては、“ 予防と抑制 ”に重点を置いた管理を行い、事故や
値を毀損させる可能性のある懸念事項をリスクとして捉え、次のとおり定義してい
トラブルを未然に防ぐとともに社会責任を果たし、現在の企業価値の維持ならび
ます。
に将来の企業価値向上に努めています。
運用については、総務本部本部長を部会長とするリスクマネジメント部会を四
1
戦略的意思決定によりKONOIKEグループの成長およびサステナビ
リティを巡る課題の解決を図り、将来に向け企業価値を向上させる
にあたり、これを阻害するリスク
2
法令遵守や経営課題への取り組み不足他、既存の事業活動や業務
運営の健全な展開を阻害し、現在の企業価値を毀損させるリスク
半期ごとに開催しており、リスクマップに基づき選定される優先対策リスクを中心
にリスク対策の確認や取り組み状況のモニタリングを実施するなど、リスク低減に
向けた活動を行っています。また、各支店・各関係会社はリスクマネジメント小部
会を通じて連携しており、KONOIKEグループ全体の活動としてリスク発生の回
避に取り組んでいます。
98
Chapter 1
Chapter 2
Chapter 3
Chapter 4
What is KONOIKE
Where we go
How we do
Data
ガバナンス
KONOIKE GROUP Integrated Report 2026
危機管理体制
KONOIKEグループの存続および事業継続を脅かす事態をクライシス(危機)と捉
対応のいずれかの危機対応体制を迅速に決定の上、危機の対処に当たります。体制
え、それらが顕在化した場合の緊急対応、復旧活動、さらには有事下での事業継続
の構築だけでなく、対策本部設置訓練や安否確認訓練などにより対応力強化にも努
活動を包括してクライシスマネジメント(危機管理)と定義しています。前述の「危機
め、被害を最小限に抑えられるように取り組んでいます。またKONOIKEグループで
管理基準」を定めるほか、自然災害に備えて各種マニュアルを常備するなど、発生し
は、これまでも地震や台風等の自然災害発生時に、物流、医療、空港業務などを通
た事象に対して適切かつ迅速に対応できる体制を構築しています。巨大地震やシステ
じて社会インフラの緊急支援対応に取り組み、緊急時対応の経験を重ねてきました。
ム障害等、当社グループの事業継続に重大な影響をおよぼす危機が顕在化した際に
これらの知見をもとに、災害時における被災地の支援にも積極的に貢献していきたい
は、社長執行役員、副社長執行役員および総務本部本部長が事態の重大性や影響
と考えています。
範囲を踏まえて即時に協議し、危機管理委員会、対策本部、対策チームまたは現場
KONOIKEグループにおけるリスクアセスメント
KONOIKEグループでは、リスクアセスメントをリスク管理のプロセスの第一歩と捉
え、分析・評価を中心としたリスクの現状把握を行っています。
この取り組みは、対策の検討や優先順位づけ等の意思決定を行うための基礎的な
データの収集を目的として実施し、リスク管理において重要なプロセスに位置づけられ
ます。リスクアセスメントは、サステナビリティ委員会の傘下のリスクマネジメント部会
が中心となり実施します。リスクアセスメントにおいて特定された優先対策リスクにつ
いては、主管部門を任命し、主管部門が中心となり、具体的な対策の実行・改善を
行います。
リスクマネジメント部会は、主管部門における取り組み状況をモニタリングする役割
を担います。
リスクアセスメント
リスク洗い出し・分析・評価
具体的対策の実行・改善
優先対策リスクの特定
対策の検討
計画の策定
改善
検証
対策の実行
リスクマネジメント部会が中心となり実施
主管部門が中心となり実施
リスクマネジメント部会にて取り組み状況をモニタリング
99
Chapter 1
Chapter 2
Chapter 3
Chapter 4
What is KONOIKE
Where we go
How we do
Data
ガバナンス
KONOIKE GROUP Integrated Report 2026
リスクアセスメントで採用している
「評価軸」
影響度の評価
レベル
分析指標
分析基準
利益
人命
4
会社経営に甚大な影響
極度に減少
死亡者が複数名発生
3
会社経営に大きな影響
大きく減少
1名の死亡者または
多数の負傷者が発生
2
会社経営に中程度の影響
やや減少
負傷者の発生
(休業4日以上)
1
会社経営に小程度の影響
小程度の減少
軽傷者が発生
発生可能性の評価
レベル
4
分析指標
半年以内の発生可能性
当該リスクが過去に発生しており、再発のリスクが高い
●
●
3
●
2
●
1
●
1年以内の発生可能性
3~5年以内の発生可能性
10年以上発生の可能性なし
レピュテーション
信用を著しく失墜
信頼関係や取引などの回復が見込めない
●
●
信用を大きく失墜
現状の取引に一定の影響が発生
●
●
信用を失墜
現状の取引に少し影響
●
●
信用への影響は軽微
現状の取引への影響は軽微
●
●
100
Chapter 1
Chapter 2
Chapter 3
Chapter 4
What is KONOIKE
Where we go
How we do
Data
ガバナンス
KONOIKE GROUP Integrated Report 2026
株主・投資家
KONOIKEグループは、株主・投資家の皆さまとの建設的な対話を、持続的な成長と中長期的な企業価値向上に向けた重要な取り組みと位置づけていま
す。対話を通じていただいたご意見やご期待を、経営判断や情報開示の充実につなげることで、
当社グループへの理解を深めていただくとともに、資本市場と
の信頼関係の強化に努めています。
また、企業理念、2030年ビジョン、中期経営計画に一貫する価値創造ストーリーを丁寧にお伝えすることを重視していま
す。加えて、事業環境の変化や経営課題、成長投資の考え方、資本政策、
サステナビリティの取り組みについて、財務・非財務の両面から分かりやすくご説明し、
対話の質の向上に取り組んでいます。
株主・投資家との建設的な対話に関する具体的取り組み
対話における体制
株主・投資家の皆さまとの建設的な対話を実現するため、経営企画本部長(執行役員)をIR 担当役員とし、経営トップおよび経営幹部(取締役・執行役員他)が対
話の場面に対応しています。また対話のご要望や主題によっては、社外取締役や事業部門長が面談に臨むこととしています。
主な活動実績
活動
機関投資家向け
個人投資家向け
項目
主な説明者
実施状況
2026年3月期実績
決算説明会
代表取締役・取締役・コーポレート担当役員・財務経理本部長
通期・第2四半期
2回
その他説明会
同上、事業本部長等
適時
1回
国内外個別面談
同上
適時
228回
海外IR
同上
定期
2カ国
証券会社主催海外カンファレンス
コーポレート担当役員・財務経理本部長・経営企画本部長
不定期
―
現場見学会
経営企画本部長・該当事業所長他
定期
2回
個人投資家説明会
コーポレート担当役員・経営企画本部長
定期
―
101
Chapter 1
Chapter 2
Chapter 3
Chapter 4
What is KONOIKE
Where we go
How we do
Data
ガバナンス
KONOIKE GROUP Integrated Report 2026
主な対話テーマ
対話では、当社グループのビジネスモデルの特長、収益力向上に向けた取り組み、注力事業における成長機会、ROICを意識した経営、資本政策、サステナビリティ
対応などが主なテーマとなっています。特に直近では、海外事業を今後の成長ドライバーとしてどう伸ばしていくか、競争優位性や価格交渉力をどのように強化していく
か、また将来の事業ポートフォリオをどのような方向へ進化させていくかに、高い関心が寄せられています。
対話の主なテーマや関心事項
●
当社グループのビジネスモデルの特長
●
海外事業を含む成長戦略の実現性
●
人材戦略やDX戦略が中長期の成長にどのようにつながるか
●
空港事業の今後の方向性
●
収益力向上に向けた具体策と進捗
●
社外役員を含むガバナンスの実効性
●
資本政策
●
ROICを起点とした事業ポートフォリオ運営の方向性
●
サステナビリティの取り組みと企業価値向上との結び付き
当社は、こうした関心事項を踏まえ、単に施策を列挙するのではなく、それぞれの取り組みが将来の成長や収益力向上にどうつながるのかを意識した説明の充実を進めています。
フィードバックの経営への反映
対話で得られたご意見・ご要望は、定期的に経営層へフィードバックし、事業
要があると認識しています。また、資本効率の改善や事業ポートフォリオの見直し
戦略、開示内容、IR 活動の改善に反映しています。とりわけ、サステナビリティや
については、現状認識だけでなく、今後どのような方向性で変革を進めていくの
人的資本、DXといった非財務テーマについては、取り組み自体の紹介にとどまら
かを示すことが重要であると考えています。今後も、対話を通じて得られた視点
ず、中長期的な成長戦略や業績への貢献との関係を、より具体的に示していく必
を経営に活かし、企業価値向上に向けた取り組みを一層強化していきます。
情報開示の充実と適切な情報管理
当社グループは、株主・投資家との対話の基盤となる情報開示の充実にも注力
報を分かりやすく発信しています。
しています。決算短信、決算説明会資料、統合報告書などを通じて、投資家の皆
一方で、対話にあたっては、インサイダー情報の管理を徹底しています。沈黙期
さまに対し、適時かつ適切な情報提供に努めています。また、海外の投資家の皆
間の設定や社内規程の整備により、公平性と適正性を確保しながら、透明性の高
さまへの情報提供の充実を図るため、英文での開示にも取り組んでいます。あわ
い対話を推進しています。
せて、Webサイトも活用し、企業情報、事業内容、IR 情報、サステナビリティ情
102
Chapter 1
Chapter 2
Chapter 3
Chapter 4
What is KONOIKE
Where we go
How we do
Data
ガバナンス
KONOIKE GROUP Integrated Report 2026
株主総会の活性化および議決権行使の円滑化に向けての取り組み状況
当社は、株主の皆さまとの建設的な対話に向け、株主総会の招集通知を早期
し、インターネット等による議決権行使を導入するほか、議決権電子行使プラット
発送(株主総会開催日の3週間前までをめど)するとともに、招集通知発送日以
フォームを活用しています。さらに、外国人の株主の皆さまにも適切に議決権を行
前の実務上可能な限り早期に、その内容を金融商品取引所および当社のWebサイ
使していただけるよう招集通知の英訳を作成し、当社 Webサイトおよび議決権電
トに掲載し、株主の皆さまの議決権行使のための検討時間を十分に確保します。
子行使プラットフォームで開示しています。なお、総会会場にご来場いただけない
第86回定時株主総会の招集通知は、書面発送に先立ち、開催日の3週間前に
株主さまに向けて、総会時の「事業報告等プレゼンテーション」の説明資料につ
いても、Webサイトに掲載しています。
金融商品取引所および当社Webサイトに開示しました。
また国内外の機関投資家を含む株主の皆さまの議決権行使の利便性を考慮
取り組み
補足説明
1 株主総会招集通知の早期発送
株主総会開催日の3週間前までをめどに発送する方針。
2026年6月23日開催の第86回定時株主総会の招集通知は2026年6月2日に発送。
2 株主総会招集通知の発送前開示
当社Webサイト等を通じて、発送前に招集通知を開示。
実務上可能な限り早期に公表する方針のもと、直近の定時株主総会の招集通知の発送前開示は
2026年5月29日に実施。
3 集中日を回避した株主総会の設定
より多くの株主の皆さまが株主総会に参加しやすいよう、集中日の回避に努めている。
なお、直近の定時株主総会は2026年6月23日に開催。
4 電磁的方法による議決権の行使
電子投票制度を採用し、
インターネット
(PC、
スマートフォンまたは携帯電話)
による議決権行使が可能。
5 議決権電子行使プラットフォームへの参加
機関投資家の議決権行使環境向上に向けた取り組みとして、
株式会社ICJが運営する機関投資家向け議決権電子行使プラットフォームに参加。
6 招集通知
(要約)
の英文での提供
当社Webサイト上に、株主総会招集通知要約の英文を和文の発送前開示と同日(2026年5月29日)
に掲載。
103
Chapter 1
Chapter 2
Chapter 3
Chapter 4
What is KONOIKE
Where we go
How we do
Data
KONOIKE GROUP Integrated Report 2026
財務ハイライト
(単位:億円)
損益状況
2017 年 3 月期
2018 年 3 月期
2019 年 3 月期
2020 年 3 月期
2021 年 3 月期
2022 年 3 月期
2023 年 3 月期
2024 年 3 月期
2025 年 3 月期
2026 年 3 月期
売上高
2,583
2,767
2,941
3,108
2,923
3,013
3,118
3,150
3,449
3,555
営業利益
102
110
109
96
39
102
132
166
213
227
(利益率)
4.0%
4.0%
3.7%
3.1%
1.4%
3.4%
4.2%
5.3%
6.2%
6.4%
経常利益
107
115
113
95
93
118
142
170
212
225
親会社株主に帰属する当期純利益
73
70
62
45
48
79
83
113
140
142
総資産
2,046
2,118
2,132
2,234
2,587
2,577
2,660
2,770
2,897
2,997
自己資本
919
978
982
961
1,015
1,109
1,212
1,332
1,467
1,590
有利子負債
466
427
450
551
892
756
748
685
614
595
自己資本比率(自己資本÷総資産)
44.9%
46.2%
46.1%
43.0%
39.2%
43.0%
45.6%
48.1%
50.7%
53.1%
D/Eレシオ(有利子負債÷自己資本)
0.51倍
0.44倍
0.46倍
0.57倍
0.88倍
0.68倍
0.62倍
0.51倍
0.42倍
0.37倍
営業キャッシュ・フロー
165
143
58
183
144
167
187
176
234
248
投資キャッシュ・フロー
△ 62
△ 99
△ 86
△ 165
△109
△64
△58
△78
△169
△162
財務状態
キャッシュ・フロー項目
財務キャッシュ・フロー
14
△ 64
△ 38
35
311
△154
△35
△98
△128
△104
フリーキャッシュ・フロー
102
43
△ 28
18
35
103
129
98
65
86
現金および現金同等物の期末残高
313
291
222
276
622
576
675
681
627
609
自己資本利益率(ROE)
8.2%
7.4%
6.4%
4.7%
4.9%
7.5%
7.1%
8.9%
10.0%
9.3%
投下資本利益率(ROIC)
4.6%
4.7%
4.6%
3.9%
1.4%
3.4%
4.3%
5.2%
6.5%
6.8%
税引後営業利益(NOPAT)
70
76
76
67
27
71
91
115
148
156
(営業CF+投資CF)
主要財務指標
104
Chapter 1
Chapter 2
Chapter 3
Chapter 4
What is KONOIKE
Where we go
How we do
Data
連結損益計算書関連財務指標
(億円)
4,000
売上高
営業利益
5年間推移
連結貸借対照表関連財務指標
親会社株主に帰属する当期純利益
営業利益率
3,449
3,013
3,150
3,118
KONOIKE GROUP Integrated Report 2026
3,555
400
(億円)
4,000
自己資本
6.4 %
6.2 %
有利子負債
300
2,000
227
200
1,000
0.42倍
0
113
79
83
2022年3月期
2023年3月期
2024年3月期
連結キャッシュ・フロー計算書関連財務指標
(億円)
営業CF
投資CF
財務CF
2025年3月期
2026年3月期
5年間推移
200
167
100
187
103
100
1,000
0
0
(億円)
FCF(営業CF+投資CF)
150
234
▲35
▲78
86
140
(億円)
150
142
2025年3月期
▲169
▲
162
6.5 %
115
83
10.0 %
9.3 % (%)
10.0
91
65
7.5 %
0.0
71
50
7.1%
5.0
(%)
税引後営業利益
(NOPAT)
ROIC
100
79
0.2
2026年3月期
148
100
50
▲98
2024年3月期
595
113
-100
10.0
156
7.5
6.8%
5.0
5.2 %
4.3%
3.4%
2.5
▲154
▲
104
▲128
-300
親会社株主に帰属する当期純利益
ROE
8.9 %
▲64
2023年3月期
614
5年間推移
176
98
▲58
685
0.4
0.37 倍
248
0
-200
748
2022年3月期
ROE、ROIC
300
129
756
142
140
102
0.51倍
2,000
166
132
0.6
1,332
1,109
3.4 %
1,467
3,000
1,212
213
0.8
1,590
0.62倍
5.3 %
4.2 %
(倍)
D/Eレシオ
(有利子負債自己資本)
0.68倍
3,000
5年間推移
2022年3月期
2023年3月期
2024年3月期
2025年3月期
2026年3月期
0
2022年 2023年 2024年
3月期 3月期
3月期
2025年
3月期
2026年
3月期
0.0
0
2022年 2023年 2024年
3月期 3月期
3月期
2025年
3月期
2026年
3月期
0.0
105
Chapter 1
Chapter 2
Chapter 3
Chapter 4
What is KONOIKE
Where we go
How we do
Data
KONOIKE GROUP Integrated Report 2026
事業状況・経営成績等の分析
経営成績および事業の状況
2026年3月期における我が国の経済は、
インバウンド需要の高水準維持や、大企業を中心
利益についても、
「中期経営計画2027」の事業戦略である
「海外事業拡大」、
「国内事業の
とした賃金改定の動きが見られました。一方で、円安の恒常化や慢性的な人手不足による物
成長加速」
に取り組み、
営業利益は227億85百万円
(同6.5%増)
、
経常利益は225億85百万円
価上昇の継続、個人消費の低迷に加え、米国による輸入関税の引き上げや日中関係の悪化、
(同6.1%増)、親会社株主に帰属する当期純利益は142億68百万円(同1.5%増)
となりまし
中東情勢の緊迫化など、
さまざまな経済環境の変化が重なり、依然として先行きは不透明と
た。
言わざるを得ない状況が続いています。
このような経営環境のなか、
当社グループは2028年3月期を最終年度とする
「中期経営計
セグメント別の経営成績は以下のとおりです。
なお、
セグメント利益は一般管理費控除前の
営業利益です。
画2027」
をスタートし、
「成長投資と人・技術・ICTへの基盤投資で、従業員の幸せと企業価値
の最大化を実現する。」
という基本方針のもと、
「人」
を価値創造の源泉と捉え、人材への積極
的な投資と戦略的な育成を着実に進めてまいりました。
あわせて、技術革新やICT活用、内部
複合ソリューション事業
鉄鋼関連における得意先での一部生産ライン休止の影響はあるものの、
インド鉄鋼子会社
統制の強化を通じて、変化に機動的かつ的確に対応できる経営基盤の強化に取り組んでおり
連結化の効果、空港関連における国際旅客便の復便、生活産業関連における新規拠点の稼働
ます。
さらに、事業戦略の三本柱の一つである海外事業拡大では、米国の輸入関税の影響はあ
および取扱量の増加、食品プロダクツ関連での取扱量増加および適正単価の収受があり、売
るものの、昨年度より連結化したFSNL Private Ltd.において取扱量の拡大と効率化、PMIの
上高は2,319億85百万円
(前年同期比6.7%増)
となりました。
進捗により、高水準の需要に対応しながら安定した収益基盤の構築を進めています。今後も、
オペレーションの高度化や新規領域の拡大を通じて、さらなる成長を図ってまいります。一
利益は、新規連結の効果や取扱量の増加に加え、継続しての適正単価収受に努め、238億
64百万円
(同14.8%増)
となりました。
方、国内事業においては、
日中関係の悪化を背景に、空港関連事業で中国路線の減便影響が
2025年12月より顕在化しました。2026年3月まで減便が増加しておりましたが、足元では底
打ちの兆しが見られています。現時点では収束時期は不透明でありますが、引き続き動向を
注視するとともに、
周辺業務の受注拡大および人材活用の最適化に取り組んでまいります。
ま
た、2026年3月以降は、
中東情勢の緊迫化に伴う燃油価格が物流コストに与える影響を懸念
しており、燃油価格の上昇分については、取引条件の適正な見直しやコスト構造の改善等を
国内物流事業
生活産業関連における取扱量の増加および適正単価の収受、新規業務の獲得等により、売
上高は565億13百万円
(前年同期比1.2%増)
となりました。
利益は、増収効果はあるものの、一部得意先の業務の撤退による減益をカバーできず、34
億48百万円
(同4.6%減)
となりました。
通じて、
影響を最小限に抑えるよう努めてまいります。
2026年3月期における経営成績については、2025年4月よりスタートした
「中期経営計画
国際物流事業
2027」
の事業戦略である
「海外事業拡大」、
「国内事業の成長加速」
に取り組んだ結果、得意先
大型案件の受注や、海外現地での取扱量の増加、カナダ子会社連結化の効果といった増
での一部生産ライン休止や航空貨物取扱量減といった減収要因があるものの、
インドやカナ
収要因はあるものの、航空貨物取扱量減により、売上高は670億28百万円(前年同期比6.4%
ダでの子会社連結化の効果、空港関連での国際旅客便の復便等の取扱量増加等の増収要因
減)
となりました。
があったため、
売上高は3,555億55百万円
(前年同期比3.1%増)
となりました。
利益についても、航空貨物取扱量減による減益を他要因にてカバーできず39億73百万円
(同15.9%減)
となりました。
106
Chapter 1
Chapter 2
Chapter 3
Chapter 4
What is KONOIKE
Where we go
How we do
Data
KONOIKE GROUP Integrated Report 2026
経営成績および財政状態
総資産
純資産
2026年3月期における総資産の残高は2,997億26百万円であり、2025年3月期に比べ
2026年3月期における純資産の残高は1,632億51百万円であり、2025年3月期に比べ
100億23百万円増加しました。
128億27百万円増加しました。主な要因は、利益剰余金が81億26百万円増加したこと、退職
給付に係る調整累計額が22億90百万円増加したこと、その他有価証券評価差額金が18億
流動資産
2026年3月期における流動資産の残高は1,433億62百万円であり、2025年3月期に比べ
32億33百万円増加しました。主な要因は、受取手形、売掛金および契約資産が32億79百万
円増加したこと等によるものです。
固定資産
2026年3月期における固定資産の残高は1,563億63百万円であり、
2025年3月期に比べ67億
90百万円増加しました。
主な要因は、
投資有価証券が38億77百万円増加したこと、
土地が26
億59百万円増加したこと、
繰延税金資産が11億16百万円減少したこと等によるものです。
84百万円増加したこと等によるものです。
キャッシュ・フローの概況
営業活動によるキャッシュ・フロー
2026年3月期の営業活動によるキャッシュ・フローは248億62百万円の収入(前年同期比13
億94百万円の収入増)
となりました。
これは、主に税金等調整前当期純利益が221億54百万
円あったこと、減価償却費が99億87百万円あったこと、法人税等の支払額が71億9百万円
あったこと等によるものです。
投資活動によるキャッシュ・フロー
2026年3月期の投資活動によるキャッシュ・フローは162億34百万円の支出(前年同期比
負債合計
7億25百万円の支出減)
となりました。
これは、主に有形固定資産の取得による支出が125億
2026年3月期における負債合計の残高は1,364億75百万円であり、2025年3月期に比べ
70百万円あったこと、持分法で会計処理されている投資の取得による支出が14億93百万円
28億3百万円減少しました。
あったこと、定期預金の増加額が13億31百万円あったこと、無形固定資産の取得による支出
が10億94百万円あったこと等によるものです。
流動負債
2026年3月期における流動負債の残高は727億81百万円であり、
2025年3月期に比べ88億49
百万円増加しました。
主な要因は、
1年内償還予定の社債が50億円増加、
その他流動負債が20
億3百万円増加したこと、
短期借入金が12億61百万円増加したこと、
訴訟損失引当金が11億円
増加したこと、
支払手形および買掛金が16億63百万円減少したこと等によるものです。
固定負債
2026年3月期における固定負債の残高は636億93百万円であり、
2025年3月期に比べ116億
52百万円減少しました。
主な要因は、
社債が100億円減少したこと、
退職給付に係る負債が28
億64百万円減少したこと、
長期借入金が12億24百万円増加したこと等によるものです。
財務活動によるキャッシュ・フロー
2026年3月期の財務活動によるキャッシュ・フローは104億76百万円の支出(前年同期比
24億8百万円の支出減)
となりました。
これは、主に配当金の支払額が61億57百万円あった
こと、社債の償還による支出が50億円あったこと、長期借入れによる収入が27億38百万円
あったこと等によるものです。
107
Chapter 1
Chapter 2
Chapter 3
Chapter 4
What is KONOIKE
Where we go
How we do
Data
KONOIKE GROUP Integrated Report 2026
連結財務諸表
連結貸借対照表
(単位:百万円)
前連結会計年度(2025年3月31日)
資産の部
流動資産
現金および預金
受取手形、
売掛金および契約資産
未成工事支出金
貯蔵品
その他
貸倒引当金
流動資産合計
固定資産
有形固定資産
建物および構築物
減価償却累計額
建物および構築物(純額)
機械装置および運搬具
減価償却累計額
機械装置および運搬具(純額)
土地
リース資産
減価償却累計額
リース資産
(純額)
建設仮勘定
その他
減価償却累計額
その他
(純額)
有形固定資産合計
無形固定資産
のれん
その他
無形固定資産合計
投資その他の資産
投資有価証券
長期貸付金
繰延税金資産
退職給付に係る資産
その他
貸倒引当金
投資その他の資産合計
固定資産合計
資産合計
66,398
67,072
22
2,243
5,511
△1,119
140,129
(単位:百万円)
当連結会計年度(2026年3月31日)
65,866
70,352
53
2,265
5,885
△1,060
143,362
129,599
△84,169
45,429
62,033
△47,007
15,025
44,043
6,159
△3,194
2,965
1,339
12,546
△9,053
3,493
112,296
131,523
△87,304
44,219
63,163
△48,013
15,149
46,702
6,533
△2,978
3,555
3,114
13,081
△9,821
3,259
116,000
2,595
4,250
6,846
2,206
4,399
6,605
13,005
231
5,845
639
10,903
△195
30,429
149,573
289,702
16,883
214
4,728
852
11,254
△175
33,757
156,363
299,726
前連結会計年度(2025年3月31日)
負債の部
流動負債
支払手形および買掛金
短期借入金
1年内償還予定の社債
1年内返済予定の長期借入金
役員賞与引当金
未払費用
未払法人税等
訴訟損失引当金
その他
流動負債合計
固定負債
社債
長期借入金
リース債務
繰延税金負債
再評価に係る繰延税金負債
退職給付に係る負債
役員退任慰労金引当金
長期未払金
資産除去債務
その他
固定負債合計
負債合計
純資産の部
株主資本
資本金
資本剰余金
利益剰余金
自己株式
株主資本合計
その他の包括利益累計額
その他有価証券評価差額金
土地再評価差額金
為替換算調整勘定
退職給付に係る調整累計額
その他の包括利益累計額合計
非支配株主持分
純資産合計
負債純資産合計
16,247
6,190
5,000
2,093
414
15,133
3,262
当連結会計年度(2026年3月31日)
15,589
63,932
14,584
7,452
10,000
2,215
364
15,361
4,110
1,100
17,592
72,781
40,000
4,115
2,473
668
1,118
20,604
91
625
3,207
2,441
75,346
139,278
30,000
5,340
2,633
757
1,111
17,739
93
618
3,294
2,105
63,693
136,475
1,723
1,937
140,453
△6,342
137,772
1,723
1,978
148,579
△6,298
145,982
4,662
△5,502
8,274
1,568
9,003
3,648
150,424
289,702
6,547
△5,518
8,205
3,859
13,093
4,175
163,251
299,726
-
108
Chapter 1
Chapter 2
Chapter 3
Chapter 4
What is KONOIKE
Where we go
How we do
Data
連結損益計算書
(単位:百万円)
前連結会計年度
(自2024年4月1日至2025年3月31日)
売上高
売上原価
売上総利益
販売費および一般管理費
営業利益
営業外収益
受取利息
受取配当金
貸倒引当金戻入額
投資有価証券評価損戻入益
その他
営業外収益合計
営業外費用
支払利息
持分法による投資損失
為替差損
貸倒引当金繰入額
その他
営業外費用合計
経常利益
特別利益
固定資産売却益
投資有価証券売却益
受取保険金
その他
特別利益合計
特別損失
固定資産除売却損
投資有価証券評価損
訴訟損失引当金繰入額
減損損失
火災損失
その他
特別損失合計
税金等調整前当期純利益
法人税、
住民税および事業税
法人税等調整額
法人税等合計
当期純利益
非支配株主に帰属する当期純利益
親会社株主に帰属する当期純利益
連結包括利益計算書
当連結会計年度
(自2025年4月1日至2026年3月31日)
344,987
304,659
40,328
18,942
21,385
355,555
312,227
43,328
20,542
22,785
245
418
59
0
410
1,133
574
444
7
0
567
1,595
373
155
312
214
167
1,223
21,295
583
385
258
144
423
1,795
22,585
30
1,917
-
46
1,995
75
419
284
-
779
118
4
-
1,494
614
200
2,432
20,858
6,727
△459
6,267
14,590
539
14,050
78
-
1,100
31
-
-
1,210
22,154
7,903
△620
7,283
14,871
602
14,268
KONOIKE GROUP Integrated Report 2026
(単位:百万円)
前連結会計年度
(自2024年4月1日至2025年3月31日)
当連結会計年度
(自2025年4月1日至2026年3月31日)
当期純利益
14,590
14,871
その他の包括利益
その他有価証券評価差額金
為替換算調整勘定
退職給付に係る調整額
持分法適用会社に対する持分相当額
土地再評価差額金
その他の包括利益合計
包括利益
△463
2,326
1,197
115
△31
3,144
17,734
1,877
△106
2,269
35
-
4,076
18,948
17,169
564
18,373
574
(内訳)
親会社株主に係る包括利益
非支配株主に係る包括利益
109
Chapter 1
Chapter 2
Chapter 3
Chapter 4
What is KONOIKE
Where we go
How we do
Data
KONOIKE GROUP Integrated Report 2026
連結株主資本等変動計算書
(単位:百万円)
当連結会計年度
(自2025年4月1日至2026年3月31日)
株主資本
資本金
資本剰余金
1,723
当期首残高
利益剰余金
1,937
自己株式
140,453
株主資本合計
△6,342
137,772
当期変動額
剰余金の配当
△6,157
△6,157
親会社株主に帰属する当期純利益
14,268
14,268
-
連結子会社増加による利益剰余金増加高
自己株式の取得
40
自己株式の処分
△0
△0
43
84
15
土地再評価差額金の取崩
15
0
非支配株主との取引に係る親会社の持分変動
0
株主資本以外の項目の当期変動額(純額)
当期変動額合計
当期末残高
-
40
8,126
43
8,210
1,723
1,978
148,579
△6,298
145,982
その他の包括利益累計額
その他有価証券
評価差額金
当期首残高
4,662
土地再評価
差額金
△5,502
為替換算
調整勘定
8,274
退職給付に係る
調整累計額
1,568
その他の包括
利益累計額合計
9,003
非支配株主持分
3,648
純資産合計
150,424
当期変動額
剰余金の配当
△6,157
親会社株主に帰属する当期純利益
14,268
連結子会社増加による利益剰余金増加高
-
自己株式の取得
△0
自己株式の処分
84
土地再評価差額金の取崩
15
0
非支配株主との取引に係る親会社の持分変動
株主資本以外の項目の当期変動額(純額)
1,884
△15
△69
2,290
4,089
527
4,616
当期変動額合計
1,884
△15
△69
2,290
4,089
527
12,827
当期末残高
6,547
△5,518
8,205
3,859
13,093
4,175
163,251
110
Chapter 1
Chapter 2
Chapter 3
Chapter 4
What is KONOIKE
Where we go
How we do
Data
KONOIKE GROUP Integrated Report 2026
(単位:百万円)
前連結会計年度
(自2024年4月1日至2025年3月31日)
株主資本
資本金
資本剰余金
1,723
当期首残高
利益剰余金
1,908
自己株式
130,161
株主資本合計
△6,400
127,393
当期変動額
剰余金の配当
△4,032
△4,032
親会社株主に帰属する当期純利益
14,050
14,050
284
連結子会社増加による利益剰余金増加高
284
自己株式の取得
28
自己株式の処分
△0
△0
58
87
△11
土地再評価差額金の取崩
△11
-
非支配株主との取引に係る親会社の持分変動
株主資本以外の項目の当期変動額(純額)
28
10,291
58
10,378
1,937
140,453
△6,342
137,772
当期変動額合計
1,723
当期末残高
その他の包括利益累計額
その他有価証券
評価差額金
当期首残高
5,116
土地再評価
差額金
△5,482
為替換算
調整勘定
5,882
退職給付に係る
調整累計額
357
その他の包括
利益累計額合計
5,873
非支配株主持分
2,814
純資産合計
136,081
当期変動額
剰余金の配当
△4,032
親会社株主に帰属する当期純利益
14,050
連結子会社増加による利益剰余金増加高
284
自己株式の取得
△0
87
自己株式の処分
△11
土地再評価差額金の取崩
-
非支配株主との取引に係る親会社の持分変動
△453
△20
2,392
1,211
3,130
833
3,964
当期変動額合計
△453
△20
2,392
1,211
3,130
833
14,342
当期末残高
4,662
△5,502
8,274
1,568
9,003
3,648
150,424
株主資本以外の項目の当期変動額(純額)
111
Chapter 1
Chapter 2
Chapter 3
Chapter 4
What is KONOIKE
Where we go
How we do
Data
KONOIKE GROUP Integrated Report 2026
連結キャッシュ・フロー計算書
(単位:百万円)
前連結会計年度
(自2024年4月1日至2025年3月31日)
(単位:百万円)
当連結会計年度
(自2025年4月1日至2026年3月31日)
前連結会計年度
(自2024年4月1日至2025年3月31日)
当連結会計年度
(自2025年4月1日至2026年3月31日)
投資活動によるキャッシュ・フロー
営業活動によるキャッシュ・フロー
税金等調整前当期純利益
20,858
22,154
定期預金の増減額(△は増加)
105
減価償却費
8,788
9,987
短期貸付金の純増減額
(△は増加)
△39
35
減損損失
1,494
31
△9,164
△12,570
有形固定資産の取得による支出
△1,331
のれん償却額
308
428
有形固定資産の売却による収入
255
273
貸倒引当金の増減額(△は減少)
100
△73
無形固定資産の取得による支出
△760
△1,094
訴訟損失引当金の増減額(△は減少)
-
1,100
投資有価証券の取得による支出
△25
△238
退職給付に係る負債の増減額(△は減少)
135
592
投資有価証券の売却による収入
1,918
699
役員退任慰労金引当金の増減額(△は減少)
9
1
△3
△11
△663
△1,019
長期貸付金の回収による収入
7
7
4
-
△0
△0
持分法で会計処理されている
投資の取得による支出
-
△1,493
受取保険金
-
△284
支払利息
373
583
連結の範囲の変更を伴う
子会社株式の取得による支出
△6,808
-
為替差損益
(△は益)
188
48
△368
-
持分法による投資損益(△は益)
155
385
固定資産売却益
△30
△75
受取利息および受取配当金
投資有価証券評価損
投資有価証券評価損戻入益
△1,917
△419
固定資産除売却損
118
78
火災損失
614
-
売上債権の増減額
(△は増加)
△536
△3,340
棚卸資産の増減額
(△は増加)
112
△42
投資有価証券売却損益(△は益)
19
△456
仕入債務の増減額
(△は減少)
△74
1,207
その他の負債の増減額(△は減少)
364
156
その他の資産の増減額(△は増加)
長期貸付けによる支出
連結の範囲の変更を伴わない
関係会社出資金の取得による支出
その他
△2,078
△509
投資活動によるキャッシュ・フロー
△16,960
△16,234
財務活動によるキャッシュ・フロー
短期借入金の純増減額
(△は減少)
社債の償還による支出
1,736
2,738
長期借入金の返済による支出
△242
△1,487
△4,032
△6,157
配当金の支払額
非支配株主への配当金の支払額
△51
△54
ファイナンス・リース債務の返済による支出
△800
△992
307
21
-
△13
△59
245
小計
30,365
31,289
653
918
連結の範囲の変更を伴わない
子会社株式の取得による支出
-
284
その他
△336
△519
財務活動によるキャッシュ・フロー
現金および現金同等物に係る換算差額
保険金の受取額
利息の支払額
1,197
△5,000
長期借入れによる収入
その他
利息および配当金の受取額
726
△10,000
非支配株主からの払込みによる収入
△529
△728
△12,885
△10,476
火災損失の支払額
△356
-
614
81
法人税等の支払額
△6,857
△7,109
現金および現金同等物の増減額
(△は減少)
△5,761
△1,766
営業活動によるキャッシュ・フロー
23,468
24,862
現金および現金同等物の期首残高
68,114
62,704
新規連結に伴う現金および現金同等物の増加額
現金および現金同等物の期末残高
351
-
62,704
60,937
112
Chapter 1
Chapter 2
Chapter 3
Chapter 4
What is KONOIKE
Where we go
How we do
Data
指標
単位
KONOIKE GROUP Integrated Report 2026
サステナビリティデータ集
分類
太陽光発電量※1
環境
エネルギー起源CO2排出量※2
CO2排出量内訳※2
(Scope1+Scope2)
2025年3月期
2026年3月期
kWh
13,091,501
14,758,226
15,663,327
千kWh
96,000
98,480
95,784
都市ガス
3
km
398
435
379
天然ガス
km3
94
85
57
プロパン
t
51
42
31
ガソリン
kℓ
809
842
829
灯油
kℓ
59
62
58
24,913
総発電量
電力
総エネルギー投入量※2
2024年3月期
軽油
kℓ
24,979
25,541
A重油
kℓ
507
554
516
B・C重油
kℓ
1,825
1,807
1,649
石炭コークス
t
6,446
5,518
11,932
無煙炭
t
952
854
0
6,154
5,184
5,797
コークス炉ガス
km
6,809
産業用蒸気
GJ
4,649
5,390
蒸気
GJ
978
975
975
バイオディーゼル燃料※4
kℓ
98
163
277
3
Scope1
t-CO2e
103,426
102,040
117,213
Scope2
t-CO2e
38,330
25,097
16,267
Scope3
t-CO2e
596,154
591,773
567,052
電力
t-CO2e
37,995
24,693
15,836
都市ガス
t-CO2e
886
893
778
天然ガス
t-CO2e
209
166
112
プロパン
t-CO2e
153
125
92
ガソリン
t-CO2e
1,877
1,929
1,902
灯油
t-CO2e
147
155
145
軽油
t-CO2e
64,445
66,920
65,244
A重油
t-CO2e
1,375
1,523
1,419
B・C重油
t-CO2e
5,475
5,603
5,110
石炭コークス
t-CO2e
20,434
17,547
37,944
無煙炭
t-CO2e
2,399
2,255
0
コークス炉ガス
t-CO2e
5,788
4,523
3,810
産業用蒸気
t-CO2e
278
352
379
蒸気
t-CO2e
56
52
52
バイオディーゼル燃料※4
t-CO2e
-
-
656
113
Chapter 1
Chapter 2
Chapter 3
Chapter 4
What is KONOIKE
Where we go
How we do
Data
指標
単位
分類
Scope3※2
カテゴリー別内訳
環境
非エネルギー起源CO2排出量※2
CO2排出削減効果
低公害車
※3
輸送トンキロ※3
2024年3月期
2025年3月期
2026年3月期
カテゴリ1
t-CO2e
-
454,713
428,654
カテゴリ2
t-CO2e
-
27,709
27,392
カテゴリ3
t-CO2e
-
23,130
27,959
カテゴリ4
t-CO2e
-
-
-
カテゴリ5
t-CO2e
-
1,270
1,391
カテゴリ6
t-CO2e
-
1,787
1,809
カテゴリ7
t-CO2e
-
27,242
28,589
カテゴリ8
t-CO2e
-
-
-
カテゴリ9
t-CO2e
-
-
-
カテゴリ10
t-CO2e
-
-
-
カテゴリ11
t-CO2e
-
55,921
51,257
カテゴリ12
t-CO2e
-
1
1
カテゴリ13
t-CO2e
-
-
-
カテゴリ14
t-CO2e
-
-
-
カテゴリ15
t-CO2e
-
-
-
フロン類算定漏えい量
t-CO2e
807
828
2,264
廃棄物由来※5
t-CO2e
87,661
88,006
50,386
バイオ燃料由来
t-CO2e
13
25
68
太陽光発電によるCO2排出削減量
t-CO2e
6,640
6,242
6,625
モーダルシフトによるCO2排出削減量※2
t-CO2e
8,427
73,478
89,451
ポストポスト新長期規制適合車
台
378
449
512
ポスト新長期規制適合車
台
424
392
342
新長期規制適合車
台
92
65
56
ハイブリッド車
台
53
62
69
EV車
台
13
17
13
CNG車
台
14
9
4
LPG車
台
1
1
0
※1、
6
輸送トンキロ※7
万t・㎞
17,055
17,416
18,429
CO2排出量
t-CO2e
25,196
26,214
25,305
0.554
0.572
0.515
348
419
435
原単位※8
水使用量※1
KONOIKE GROUP Integrated Report 2026
上下水道使用量
千m3
114
Chapter 1
Chapter 2
Chapter 3
Chapter 4
What is KONOIKE
Where we go
How we do
Data
指標
単位
分類
労働時間と有給休暇取得日数※3
研修※3
時間
2,248.7
2,241.7
2,223.9
2,131.0
2,141.6
1,993.2
有給休暇取得日数(専門職)
日
15.5
13.1
12.9
有給休暇取得日数(総合職)
日
9.4
8.7
8.7
名
8,336
8,308
8,305
%
10.0
10.5
11.1
名
927
956
981
うち女性従業員比率
%
17.0
18.4
20.0
新卒採用者数(専門職)
名
65
60
67
新卒採用者数(総合職)
名
47
47
49
キャリア採用者数(専門職)
名
458
427
456
キャリア採用者数(総合職)
名
22
44
65
男性育休取得率
%
42.0
70.5
96.4
女性管理職比率
%
3.4
4.2
4.8
障がい者雇用率
%
2.6
2.6
2.5
研修費用
億円
5.3
6.6
7.7
研修時間
時間/人
19.9
20.2
19.3
98
263
371
幸福度(高い方が望ましい)
4.15
4.11
4.12
注意度(低い方が望ましい)
3.15
3.23
3.25
4.29
コーチング累計受講者数
ウェルビーイング・サーベイ※3
名
4.36
4.31
現場への技術導入実績
件
25
24
20
現場への技術導入に向けたPoC
件
45
38
44
技研ICでの技術検証
件
9
9
13
新統合WMS導入実績
件
2
6
14
生成AIを活用したユースケース
件
-
-
7
153
モラール
技術革新※3
ICT・DX※3
技術
安全・品質※1
2026年3月期
時間
従業員数(総合職)
人材
2025年3月期
年間平均労働時間(専門職)
うち女性従業員比率
人
2024年3月期
年間平均労働時間(総合職)
従業員数(専門職)
※3
KONOIKE GROUP Integrated Report 2026
労働災害
件
111
124
自動車事故
件
28
45
57
品質事故
件
23
31
80
労働災害度数率
2.1
2.22
2.84
休業災害度数率
0.28
0.24
0.31
115
Chapter 1
Chapter 2
Chapter 3
Chapter 4
What is KONOIKE
Where we go
How we do
Data
指標
単位
分類
取締役会の構成※3
取締役会※3
2024年3月期
2025年3月期
2026年3月期
名
5
5
8
うち社外取締役
名
3
3
4
うち女性取締役
名
1
1
1
名
4
4
4
うち社外監査役
名
2
2
2
うち女性監査役
名
1
1
1
取締役会開催回数
回
18
17
17
取締役
ガバナンス
KONOIKE GROUP Integrated Report 2026
監査役
※1 対象は鴻池運輸㈱および国内外連結子会社 ※2 対象は鴻池運輸㈱および国内連結子会社 ※3 対象は鴻池運輸㈱ ※4 バイオディーゼル燃料:B5燃料、
B30燃料を含む ※5 廃棄物は、
連結子会社の㈱エコイノベーションの再資源化事業において化石燃料の代替として使用
※6 FIT制度による売電量を含む ※7 輸送した貨物の重量(トン)にそれぞれの輸送距離(キロ)を乗じたものの総合計
※8 エネルギー使用量(原油換算㎘)÷輸送トンキロ(万t・㎞)
環境関連データの第三者認証
KONOIKEグループは、2024年度のGHG排出
(Scope1、
Scope2、Scope3のカテゴリ1、2、3、5、6、7、11、12※1)、
総エネルギー投入量、
自家発電太陽光総発電量※2につい
て、保証機関LRQAリミテッドによるISO14064-3:2019
(GHG)、ISAE3000(改訂版)
(GHG以外)を基準とした
第三者保証を取得しました。今後も、第三者保証を得るこ
とで算出値の信頼性を確保すると共に、保証範囲の拡大
にも取り組んでいきます。
※1 Scope3のカテゴリのうち1、
2、
7、
11、
12の対象は鴻池運輸㈱
※2 対象は鴻池運輸㈱および国内連結子会社
116
Chapter 1
Chapter 2
Chapter 3
Chapter 4
What is KONOIKE
Where we go
How we do
Data
会社情報
KONOIKE GROUP Integrated Report 2026
海外拠点
(2026年8月1日現在)
海外拠点数(13カ国)
38
●現地法人
37
117
(■現地法人の支店(事務所)など拠点)
グループネットワーク
アクスブリッジ
1
▲(駐在員)事務所
Canada
KONOIKEグループのアジア拠点
United States
天津
ロサンゼルス
国内拠点
(2026年8月1日現在)
国内拠点数
182
当社
153
本社
2
支店
12
事業所
139
グループ会社
29
青島
Mexico
China
ニューデリー
モンテレイ
グルガオン
Bangladesh
グアナファト
グアダラハラ シラオ
北海道・東北地区
India
3
事業所
チャティスガール
中部地区
支店
事業所
グループ会社
チェンナイ
ベンガルール
1
17
1
大阪本社
グループ 会社
関西地区
中国・四国地区
事業所
4
グループ 会社
1
バンコク
事業所
グループ 会社
4
50
支店
事業所
1
5
グループ 会社
3
深圳厦門
Canada
カブヤオ アクスブリッジ
Viet Nam
United States Philippines
シンガポール
Singapore
16
Mexico
モンテレイ
Indonesia
グアナファト
グアダラハラ シラオ
ジャカルタ
KONOIKEグループの欧州拠点
KONOIKEグループの北米・中米拠点
Canada
アクスブリッジ
8
United States
ロサンゼルス
九州地区
常熟
上海
寧波
バリアブンタウ
ロサンゼルス
ホーチミン
東京本社
大阪本社支店
広州
香港
ダッカ Myanmar
ハノイ
ハイズン
チェンマイ
ハイフォン
Thailand
ヤンゴン
ダナン マニラ
デュッセルドルフ
関東・甲信越地区
ボッパルト
支店
6
Germany
事業所
60
東京本社
無錫
蘇州
杭州
Mexico
モンテレイ
グアナファト
グアダラハラ シラオ
デュッセルドルフ
ボッパルト
Germany
ニューデリー
グルガオン
Ch
Bangladesh
India
チャティスガール
ベンガルール
チェンナイ
ダッカ Myanmar
ハ
チェンマイ
ヤンゴン
バンコク
Tha
Chapter 1
Chapter 2
Chapter 3
Chapter 4
What is KONOIKE
Where we go
How we do
Data
KONOIKE GROUP Integrated Report 2026
グループネットワーク(2026年8月1日現在)
本部体制
国内子会社
海外関係会社
㈱ エコイノベーション
ASRリサイクリング鹿島㈱
コウノイケ・エキスプレス㈱
鳳テック㈱
FSNL Private Ltd.
中電産業㈱
エヌビーエス㈱
千代田検査工業㈱
Vertex Konoike Engineers Pvt.Ltd.
生活産業本部
九州産交運輸㈱
関西陸運㈱
日本空輸㈱
此花運輸㈱
コウノイケ・コーポレートサービス㈱
Konoike Philippines Corporation
メディカル本部
鴻池メディカル㈱
SPD India Healthcare Pvt. Ltd.
鴻池エアーホールディング㈱
コウノイケ・エアポートサービス㈱
コウノイケ・スカイサポート㈱
㈱Kスカイ
㈱Kグランドサービス
㈱Kグランドエキスパート
日本空港サービス㈱
空港ターミナルサービス㈱
㈱エヌエービー
㈱ジェイフレンドリー
エアーエキスプレス㈱
MacroAsia Airport Services Corporation
国際統括本部
佐野運輸㈱
コウノイケ・シッピング㈱
㈱ ニチウン
Konoike Kanepackage Holding Co., Ltd.
Pine Valley Packaging Group Inc.
Pine Valley Packaging Mexico S.A. de C.V.
Konoike-Pacific California, Inc.
Konoike-General, Inc.
Konoike-E Street, Inc.
Konoike Transport & Engineering (USA), Inc.
Konoike Mexico S.A. de C.V.
Konoike Transport & Engineering (H.K.) Ltd.
鴻池国際貨運(深圳)有限公司
鴻池物流(上海)有限公司
鴻池亜細亜物流(江蘇)有限公司
BEL International Logistics Ltd.
創業國際貨運代理(中國)有限公司
BEL Supply Chain Solutions Ltd.
ICT推進本部
シャイン㈱
コウノイケITソリューションズ㈱
鉄鋼本部
エンジニアリング本部
空港本部
事業開発本部
Ehrhardt Konoike Solutions GmbH
Carna Medical Database Pvt. Ltd.
PKI Manufacturing & Technology, Inc.
PT. Konoike Transport Indonesia
Konoike Vinatrans Logistics Co., Ltd.
Anpha-AG Joint Stock Company
BEL International Logistics Vietnam Company Ltd.
Vinako Forwarding Co., Ltd.
Konoike Transport & Engineering (S) Pte Ltd.
Konoike Asia (Thailand) Co., Ltd.
Konoike Cool Logistics (Thailand) Co., Ltd.
Konoike-Sotus Venture Co., Ltd.
Konoike Express (Thailand) Co., Ltd.
Konoike Myanmar Co., Ltd.
Konoike-EURO Logistics (Bangladesh) Ltd.
Joshi Konoike Transport & Infrastructure Pvt. Ltd.
Konoike India Pvt. Ltd.
118
Chapter 1
Chapter 2
Chapter 3
Chapter 4
What is KONOIKE
Where we go
How we do
Data
KONOIKE GROUP Integrated Report 2026
会社概要 (2026年8月1日現在)
商
鴻池運輸株式会社
代
表
者
代表取締役会長兼社長執行役員
大阪本社所在地
〒541-0044 大阪府大阪市中央区伏見町4-3-9
資
本
金
1,723百万円
東京本社所在地
〒104-0061 東京都中央区銀座6-10-1
従
数
連結:約25,000名/単体:約14,000名
創
業
1880(明治13)年5月
立
1945(昭和20)年5月30日
会
号
株主メモ
社
設
業
員
鴻池忠彦
※上記人数には臨時雇用者数を含みます。
事
業
年
度
毎年4月1日から翌年3月31日まで
定時株主総会
毎年6月開催
基
定時株主総会毎年3月31日
準
日
期末配当金
毎年3月31日
中間配当金
毎年9月30日
その他必要あるときは、
予め公告して定めた日
株式情報 (2026年6月30日現在)
00.0%
発行可能株式総数
227,596,808株
上場証券取引所
東京証券取引所
発行済株式の総数
56,952,442株(自己株式3,852,824株を含む)
証券 コ ー ド
9025
株
6,332名
主
数
プライム市場
株主名簿管理人および
東京都千代田区丸の内一丁目4番1号
特別口座の口座管理機関
三井住友信託銀行㈱
株主名簿管理人
大阪市中央区北浜四丁目5番33号
事務取扱場所
三井住友信託銀行㈱
郵便物送付先
〒168-0063
東京都杉並区和泉二丁目8番4号
三井住友信託銀行㈱
電話照会先
大株主(上位10名)
株主名
持株数(株)
持株比率
(%)
江之子島商事㈱
5,040,888
9.49
日本マスタートラスト信託銀行㈱
(信託口)
4,448,700
8.37
鴻池運輸従業員持株会
3,848,792
7.24
銀泉㈱
3,598,274
6.77
鴻池忠彦
2,846,878
5.36
㈱三井住友銀行
2,480,022
4.67
外国法人など
213 名
(3.36%)
よくあるご質問(FAQ)
https://www.smtb.jp/personal/procedure/agency/
https://faq-agency.smtb.jp/?site_domain=personal
お手続き方法やよくあるご質問は、
上記
「よく
あるご質問
(FAQ)
」
サイトでご確認いただけ
所有者別
株主数分布状況
ます。
個人・その他
6,017 名
(95.02%)
金融商品取引業者
498,502 株(0.87%)
2,248,912
4.23
㈱日本カストディ銀行
(信託口)
1,893,600
3.56
(6.76%)
鴻池忠嗣
1,623,444
3.05
外国法人など
日本製鉄㈱
1,591,118
2.99
2.
持株比率は自己株式を控除して計算し、
小数点第3位以下を切り捨てています。
自己株式 1名(0.01%)
インターネットホームページURL
公
告
方
法
当社のWebサイトに掲載いたします。
(https://www.konoike.net/)
ただし、
事故その他やむを得ない事由が生じ
たときは、
日本経済新聞に掲載いたします。
大阪瓦斯㈱
(注)
1.
当社は自己株式を3,852,824株保有していますが、
上記大株主からは除外しています。
証券代行部
0120-782-031
受付時間 9:00~17:00
(土日休日を除く)
(0.31%)
金融機関 20 名
金融商品取引業者
26 名(0.41%)
その他の
国内法人
55 名
(0.86%)
証券代行部
自己株式
3,852,824 株
9,349,661 株
(16.41%)
個人・その他
所有者別
株式数分布状況
17,807,490 株
(31.26%)
金融機関
11,024,958 株
(19.35%)
その他の国内法人
14,419,007 株
(25.31%)
119