INTEGRATED 統合報告書 2026 REPORT 2 Purpose |パーパス Philosophy |経営理念 この街に、 ひとつでも多くの喜びを。 未来への扉を 。 私たちは、中古再生住宅のパイオニアとしての誇りと責任をもって、中古住宅業界を先導し、…
INTEGRATED 統合報告書
2026
REPORT
2
Purpose
|パーパス
Philosophy
|経営理念
この街に、
ひとつでも多くの喜びを。
未来への扉を 。
私たちは、中古再生住宅のパイオニアとしての誇りと責任をもって、中古住宅業界を先導し、
私たちは、「くらしに価値タス」活動を通じて、
「無駄なく家を住み繋ぎ、地域を大事にする」
地域とそこに暮らす人々の生活にひとつでも多くの「未来への扉」を提供し、
住まい方ができるよう、
「くらしに価値タス」ことを通じて、地域とお客様に。
住宅市場を変えていく。
お客様からは「カチタスに売ってよかった」「カチタスで買ってよかった」と
最高の笑顔をいただき、お取引先とは「カチタスとずっと付き合いたい」と深い絆でつながり、
従業員一人ひとりがカチタスの
一員であることを誇りに思う会社にしていく。
そのために、昨年よりも、昨月よりも、
一棟でも多くのいい商品を企画し、
ひとつでも多くの
昨日よりも一棟でも多くのいい仕入れをし、
一棟でも多くの販売をしていくことで、
幸せな暮らしを支援していく。
土地開発を前提とした新築中心の日本の住まい方から、
既存の家を再生して住みつなげるという新しい住まい方を提唱して、
地域の活性化・発展を支援し続けていく。
3
トップメッセージ
第4次中期経営計画、力強いスタート
第4次中期経営計画の初年度となる 2026 年3月期は、販売件数8,380 件、営業利益182 億円、
ROE 25 .2%となり 、 3つの重要経営指標すべてにおいて目標を達成することができました
。特に
最重要経営指標である営業利益については 、上半期の決算発表時に当初予算 162 億円から 178 億円
人と組織の成長を力に、販売件数 1万件へ
へと上方修正し 、従業員への決算特別賞与の5億円を支給したうえでも超過達成するという
変良い決算であったと評価しています
「この街に、ひとつでも多くの喜びを
。」
解でき 、 この好業績を牽引したのは 、「営業人員数の増加」 と 「生産性の向上」 を両輪とする成
この 事業を通じて 「増加する空き家問題の解決」「手ごろな価格の住宅
( アフォーダブル住宅 ) の提供」 などの多くの社会問題 を 解決しながら 事
業の成長ができると考えています
。 また 、外部環境では省エネ基準の適合義務化や建築基準法の
改正により新築住宅の建設コストが構造的に上昇しています
。 さらに建築コストの上昇は
積にも影響を与え 、新築住宅が縮小していく兆しがあります
。 そのような環境の中で 、「手ごろ
な価格で広くゆとりある住まいを
て販売しています 。
。
当社の売上高は、「営業人員数×生産性( 1人当たりの売買件数 ) =販売件数・売上高」 と分
長戦略が着実に機能したことです
私たちは地方を中心に空き家 の住宅を仕入れ 、 リフォームにより再生し
、大
」 というニーズが一層顕在化しており
供する価格と広さという価値への社会的期待は
、床面
、中古住宅再生事業が提
、今後さらに大きくなると考えています
。
カチタスの強み
。
今後も期待を超える価値を 、皆様に届けてまいります 。
当社の最大の強みは、長年にわたり蓄積してきた独自のナレッジです
。累計10 万件( 連結) を
超える物件の仕入れ時の状態、 リフォームの企画、販売価格等の情報は外部には一切公開されて
いない 、当社固有の資産です 。 それらは 、「社内のベストプラクティスを徹底的に学習
株式会社カチタス
代表取締役社長
新井健資
してさら
に進化させること 」 が根付いた文化の中で 、表彰式における成功事例共有を通じて全社に発信さ
れ続けてきました 。外部出向を経て 2年ぶりに戻ってきた社員が 「別の会社かと思った 」 と語っ
ていたことは 、私にとって非常に印象的で 、日々の小さな積み重ねは気づきづらいものの
積み重ねの結果で大きく変化し続けていると確信しました
さらにもう一つの強みは
、物件やお客様に合わせたリフォームを企画できる
中古住宅は一つとして同じ物件がありません
、 その
。
「現場力」 です 。
。物件の状態とお客様の予算を踏まえ 、 どこを直
し 、 どこを活かすのかを見極める 「引き算のリフォーム 」 が重要になります 。 この判断はマニュ
アルだけで再現できるものではなく
、現場で培われた経験によって支えられています
蓄積されたナレッジと現場力が組み合わさることで
フォーダブルな住まいを提供することができます
。
、多様な住宅ニーズに応えながら 、 ア
。 お客様からも 「浮いたお金を教育費に回すこ
とができる 」「部分リフォーム物件の価格だから購入することができました
」 という喜びの声を
いただきました 。 さらに 、 ひとり親世帯、高齢者、外国人など 、賃貸住宅への入居が断られやす
い、 いわゆる 「住宅弱者」 の方々へも住まいを届けられていることは
に価値タス 」 の実現に繋がっていると考えています
。
、私たちが目指す 「 くらし
累計 10 万件を超える積み上げてきたナレッジを
4
未来の価値創造へつなげる
成長戦略
― 基本戦略の深化と、中計が描く新たな成長
は工場などの設備はなく 、価値創造の源泉は「人」 であり 、 そこにナレッジと
当社の成長を支える基本戦略は 、「営業人員数の増加」 と 「生産性の向上」
採用・育成にとどまりません 。頑張った人がしっかりと報われ
現場力が積み上がることが 、事業の競争力そのものになります 。人への投資は
、長くカチタス
で働きたいと思っていただけるよう報酬制度や職場環境の整備にも取り組んで
です 。
営業人員数の増加は、売買件数を増やす重要な成長ドライバーです
し 、採用した人材がすぐに戦力になるわけではありません
見極め、適切なリフォームを企画し
います 。具体的には、 2012 年の現経営体制への変更前に比べ 、従業員1人当た
。 しか
。仕入れ時に物件を
、 お客様へ価値を届けるためには経験の蓄
積が必要です 。経験を重ねナレッジを蓄えた人材が増えることで
、売買件数は
りの報酬や年間休日は約 2倍以上増えています 。会社が成長し 、利益が出て 、
それが従業員に還元され 、 より働きやすい環境で長く働いていく
そ、当社の事業にとって最も大切なものだと考えています
、 この循環こ
。
人材と在庫への投資の次の優先事項は M&A です 。統合から 10 年が経過したリ
安定的に伸びていきます 。
2012 年に現経営体制の発足以降、新卒採用を開始しましたが 、現在の営業メ
ンバーおよび店長における新卒入社者の割合はいずれも
6割を超え 、営業人員
プライスでは 、 この PMI を通じて売上高、営業利益ともに約 5倍まで成長しま
した 。 キーマン人材もほとんど流出することなく
、優秀な社員が残りながら成
層の厚みが一段と増しています 。 さらに 、今回の中期経営計画から採用目標を
長を続けています 。背景には、築古・地方を得意としてきたカチタスから
従来の年間約100 名から引き上げ 、 2年目である 2026 年4月は計画を超える 152
件当たりの価値と利益を高めるリフォーム企画
名を採用することができました
共有できたことがあります
。一方で、 リプライスからカチタスへは生産性向上
のノウハウを得ることができ
、良いシナジーが表れていると評価しています
。合わせて 、安定成長の実現に向けて 、管理部
門の執行役員・部長クラスの幹部人材の採用も行いました
。現場が安心して働
き 、成果を伸ばしていける組織基盤を 、人事面からも強化できました
くらしに価値タス
2012 年に現経営体制が発足して以来、目標として掲げてきた年間販売件数
成長を守る
、書類作成時
万件の達成が、 いよいよ現実味を帯びてまいりました
売るならカチタス
― お引渡し後の不具合なき成長
AIに学習させることで
「 カチ
、家を買うならカチタス
私たちが事業成長するうえで 、気をつけていることは
、 お引渡し後の不具合
」 と想起していただけることを目指
宅購入時には、 まずカチタスの物件を見たいと思っていた
」「住
」「実家がカチタス
タス固有の判断エンジン 」 を育てる構想も進めています 。 10 万件を超える取り
です 。特に、事業が拡大するなかで 、調査不足や確認漏れが発生すれば 、 お引
の家だったので 、入社して自分も住宅を届けたい 」 などの声をいただく機会も
扱いデータを持つ当社だからこそ実現できる競争力の強化を目指しています
渡し後の不具合につながります 。 それはお客様の信頼を損ない 、営業現場の疲
増えてまいりました
弊や人材流出を招くことになります
単なる住宅ではなく 、「 くらしの選択肢」 そのものであると実感しています
。
第4次中期経営計画ではこの基本戦略に加え 、複数の成長戦略を掲げていま
。 これは過去に私たち自身が経験した教訓
す。新築検討層を意識した 「戦略在庫」 の販売構成比率の向上、 ファミリー層
であり 、事業運営における最大のリスクだと考えています
以外への「低価格商品」 の浸透、 さらには人口の少ない小規模エリアへの出店
フォームで再生できない物件の仕入れを防ぐために
、「一件一件、丁寧に調査
など 、将来の収益基盤となる取り組みが着実に根付きつつあります
して仕入れる 」 ことが最も重要だと考えています
。 そのうえで 、 お客様が安心
。
して暮らせるリフォーム企画
成長への投資
成長戦略を実現していくための資本配分において
、 リフォーム工事完了時の抜け漏れのない確認を
徹底しています 。 この地道な取り組みを続けることが
― 人材・在庫への集中と、統合の成果
、私たちが最優先に位置づ
けているのは 、「人材の採用・育成」 と 「在庫( 商品) への投資」 です 。当社
。 そのため 、 リ
、 お客様からの長期的な
信頼、社員の働きやすい環境づくりに繋がっていくと考えています
。 そのため
には、急速な事業成長を目指さずに 、質と量のバランスを保つことが持続的な
。 こうした声に触れるたびに
、私たちが提供しているのは
さらに 、 2035 年には2万件を現実的な目標としてとらえています
私たちが目指しているのは数字の拡大ではありません
。
。 しかし 、
。
日本では 、人口減少が進む一方で空き家は増加し 、住宅価格の上昇によって
マイホーム取得のハードルは高まっています
。 そうした社会の中で 、「住みた
い場所で 、無理のない価格で 、自分らしい暮らしを実現できること
ますます重要な社会的価値になると考えています
」 は、今後
。
私たちは 、流通していない住宅に新たな価値を吹き込み
、次の住まい手へつ
成長には不可欠であり 、 さらにはリーディングカンパニーとして業界全体の信
なぐことで 、誰もが住まいを持つ喜びを実感できる社会を実現すべく事業運営
頼を守る責任を担っていると考えています
してまいります 。
。
1
。 これはお客様に 「家を
した目標です 。最近では 「実家は最初からカチタスに売ると決めていた
間の短縮や市場分析の効率化等のDX施策は、全社的に重要な取り組みです 。 さ
らに中長期的には 、社内に蓄積されたナレッジを
― 次の10 年に向けて
。
。
生産性の向上は、同じ営業人員数でより多くのお客様に価値を届けるドライ
バーです 。「 お客様と向き合う時間」 を最大化することを目指す
、1
、人事・ インセンティブ制度を
5
目次
パーパス・
経営理念
パーパス・経営理念
2
トップメッセージ
3
目次
5
成長の基本戦略
15
統合報告書の全体像と価値創造プロセス
6
人事管掌役員インタビュー
16
企業価値向上に向けた戦略
7
事業戦略管掌役員インタビュー
18
人的資本経営を起因とするインパクトの創出
20
マテリアリティ(インプット)
21
中期経営計画の取り組み
22
財務戦略
23
財務ハイライト
24
ト
ッ
プメ
ッ
セージ
03成長戦略
03
01社会課題の解決
01
社会課題の解決
カチタスが取り組む社会課題
カチタスが創出する価値
(マテリアリティ(アウトプット))
9
10
成長戦略
02価値創造の仕組み
04成長基盤
02
価値創造の仕組み
ビジネスモデル
「失敗の歴史」が築いた模倣困難な
競争優位性
04
12
13
成長基盤
事業成長を推進する取締役会
26
コーポレートガバナンスの体制
27
編集方針
カチタスは、空き家を再生し、手ごろな価格で住宅を提供
することで、社会課題の解決と企業価値の向上を両立して
います。
本統合報告書は、<カチタスが持続的に利益を生み出せる
理由=カチタスの「稼ぐ力」>に焦点をあて、競争優位性
の源泉と今後の成長戦略を中心に構成しました。本年度は
情報を網羅するのではなく、中核となる論点を絞ってお伝
えします。
①事業機会空き家の増加と住宅価格の高騰が、地方・築
古・戸建の再生住宅への需要をどう広げているのか。
②競争優位性買取再販事業のパイオニアとして、現場経
験をノウハウへ昇華し再現性を高めてきたことが、商品品
質と収益力の差別化にどうつながっているのか。
③成長の持続性営業人員数の増加と生産性の向上を両輪
に、その基盤である人的資本の充実を通じて、いかに持続
的成長を実現するのか。
特に、次の 3つの視点でお読みください。
今後もステークホルダーの皆様との対話を通じて、適切な情報開示と、さらなる企業価値向上
につながるよう取り組んでまいります。
なお、本統合報告書に掲載していない財務・非財務情報の詳細は、当社
WEB サイトをご参照く
ださい。
6
統合報告書の全体像と価値創造プロセス
01
02
事業環境
03
価値創造の仕組み
外部環境(社会課題)
成長戦略
ビジネスモデル
増え続ける空き家
相続等により、
全国で空き家が増加
仕入
マテリアリティ
(インプット)
販売
リフォーム
住宅価格の高騰
手ごろな価格の
住宅ニーズが高まる
成長の方程式
営業人員数の増加
生産性の向上
×
=
人的資本の
質的・量的向上
仕入から販売まで一気通貫
マテリアリティ
(インプット)
マテリアリティ
(インプット)
カチタスが創出する価値
社会的インパクトの創出
競争優位性の源泉
マテリアリティ
(アウトプット)
歴史的起点
第4次中期経営計画目標と施策
失敗が「仕組み」の種に
「空き家」問題の解決
計画
平均成長率
(CAGR)
10,000 件超
10.7% 超
営業利益
23,000 百万円
17.4%
ROE
最低20% 以上を
維持
25 %を目指す
配当性向
50.0 %以上
かつ累進配当
2026 年3月期年間仕入件数 7,682 件
(内、空き家仕入件数
5,691 件)
中古戸建住宅の
特有のリスク
「空き家」を再生するインパクト
1物件当たりの経済効果
1物件当たりの受益者数
1,960 万円
5.9 人
仕組みへの変換
「アフォーダブル住宅」の提供
経済性
新築の半額程度
月々の支払いが家賃以下( 5万円以下など)
品質
安心・清潔・実用的
建物調査とリフォーム品質の標準化を徹底
対象
住宅取得を希望する人びと
ファミリー世帯・ひとり親世帯・シニア世帯
環境負荷の低減
04
成長基盤
顧客
クレーム
マテリアリティ
(アウトプット)
三者立会いによる
リスク低減
組織・階層間の
情報断絶
社員の離職
販売件数
失敗を防ぐための制度設計
お客様相談室
社員疲弊を防ぐ
テレビ朝会
情報の歪みを防ぐ
持続的なパートナーシップ
による地域コミュニティへの貢献
商品品質の向上
採用・育成の
質の向上と組織強化
営業人員数の増加と
育成強化
仕入れチャネルの
多様化
生産性向上
M &A
リフォーム企画の
多様化
リプライスの収益の
安定性アップ
創出したキャッシュを再投資
成長を支えるキャッシュ創出
財務戦略
競争優位性
事業が拡大するとともに
知見が蓄積され、
優位性が継続的に強化される
事業成長を推進する取締役会
多様なスキルと知見が支える経営体制
高いROE の維持
成長のための投資
コーポレート・ガバナンス
健全で透明性の高い経営の実践
安定的な株主還元
7
企業価値向上に向けた戦略
カチタスは、中古住宅買取再販事業を通じた社会課題の解
価格で手ごろな住宅(アフォーダブル住宅)を提供すること
決が、持続可能な社会の実現につながるとともに、カチタス
で、お客様のより良い暮らしの実現を支えています。また、
の持続的な成長と企業価値の向上につながるものと考えてい
都市郊外や地方都市を中心に事業を展開することで、地域に
ます。その実現に向けて、持続的な成長と企業価値の向上に
おける雇用の創出にも寄与しています。
必要な課題を整理し、マテリアリティ(重要課題)を特定し
ています。
3/4を占める空
き家を再生・流通させることで、日本で増加する空き家問題
社会に提供する価値
マテリアリティ
課題項目
カチタスでは、特定したマテリアリティを踏まえ、中期経
営計画の策定や事業運営の方向性を検討し、社会課題の解決
具体的には、カチタスが買い取る住宅の約
アウトカム
空き家問題の解決
社会的インパクトの創出
と事業成長の両立を図ることで、持続可能な社会の実現と企
手ごろな価格の
住宅の提供
業価値の向上を目指してまいります。
の解決に貢献するとともに、新築住宅と比べて約半額程度の
事業活動に伴う
CO2 排出量の抑制
環境負荷の低減
戦略の全体像
中期経営計画・事業
計画
2028 年 3 月期
進捗
26 年3月期
仕入れた物件の空き家の比率
(単体)
毎年70%以上
74.1 %
販売件数
2028 年までに 1万件
8,380 件
住宅価格年収倍率(単体)
毎年5倍以下
4.4 倍
スコープ 1,2 の削減
2030 年までに 50 %削減
(2021 年3月期比)
52.8 %
スコープ 1,2,3 の削減
2030 年までに 10 %削減
( 2023 年3月期比)
7.0 %
施策
価値創出を支える基盤
マテリアリティ
マテリアリティ
ひとつでも多くの
「より良い暮らし」
を提供 し続けることで、
ステークホルダーの皆様 に貢献し、
商品品質の向上
サステナブルな社会の実現 を目指して
まいります。
経営理念
目標
販売件数 1 万件超、
営業利益 230 億円に向けた
インプット
サステナビリティ基本方針
KPI
未来への扉を。
「くらしに価値タス」ことを
通じて、地域とお客様に。
人的資本の質的・量的向上
パーパス
この街に、
ひとつでも多くの喜びを。
持続的な
パートナーシップによる
地域コミュニティへの貢献
課題項目
KPI
目標
進捗
26 年3月期
引渡し後の
不具合の抑制
補修費用が売上高に占める比率
毎年0.3 %程度
0.28 %
お客様満足度の向上
Google 口コミの平均値(単体)
毎年4.0 以上
4.68
販売物件の
耐震性能の向上
耐震基準適合物件数(単体)
2030 年までに
90 %以上
82.9 %
全社横断的な取り組み
による生産性の向上
営業社員1人当たりの
売買件数(単体)
2030 年までに 20
件
20.6
働きやすい環境づくり
従業員エンゲージメント(単
体)
毎年BBB以上
BBB以上
優秀な人材の
リテンション
全社員の離職率(単体)
毎年10%程度
10.6 %
ダイバーシティの推進
管理職への登用者に占める
女性比率(単体)
2030 年までに
30 %以上
32.0 %
工務店など地域社会
への経済便益還元
工務店への発注件数
=仕入件数
2028 年までに 1万
件
9,804 件
工務店の事業継続支援
工務店の休業日数1日以上の事故
発生件数(単体 /1,000 棟当た
り)
毎年3件以下
1.71
01
8
社会課題の解決
提供価値
ご売却いただくお客様
他社とは違う視点で住宅の価値を見出し、早い対応で手離れがよく、
安心できる買い取りを実現する
ご売却いただいたお客様からの声 ①
相続した実家は 、大量の荷物が残り 、
遠方から管理に困っていました
。査定
依頼した他社には 「解体するしかな
い」 と言われました 。 カチタスは家の
価値を認めてくれたうえ
、荷物を引き
取ってくれて肩の荷が下りました
。
ご売却いただいたお客様からの声 ②
カチタスから住宅を購入し
、私の実家
の売却もさせていただきました
。
カチタスのすばらしさは分かっていた
ので 、実家を売却するならカチタスと
決めていました 。売主の立場になった
ときに 、実家の暮らしぶりのヒアリン
グや丁寧に物件調査をしていることを
知り 、購入した住宅への安心感がいっ
そう増しました
。
施工会社様
従業員
ご購入いただくお客様
仲介会社様
株主の皆様
ホーム単色塗り
つぶし
9
カチタスが取り組む社会課題
人口減少・少子高齢化と都市部への人口集中を背景に 、空き家の増加と住宅価格の高騰という
2つの社会課題が深刻化し 、生活や地域経済にさまざまな影響を及ぼしています
。
01
社会課題の解決
増え続ける空き家
住宅価格の高騰
社会課題の解決
当社が取り
組む社会課題
当社が取り組む社会課題
当
(
マ
社
テが
リ
ア
創
リ
出
ティ
す
(
る
ア
価
ウト
値
プッ
ト)
)
空き家戸数・率予測
2,500
50%
1,887
2,000
3,000
1,500
空き家戸数(万戸)
空き家率
1,000
500
0
1,288
268
330
394
576
448
9.4% 9.8%
7.6% 8.6%
11.5%
659
757
820
849
2,774
2,652
25.6%
2,500
20%
2,000
21.9%
13.8%
12.2% 13.1% 13.5% 13.6%
15.6%
18.4%
2,845
02
価値創造の仕組み
30%
1,051
900
2,784
(マテリアリティ(アウトプット))
3,113
3,073
40%
1,575
当社が創出する価値
住宅価格の推移 ( 地方エリア )
( 万円)
3,500
1,693
1,808
1,886
1,867
1,889
1,886
1,552
1,608
1,643
1,631
1,703
1,500
10%
1,000
1,498
2020
2021
新築戸建て
0%
出所:実数値については総務省資料「令和5年住宅・土地統計調査住宅数概数集計(確報集計) 」、
推計値については株式会社野村総合研究所「 2040 年の住宅市場と課題 ~変わりゆく住宅着工の潮流、変化に対応し
た取組を~( 2025 年6月12日)」に基づき当社作成
価値創造の仕組み
成長戦略
2022
2023
中古戸建て
(出所)レインズデータライブラリーおよび社内情報より当社作成。地方エリアは、
葉県、愛知県、大阪府以外の地域。 カチタスの価格は税込金額
2024
03
成長戦略
2025 ( 年度)
カチタス
東京都、神奈川県、埼玉県、千
成長基盤
04
成長基盤
老朽化による倒壊
不動産価値の低下
管理されないまま放置された家屋は
住宅取得の困難化
地域経済の停滞
、老朽化が急速に
空き家となった家屋は建物としての価値が下がり
、維
住宅価格の上昇が続き 、特に若年層や子育て世帯に
住宅取得の費用が増えると 、購入者の可処分所得が目
進みます 。台風や地震などの災害時に倒壊すれば 、近
持・解体費用を織り込んだ価格でしか取引されず
、更
とって住宅取得のハードルが高まっています
。必要な
減りし 、地域での消費が抑制されます 。取得を諦める
隣住民や通行人に危害を及ぼし 、所有者が損害賠償責
地よりも低い価格になりがちです
、希望
人が増えれば地域への人口流入も細り 、経済の活力低
任を問われるおそれもあります
して認められなくなると固定資産税の軽減措置の対象
するエリアや広さを見直したりするケースが増えてい
下につながります 。住宅需要の停滞は地域内の資金循
再生が難しく 、取り壊す以外の選択肢がなくなってし
から外れ 、税負担が増える場合があります 。空き家が
ます 。 こうした状況は 、住まいの質や豊かな暮らしの
環を鈍らせ 、商業・ サービス業を含む地域経済全体の
まいます 。
多い地域では 、周辺の不動産価格も下がりやすい傾向
実現にも影響を及ぼします 。
持続的な成長を妨げる要因となります
。傷みが激しい家屋は
。 また 、住宅用地と
資金負担が増すことで 、 マイホームを諦めたり
。
があります 。
治安・景観・衛生環境の悪化
地域コミュニティへの負担
家計負担の増加
地域コミュニティの弱体化
空き家は 、不法侵入や犯罪の温床となるほか 、放火の
人が住まなくなった家は手入れが行き届かず朽ちてい
住宅価格の上昇は 、住宅ローンや頭金といった取得費
住宅取得の困難化で若い世帯の流入が減ると 、高齢化
標的にもなりやすく
、発見が遅れて被害が拡大するお
き 、周辺の景観や住環境を悪化させます 。管理や解体
用を押し上げます 。家計に占める住居費の割合が高ま
と人口流出が進み 、地域コミュニティの維持が難しく
それがあります 。 また 、雑草の繁茂や害虫・害獣の発
には多額の費用がかかり 、所有者が対応しない場合に
ると 、教育・子育てや老後への備えなど 、他の支出に
なります 。人口減少が進むほど地域は縮小し 、店舗・
生により 、周辺の衛生環境が損なわれることもありま
は行政代執行によって自治体が解体することもありま
回せる余裕が減少します 。住居費の負担増は家計の余
医療機関・公共交通などの生活インフラの維持も困難
す。空き家の増加はこうした治安
すが、 その費用が自治体の負担となる場合がありま
力を圧迫し 、将来設計にも影響を与えかねません 。
になります 。防災・防犯活動や地域行事の担い手が減
・衛生面の悪化を招
き 、地域住民の安心や生活の質を損なう要因となりま
す。空き家の増加は地方自治体の財政を圧迫し 、教育
れば、住民同士のつながりも薄れていきます
す。
や福祉など他の公共サービスに充てる予算を削り
た状況は地域の支え合いや安全性を弱め 、住み続けら
民生活にも影響を及ぼします
。
、住
れるまちづくりの基盤を損なう要因となります
。 こうし
。
ホーム単色塗り
つぶし
10
カチタスが創出する価値(マテリアリティ(アウトプット))
カチタスは空き家を再生し
、手の届きやすいアフォーダブル住宅として提供することで増え続ける空き家
また 、再生できる建材・建具の再活用により環境負荷の低減についても貢献しています
・住宅価格の高騰といった社会課題を解決しています
。
01
。
社会課題の解決
社会課題の解決
空き家問題の解決
年間仕入件数(単体)
年間販売件数(単体)
7,682件
6,422件
取扱物件の約7割が空き家、
既存住宅ストックの有効活用
アフォーダブル住宅の提供
当社が取り
組む社会課題
当社が取り組む社会課題
当
(
マ
社
テが
リ
ア
創
リ
出
ティ
す
(
る
ア
価
ウト
値
プッ
ト)
)
(マテリアリティ(アウトプット))
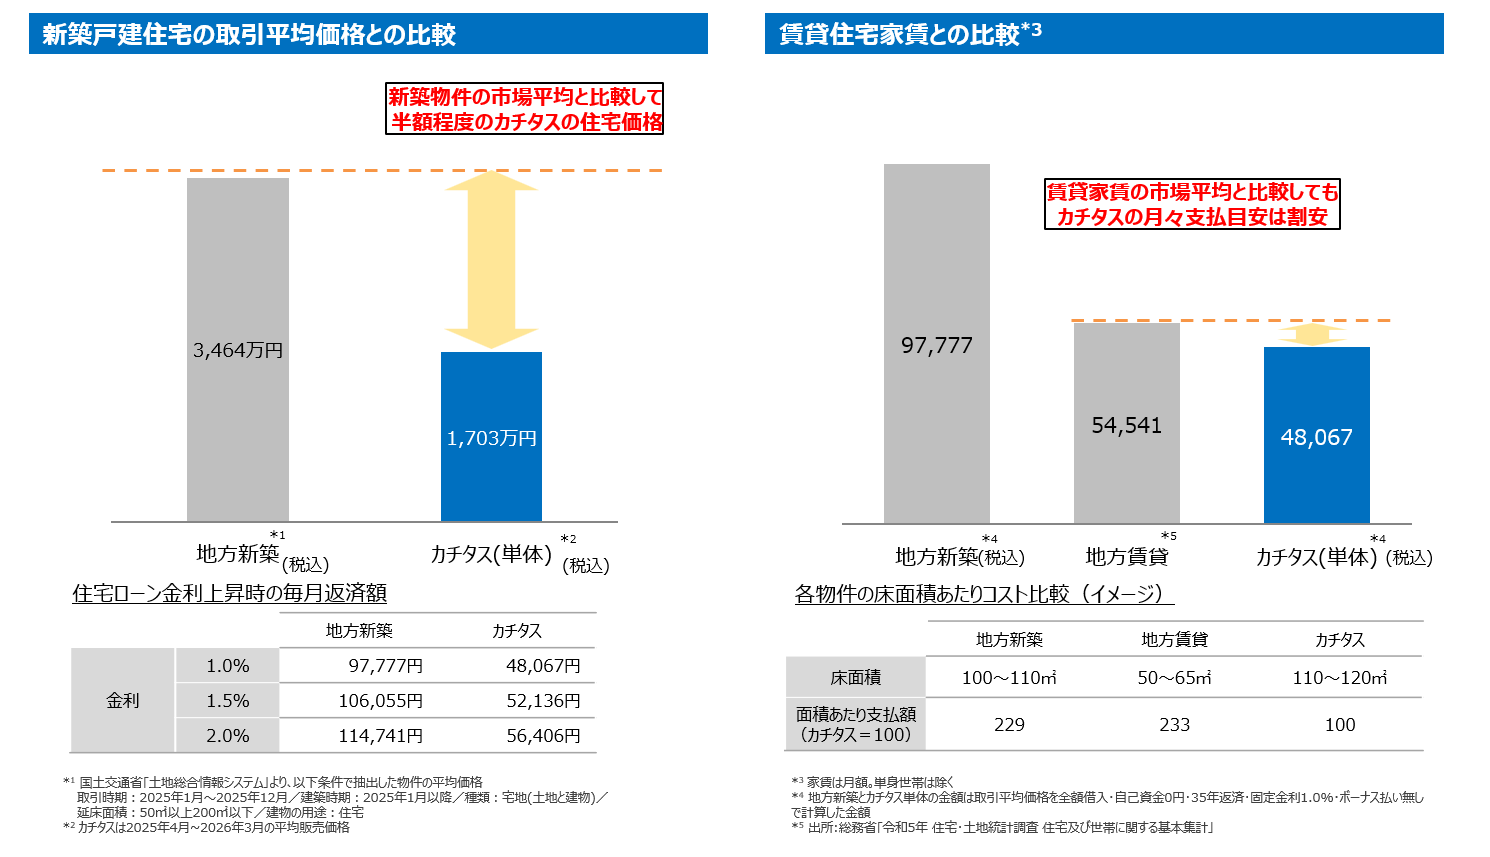
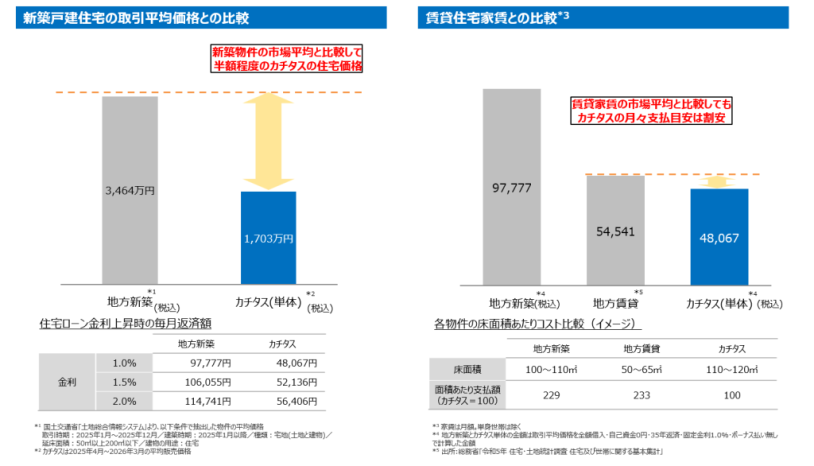
賃貸家賃の市場価格と
比較しても、
カチタスの
月々支払目安は割安
月々の支払い額
売却時の居住状況
当社が創出する価値
新築住宅の約半額での提供による
住宅取得機会の創出
居住中
25.9%
97,777
02
価値創造の仕組み
価値創造の仕組み
成長戦略
成長戦略
54,541
48,067
地方賃貸*3 *4
カチタス(単体)*1(税込)
空き家
03
74.1%
地方新築 12 (税込)
*1 地方新築と カチタス 単体の金額は取引平均価格を 全額借入・自己資金0円・35 年返済・固定
金利1.0% ・ボーナス払い無しで計算した金額
*2 出所 : 国土交通省「不動産情報ライブラリ 」より抽出
*3 家賃は月額。単身世帯は除く
*4 出所 : 総務省「令和5年住宅・土地統計調査住宅及び世帯に関する基本集計」
出所: 2026 年3月期実績(単体)
環境負荷の低減
今ある資源・資産の循環による
サーキュラーエコノミーの実現
多様なライフスタイルに応える住まいの提供
Scope 1, 2, 3における排出量の削減
カチタスが空き家を 1物件再生する経済的インパクト
毎年の固定資産税: 5万円×10 年
生活品等を処分する費用
将来発生する建て壊し費用
新築に比べて安価になった金額
50 万円
30 万円
120 万円
1,760 万円
940,452
1,960 万円
3.2 人
5.9人
ESGデータブックをご覧ください。
三世帯同居
単身
その他
24.2 %
39.3 %
14.8 %
4.9 %
11.8 %
5.0 %
6.702
6.500
購入者の年齢層
6.422
6.025
6.211 ( 2030 年度目標)
6.000
237
2024/3
Scope1
2025/3
Scope2
2026/3
Scope3
26.9%
原単位(右軸)
カチタス
30.1%
26.7%
14.3%
13.4%
18.4%
8.1%
230
2,530
5.500
220
2,358
2,400
0
分譲戸建
43.8%
600,000
200,000
2.7 人
ひとり親と
子ども
出所: 2025 年4月~2026 年3月までのカチタス単体の実績から加工
400,000
買取時の受益者
1人の被相続人に対する相続人人数
販売時の受益者
住宅の平均居住人数
7.000
夫婦と
子ども
865,560
811,157
800,000
1物件に係る受益者数
経済的なインパクトの創出の詳細は、
1,000,000
夫婦のみ
30 歳未満
30 代
40 代
50 代
11.1%
5.0%
60 歳以上
出所: 2025 年4月~2026 年3月までのカチタス単体の実績から加工
国土交通省「令和 6年度住宅市場動向調査報告書」経年変化比較表(分譲住宅)一戸建て
成長基盤
04
成長基盤
02
11
提供価値
価値創造の仕組み
ご売却いただくお客様
施工会社様
頻度と精度の高い発注を通じて
経営を安定させ、互いによい仕事をするためのパートナーとなる
施工会社様からの声 ①
安定した発注数と早いサイクルの支払
いで 、安心して工事を請けることがで
きます 。工事の指示書も細かいので工
事中に迷うことがなく
、困ったときに
はすぐに相談できるので 、後々のトラ
ブルもありません 。中東情勢の影響で
一部の工事代金を前払対応してもらえ
たのも助かりました
。 こうして寄り添
う姿勢を見せてくれるカチタスだから
こそ 、安心して仕事を続けられます
。
施工会社様からの声 ②
カチタスは 、一緒に商品を作っていく
パートナーだと思って仕事をしていま
す。自社の大工もカチタスの耐震施工
をきっかけに勉強をして
、 できること
が増えました 。
従業員
ご購入いただくお客様
仲介会社様
株主の皆様
ホーム単色塗り
つぶし
12
ビジネスモデル
01 仕入
仕入れて、
01
社会課題の解決
社会課題の解決
仕入れ力・目利き力により再生可能な物件を厳選買取
02
リフォームして、
価値創造の仕組み
価値創造の仕組み
販売する
ビ
ジネスモデル
ビジネスモデル
競争優位性
競争優位性
シンプル な ビジネスモデル
成長戦略
02 再生・商品化
成長戦略
リフォーム企画力・施工力によりきれいな物件を低コストで企画・施工
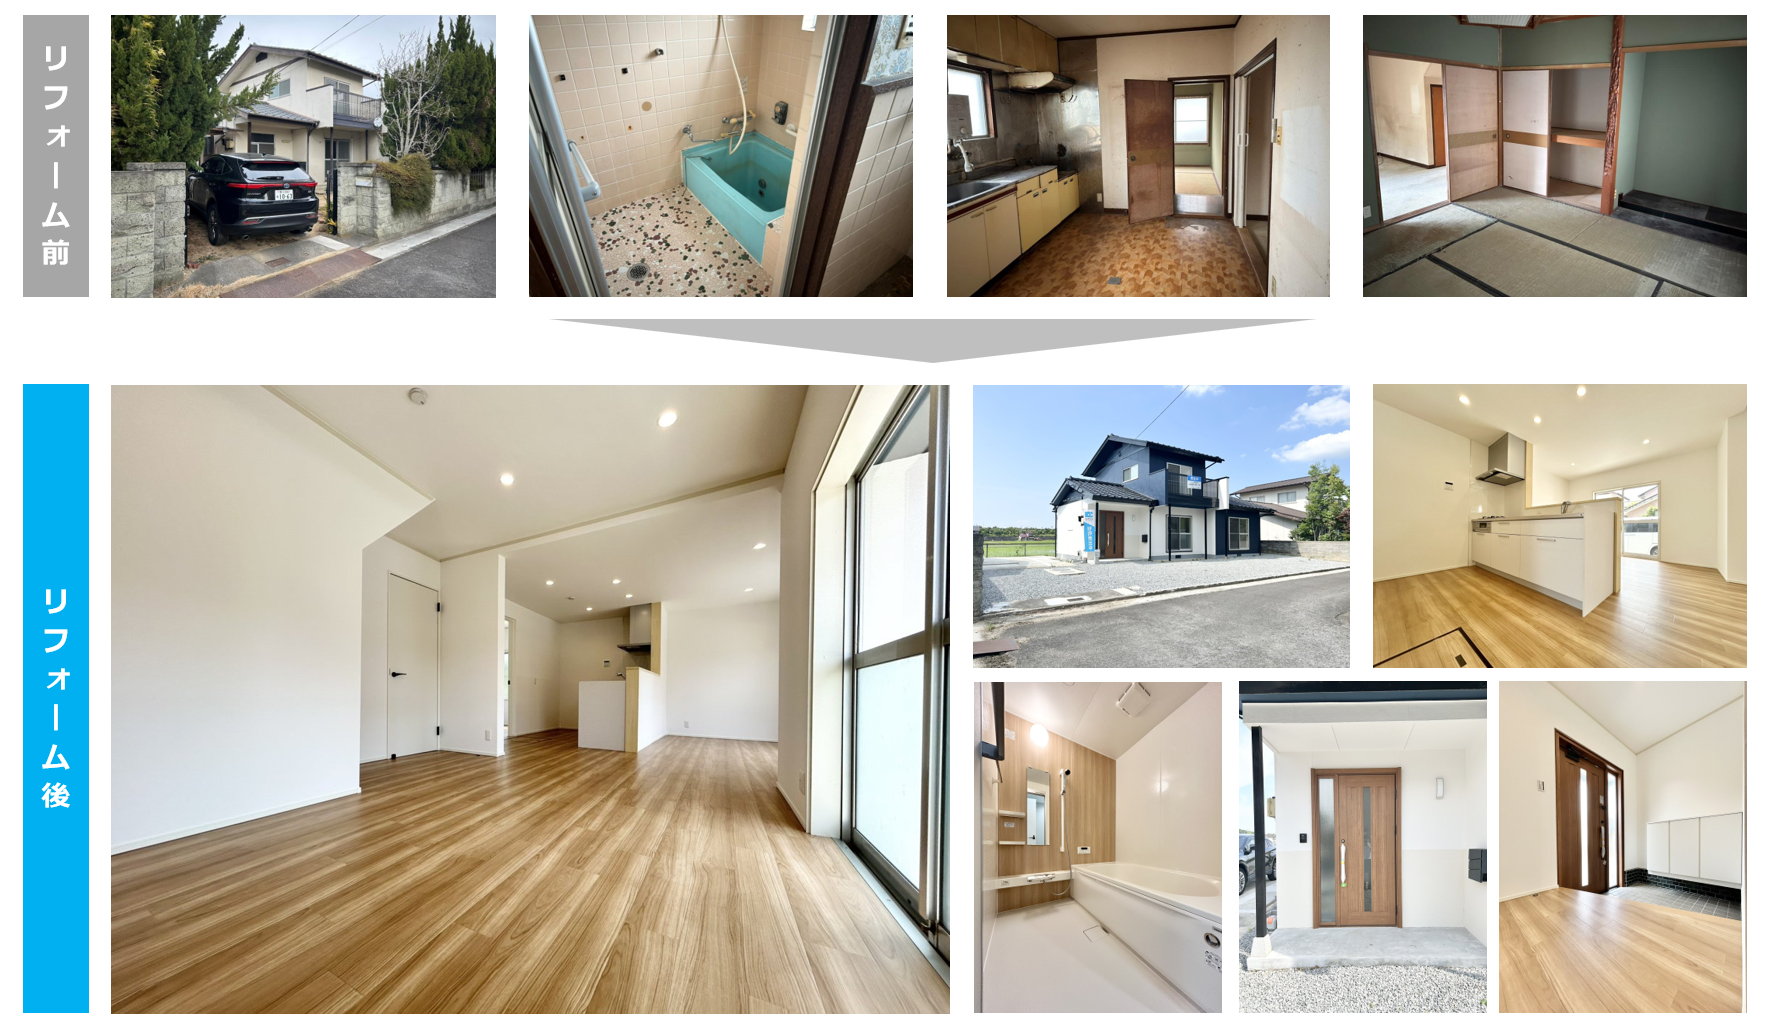
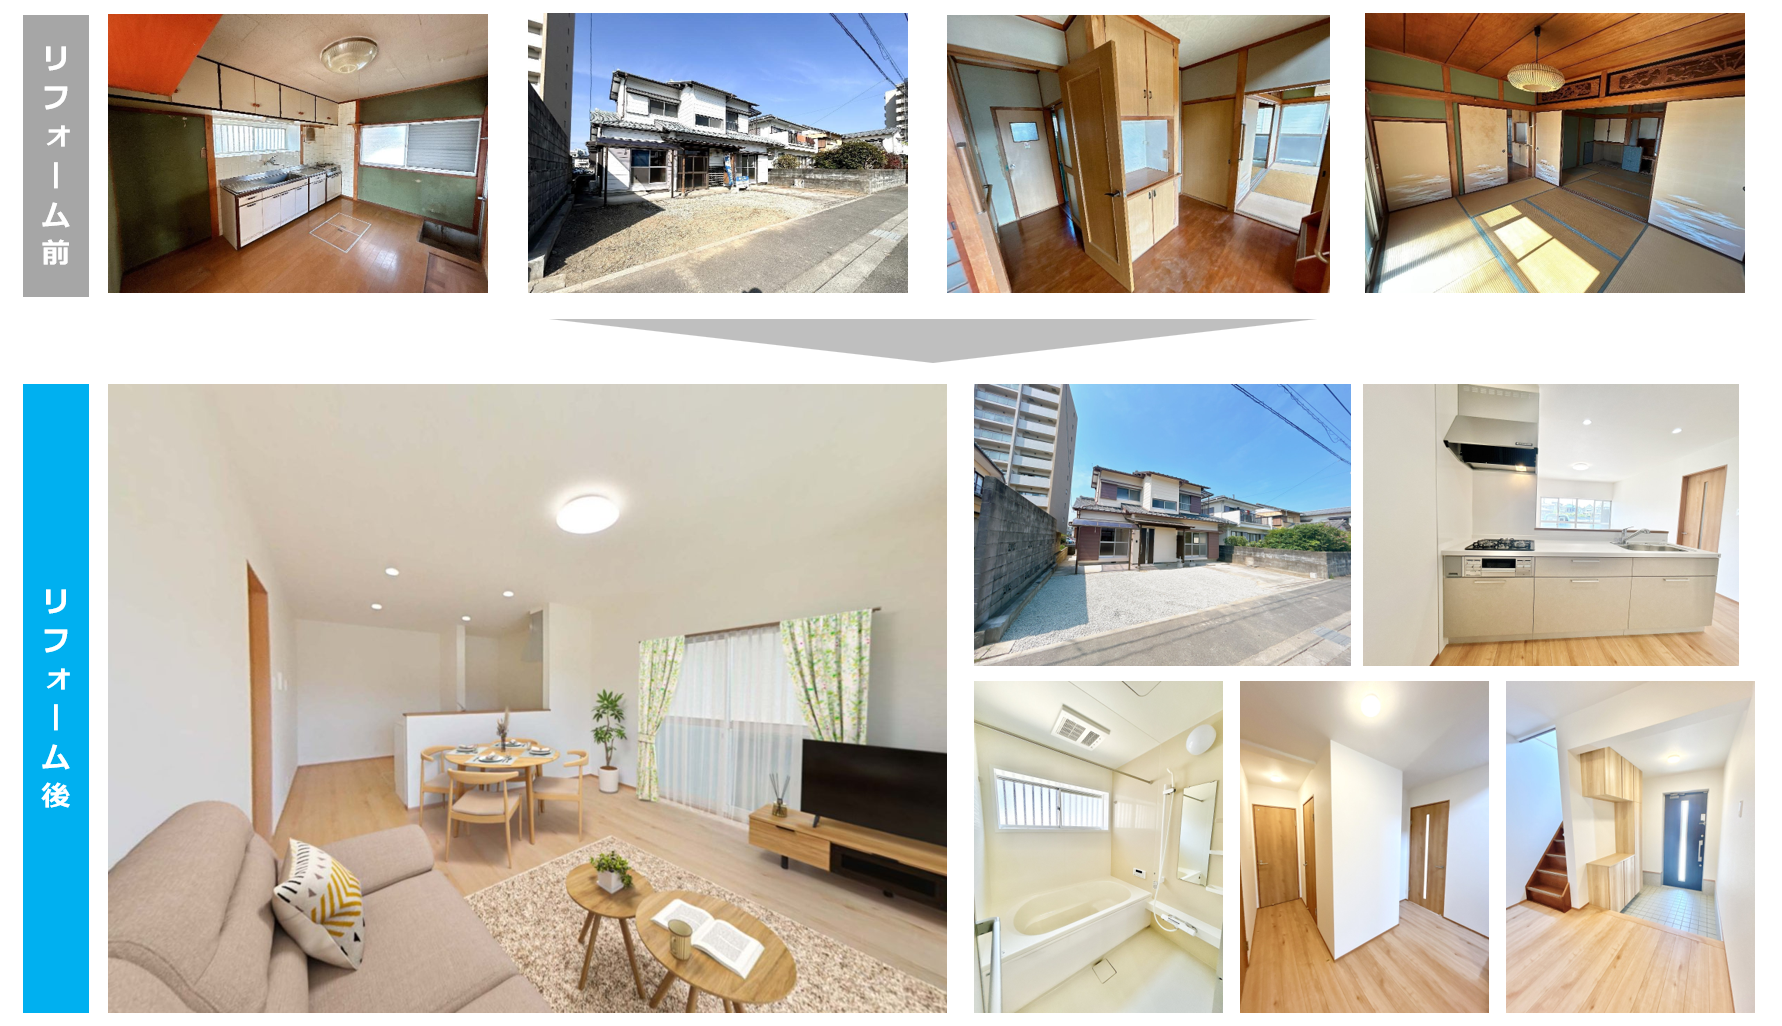
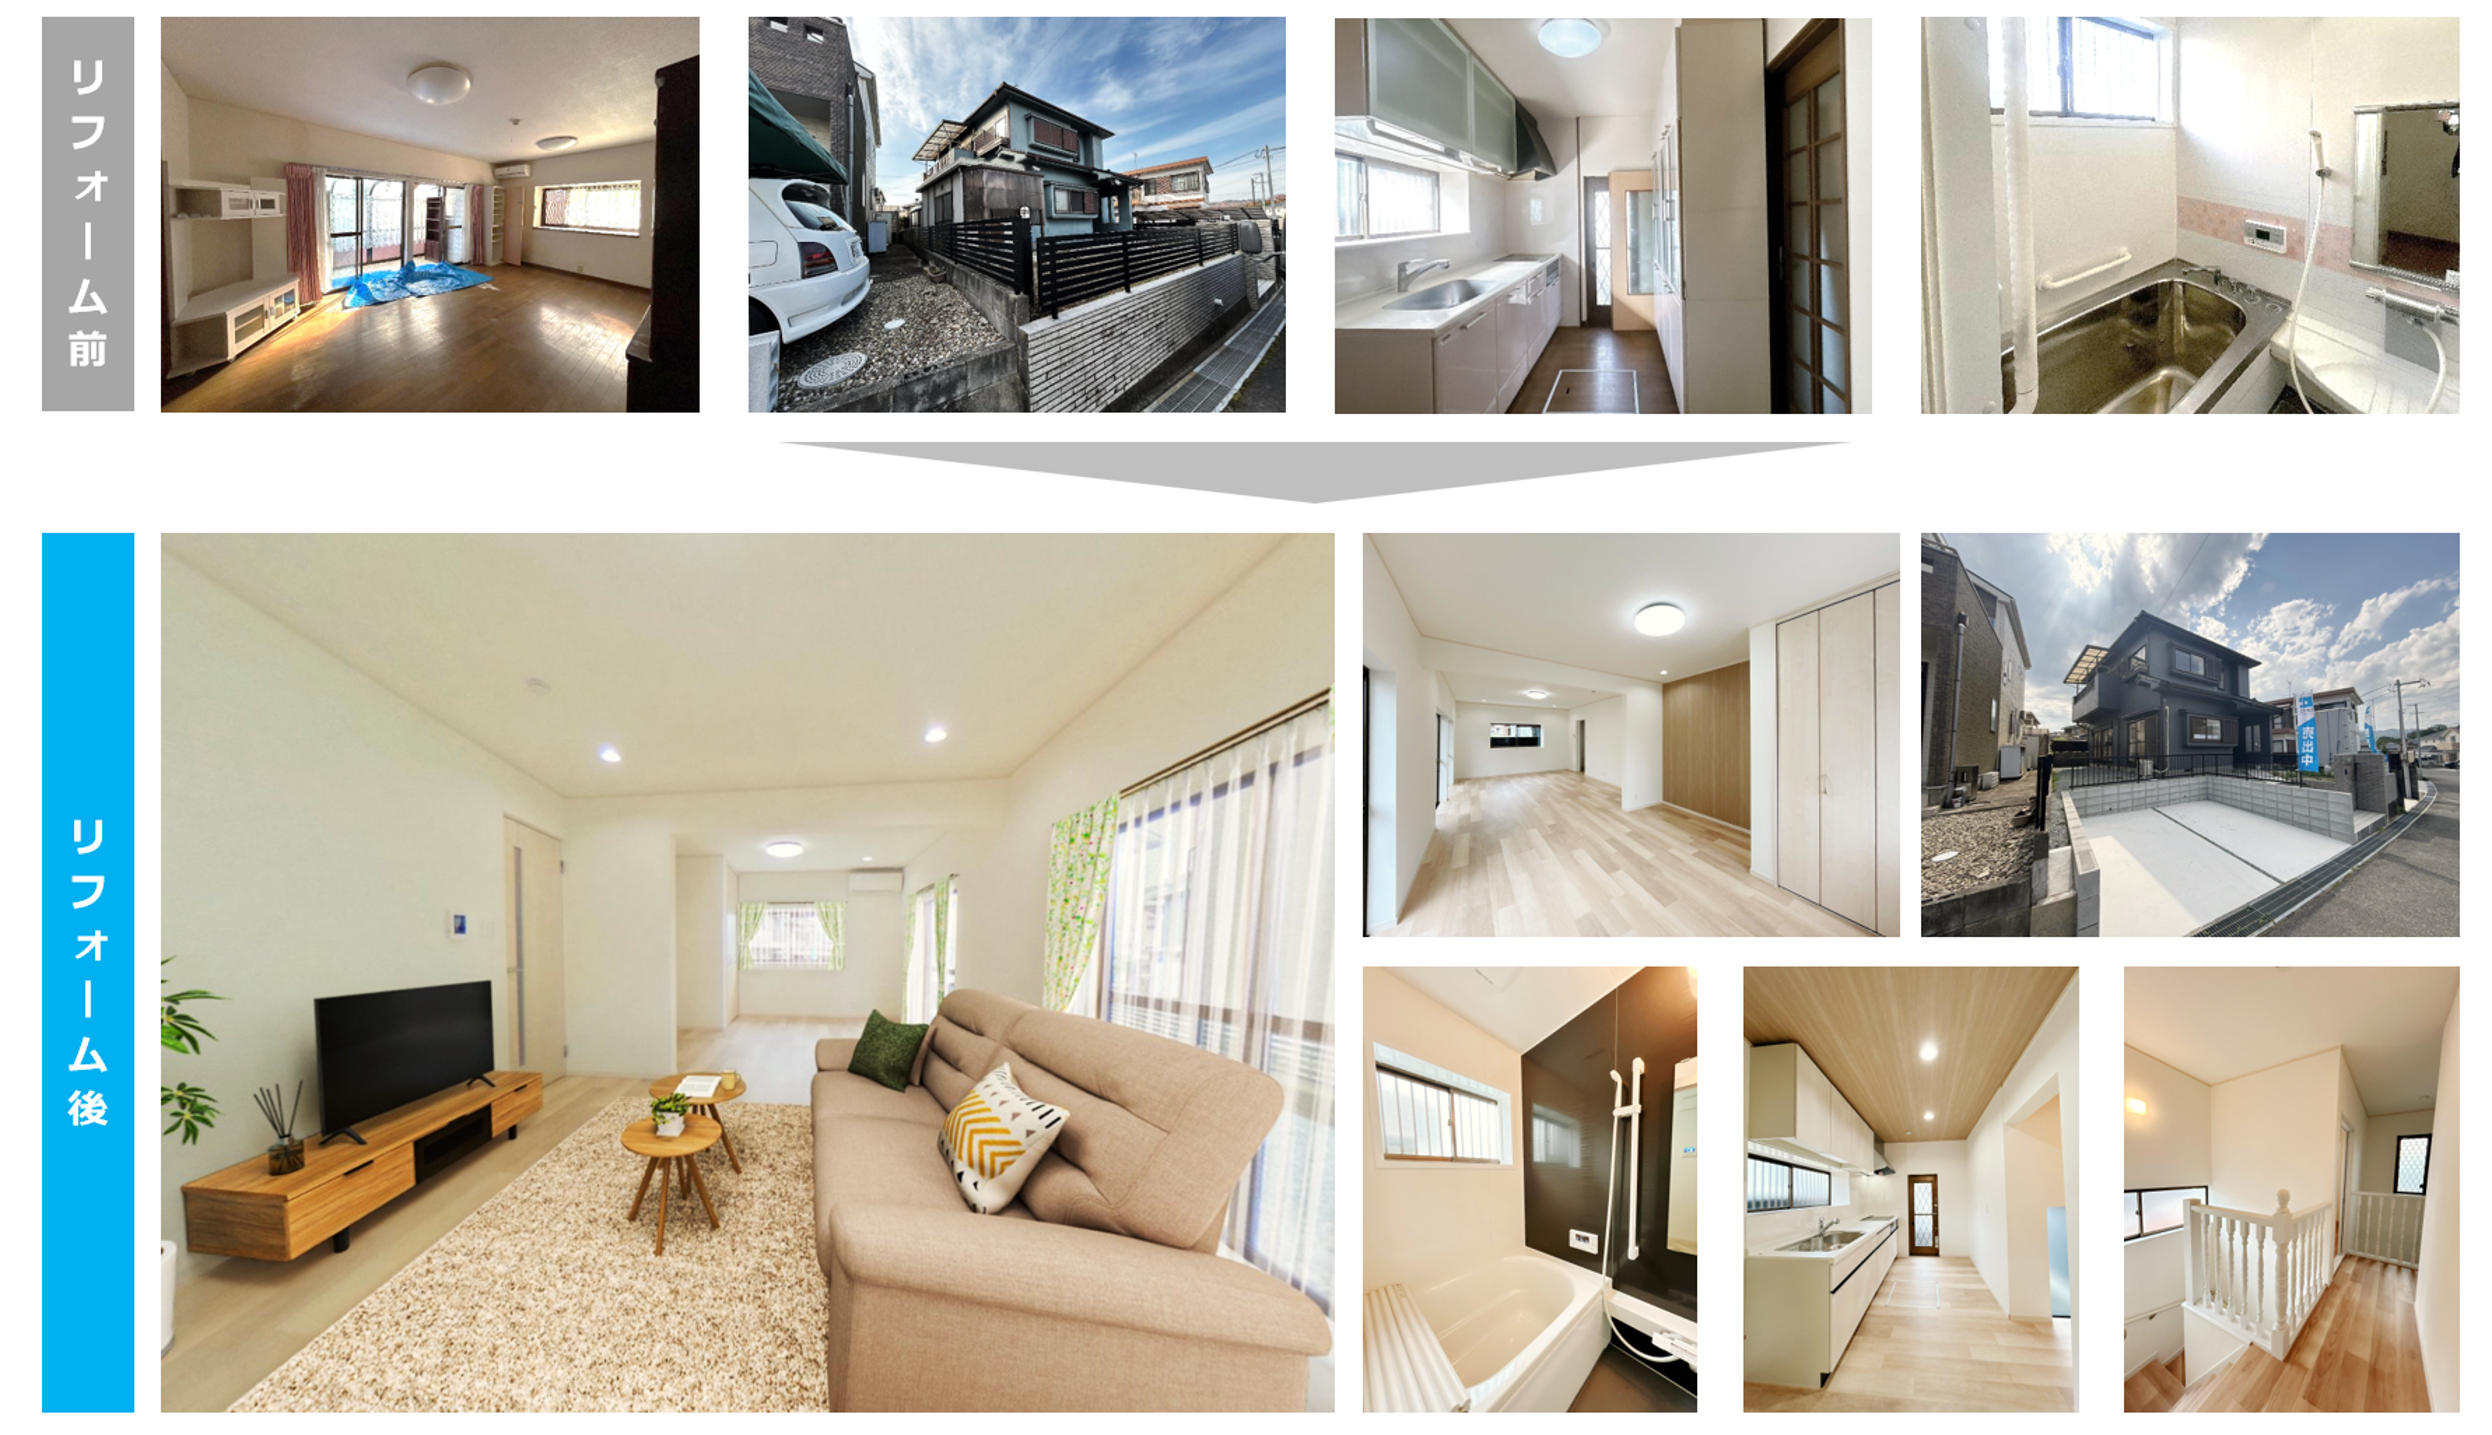
カチタス は
地方・築古・戸建の中古物件を買い取り
、
成長基盤
リフォームで住宅を再生 し、
新築の半額程度で販売しています。
買い取る中古住宅の 7割程度は空き家で、
「空き家問題の解決」と
「手ごろな価格の住宅の提供」などの
社会的価値を創出しています。
04
成長基盤
現代の生活スタイルに合わせた
事業を通じて
03
03 販売
販売価格は新築の半額程度で、 お客様の毎月の住宅ローン支払い額は 賃貸物件の家賃以下
ホーム単色塗り
つぶし
13
「失敗の歴史」が築いた模倣困難な競争優位性
中古住宅買取再販事業の確立
年の民事執行法改正に伴い参
01 1998
入。競売チャネルにより仕入実施
ビジネスモデルの転換
失敗事例の蓄積と徹底した再発防止
積み上げたナレッジが競争優位性へ
買取に仕入れチャネルを変更し仕入の量・質が安定。
難しいビジネスモデルを遂行するための組織を整備
中古住宅特有のリスクを低減するために数多くの失敗と向き合い、
再発防止のための仕組み・制度を構築
蓄積されたナレッジに基づくオペレーションが組織知となり
高い収益性・成長性を生み出す
01
社会課題の解決
短期間に全国展開し
現在の基盤となるネットワークを確立
02
金融円滑化法により競売案件が減少。
業績が悪化し、 2012 年に上場廃止。
現経営体制が発足し、仕入れチャネル転換
03
事業拡大に伴い、さまざまな課題が顕在化。失敗事
例を組織の知見へ転換する仕組みづくりを推進
04
新卒社員がマネジメント層に昇格。
経営陣と現場が一体化して動く組織に昇華
社会課題の解決
02
価値創造の仕組み
価値創造の仕組み
ビ
ジネスモデル
市場の黎明期の参入で競合も少なく、
先行者優位で事業を拡大
現経営体制への移行に伴い、
組織的な経営体制が確立
仕入から販売までを 1人の社員が一気通貫で担当できる
育成・支援体制が確立
全国の裁判所の近隣に店舗を出店。各地の
仲介会社や工務店とのネットワークをいち
早く構築
旧来の現場任せのマネジメントから新経営体制
では経営陣と現場との透明性を高め、組織的な
経営ができる基盤を構築
物件の個別性が高い中古住宅を一気通貫で担当するには、社員の育成
と習熟が必要。本部主導で育成を支援するとともに、失敗事例を共有
し再発防止を徹底することで、社員の生産性と品質の向上を実現
業界圧倒的No.1 の競争優位性の確立
ビジネスモデル
競争優位性
優秀な社員が、やりがいを持って働く。社員が経験を惜しみ
なくナレッジ共有することで、成長するほど学習が蓄積し競
争力が増す「成長学習効果」の循環を確立
競争優位性
成長戦略
仕入時の物件の調査不足
調査の見落としや判断の甘さにより、想
定外の物件の補修のためのコストが発生
三者立会の実施
防蟻会社・リフォーム協力会社・当社の
三者で現地を確認し、精度の高い調査 · 判
断を実現
成長戦略
社員の離職
育成や制度が追い付かず、旧体制の社員を中心
とした社員が離職
人員の育成、労働環境の改善
成長基盤
教育体制の整備や評価制度の見直し、働きやす
い環境づくりを推進
顧客クレームによる
社員の疲弊
全国100 を超える店舗を展開する中で、経営層
のメッセージが階層を経るごとに、本来の意図
とのずれや伝達の遅延が発生
TV朝会の実施
全国の店舗をオンラインでつなぎ、
経営層が社員に直接メッセージを
発信
クレーム対応が個人に集中し、
精神的・時間的負担が増大
お客様相談室の設置
専門部署で対応を集約し、
再発防止と社員の負担軽減を両立
04
成長基盤
横展開する仕組み
階層間での情報のゆがみと
伝達のラグ
03
毎週のTV朝会、月間表彰、四半期ごとの
キックオフ、エリア会議や社内
SNSなどを
通じて、成功事例や改善点を全社で共有。
重要な情報はタイムリーに伝達し、振り返
りには十分な時間をかけることで、個人の
学びを組織全体のナレッジへと転換する仕
組みを構築
表彰文化
四半期に1度優秀店舗が表彰され、
ナレッジを共有。優れた取り組み
と改善を表彰し、挑戦と工夫を称
え合う文化を確立
ナレッジ文化
「社内のベストプラクティスを徹底的に学
習してさらに進化させる」の共通認識のも
と、他店のナレッジを積極的に学び、すぐ
に実践し、さらにその実践知を全社へ展開
する文化を確立
03
14
提供価値
成長戦略
ご売却いただくお客様
施工会社様
従業員
仕入れから販売まで一気通貫した仕事を通じ、意欲と実績と能力に応じて成長できる環境
を提供する
従業員からの声 ①
物件の状況もお客様の想いも違うから
こそ 、自分で考え抜いて正解を導くこ
とに楽しみを感じています
。中古住宅
に価値を足し 、次の住まい手へ届ける
まで一気通貫で関り 、自分の工夫が貢
献につながるという手応えが
、 この仕
事の面白さであり 、 やりがいです 。
従業員からの声 ②
わからないことがあれば
、店舗メン
バー、店長、課長や本部スタッフも相
談に応じてくれます
。成約はみんなで
喜び合い 、 つまずいたときは一緒に考
えてくれます 。個人の頑張りをチーム
全体で後押ししてくれる空気があるか
らこそ 、安心して挑戦できます 。 この
支え合いの文化が 、 カチタスで働く一
番の魅力だと感じています
ご購入いただくお客様
仲介会社様
株主の皆様
。
ホーム単色塗り
つぶし
15
成長の基本戦略
営業人員数の増加 × 生産性向上 による 持続的な成長
供給力の拡大が業績向上に直結するため、カチタス
は、「営業人員数の増加」と「
01
社会課題の解決
社会課題の解決
1人当たりの生産性向上」を掛け合わせることで、持続的な成長を
実現していきます。
これまで培ってきたノウハウや再現性を生かしながら、人材への投資と生産性向上の取り組みを推進し、さらなる成長につなげていきます。
02
価値創造の仕組み
価値創造の仕組み
営業人員数の増加
販売件数・売上高の増加
生産性の向上
成長戦略
03
成長戦略
成長の基本戦略
成長の基本戦略
人事管掌役員インタ
ビ
ュ
ー
売上高
4月入社
3月末営業員数
22/4/1
時点
662
106
23/4/1
時点
698
102
24/4/1
時点
722
100
25/4/1
時点
販売件数
26/4/1
時点
152
129
(件)
人事管掌役員インタビュー
事業戦略管掌役員インタ
ビ
ュ
ー
(百万円)
6,422
7,000
20.6
865
786
仕入件数
105,909
販売件数
事業戦略管掌役員インタビュー
人ン
イ
的
パ
資
ク
ト
本
の
経
創
営
出
を起因と
する
人的資本経営を起因とする
120,000
インパクトの創出
マテリ
アリ
ティ
(
インプッ
ト)
×
18.2
18.5
17.9
18.8
11.2
9.6
9.5
8.8
10.0
=
マテリアリティ(インプット)
6,000
100,000
中期経営計画の取り
組み
中期経営計画の取り組み
財務戦略
財務戦略
5,000
財務ハイラ
イト
80,000
財務ハイライト
4,000
60,000
3,000
556
596
622
657
成長基盤
成長基盤
713
40,000
2,000
8.6
9.0
9.1
8.8
9.4
20,000
1,000
22/3
23/3
24/3
25/3
26/3
(単体)
04
22/3
23/3
24/3
25/3
26/3
(単体)
0
0
2022/3
2023/3
2024/3
2025/3
2026/3
ホーム単色塗り
つぶし
16
人事管掌役員インタビュー
事例だけでなく失敗事例も 、個人や店舗にとどめるこ
営業人員数
の増加
×
生産性の向上
質や判断の水準を再現できることが
学生だけでなく 、店舗で働く先輩社員の性格や成果を
当社の成長戦略は、 シンプルに言えば 「営業人員数
把握し 、配属を検討しています 。
の増加」 と 「生産性( 営業1人当たりの売買件数 ) の向
採用で重視している資質は 、「良い子・強い子・賢
上」 の掛け算です 。私たちは地域に密着した少人数の
い子」 です 。「良い子」 とは 、素直さや誠実さ 。私た
店舗を全国に展開するモデルであり
ちの仕事は 、 お客様に長く住み続けていただく住宅を
というマーケットには
、中古住宅の再生
、 まだ大きな成長余地がありま
提供する仕事ですから 、誠実に向き合えることが何よ
す。仕入れからリフォーム企画、販売までを 1人の営業
り大切です 。「強い子」 とは 、目標から逆算して最後
社員が一気通貫で担う事業だからこそ
までやり抜く力。「賢い子」 とは 、学び続け 、自ら成
、人が増えれ
ば、 それだけ取り扱える住宅が増え 、 お客様に提供で
長できる力です 。店長になると仕事の質も大きく変わ
きる住宅も増えていきます
るため 、学び続ける姿勢は欠かせません 。
。 だからこそ 、採用と定着
によって営業人員数を増やし続けられるかどうかが
、
成長戦略の生命線になります 。
そして近年、 この資質に加えたのが 「 ビジネス視
ほど 、 ともすると 「 お客様のためになること 」 と 「利
文化です 。人は、 ただ増やせばよいというものではあ
益を生み出すこと 」 を別のものとして捉えてしまうこ
りません 。少人数の店舗では 、一人ひとりの成長意欲
とがあります 。 しかし私たちは 、 この二つは両立する
や周囲との関係性が社員の定着に直結するため 、長く
ものだと考えています 。私たちは 、 お客様に本当に求
働き続けられる文化が欠かせません 。私は「組織文化
められる商品を企画し 、適正な価格で提供することで
の8割は採用と配属で決まる 」 と考えています 。
価値を生み出し 、利益を創出しています 。利益は、 お
また 、営業人員数の増加と生産性の向上は別々の
客様に提供した価値の対価であり 、社員の報酬や次の
テーマではなく 、採用、育成、定着、組織文化という
成長への原資でもあります 。 この考え方に共感できる
組織づくりの積み重ねによるものだと考えています
素直な 「良い子」 を採用しているので 、今では自ら付
良い組織づくりにおいて、
。
『誰を採り、どこに配属
するか 』 はどのような意味を持つのでしょうか。採
用と配属で大切にしていることを教えてください。
当社のビジネスモデルは 「少人数」 であることに大
加価値を生み 、自信を持って利益を創出している社員
うに成果を出したのかを言語化し
02
価値創造の仕組み
、 それを全社で真似
価値創造の仕組み
ること 」 です 。表彰者の発表では 、過去のどの店舗の
ナレッジを参考にしたのか
、 さらに自店なりにどのよ
うな工夫やアレンジを加えたのかまで共有します
。一
つひとつの成功を組織全体の成功へと変えるサイクル
が当社のナレッジを蓄積し続ける源になっています
成長戦略
ゾート物件という新たな市場に挑戦し
差別化につながっていると考えています
人加わるだけで店舗に与える影響は 20 〜25 %にもなり
成長の基本戦略
成長の基本戦略
、 その成功体験
が全社へと共有された事例です 。 このように当社のナ
人事管掌役員インタビュー
事業戦略管掌役員インタ
ビ
ュ
ー
レッジは 、経営陣がトップダウンで示すものではな
く 、現場で生まれた挑戦から蓄積されたものです
事業戦略管掌役員インタビュー
。
人ン
イ
的
パ
資
ク
ト
本
の
経
創
営
出
を起因と
する
人的資本経営を起因とする
また 、毎年100 名を超える新卒社員が入社する当社に
とって早期の戦力化は欠かせません 。 そのため 、新入
社員一人ひとりに教育担当者がつき 、日々の業務を通
じて実践的な知識や経験を伝えています
、
教育担当者からは 「教えることで自分自身も成長して
いる 」 という声も数多く聞かれます
インパクトの創出
マテリ
アリ
ティ
(
インプッ
ト)
マテリアリティ(インプット)
中期経営計画の取り
組み
。月に一度以
上の1on 1やレポートを通じて成長を振り返るなかで
中期経営計画の取り組み
財務戦略
財務戦略
財務ハイラ
イト
財務ハイライト
。教える側に回る
ことで理解が深まり 、教育担当者から報告されるレ
ポートの質も向上しているのを実感しています
。
直後に経営幹部の一人として参画。採用方針の転換や評
ます 。 その人の個性や人柄が店舗の雰囲気や成果に与
価・報酬制度の変更等による人的資本の拡充を主導し、 そ
える影響は非常に大きいため 、一人ひとりを丁寧に見
の後の10年間の大きな成長を実現。
極めることが何より重要になります
カチタスの強みであるナレッジは、どのように
組織へ蓄積され、再現されているのでしょうか。
当社が事業を拡大しながら品質を維持できているの
織全体のナレッジとして蓄積してきたからです
、組
。成功
04
成長基盤
。
は、一人ひとりの経験を個人の経験で終わらせず
03
成長戦略
。
最近の表彰で印象的だったのは 、長野の店舗がリ
会社は多くありません 。 こうした成長環境そのもの
ジパートナーズが公開買付( TOB) を行い、非上場化した
「 この人なら 、 こ
る場ではありません 。大切にしているのは 、「 どのよ
任を持ちながら 、 20 代でマネジメントまで経験できる
が、当社ならではの魅力であり 、採用における大きな
通じて感じた人物像を丁寧に記録し
代表的な取り組みが 、四半期に1度開催している優秀
店舗の表彰式です 。当社の表彰式は、単に成果を称え
お客様のニーズを把握し 、商品を企画し 、利益に責
も 、店舗では 4〜5人のうちの一人です 。新卒社員が一
。面接を
社会課題の解決
成長基盤
カチタスの前身である㈱やすらぎに対して㈱アドバンテッ
。 だからこそ 、採
01
社会課題の解決
みになっています 。
が集まっています 。
きな特徴があります 。全社では 700 人のうちの一人で
用と同じくらい大切にしているのが配属です
、当社の大きな強
人事管掌役員インタ
ビ
ュ
ー
点」 です 。誠実で相手を思いやれる 「良い子」 である
そのうえで 、私が最も大切だと考えているのが組織
、磨き上げ 、次の挑戦へと生かし
ています 。 この積み重ねによって 、人が変わっても品
高めています 。 そのためにも人事チームは 、採用する
でしょうか。
取締役管理本部長
となく全社で共有し
販売件数・
売上高の増加
の店舗で力を発揮できる 」 というところまで解像度を
なぜ、人材と組織づくりが成長戦略の要になるの
横田和仁
=
優秀店舗の表彰式の様子
ホーム単色塗り
つぶし
17
人が育ち、組織が育ち、成長が続く
じた店舗への補充が中心でしたが 、今後は採用全体に
占める割合をこれまでより高めていきたいと考えてい
失敗を責めないことが、なぜ品質を守るのでしょう
長し 、利益を上げることが 、 そのまま社員の報酬向上
ます 。 これまで新卒採用を中心としてきたのは
か。人事評価の考え方を教えてください。
につながる 。 この関係が成り立っていることが最も重
文化を育てることを何よりも重視してきたからです
要な前提だと考えています 。当社では 、成長の果実を
その結果、今は新卒社員が組織の中核を担い 、文化が
社員へ還元する仕組みを評価・報酬制度の中に組み込
十分に成熟してきました
んでいるため 、会社の成長と社員一人ひとりの成長・
したとしても新卒が育んだ文化の中に中途社員が溶け
報酬が連動することが 、働き続けるモチベーションに
込むような状況になったことから
、中途採用を強化で
つながっています 。
きる環境が整ったと考えています
。
ナレッジを組織知にするためには
社会課題の解決
、成功事例だけで
なく失敗事例からも学び続けることが欠かせません
。
そのため当社では 、失敗やクレームを隠さず共有する
ことを大切にしています
。 その根幹にあるのが 、「悪
意のないミスは評価に影響させない
」 という人事評価
二つ目は、「誰と働くか 」 です 。先述のとおり当社
。
価値創造の仕組み
は少人数の店舗運営のため 、一緒に働く店長やメン
は、店長を中心としたマネジメント人材の育成です
バーとの関係性が定着に大きく影響します
営業人員数を増やし続けるためには 、店舗を任せられ
ようになり 、組織として学ぶ機会を失ってしまいま
め、半年に一度エンゲージメントサーベイを実施し
す。 だからこそ 、誠実に仕事へ向き合った結果として
店長は自店舗のスコアやメンバーからの評価を客観的
10 年後に後輩たちのロールモデルとなる存在へ成長し
生じた悪意のないミスは 、評価において不利にならな
なデータとして受け取ります
てほしいと思います 。
いことを明確にしています
たサーベイ結果をもとに
。
一方で 、「 なぜ起きたのか 」「 どうすれば防げたの
、
。 データで見える化され
、店長は「半年で何を改善す
。
る店長の存在が欠かせません 。新卒社員には、 5年後、
るか 」 を考え 、実践を積み重ねることで 、店舗の働き
ス 」 という言葉のとおり
やすい環境づくりにつながっています
と暮らしに価値を足し続けられる会社です
次で発生したクレームを一件一件確認し
、必要に応じ
は、 この結果を評価に反映させることはしていませ
のためには 、人が増えるほどに組織が強くなる会社で
ん。評価と結び付けてしまうと
なければなりません 。社員一人ひとりが成長し 、 その
を追及することではありません
。一つひとつの事例を
再発防止のナレッジへと変え 、組織全体で共有するた
めです 。 ミスを隠さないから原因が分かる
。原因が分
くくなるからです
、率直な声が集まりに
。
三つ目は、「本部サポート 」 です 。人事チームが採
、店長からの週
かるから改善できる 。 そして 、 その改善が全社へ共有
次報告に人事報告を加えたりすることで
、社員の変化
されることで 、品質がさらに高まっていく
を早期に把握し 、必要なサポートにつなげています
。 この積み
重ねが、当社の品質を支えているのだと思います
また 、 この考え方は品質の向上だけでなく
、人材の
て柔軟に異動を行うなど 、安心して働き続けられる環
境づくりを進めています
。
。
はなく 、互いに良い循環を生み出していると考えてい
マテリアリティ(インプット)
を育てていく 。「人が育ち 、組織が育ち 、 さらに人が
育つ」循環をつくることが
中期経営計画の取り
組み
中期経営計画の取り組み
、 カチタスの持続的な成長
を支える人的資本経営そのものだと考えています
。
財務戦略
財務ハイラ
イト
財務ハイライト
Topics |人的資本に関する外部からの評価
OpenWork 公表の「働きがいのある企業ランキング
における部門別「 20 代成長環境」にて、
今後の人材戦略として 、 まず力を入れていくのが二
一つは、 DXやマーケティングをはじめとする本部の
専門性をさらに高めていくことは欠かせません
その定着を支える仕組みは何でしょうか。
。 その
一環として 、直近2年ほどで本部の専門人材として執行
第4位に選出
高い従業員エンゲージメントに関する表彰
、意図的に整えてきた
役員クラスを 5名以上採用しています 。
。
もう一つは営業職の中途採用です 。従来、当社は新
一つ目は 、業績と連動した報酬制度です 。会社が成
卒採用を中心に採用しており 、中途採用は、欠員が生
株式会社リンクアンドモチベーションが開催した従業員エンゲージメントの高い企業を
表彰する「 BMC(Best Motivation Company Award)2026
( 1,000 名未満) で「 Motivation Company
」における、
中堅企業部門
」を 2年連続で受賞
当表彰は2025 年にエンゲージメント調査を実施した企業の中で、エンゲージメント状態
の高い TOP10 社が表彰される
04
成長基盤
2026 」
19,681 社中、
専門人材の採用です 。会社の成長に伴い 、本部機能の
人が辞めず、活き活きと働き続ける。
人が長く活躍し続けるために
インパクトの創出
マテリ
アリ
ティ
(
インプッ
ト)
つの領域での中途採用です 。
ます 。
仕組みがあり 、特に三つのことを大切にしています
人的資本経営を起因とする
成長基盤
これからの人材戦略と、 5年後・ 10 年後に目指す
組織像を教えてください。
ながります 。品質の向上と人材の定着は別々のもので
事業戦略管掌役員インタビュー
人ン
イ
的
パ
資
ク
ト
本
の
経
創
営
出
を起因と
する
若手従業員の成長環境に関する外部評価
物件を一気通貫で担当するため 、品質が向上しクレー
その結果、 より長く安心して働き続けられる環境につ
人事管掌役員インタビュー
事業戦略管掌役員インタ
ビ
ュ
ー
。 その実現
。
ライフイベントが発生した場合などはその状況に応じ
ムが減ることで心理的な負担も着実に軽減されます
、 もっと地域に密着し 、 もっ
財務戦略
。
定着にもつながっています 。当社は一人の営業社員が
成長の基本戦略
人事管掌役員インタ
ビ
ュ
ー
経験やナレッジが次の世代へと受け継がれ 、次の人材
用担当として定期的に連絡を取ったり
03
成長戦略
5年後、 10 年後に目指したいのは 、「 くらしに価値タ
。経営陣は週
、 その目的は責任
成長戦略
成長の基本戦略
か」 という原因の追究は徹底しています
。 なお 、当社で
02
価値創造の仕組み
そして 、 これからも変わらない最も重要なテーマ
てきました 。 ミスを過度に責めれば 、人はミスを隠す
。 そのた
社会課題の解決
。 そのため 、中途採用を増や
の考え方で 、 この考え方を経営陣は一貫して大切にし
て現場へのヒアリングも行いますが
01
、組織
ホーム単色塗り
つぶし
18
事業戦略管掌役員インタビュー
照しながら商品構成や価格帯を検討できる環境が整っ
営業人員数
の増加
×
生産性の向上
と考えています 。営業社員が一気通貫で物件を担当す
うな取り組みを行っていますか。
る体制をあえて崩さないのも
どこまで高められるかという点にあります
。当社の営
業は、物件の仕入れ、 リフォーム企画、販売までを一
。
2025 年3月期に終了した第 3次中期経営計画期間で
は「営業人員数×営業1人当たりの売買件数」 という
Web サイトの改修、自動予約システム 、 Salesforce を
式で成り立っており
活用したマーケティングオートメーション
、人員数の増加と合わせて1人当
、
、 リフォー
たりの売買件数を高めることが中期経営計画の柱の一
ム企画を標準化したカチタススタンダードプランなど
つです 。
を実現してきました
。 アナログ中心の業務フローから
スピーディに IT基盤を整備する必要があったため 、既製
能力を最大限に発揮できる業務プロセスやシステムと
品を活用しながら仕組みを築いてきましたが
いった社内インフラによって決まります
必要に応じて当社の業務に合ったシステムを内製化し
。 ポテンシャ
、 その
が、生産性向上の大きなテーマの一つになります
ていく必要があると考えています
、今後は
。
中古住宅の買取再販事業は、他業界の効率化事例を
社員が持つ力を存分に発揮できる環境を整えること
そのまま当てはめることが難しい事業だと感じていま
。
す。 だからこそ 、「何を効率化し 、何を効率化しない
DXの推進において現在の業務フローを起点として業
務のシステム化そのものが目的になってしまうケース
のか」 を現場とともに試行錯誤しながら
や、 BPR( 業務プロセスの根本的見直し ) において 、業
て最適な DXやBPRを進める必要があり 、 その試行錯誤
務の削減ばかりが注目されるケースを見かけることが
の積み重ねこそが 、他社が容易に追随できない当社の
ありますが 、 こうした取り組みでも生産性が向上する
強みになっていると考えています
、当社にとっ
。
また 、生産性を高めるためには 、業務フローやシス
ことはあります 。 しかし 、当社の場合、仕入の目利
き 、 リフォーム企画、販売時の価格設定といった 「判
テムだけでなく 、 どのような商品を仕入れるかという
断」 が収益を大きく左右します
視点も重要です 。高回転を狙える商品構成を意識する
。間違った DXやBPRで
は、手間をかけたからこそ担保された品質
、創出され
など 、仕入れの段階から生産性を設計していくという
ていた利益まで損ない 「作業は少なくなったが利益も
考え方は 、今後の成長戦略においても重要なテーマに
減少した 」 という結果になりかねません
なると考えています 。
。私たちは単
なる作業の効率化ではなく 、工数当たりの品質と利益
の向上に重点を置きながら 、最適なBPRと DXを推進し
ていきます 。 より良い判断ができる業務フローやシス
。例
テムによって判断の精度を高め 、結果として生産性を
構成を 、 どの店舗でも毎週見直せるようになれば
CMO( Chief Marketing Officer) として生産性 ( 社員1人当
向上しながら利益を高めていきたいと考えています
たりの売買件数) 向上をミッションに 、顧客からの反響数
つまり 、入力作業や重複したプロセスなど
。
、市
すことができます 。 その結果、在庫回転の向上や生産
性の向上にもつながると考えています
決定を支える基盤として
、付加価
直しとシステムの内製化をさらに加速させます
。内製
化においては 、 プロセスの再設計や要件の洗い出しに
おいても開発そのものにおいても
AIの活用が鍵を握ると
化していきます 。
の隅々まで浸透してきたと感じています
の査定、 リフォーム企画、 お客様への説明といった価
が十分に現場まで行き渡らない面もありましたが
。以前は数字
値の源泉となる業務には 、 むしろ時間をかけるべきだ
Salesforce などの導入によって 、誰もが同じデータを参
、
03
成長戦略
成長の基本戦略
さらに 、当社が長年蓄積してきたナレッジは
成長の基本戦略
、 DX・
人事管掌役員インタ
ビ
ュ
ー
AIの時代だからこそ 、 これまで以上に価値を発揮すると
考えています 。累計10 万件( 連結) を超える仕入物件
情報、 リフォーム企画、販売価格といったデータは 、
人事管掌役員インタビュー
事業戦略管掌役員インタ
ビ
ュ
ー
事業戦略管掌役員インタビュー
人ン
イ
的
パ
資
ク
ト
本
の
経
創
営
出
を起因と
する
人的資本経営を起因とする
外部には一切公開されていない当社固有の資産です 。
これらを AIに学習させることで
、「 カチタスならではの
判断」 を支える仕組みを構築していきたいと考えてい
インパクトの創出
マテリ
アリ
ティ
(
インプッ
ト)
マテリアリティ(インプット)
中期経営計画の取り
組み
ます 。膨大な取扱いデータを持つ当社だからこそ実現
できる競争力であり 、 これまでの蓄積が 、 そのまま次
の価値創造の源泉になっていくと考えています
。
中期経営計画の取り組み
財務戦略
財務戦略
財務ハイラ
イト
財務ハイライト
また 、当社は営業現場に大きな裁量を持たせている
ため 、社内申請書類の入力業務など 、事務作業が数多
くあります 。 そのため 、自社業務に合わせて開発した
小型のアプリを組み合わせることで
、生産性を底上げ
していく構想に取り組んでいます
。例えば 、社内申請
書類を先輩社員や店長が確認する前に AIが一次チェック
などを検討しています 。将来的には、仕入れの妥当性
値を生まない業務は積極的に効率化する一方で 、物件
成長戦略
考えており 、 IT・ AIに精通した人材の採用を引き続き強
部門ではシステム開発におけるコード作成などの
を活用した商品構成や価格帯を検討する文化が 、現場
価値創造の仕組み
、業務プロセスの継続的な見
を行うことや 、 AI-OCRによる確認業務の効率化、管理
。 その結果、 データ
02
価値創造の仕組み
。 こうした意思
DX推進やAI活用に取り組みますか。
IT基盤づくりに取り組んできました
社会課題の解決
場環境の変化に応じて取り扱う価格帯を機動的に見直
現在進行中の第4次中期経営計画では、どのような
第3次中期経営計画では 、 DXと BPRを推進するための
01
社会課題の解決
えば 、 これまで店舗ごとに月に一度見直していた商品
AI活用
評価や価格設定、 リフォーム企画など 、当社の競争力
マーケティング戦略立案と実行に従事。 カチタスでは
アップや業務の効率化を担当
、判断の質や、 お客様へお届け
する住宅の品質を損なうことを避けるためです
は、営業部長も参加する BPRプロジェクトを推進し
ルの高い社員を採用し 、 しっかりと育てた上で
リクルートで人材・住宅領域のクリエイティブ作成及び
ケーションロスが生じ
、分業によるコミュニ
人が一気通貫で担っています 。 そのため 、当社の売上
生産性は、営業社員一人ひとりの能力に加え 、 その
執行役員事業戦略本部長
第4次中期経営計画では 、 この基盤をさらに発展さ
せ、意思決定のスピードと精度を高めていきます
カチタスにおける「生産性向上」について、どのよ
生産性向上の基本は、営業1人当たりの売買件数を
森川晶
てきました 。
販売件数・
売上高の増加
=
の源泉である判断業務についても AIを活用した支援を進
めていきたいと考えています
。
AIが進化すると 、人の仕事がなくなると言われること
がありますが 、当社ではそのようには考えていませ
ん。先述のような事務作業を AIが担うことで 、営業社員
はより価値の高い判断業務に時間を使えるようになり
成長基盤
04
成長基盤
ホーム単色塗り
つぶし
19
現場の判断を磨き、稼ぐ力を最大化する
5年後、 10 年後には、私たちは地域の流通を支える
「総合プロデューサー 」 のような存在になっていたい
ます 。一方で 、 AIには事実と異なる内容を生成してしま
)」
任せきりにするのではなく
のような課題もあります
。 AIに
、社員が最終的に判断する
ことを前提に 、 AIと人、 それぞれの強みを生かしながら
活用していくことが重要だと考えています
。
今後の取り組みとこれからの成長について、教えて
り扱えていなかった高価格帯の住宅まで
ください。
ズに応えられる存在になりたいと考えています
まず注力していきたいのが 、中古住宅への信頼の向
上です 。新築住宅が減っていくなかで
、中古住宅への
注目は、今後さらに大きくなると考えています
カチタスらしい生産性向上とは、どのようなもの
。品質
を担保できない事業者は市場から退場していくことが
だと考えますか。
想定されますが 、当社は品質をさらに高め 、 その品質
同じシステムやツールを導入しても
果が得られるとは限りません
と考えています 。 その地域の住宅の売買を幅広く担
。
01
い、手ごろな価格帯住宅からこれまで当社が十分に取
う 「 ハルシネーション ( もっともらしい誤った情報を
生成してしまうこと
が、当社らしい生産性向上だと捉えています
、他社と同じ効
。 データそのものも当社
を社外からも信頼される 「 ブランド 」 へと育てていき
社会課題の解決
社会課題の解決
、多様なニー
。私た
ちが 「総合プロデューサー 」 になるためには 、一人ひ
とりに求められる水準はさらに高くなりますが
02
、同時
価値創造の仕組み
に非常にやりがいのある挑戦でもあります
。営業人員
価値創造の仕組み
数の増加と合わせて生産性向上により一人ひとりの社
員が今まで以上にできる業務を増やしながら
、地域に
とってなくてはならない存在を目指してまいります
。
たいと考えています 。当社ならではの中古住宅の品
の重要な資産ですが 、 その真の価値は 、 データをどう
質・信頼性をブランドとして確立していくことが重要
解釈し 、次の打ち手につなげるかによって決まるから
なテーマです 。
成長戦略
03
成長戦略
成長の基本戦略
です 。当社には、現場で物件の価値を見極め 、価値を
あわせて 、第4次中期経営計画でも掲げる仕入れチャ
高めてきた判断の積み重ねがあります 。 その判断のプ
ネルの多様化や新規顧客層の獲得を進めていきます 。
ロセスが組織にしっかりと根付いており
仕入れについては 、地方自治体・異業種連携等の想定
成長の基本戦略
人事管掌役員インタ
ビ
ュ
ー
人事管掌役員インタビュー
事業戦略管掌役員インタ
ビ
ュ
ー
、 データに
よってそのクオリティをさらに高められることが
、当
されるあらゆるルートから物件を確保することで
事業戦略管掌役員インタビュー
、仕
人ン
イ
的
パ
資
ク
ト
本
の
経
創
営
出
を起因と
する
人的資本経営を起因とする
入れを最大化していきます 。
社の本質的な強みだと考えています 。
もう一つの強みは 、 チームの一体感です 。経営陣か
インパクトの創出
一方、販売については 、戦略在庫や低価格商品をは
マテリ
アリ
ティ
(
インプッ
ト)
マテリアリティ(インプット)
ら営業部長、課長、店長までが密接に連携しながら意
じめとした商品ラインナップを拡充することで
思決定を行っています 。 いわば有機的なネットワーク
で接点の少なかった新しいお客様にも選んでいただけ
のように 、 それぞれが状況に応じて連携しながら判断
る商品を増やしていきます
を重ねています 。市場は常に変化しますが 、 その変化
の核となるお客様は変わりませんが
に合わせて素早く方針や行動を変えられることが
るお客様や 、 ひとり親世帯、高齢者、別荘やリゾート
カチタスは、豪州在住者向けに日本の地方での住宅購入を支援する
「 JapanoMa (ジャパの間)」を運営する
、生
。 こうした強みが最も
物件として活用される外国人など
発揮されたのがコロナ禍でした
。厳しい局面でも 、経
ていきたいと考えています
、
環境変化へ迅速に対応し 、乗り切ることができまし
た。目先の生産性だけを見て組織を分断していたら
こうした対応はできなかったと思います
カチタスらしい生産性向上とは
、
中期経営計画の取り組み
、 お客様の幅を広げ
。商品の多様化は、 お客様
財務ハイライト
GO & C Partners と連携し、
空き家の活用と関係人口の創出に取り組んでいます。空き家発生の背
景の一つには「地域と関わる人」の減少があります。カチタスはリ
れ、多様化するライフスタイルのお客様へ
、一件でも
フォーム・検査済みの中古住宅を提供し、
多くお届けできるよう取り組んでいきます
。
方々の目的に合った物件選定を支援。単なる不動産購入ではなく、海
成長基盤
GO & C Partners が海外の
外の方々と日本の地域をつなぎ、地域と継続的な関係を築く担い手を
増やすことを目指します。
ると考えています 。当社はエリアに根ざしたリアルビ
ジネスであるため 、移動時間などの時間的なロスが生
「営業現場の徹底した実行力」 と 、「仕入れからリ
産性を阻害する要因になります 。 ソフトウェアだけで
フォーム ・販売までを一人が一気通貫で担う体制」 を
なく 、 デバイスの進化も含めた技術革新によって
、こ
さらに伸ばしていくことだと考えています
。 DXが進ん
うした課題を解消できる余地はまだ数多くあります
。
、 むしろ 、定型業務
1人当たりの売買件数は今も伸び続けているものの
、個
を効率化することで 、一人ひとりがより高い付加価値
人の能力開発と AIの活用によって 、 さらに高めていける
を発揮し 、多くの仲間が活躍できるようになる
と考えています 。
。 これ
財務戦略
財務ハイラ
イト
の多様化でもあります 。流通していない住宅を仕入
を活用しながら 、 これまで大切にしてきた強みである
でも人がいらなくなるのではなく
財務戦略
、新築を検討され
また 、生産性向上の余地は、 まだ大きく残されてい
。
、 DXなどの最新技術
中期経営計画の取り
組み
Topics |空き家問題を「地域と継続的に関わる人(関係人口)」の創出で解決に挑む
。 ファミリー層という当社
産性の高さにつながっています
営と現場が一体となって変革を続けられたからこそ
、今ま
夕張に住宅を購入した豪州在住
Michelle さんの声
価格の安さではなく、その土地への敬意を大切にして夕張を選びまし
た。投資や賃貸のためではなく、家族や友人が集う
"帰る場所 "です。
地元のお店を利用し、不在時の管理も地元の方にお願いしています。
歴史を知るほど町に惹かれ、
感じています。
『 ここは長く戻ってくる場所になる
』 と
04
成長基盤
ホーム単色塗り
つぶし
20
人的資本経営を起因とするインパクトの創出
当社は、人的資本への投資を成長の起点と位置づけています。地域に貢献したいという意欲ある人材の採用・育成を土台に、営業人員数の増加と生産性(
1人あたり売買件数)の向上を実現し、
01
その成果を社会的・財務的なインパクトへとつなげています。
社会課題の解決
社会課題の解決
人的資本の最大化
サービス・商品品質の向上
事業における成果
インパクトの最大化
<インプット>
<アクティビティ>
<アウトプット>
<アウトカム>
パーパス
02
価値創造の仕組み
地元で働きたい・貢献したい
意欲ある社員の採用
お客様満足度の向上
標準化された育成体系
良い子・強い子・賢い子
×ビジネス視点を持つ学生を採用する
エントリーマネジメント
価値創造の仕組み
一気通貫の仕事設計
社会的インパクト
補修費率
(対売上高)
: 0.3 %程度
Google 口コミ:
4.0 以上
ナレッジ文化
成長戦略
空き家問題の解決
成長戦略
アフォーダブル住宅の提供
成長の基本戦略
暮らしの豊かさ(
Well -Being )
の向上
固定給を中心とした成果連動報酬
+チームインセンティブ
03
ROIC 思考のインセンティブ制度
成長の基本戦略
人事管掌役員インタ
ビ
ュ
ー
人事管掌役員インタビュー
事業戦略管掌役員インタ
ビ
ュ
ー
事業戦略管掌役員インタビュー
人ン
イ
的
パ
資
ク
ト
本
の
経
創
営
出
を起因と
する
人的資本経営を起因とする
エンゲージメントの向上
公平な機会の提供と
サーベイの実施による
リテンション向上
インパクトの創出
価値の総和の増加
マテリ
アリ
ティ
(
インプッ
ト)
マテリアリティ(インプット)
中期経営計画の取り
組み
安全・衛生管理
販売件数: 1万件
中期経営計画の取り組み
財務戦略
1人当たり売買件数: 20 件
財務戦略
財務インパクト
仲介会社・パートナー工務店との共創
財務ハイラ
イト
財務ハイライト
業務の標準化による効率化
資本効率・収益性の向上
買取精度の向上
成長基盤
04
成長基盤
DX推進による生産性向上
工期短縮・品質の向上
働きがいの向上
エリア・顧客データベースの活用
戦略在庫枠等の各種施策
離職率: 10 %程度
エンゲージメント:
BBB 以上
女性管理職登用: 30 %以上
営業活動の質の向上と時間の有効活用
仕入れチャネルの多様化
未出店エリアへの進出
人的資本への再投資
ホーム単色塗り
つぶし
マテリアリティ
21
(インプット)
KRP (カチタスリフォームパートナー会)の実施
引き渡し後の補修費用と対売上高比率(連結)
商品品質の向上
0.27%
0.20%
耐震性能の向上
254
(百万円)
01
0.28%
社会課題の解決
社会課題の解決
353
424
2025/3
2026/3
中古住宅を探されるお客様の中には 、地震による倒壊に不安を抱き 、購
入に踏み出せない方もいらっしゃいます
査・調査に取り組む企業と連携して
。現在では 、当社が買い取
る物件の約 2割が旧耐震基準の戸建住宅ですが 、 その内、約5割は新耐震基
準にリフォームを行い販売しています
。 なお 、新耐震基準に適合した物件
を購入する際には税制優遇を受けられるため
、 お客様の負担を軽減する側
面もあります 。 この取り組みを通じて当社は
、 お客様が安心して住める住
02
価値創造の仕組み
価値創造の仕組み
Google ビジネスプロフィールの評価
、「旧耐震基準」 の物件を 「新耐震基
準」 に適合させるリフォームを実施しています
宅を今後も提供してまいります
2024/3
。 そこで 、当社では住宅の建物検
また当社では商品の品質だけでなく営業社員の対応の品質も含めたお客
様からの評価向上を目指しており
て運営しております
、 グーグルマップ上での評価を指標とし
。直近1年間の評価は以下の通りです 。
成長戦略
地域毎に 10 社から 20 社のパートナー工務店にお集まりいただき
4.68 (全店舗平均)
スリフォームパートナー会
( KRP 会)」
を当社は定期的に開催していま
03
成長戦略
「 カチタ
成長の基本戦略
成長の基本戦略
す。 KRP 会のプログラムは 「 カチタスの事業方針の説明」「良ナレッジ ・
。
人事管掌役員インタ
ビ
ュ
ー
耐力壁の新設
耐震補強金物を設置
ミスナレッジ共有
持続的なパートナーシップによる
地域コミュニティへの貢献
建物の現況の評点を計算
し 、新耐震レベルの評点を
クリア出来る補強案を立
受けながらリフォームの企画を行っています
。 パートナーとして相互理解
店と直接対話する機会を設けることが重要であると考え
継続的な工事発注と
よる評価書を発行していま
資金繰りの安定に向けた取り組み
事業戦略管掌役員インタビュー
人ン
イ
的
パ
資
ク
ト
本
の
経
創
営
出
を起因と
する
人的資本経営を起因とする
を図るためにも 、代表取締役社長をはじめとした経営陣がパートナー工務
強金物を設置することで耐
震化を行い 、第三者機関に
人事管掌役員インタビュー
事業戦略管掌役員インタ
ビ
ュ
ー
案、耐力壁の新設や耐震補
す。
」「工務店表彰」「懇親会」等です 。
当社の営業社員は若手社員も多く 、 パートナー工務店からアドバイスを
、 KRP 会を開催し
ております 。
インパクトの創出
マテリ
アリ
ティ
(
インプッ
ト)
マテリアリティ(インプット)
中期経営計画の取り
組み
中期経営計画の取り組み
財務戦略
アンケート内容の抜粋
財務戦略
財務ハイラ
イト
当社のパートナー工務店のほとんどは中小規模の工務店です
工務店には継続的にリフォーム工事を発注しており
お客様満足度の向上
、資金繰りを支援する
目的で月 3回の締め日と短い支払いサイクルを設定しています
当社が販売した住宅の引き渡し後に
、当社に責任がある引き渡し後の住
いているパートナー工務店からは
。 これらの
。取引いただ
「新築の工事案件が減少する中で継続し
宅の不具合( 契約不適合を含む ) が発生した場合は 、当社の負担で補修工
事を行っております
要な水回り品や建材が高騰し資金繰りが厳しくなりやすい環境で
当社で補修することが適切と判断された場合は
ついても対応しています
フォームの品質指標として
、
、法的責任のない不具合に
。引き渡し後に発生した補修件数
部材をカチタスが用意してくれるので助かる
(百万円)
、苦情・不具合の内容と併せて週次で経営陣に
共有されています 。
自社だけでは知りえない不具合やクレームの事例を学ぶことができまし
た。物件の可能性を引き出せるのがリフォームなので、良いことも悪いこ
ともカチタスさんに相談しながら魅力的な住宅を作りたいと思います。
18,450
。 なお 、不具
合に関する適切な報告と適正な補修対応が行われることを担保するため
16,112
各店のパートナー様
2025/3
初めて参加しましたが、工務店さんの多さに驚きました。カチタスの社
長や社員からの我々工務店向けのメッセージがとても暖かく、そして我々
の日々の仕事を細やかに見てくれているんだなと感動しました。
、
補修費用が売上高に占める比率は現状と同等程度あるいは緩やかに低下す
。
2024/3
2026/3
04
成長基盤
工事における注意点について
17,368
各年度の補修費用と売上高に占める比率は以下の通りです
ることが望ましいと考えております
、必要な
」等の声をいただいておりま
す。
・費用はリ
新井社長の1万件、中長期で 2万棟を目指すという目標、そしてより良い
暮らしを提供するという想いの強さに共感しました。現場の職人にもこの
KRP会の熱量を伝えたいと思います。一緒に成長していきたいです。
成長基盤
て仕事があるのは助かる 」「資金繰りの心配が少ない 」「 リフォームに必
。 また顧客保護とレピュテーション向上の観点から
財務ハイライト
社長メッセージについて
ご紹介パートについて
ホーム単色塗り
つぶし
22
第4次中期経営計画 ( 2 0 26 年3 月期~ 2 028 年3 月期) の取り組み
中計施策進捗
01
社会課題の解決
第4次中期経営計画基本戦略
中期経営計画の取り組みイメージ
2026 年3月期実績
社会課題の解決
営業人員数の増加
既存事業を深堀りしつつ 、地理的な新規市場の獲得を進め 、 また新しい顧客セグメントにリーチできる新規商品の開発
を目指します 。 また 、新規市場と新規顧客層の開拓により 、成長ポテンシャルの拡大と成長加速の実現を目指します
新卒採用人数
。
営業人員数増加と
02
価値創造の仕組み
24 年4月実績
25 年4月実績 26 年4月実績 27 年4月目標
カチタス
100 名
129 名
152 名
リプライス
21 名
28 名
育成強化
- 小型店舗の出店
新規市場への進出
⚫
⚫
日本で一番、ひとびとの
暮らしを豊かにする会社
未出店地域への出店強化
小型店舗による小規模・高収益エリアへの進出
34 名
35 名
(計画 35 名)
成長戦略
成長の基本戦略
成長の基本戦略
戦略在庫の販売構成比率
人事管掌役員インタ
ビ
ュ
ー
人事管掌役員インタビュー
生産性向上
- 戦略在庫枠の設定
03
成長戦略
都市近郊で新規出店予定(千葉・神奈川)
小型店は益田店・名寄店を出店。ほか複数店舗を検討中
長期ビジョン
新
規
市
場
150 名
(計画 150 名)
- 未出店地域への出店
価値創造の仕組み
25 年3月期
26 年3月期
3%
カチタス
事業戦略管掌役員インタ
ビ
ュ
ー
事業戦略管掌役員インタビュー
人ン
イ
的
パ
資
ク
ト
本
の
経
創
営
出
を起因と
する
人的資本経営を起因とする
インパクトの創出
低価格商品の販売構成比率
マテリ
アリ
ティ
(
インプッ
ト)
マテリアリティ(インプット)
中期経営計画の取り
組み
24 年3月期
リフォーム企画の多様化
- 新たな顧客層の獲得
25 年3月期
26 年3月期
中期経営計画の取り組み
財務戦略
カチタス
15%
20%
20%
リプライス
10%
20%
20%
財務戦略
財務ハイラ
イト
財務ハイライト
新規顧客層の獲得
既
存
市
場
既存市場・既存商品
⚫
⚫
⚫
新築検討層獲得のための物件強化
新築検討層獲得のための物件強化
ファミリー世帯以外獲得のための企画力の強化
ファミリー世帯以外獲得のための企画力の強化
仕入れチャネルの多様化
対自治体・対他業種との提携を推進する専任担当者をそれぞれ採用
これまで岡山県瀬戸内市を含む計 6自治体と協定締結
04
成長基盤
仕入れチャネル多様化
さらなる案件掘り起こし
M &A
既存商品
成長基盤
非開示
グループ内での物件仲介
低価格商品やリフォーム中など、一般の仲介会社では販売しづらい工
事中の物件も販売が促進
新規商品
リプライスの収益の
安定性アップ
グループ仲介比率 *1
24 年3月期
25 年3月期
26 年3月期
9%
12%
18%
*1 リプライス物件のカチタス仲介販売件数
÷
リプライスの販売件数
ホーム単色塗り
つぶし
23
財務戦略
事業を通じて創出したキャッシュについては
基本方針
、将来の成長に向けた投資 ( 人材・在庫・ M&A) への充当を優先的に検討しながら高い水準の株主還元を行
い、成長の維持・加速と資本効率性の維持・向上を通じて持続的な企業価値向上を実現します
財務K GI
中間KPI
01
。
社会課題の解決
社会課題の解決
施策(非財務の主な取り組み)
02
価値創造の仕組み
売上総利益
販売件数
26/3期実績
8,380 件
中計目標
10,000 件超
営業人員数
地元採用→地元配属
エンゲージメント 向上を通じた離職抑制
販売生産性
( 1人当たり販売件数)
自社販売・ OJT等による営業力強化
業務の効率化( DXツールの活用等 )
仕入価格
仲介会社とのネットワークの強化
CM等による消費者認知の獲得
価値創造の仕組み
キャピタルアロケーションの方針
高い水準の配当性向を維持しつつ、将来的な投資
(人材・在庫・
M&A )に向けた余力を一定程度確
保します。投資を実行した後も
26/3期実績
25.2%
中計目標
最低20% 以上を維持
協力会社ネットワークによる低価格施工
住宅資材のー括発注によるディスカウント
リフォーム価格
成長の基本戦略
加速しており、戦略在庫含む在庫資金
販売価格
25% を目指す
成長の基本戦略
人事管掌役員インタ
ビ
ュ
ー
人事管掌役員インタビュー
として 借入
事業戦略管掌役員インタ
ビ
ュ
ー
増加が見込まれるため、 28/3末の自己資本比率は
事業戦略管掌役員インタビュー
人ン
イ
的
パ
資
ク
ト
本
の
経
創
営
出
を起因と
する
当初見込みより低下する予定です。
リフォーム品質の向上、プランの多様化
DXツール等による販売価格の最適化
03
成長戦略
30% 以上の自己資
本比率を確保する方針です。
中計策定時の想定以上の販売状況を受けて仕入も
1件当たり売上総利益
(粗利 /1件)
成長戦略
人的資本経営を起因とする
M&A は、弊社として前向きに検討したい案件が複
インパクトの創出
マテリ
アリ
ティ
(
インプッ
ト)
数あり、継続して検討してまいります。
マテリアリティ(インプット)
中期経営計画の取り
組み
ROE
生産性の向上
社員のモチベーション向上に向けた報酬体系
人件費
中期経営計画の取り組み
自己資本比率
財務戦略
財務戦略
財務ハイラ
イト
営業利益
販売費および一般管理費
26/3期実績
182 億円
中計目標
230 億円
総資産回転率
広告宣伝費
コミュニケーションチャネルの最適化
自社販売サイトの強化
その他販管費
業務プロセスの見直し
標準化· ツール活用によるコスト最適化
財務ハイライト
3年間の
3年間の 配当
当期
純利益
戦略
在庫
投資
内装リフォーム標準化
パートナー工務店 のネットワーク強化
リフォーム工期
28/3末
成長基盤
成長基盤
M&A
待機
余力
(自然体)
在庫回転率
財務レバレッジ
販売期間
リフォーム前・中契約の取り組み
配当性向
投資余力(人材・在庫・ M&A)を確保
高水準の配当性向
26/3期実績
- 2%
中計目標
50.0% 以上かつ累進配当
25/3末
55 %
04
60%
程度
最低限
30%
ホーム単色塗り
つぶし
24
財務ハイライト
(単位:百万円)
22 年3月期
23 年3月期
24 年3月期
25 年3月期
26 年3月期
営業利益/営業利益率
売上高
151,851
160,000
101,269
121,341
126,718
129,537
151,851
(売上高成長率)
+3.6%
+19.8%
+4.4%
+2.2%
17.2%
18,279
14.0%
12.0%
6,120
6,927
7,169
7,372
8,380
80,000
10,000
売上原価
76,621
94,485
98,904
98,835
116,480
60,000
8,000
売上総利益
24,647
26,855
27,814
30,702
35,371
40,000
10.0%
8.0%
調整後売上総利益
(調整後売上総利益率)
販売費及び一般管理費
営業利益
(営業利益率)
経常利益
24.3%
22.1%
21.9%
23.7%
6.0%
6,000
23.3%
20,000
0
24,647
26,855
27,814
30,702
37,671
4.0%
24.3%
22.1%
21.9%
23.7%
24.4%
11,519
12,795
15,141
16,479
17,091
13,127
14,060
12,672
14,222
18,279
13.0%
11.6%
10.0%
11.0%
12.0%
12,697
13,833
12,321
13,876
17,809
10.0%
14,000
12,000
8.0%
6.0%
8,000
6,000
2024/3
2025/3
当期純利益
12.5%
6,845
11.4%
6,091
9.7%
8,497
10.7%
9,550
11.7%
12,470
(当期純利益率)
6.8%
5.0%
6.7%
7.4%
8.2%
1株当たり当期純利益
88.71
78.66
109.23
122.22
159.43
1株当たり配当金額
33.50
49.00
54.00
56.00
80.0
(配当性向)
37.8%
62.3%
49.4%
45.8%
50.2%
44,862
54,143
52,252
61,535
81,203
販売用不動産・仕掛販売用不動産
2026/3
2.0%
2022/3
2023/3
2024/3
2025/3
0
2026/3
0.0%
2022/3
2023/3
2024/3
2025/3
2026/3
成長戦略
1.96
1.91
1.86
1.74
1.63
株主資本
32,562
35,655
40,289
45,719
53,059
純資産
32,752
35,768
40,341
45,719
53,059
総資産
62,644
66,304
77,366
83,329
93,245
自己資本比率
52.0%
53.8%
52.1%
54.9%
56.9%
1株当たり配当金 /配当性向
成長の基本戦略
当期純利益
14,000
1株当たり配当金額
(当期純利益率)
12,470
10.0%
180
159.43
(配当性向)
100
18,500
18,500
26,500
26,500
26,500
D/Eレシオ
0.6倍
0.5倍
0.7倍
0.6倍
0.5 倍
ROA
22.2%
21.8%
17.6%
17.7%
20.7%
ROE
22.6%
17.9%
22.4%
22.2%
25.2%
人事管掌役員インタ
ビ
ュ
ー
8.2%
8.0%
80.0
140
80
6.0%
8,000
50.0%
783
832
859
922
1002
(中古住宅再生事業)
727
771
798
852
910
(全社)
56
61
61
70
92
40.0%
80
6,000
4.0%
事業戦略管掌役員インタビュー
人ン
イ
的
パ
資
ク
ト
本
の
経
創
営
出
を起因と
する
60
100
人事管掌役員インタビュー
60.0%
事業戦略管掌役員インタ
ビ
ュ
ー
50.2%
10,000
人的資本経営を起因とする
インパクトの創出
30.0%
40
マテリ
アリ
ティ
(
インプッ
ト)
60
20.0%
4,000
40
2.0%
2,000
20
0
2022/3
2023/3
2024/3
2025/3
0
0
0.0%
2022/3
2026/3
マテリアリティ(インプット)
中期経営計画の取り
組み
10.0%
20
2023/3
2024/3
2025/3
0.0%
2022/3
2026/3
2023/3
2024/3
2025/3
中期経営計画の取り組み
財務戦略
財務戦略
2026/3
財務ハイラ
イト
財務ハイライト
自己資本比率
株主資本/総資産
ROA
100,000
ROE
株主資本
93,245
総資産
70.0%
56.9%
60.0%
成長基盤
80,000
30%
50.0%
25.2%
53,059
60,000
20%
20.7%
30.0%
40,000
20.0%
20,000
0%
10.0%
0.0%
0
2022/3
2023/3
2024/3
2025/3
2026/3
2022/3
2023/3
2024/3
2025/3
2026/3
*1 1株当たり純利益及び 1株当たり配当金は、 2017 年9月22日及び2020 年4月1日付の株式分割を考慮して算出しております。
*2 ROA = 営業利益 / 資産合計の期首期末残高平均
*3 ROE = 当期純利益 / 株主資本の期首期末残高平均
04
成長基盤
40.0%
10%
連結従業員数
成長の基本戦略
70.0%
160
12,000
40%
有利子負債
03
成長戦略
1株当たり当期純利益
当期純利益/当期純利益率
ROA/ROE
(棚卸資産回転率)
価値創造の仕組み
2,000
0.0%
120
(経常利益率)
02
価値創造の仕組み
4.0%
2.0%
0
2023/3
社会課題の解決
4,000
2,000
2022/3
社会課題の解決
12.0%
10,000
4,000
(売上総利益率)
14.0%
17,809
11.7%
16,000
12,000
販売件数
(経常利益率)
12.0%
14,000
100,000
20,000
18,000
16,000
120,000
01
経常利益
(営業利益率)
18,000
140,000
売上高
経常利益/経常利益率
営業利益
20,000
2022/3
2023/3
2024/3
2025/3
2026/3
04
25
提供価値
成長基盤
ご売却いただくお客様
施工会社様
従業員
ご購入いただくお客様
顕在ニーズと潜在ニーズを満たし、住み続けてからも安心な住宅を提供する
ご購入いただくお客様からの声
6年間も家を探し続ける中で
①
、口コミ
の評価が高かったカチタスに問い合わ
せしました 。中古住宅固有のリスクも
丁寧に説明してくれたおかげで
、購入
に踏み切ることができました
。家族や
友人に褒められる自慢の家ですし
、知
り合いの工務店に聞くと
『 この価格で
このリフォームはできない
』 と言われ
るほどでした 。 あのとき連絡して 、本
当に正解でした 。
ご購入いただくお客様からの声
②
離婚を機に住み替え先を探していまし
た。金額に余裕はなかったため 、気に
なる部分だけを直すプランのおかげで
予算にもぴったり収まり
とりも生まれました
、暮らしにゆ
。年数が古いこと
は気がかりでしたが 、良いところも悪
いところも包み隠さず話してくれたの
で 、安心して決められました
仲介会社様
株主の皆様
。
ホーム単色塗り
つぶし
26
事業成長を推進する取締役会
取締役会のスキルマトリックス
社外取締役の積極的な登用
01
社会課題の解決
当社では 、以下の通り取締役会のスキルマトリッ
クスを定めております
社会課題の解決
当社は、 それぞれが専門的な知識を有する独立社
。当社の戦略と関連するスキ
外取締役を招聘し 、全取締役7名中3名( 42 .9% ) が
ル・経験等としては 、住宅供給能力向上のための営
独立した立場から業務執行取締役の業務執行をモニ
業人員数の増加を実現する上で 「人事」、生産性の
タリングしております
向上を実現する上で 「営業・ マーケティング
営者や企業統治推進の有識者、会計領域、 マーケ
02
。社外取締役は事業会社の経
価値創造の仕組み
」「 IT
デジタル 」 を必要なスキルだと認識しております
。
価値創造の仕組み
ティング等の幅広い経験と知識を有しているメン
また 、最大のリスクである引き渡し後の不具合発生
バーで構成されており 、透明性の高い事業運営を心
を防ぐ目的で 「法務・ リスクマネジメント
がけています 。
」「建
築・業界経験」 を重要なスキルと位置付けておりま
成長戦略
成長戦略
す。
取締役(社外)
取締役(社外)
監査役
監査役(社外)
福島 かなえ
永井弘
中尾隆一郎
須藤実和
高橋徹郎
角田朋子
2025 年当社監査役
2026 年当社監査役
2025 年当社取締役
2021 年当社取締役
2014 年当社入社
2025 年当社監査役
2021 年当社監査役
スキル/経験等
監査役
●
営業・マーケティング
●
監査役
●
●
●
●
●
●
●
会計・ファイナンス
代表取締役
取締役
社長
管理本部長
事業成長を推進する取締役会
●
コ
ーポレート
ガバナンスの体制
コーポレートガバナンスの体制
●
●
●
●
●
●
●
●
●
●
●
●
●
●
取締役
業務執行取締役
(子会社業務執行取締役を含む)
○
○
○
業務執行取締役等のうち
新卒採用以外で入社した者
○
○
○
独立役員としての届出
○
○
○
○
○
独立役員の在任年数
8
6
2
6
2
性別
男
男
男
男
男
女
男
男
男
女
女
年齢 ( 2026年6月末時点)
57
58
42
70
62
62
62
59
61
55
52
佃秀昭
牛嶋孝之
新井健資
横田和仁
白井俊之
2019 年当社取締役
2009 年当社グループ
2009 年会社入社
2017 年当社取締役
2012 年当社入社
当社代表
取締役社長
2012 年当社入社
2017 年当社取締役
2017 年管理本部長
2017 年当社取締役
※ スキルマトリックス表内の
「●」印は、各役員に特に求めるスキル・経験等(
04
事業成長を推進する取締役会
●
建築・業界経験
取締役
●
●
ITデジタル
取締役(社外)
●
法務・リスクマネジメント
ESG
福島かなえ
人事
●
角田朋子
●
永井弘
高橋徹郎
中尾隆一郎
須藤実和
佃秀昭
白井俊之
牛嶋孝之
横田和仁
新井健資
会社経営
成長基盤
成長基盤
取締役
監査役(社外)
03
1人につき 3領域まで)について示したものです。
ホーム単色塗り
つぶし
27
コーポレートガバナンスの体制
取締役の報酬制度の設計は、優秀な経営人財を確保し 、上場企業として持
コーポレートガバナンス体制図
当社は、会社法に基づく機関として
続的な発展に資することから重要な経営課題であると認識しております
、株主総会及び取締役会、監査役会を
設置するとともに 、独自の経営会議体として経営会議及びコンプライアンス
委員会を設置しております 。 また当社は 、当社の事業に精通している者が取
締役として業務執行に当たると同時に
、経営の意思決定の迅速化のために取
締役会のメンバーとして経営上の意思決定及び各取締役の業務執行を相互に
考えております 。各種会議体の詳細は、 ESGデータブックをご覧ください
。
、重要な討議事項および速や
かに着手できる事項については 、 2027 年3月期の取締役会から順次対応しま
の様な認識のもと 、 2021 年6月には、業務執行取締役に対して業績連動型の
す。来期は次の5点を重点的に強化し 、取締役会の実効性のさらなる向上を
譲渡制限株式制度の導入を決定し 、中長期的な企業価値向上に向けて報酬制
図ってまいります 。
度の設計の見直しを行っております
社会課題の解決
する金銭報酬 ( 売上・営業利益等の財務KPI と取締役毎に設定された KPI 、安
、 サステナビリティ
KPI 等の目標達
「業績連動報酬( 譲渡制限付株式報酬)」
により構成して
おり 、個人別業績指標100 %達成の場合における各報酬の比率の目安は下記
02
取締役会の実効性のさらなる向上に向けた取り組み
なお 、当社の業務執行取締役の報酬は、「固定報酬」「個人別業績に連動
成状況に連動)」
01
社会課題の解決
。
定成長に向けた基盤づくりに対する評価
監督し 、 かつ監査役会による監査を行うことが最も適切な経営体制であると
評価を通じて明らかになった改善課題のうち
。こ
価値創造の仕組み
強化テーマ
価値創造の仕組み
主な取り組みと狙い
⚫
定型的な業績報告を簡素化
⚫
生み出した時間を中長期戦略、資本政策、人的資
本、内部統制の討議へ振り替え
⚫
執行役員からの報告機会を設け、執行と監督の対
話を深化
⚫
中期経営計画、資本政策、人的資本、内部統制・
ERM 、サステナビリティ等を重点テーマに選定
⚫
討議の時期と論点を年間計画として設定し、議論
の継続性と充実度を確保
審議時間の重点配分
成長戦略
の通りです ( 実際の比率は取締役により異なります
) 。
03
成長戦略
株主総会
選任・解任
選任・解任
選任・解任
業績連動
業務監査
取締役会
監査役会
連携
監査
選定
報告
(現金)
20 %
報告
コンプライアンス委員会
(本部長、部長、室長等、常勤監査役)
指示
業績連動
指示
報告
経営会議
重点テーマの
年間アジェンダ化
10 %
会計監査人
連携
報告
代表取締役社長
指示
(株式)
連携
報酬体系
会計監査
高度化
(本部長、常勤監査役、管理部長)
報告
報告
内部監査室
各部門
助言・相談
外部専門家
・顧問弁護士
・顧問税理士
70 %
社外役員による
協議の場の充実
⚫
内部監査機能の強化とあわせ、取締役会が運用状
況を継続的にモニタリング
⚫
長期戦略、内部統制、後継者計画(サクセッショ
ン)等を議題とする協議の場を 2026 年5月に実施
⚫
継続開催し、議論の要旨を取締役会へ共有するこ
とで独立した立場からの監督機能を強化
⚫
資料の提供時期・情報量を見直し、役員が十分な
検討時間を確保できる運営へ改善
⚫
運営のデジタル化を進め、取締役会を支える事務
局機能を向上
取締役会の実効性評価
指名・報酬諮問委員会の設置
当社は取締役会を 、月次の事業運営をモニタリングする場であると同時
当社の取締役の報酬等の額は、 2002 年1月15 日開催の臨時株主総会におい
に、中長期の戦略やリスクを協議する場として活用しています
。取締役会は
て年額300 百万円以内( ただし 、使用人兼務取締役の使用人分給与を含みま
自由闊達で建設的な議論を尊ぶ運営を旨としており
せん。 ) と定めております 。 その上で 、役員の報酬については 、社内役員及
業績や運営方針に関する質問が活発になされ 、 その知見に基づく助言はタイ
び社外役員により構成される任意に設置した指名
ムリーに事業運営へ反映されています
・報酬諮問委員会を設けて
。
、社外役員からは直近の
。 また 、社外役員からの質疑でその場
では回答しきれなかった事項や継続検討となった事項は
取締役会までにフォローする運用としています
当社は、取締役会全体としての実効性を検証するため
当社の取締役の報酬は、業績の安定的な成長と新たな企業価値の創造の対
。
役の全員を対象としたアンケート調査を実施し
、可能な限り翌月の
。 こうした運営を通じて
資家の視点を強く意識した取締役会の実現に努めています
取締役の報酬の決定方針
価を支給することを目的として設計しております
リスクを網羅的に可視化し、優先順位と対応方針
を明確化
、投
。
、取締役および監査
、 その結果を分析・評価しま
した 。評価の概要は、当社コーポレート ・ ガバナンスに関する報告書をご覧
ください 。
取締役会
事務局機能の強化
04
成長基盤
事業成長を推進する取締役会
事業成長を推進する取締役会
コ
ーポレート
ガバナンスの体制
固定報酬・手当
内部監査
協議を行った上で決定しています
⚫
リスクガバナンスの
成長基盤
さらに当社は 、独立社外取締役および独立社外監査役等による情報交換と
認識の共有を促す場として 、 2026 年5月に意見交換会を初めて開催しまし
た。自由闊達な意見交換を確保する観点から 、 あらかじめ議題を設けず 、各
出席者が認識する経営上の課題や問題意識を幅広く議論しています
。今後も
継続開催する方針で 、年間複数回の開催を念頭に日程調整を進めています 。
加えて 、中期経営計画の策定など個別の重要テーマがある場合には 、代表取
締役社長と独立社外取締役全員との個別面談を実施しています
。
コーポレートガバナンスの体制
©2026 KATITAS Co.,Ltd.
会社概要 ( 202 6 年 3 月 31 日時点 )
商号
株式会社カチタス
本社所在地
群馬県桐生市美原町
資本金
3 , 778 百万円
設立
1978 年 9 月 1 日
従業員数 ( 連結 )
1 , 002 名
4番2 号
注意事項
本統合報告書は、 2026 年 3 月期の業績及び今後の経営戦略に
関する情報の提供を目的として当社が作成したものであり
、米
国、日本国又はそれ以外の一切の法域における有価証券の取得勧
誘又は売付け勧誘等を構成するものではありません
。
本統合報告書に記載されている情報又は意見は、制作時の経
済、規制、市場等の状況を前提としていますが、その真実性、
正確性、又は完全性について、当社は何ら表明及び保証するも
のではなく、また今後、予告なしに変更されることがありま
す。