MIRARTHホールディングス株式会社 2026年3月期決算説明会 証券コード:8897 1 Copyright © MIRARTH HOLDINGS Group. ALL RIGHTS RESERVED. 【今期業績】…
MIRARTHホールディングス株式会社
2026年3月期決算説明会
証券コード:8897
1
Copyright © MIRARTH HOLDINGS Group. ALL RIGHTS RESERVED.
【今期業績】
2026年3月期の連結業績は、売上高214,369百万円(前年同期比+9.1%)、営業利益17,649百万円(同+22.9%)、経常利益14,182百万円(同
+14.1%増)、親会社株主に帰属する当期純利益は4,758百万円(同△42.0%)となりました。主力の不動産事業が堅調に推移したことに加え、収益
性改善に向けた各種施策が奏功し、売上高は過去最高、営業利益および経常利益も過去最高益を達成しました。一方で、エネルギー事業における構造
改革の実施に伴い「延岡バイオマス発電所」等に係る減損損失を計上した結果、親会社株主に帰属する当期純利益は前期比で減益となりました。
【不動産事業】
不動産事業における新築戸建分譲事業およびリニューアル再販事業を新たな成長牽引事業と位置付け、経営資源の配分を強化します。新築戸建分譲
事業については販売価格の見直しや値引きの圧縮により、売上高は前期比26.8%増、売上総利益は前期比47.3%増と大幅な増収増益を達成しま
した。リニューアル再販事業についても利益率向上を追求した結果、売上総利益は計画を70.4%上回るなど、極めて高い収益性を実現しています。
また、仕入も順調に進捗しており、将来の成長に向けた基盤を構築しています。
【エネルギー事業】
エネルギー事業では、インフレ影響、金利上昇、維持管理コストの増加、制度変更リスク等を踏まえ、事業ポートフォリオの見直しを実施しました。また、
カンボジアで実施しているカシュー事業をエネルギー事業から分離し次世代事業に位置付けております。ROIC管理を厳格化し、より収益性の高い資
産への入れ替えを進めるとともに、事業用蓄電池など成長性の高い分野に投資対象を厳選していきます。
【株主還元方針】
株主還元については、従来の配当性向35~40%を継続しつつ、新たにDOE(株主資本配当率)を導入しました。配当性向とDOEのいずれか高い方を
配当金額決定の基準とすることで、安定性と予見可能性を高めた還元方針へ移行します。また、約10年ぶりとなる自己株式の取得も決定、資本効率の
向上と株主還元の更なる強化を進めてまいります。
エグゼクティブサマリー
Copyright © MIRARTH HOLDINGS Group. ALL RIGHTS RESERVED.
INDEX
2
目次
P. 3
P. 16
P. 24
P. 29
1.2026年3月期業績概要
2.2027年3月期通期業績予想
3.3/9のアップデート、今後の不動産事業について
4.Appendix
2026年3月期業績概要
01
p e r f o r m a n c e s u m m a r y
4
Copyright © MIRARTH HOLDINGS Group. ALL RIGHTS RESERVED.
2026年3月期連結損益計算書
2026年3月期
実績
(百万円)
2025年3月期
実績
前期比
増減率
売上高
196,523214,3699.1%
売上原価
154,212168,7109.4%
売上総利益
42,31145,6597.9%
販売費及び一般管理費
27,94628,0090.2%
営業利益
14,36417,64922.9%
経常利益
12,42714,18214.1%
親会社株主に帰属する
当期純利益
8,2074,758△42.0%
負債コスト
1.6%2.3%0.7pt
株主資本コスト
6.9%7.3%0.4pt
WACC
2.9%3.2%0.3pt
2026年3月期
計画
計画比
増減
216,400△0.9%
172,000△1.9%
44,4002.8%
28,900△3.1%
15,50013.9%
12,00018.2%
8,000△40.5%
ー
ー
ーー
ーー
※WACC=負債コスト×(1-T)×D/(D+E)+株主資本コスト×E/(D+E)( T:実効税率[30.9%で試算]D:有利子負債E:親会社所有者帰属持分)
参考
3月9日
アップデート
計画比
増減
208,0003.1%
163,0003.5%
45,0001.5%
28,500△1.7%
16,5007.0%
12,50013.5%
4,5005.8%
ー
ー
ーー
ーー
5
Copyright © MIRARTH HOLDINGS Group. ALL RIGHTS RESERVED.
2026年3月期 セグメント別売上高・売上総利益・営業利益
2026年3月期
実績
(百万円)
2025年3月期
実績
前期比
増減率
不動産事業
売上高
178,512192,446
7.8%
売上総利益
38,45140,766
6.0%
営業利益
13,13015,552
18.4%
エネルギー事業
売上高
9,92111,465
15.6%
売上総利益
2,5513,036
19.0%
営業利益
1,1101,619
45.8%
アセットマネジメント事業
売上高
1,1621,226
5.5%
売上総利益
934937
0.4%
営業利益
268242
△9.5%
その他事業
売上高
6,9279,231
33.3%
売上総利益
373918
145.7%
営業利益
△144233
ー
総合計
売上高
196,523214,369
9.1%
売上総利益
42,31145,659
7.9%
営業利益
14,36417,649
22.9%
2026年3月期
期初計画
計画比
増減
194,600
△1.1%
39,500
3.2%
13,590
14.4%
10,870
5.5%
2,720
11.6%
1,220
32.8%
1,190
3.0%
970
△3.3%
280
△13.3%
9,740
△5.2%
1,210
△24.1%
410
△42.9%
216,400
△0.9%
44,400
2.8%
15,500
13.9%
※2026年3月期実績よりカシュー事業はエネルギー事業から『その他事業』にて計上しております。
6
Copyright © MIRARTH HOLDINGS Group. ALL RIGHTS RESERVED.
2,421
509
△25
378
7,649
4,365
2026年3月期営業利益(前期比)
(百万円)
2025年3月期
実績
2026年3月期
実績
不動産
アセットマネジメントエネルギーその他
1
2
4
3
⚫新築戸建分譲事業の伸長
や管理事業の収益性改善、
新築分譲マンション事業
におけるJVフィーの獲得
などが営業利益を底上げ
⚫発電設備等の売却実施、
販管費コントロールによる
営業利益率の向上
⚫AUM拡大に備えた人員
増強等の影響により、昨
対比微減
⚫建設事業の利益率改善、
ホテル運営の成長など
1
2
3
17,649
4
営業利益は前期対比で22.9%増。
不動産セグメントでは主軸の新築分譲マンションの他、新築戸建・リニューアル再販・賃貸・管理等が着実に成長し収益貢献。
14,364
7
Copyright © MIRARTH HOLDINGS Group. ALL RIGHTS RESERVED.
△455
△642
360
315
483
2,008
1,946
前期比で61百万円増加、ほぼ横ばいとなり28,009百万円の計上。
✓販管費全体での費用対効果
向上施策を推進
✓流動化売却案件の増加によ
り販売手数料が増加
✓4年連続のベースアップ等、
人的資本投資による人件費
の増加
✓物件購入に伴う消費税の増
加による公租公課の増加
(百万円)
2025年3月期
実績
2026年3月期
実績
広報費広告宣伝費等
(物件販売)
人件費販売手数料
(流動化等)
その他
2026年3月期販売費及び一般管理費(前期比)
27,946
28,009
8
Copyright © MIRARTH HOLDINGS Group. ALL RIGHTS RESERVED.
•物件竣工に伴う完成在庫の増加により、販売用不動産が拡大。
•早期の収益化を目的に、一部発電施設を販売用不動産へ振替。
2026年3月末
(百万円)
2025年3月末増減額
資産
372,508419,51247,003
流動資産
215,263257,95442,691
現金及び預金
48,04459,02710,982
棚卸資産
146,346169,05722,710
販売用不動産
53,55171,39717,845
販売用発電施設
65956891
仕掛販売用不動産、発電施設
92,72996,7023,973
固定資産
157,198161,5204,322
繰延資産
4737△10
負債
283,401329,39345,992
流動負債
134,075143,9409,865
支払手形・買掛金
28,41425,692△2,721
借入金(短期・一年内)
82,70085,9543,254
社債(一年内)
1,0062,8361,829
固定負債
149,325185,45336,127
長期借入金
136,185174,66138,476
社債
6,8874,624△2,263
純資産
89,10790,1181,010
資本金
9,0569,056ー
負債・純資産合計
372,508419,51247,003
2026年3月期連結貸借対照表
9
Copyright © MIRARTH HOLDINGS Group. ALL RIGHTS RESERVED.
総資産(419,512百万円)(2026年3月末)
流動資産257,954負債329,393
現金・預金59,027短期借入金他85,954
棚卸資産169,057社債(一年内)2,836
新築分譲マンション98,051長期借入金174,661
流動化32,593社債4,624
新築戸建14,107その他負債61,316
リニューアル再販23,203
発電施設1,101
その他流動資産29,870
固定資産161,520純資産90,118
有形固定資産134,019株主資本83,246
(内流動化資産)50,480新株予約権363
無形固定資産7,695非支配株主持分6,004
投資その他の資産19,805その他純資産504
28%
21%
5%
7%
25%
14%
有利子負債内訳
87%
1%
12%
0%
0%
20%
44%
3%
32%
1%
販売用資産内訳仕掛販売用資産内訳00
21
54%
17%
13%
13%
3%
レジデンス
ホテル
オフィス
商業・物流
土地など
資産に紐づかない
新築分譲マンション
新築戸建
発電施設
流動化
リニューアル再販
0%
38%
61%
1%
新築分譲マンション
発電施設
流動化
その他
新築分譲マンション
新築戸建
発電施設
流動化
リニューアル再販
1
2
流動化資産内訳
有形固定資産内訳
新築分譲マンション
新築戸建
流動化
リニューアル再販
2026年3月期連結貸借対照表(内訳)
(百万円)
10
Copyright © MIRARTH HOLDINGS Group. ALL RIGHTS RESERVED.
※社債7,460百万円を含む
資産合計
(百万円)
販売用不動産仕掛不動産有形固定資産借入金・社債
新築分譲マンション
14,286
83,7642898,079
76,531
流動化
31,909
68450,48083,074
55,931
新築戸建
2,096
12,010-14,107
12,494
リニューアル再販
23,104
98-23,203
18,186
発電施設
956
14481,56082,661
66,987
その他
--1,9501,950
-
資産に紐づかない借入金・社債
----
37,946
※
合計
72,354
96,702134,019303,077
268,077
2026年3月期セグメント別資産・借入金・社債明細
•活発な用地仕入と物件竣工により、棚卸資産(販売用・仕掛不動産)が着実に拡大。
•資産ポートフォリオの最適化に向け、一部発電施設を販売用不動産へ振替。
11
Copyright © MIRARTH HOLDINGS Group. ALL RIGHTS RESERVED.
36%
5%
5%
7%
19%
14%
6%
3%
5%
1
2
3
4
5
6
7
9
10
2026年
3月期
大都市圏
45.9%
•販売価格等の上昇により売上高は増加するも、原価の高騰により売上総利益は減少。
•首都圏を中心に大都市圏でのラインナップが増加、販売価格を牽引。
新築分譲マンション
不動産事業
2026年3月期実績
(百万円)
2025年3月期実績前期比増減率
売上高
106,582106,9860.4%
売上総利益
23,08222,133△4.1%
粗利益率
21.7%20.7%△1.0pt
売上戸数
2,339戸2,767戸428戸
JV除外戸数
2,273戸2,087戸△186戸
業績実績
2026年3月期期初計画計画比増減
110,900△3.5%
23,210△4.6%
20.9%△0.2pt
2,820戸△53戸
2,150戸△63戸
27%
5%
12%
3%
18%
6%
8%
5%
4%
12%
1
2
3
4
5
7
9
10
2025年
3月期
大都市圏
44.1%
6
8
大都市圏比率
首都圏
1
中部圏
2
近畿圏
3
北海道圏
東北圏
4
5
関東甲信越圏
6
北陸圏
7
中国圏
8
四国圏
9
九州圏
10
大都市圏
事業概況
レーベン和光THE GRANDE (共同事業総戸数304戸)
12
Copyright © MIRARTH HOLDINGS Group. ALL RIGHTS RESERVED.
取得実績
•計画比は、利益率の向上が図れ、売上総利益が増加。
•新築分譲マンション事業で培った強みを生かし、主にレジデンスを中心に投資・開発を実施。
•戦略的な資産の入替により、アセットの短期回転を実現。
流動化
不動産事業
21
2026年3月期実績
(百万円)
2025年3月期実績前期比増減率
売上高
30,89836,69218.7%
売上総利益
7,3756,319△14.3%
粗利益率
23.9%17.2%△6.7pt
業績実績
2026年3月期期初計画計画比増減
39,000
△5.9%
5,550
13.9%
14.2%
3.0pt
売却実績
事業概況
17%
(開発)
20%
(既存)
4%
(開発)
39%(既存)
5%
2%
13%
合計金額
36,692
百万円
レジデンス
オフィス
ホテル
商業・物流
土地など
23%
(開発)
38%
(既存)
2%
27%
10%
0%
合計金額
22,614
百万円
レジデンス
オフィス
ホテル
商業・物流
13
Copyright © MIRARTH HOLDINGS Group. ALL RIGHTS RESERVED.
•新築戸建分譲:販売価格の見直しや値引き圧縮により、増収増益。
•リニューアル再販:利益率向上を追求し、計画を上回る売上総利益を達成。仕入は順調に進捗。
新築戸建分譲リニューアル再販
不動産事業
新築戸建分譲
2026年3月期実績
(百万円)
2025年3月期実績前期比増減率
売上高
12,95016,42626.8%
売上総利益
1,5012,21147.3%
粗利益率
11.6%13.5%1.9pt
売上戸数
217戸239戸22戸
2026年3月期期初計画計画比増減
16,500
△0.4%
1,800
22.8%
10.9%
2.6pt
250戸
△11戸
リニューアル再販
2026年3月期実績
(百万円)
2025年3月期実績前期比増減率
売上高
10,55410,6390.8%
売上総利益
1,5682,04530.4%
粗利益率
14.9%19.2%4.3pt
売上戸数
242戸238戸△4戸
仕入戸数
208戸401戸193戸
期末保有戸数
494戸657戸163戸
2026年3月期期初計画計画比増減
7,400
43.8%
1,200
70.4%
16.2%
3.0pt
150戸
88戸
50戸
351戸
394戸
263戸
事業概況
戸数変更
14
Copyright © MIRARTH HOLDINGS Group. ALL RIGHTS RESERVED.
•不動産賃貸:計画どおりに進捗。
•不動産管理:管理委託費の適正化を実施し増収増益。
不動産事業
不動産賃貸不動産その他不動産管理
2026年3月期
期初計画
計画比
増減
6,1508.8%
1,900△12.2%
30.9%△6.0pt
10,8200.5%
2,01012.3%
18.6%2.2pt
96,500戸△1,143戸
3,8308.0%
3,8307.9%
100.0%△0.1pt
事業概況
・△6ppt→△6pt
・△1,043戸⇒△3,034
戸
・147.1%→247.1%?
(百万円)
2026年3月期
実績
2025年3月期
実績
前期比
増減率
不動産賃貸
売上高
6,2296,6887.4%
売上総利益
1,6901,688△1.3%
粗利益率
27.1%24.9%△2.2pt
不動産管理
売上高
9,62310,87413.0%
売上総利益
1,5642,25744.3%
粗利益率
16.3%20.8%4.5pt
管理戸数
93,135戸95,357戸2,222戸
不動産その他
売上高
1,6744,137
147.1%
売上総利益
1,6694,131147.5%
粗利益率
99.7%99.9%
0.2pt
※賃貸管理戸数を合算して開示しております。
15
Copyright © MIRARTH HOLDINGS Group. ALL RIGHTS RESERVED.
エネルギー事業・アセットマネジメント事業・その他事業
•エネルギー事業:施設売却が利益に貢献したほか、一部の稼働済施設の順調な稼働により売電事業が増収増益に転換。
•AM事業:運用報酬等の増加に伴い、売上高は前年同期比で増加。
(百万円)
2026年3月期
実績
2025年3月期
実績
前期比
増減率
エネルギー事業
施設売却
売上高
-822-
売上総利益
-325-
粗利益率
-39.6%-
売電収入
売上高
9,92110,6437.3%
売上総利益
2,5512,7106.2%
粗利益率
25.7%25.5%△0.2pt
稼働済発電規模(累計)
385MW393MW8MW
アセット
マネジメント事業
売上高
1,1621,2265.5%
売上総利益
9349370.4%
粗利益率
80.4%76.5%△3.9pt
その他事業
売上高
6,9279,23133.3%
売上総利益
373918145.7%
粗利益率
5.4%10.0%
4.6pt
2026年3月期
期初計画
計画比
増減
--
--
--
11,670△8.8%
2,950△8.1%
25.3%0.2pt
410MW△17MW
1,1903.0%
970△3.3%
81.5%△5.0pt
8,9403.3%
980△6.3%
11.0%
△1.0pt
事業概況
※2026年3月期実績よりカシュー事業はエネルギー事業から『その他事業』にて計上しております。
・2026年3月期書計画
の数字根拠について
25年3月期末公表の
FACTBOOKに揃えま
した
https://mirarth.co.jp/
ir/pdf/2025_3_4q_fac
tbook.pdf
・注釈の位置
2027年3月期通期業績予想
02
E a r n i n gF o r e c a s t
17
Copyright © MIRARTH HOLDINGS Group. ALL RIGHTS RESERVED.
2027年3月期
予想
(百万円)
2026年3月期
実績
前期比
増減率
売上高
214,369228,7006.7%
売上原価
168,710183,7008.9%
売上総利益
45,65945,000△1.4%
販売費及び一般管理費
28,00930,0007.1%
営業利益
17,64915,000△15.0%
経常利益
14,18212,100△14.7%
親会社株主に帰属する
純利益
4,7588,00068.1%
WACC
3.2%
ーー
ROIC
3.7%3.2%△0.5pt
※ROIC=税引後営業利益÷投下資本(投下資本=有利子負債+親会社所有者帰属持分)
※WACC=負債コスト×(1-T)×D/(D+E)+株主資本コスト×E/(D+E)( T:実効税率[30.9%で試算]D:有利子負債E:親会社所有者帰属持分)
2027年3月期通期業績予想連結損益計算書
18
Copyright © MIRARTH HOLDINGS Group. ALL RIGHTS RESERVED.
2027年3月期
予想
(百万円)
2026年3月期
実績
前期比
増減率
不動産事業
売上高
192,446
202,7005.3%
売上総利益
40,766
40,400△0.9%
営業利益
15,552
12,800△17.7%
エネルギー事業
売上高
11,465
19,00065.7%
売上総利益
3,036
3,1002.1%
営業利益
1,619
2,00023.5%
アセットマネジメント事業
売上高
1,226
1,000△18.4%
売上総利益
937
750△20.0%
営業利益
242
50△79.4%
その他事業
売上高
9,231
6,000△35.0%
売上総利益
918
750△18.4%
営業利益
233
150△35.9%
総合計
売上高
214,369
228,7006.7%
売上総利益
45,659
45,000△1.4%
営業利益
17,649
15,000△15.0%
2027年3月期通期業績予想 セグメント別売上高・売上総利益・営業利益
※2026年実績よりカシュー事業はエネルギー事業からその他事業へ組み替えております。
19
Copyright © MIRARTH HOLDINGS Group. ALL RIGHTS RESERVED.
22%
5%
18%
12%
6%
9%
9%
4%
5%
10%
1
新築分譲マンション❶
不動産事業
2027年3月期予想
(百万円)
2026年3月期実績前期比増減率
売上高
106,986105,000△1.9%
売上総利益
22,13321,000△5.1%
粗利益率
20.7%20.0%
△0.7pt
売上戸数
2,767戸2,480戸△287戸
JV除外戸数
2,087戸1,910戸△177戸
業績予想
大都市圏比率
首都圏
1
中部圏
2
近畿圏
3
北海道圏
東北圏
4
5
関東甲信越圏
6
北陸圏
7
中国圏
8
四国圏
9
九州圏
10
大都市圏
2
3
4
5
7
9
10
2027年
3月期
大都市圏
45.9%
6
2027年3月期通期業績予想
36%
5%
5%
7%
19%
14%
6%
3%
5%
1
2
3
4
5
6
7
9
10
2026年
3月期
大都市圏
45.9%
8
ザ・グランドグレイス大坂西九条 (共同事業総戸数204戸)
•引渡戸数は減少するものの、売上高は前年並みの見込み。
•大都市圏比率は前期と同水準の見込み。
・行間を1.5→1.0にし
ました
20
Copyright © MIRARTH HOLDINGS Group. ALL RIGHTS RESERVED.
新築分譲マンション❷
不動産事業
2026年3月期
実績(売上戸数)
2027年3月期
竣工戸数
第1四半期
107戸401戸
第2四半期
206戸391戸
第3四半期
531戸464戸
第4四半期
1,923戸1,042戸
合計
2,767戸2,298戸
大都市圏戸数比率
45.9%48.1%
※大都市圏:首都圏・中部圏・近畿圏
2026年3月期
実績
2027年3月期
予想
売上戸数
2,767戸2,480戸
大都市圏売上比率
45.9%45.9%
2027年3月期
2025年3月期2026年3月期
通期計画
期首
時点
契約進捗率通期計画
期首
時点
契約進捗率通期計画
期首
時点
契約進捗率
当期引渡分
2,200戸
(2,150戸)
1,353戸
(1,311戸)
61.5%
(61.0%)
2,820戸
(2,150戸)
1,349戸
(1,005戸)
47.8%
(46.7%)
2,480戸
(1,910戸)
945戸
(648戸)
38.1%
(33.9%)
翌期以降引渡分2,200戸148戸
―
2,480戸300戸
――
388戸
―
新築分譲マンション契約進捗
竣工スケジュール
※( )内はJV戸数を除いた戸数および契約進捗率
2027年3月期通期業績予想
売上戸数
21
Copyright © MIRARTH HOLDINGS Group. ALL RIGHTS RESERVED.
•流動化:投資対象を厳選し、資金回収サイクルの短い案件への投資を積極化。
•新築戸建分譲:エリアの厳選と高回転化により、さらなる収益性向上を図る。
•リニューアル再販:着実な仕込み物件の売却進捗を背景に、前期同水準の利益率を計画。
(百万円)
2027年3月期
予想
2026年3月期
実績
前期比
増減率
流動化
売上高
36,69246,00025.4%
売上総利益
6,3198,00026.6%
粗利益率
17.2%17.4%0.2pt
新築戸建分譲
売上高
16,42620,00021.8%
売上総利益
2,2113,00035.7%
粗利益率
13.5%15.0%1.5pt
売上戸数
239戸203戸△36戸
リニューアル再販
売上高10,63913,00022.2%
売上総利益2,0452,50022.2%
粗利益率19.2%19.2%ー
売上戸数238戸248戸10戸
不動産事業
流動化リニューアル再販新築戸建分譲
2027年3月期通期業績予想
・売上戸数
171戸⇒238戸
・△13戸⇒54戸
・コメント修正
~堅調な推移を計画。
賃貸(前期同水準...)と
比較すると売上高,売上
総利益は2割アップ。
→江間さん
22
Copyright © MIRARTH HOLDINGS Group. ALL RIGHTS RESERVED.
•不動産賃貸:底堅い需要を背景に、前期同水準の堅調な推移を計画。
•不動産管理:大規模修繕工事等の受注見通しを考慮し、保守的に計画。
不動産事業
不動産賃貸不動産その他不動産管理
2027年3月期通期業績予想
・2,705戸⇒5,143
戸
・MS,流動化,戸建て,リ
ニューアル同様、『売上
総利益』を追加しません
か?
→江間さん
(百万円)
2027年3月期
予想
2026年3月期
実績
前期比
増減率
不動産賃貸
売上高
6,6886,500△2.8%
売上総利益
1,6681,7001.9%
粗利益率
24.9%26.2%1.3pt
不動産管理
売上高
10,87410,000△8.0%
売上総利益
2,2572,000△11.4%
粗利益率
20.8%20.0%△0.8pt
管理戸数
95,357戸98,500戸3,143戸
不動産その他
売上高
4,1372,200△46.8%
売上総利益
4,1312,200△46.7%
粗利益率
99.9%100.0%0.1pt
※賃貸管理戸数を合算して開示しております。
23
Copyright © MIRARTH HOLDINGS Group. ALL RIGHTS RESERVED.
•エネルギー事業:事業ポートフォリオの再構築に伴う施設売却により、売上高は大幅に増加。
•アセットマネジメント事業:資産入れ替えの影響により減収減益の計画も、AUMの着実な拡大により将来の成長基盤を強化。
エネルギー事業・アセットマネジメント事業・その他事業
2027年3月期通期業績予想
※2026年3月期実績よりカシュー事業はエネルギー事業から『その他事業』にて計上しております。
(百万円)
2027年3月期
予想
2026年3月期
実績
前期比
増減率
エネルギー事業
施設売却
売上高
8229,000994.6%
売上総利益
32560084.3%
粗利益率
39.6%6.7%△32.9pt
売電収入
売上高
10,64310,000△6.0%
売上総利益
2,7102,500△7.8%
粗利益率
25.5%25.0%△0.5pt
稼働済発電規模(累計)
393MW413MW20MW
アセット
マネジメント事業
売上高
1,2261,000△18.4%
売上総利益
937750△20.0%
粗利益率
76.5%75.0%△1.4pt
その他事業
売上高
9,2316,000△35.0%
売上総利益
918750△18.4%
粗利益率
10.0%12.5%2.5pt
3/9のアップデート、今後の不動産事業について
03
U p d a t e o n 9 M a r c h/ T h e F u t u r e o f O u r P r o p e r t y B u s i n e s s
25
Copyright © MIRARTH HOLDINGS Group. ALL RIGHTS RESERVED.
中期経営計画重要経営指標
2027年3月期
目標
参考
2026年3月期
自 己 資 本 比 率
20.0%23%以上
LTV
63.9%65%未満
D/Eレシオ
3.0倍3.0倍未満
ROE
5.7%9%以上
株主還元配当性向
60.0%35~40%
配当金
中間:5円
期末:16円
中間:11円
期末:12円
EPS・BPSの向上×財務の健全性
=持続的な時価総額・株価の向上
株主還元の抜本的強化
株主還元策の抜本的強化/ 中期経営計画重要経営指標
約40億円規模
2027年3月期総還元額(予定)
配当性向35-40%のいずれか高
い方を適用。下方硬直的かつ累進
的な配当構造による「予見可能
性」の圧倒的向上。
DOE3.5%導入(新規)
2026年4月1日から4月17日ま
での期間で約10億円の自己株式
の取得を実施。取得した株式は消
却を予定。
約10年ぶりの自己株式取得
EPS・BPSの向上×財務の健全性=
持続的な時価総額・株価の向上
積極的な還元
(資本の還元)
厳格なKPI
(資本の蓄積・効率化)
・配当性向47.9%→6
0.0%
•安定的な株主還元を実現するための新たな指標として「DOE」を導入し、自己株式取得を組み合わせた約40億円規模
の総還元を実施。
26
Copyright © MIRARTH HOLDINGS Group. ALL RIGHTS RESERVED.
新築戸建分譲リニューアル再販
次世代事業成長牽引事業
基盤事業課題事業
市
場
成
長
性
アセット
マネジメント事業
収益力
不動産事業
エネルギー事業
カシュー事業
※エネルギー事業から分離
基盤事業としての成長限界の拡張
市場トレンド分野(都心戸建・リニューアル再販)への投資強化
フロー事業の強化で狙う、フィービジネスの成長
総合デベロッパーの強みを最大限に発揮
不動産事業の更なる成長
エネルギー事業とカシュー事業のセグメント分割
不動産セグメント
事業ポートフォリオにおける各セグメントの位置づけ
営業利益
2025年3月期実績
2030年度に向けた
成長イメージ
本中計期間の
成長イメージ
70%
15%
15%
92%
2%
6%
80%
11%
9%
営業利益
13,130百万円
WACC
成長戦略の再定義事業ポートフォリオ
事業環境の不確実性は高まっているが、電力需要は今後も増加する見通し
バランスシートの肥大を抑制しつつ、新たな収益獲得機会への厳選投資
カシュー事業は次世代事業と位置づけ、ビジネスモデルの確立を目指す
•Phase3への移行をより確実なものにするため、セグメント別の成長戦略を軌道修正。
・フォントサイズ16→18
27
Copyright © MIRARTH HOLDINGS Group. ALL RIGHTS RESERVED.
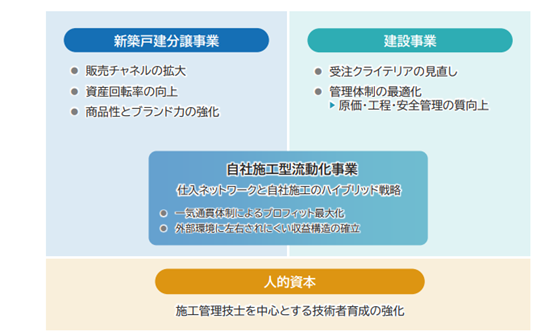
成長戦略の再定義新築戸建分譲事業・建設事業/リニューアル再販事業
施工管理技士を中心とする技術者育成の強化
人的資本
⚫販売チャネルの拡大
⚫資産回転率の向上
⚫商品性とブランド力の強化
新築戸建分譲事業
⚫受注クライテリアの見直し
⚫管理体制の最適化
原価・工程・安全管理の質向上
建設事業
2030年度の成長イメージ
不動産事業セグメントに占める営業利益シェア15%
新築戸建分譲・建設成長戦略
自社施工型流動化事業
仕入ネットワークと自社施工のハイブリッド戦略
⚫一気通貫体制によるプロフィット最大化
⚫外部環境に左右されにくい収益構造の確立
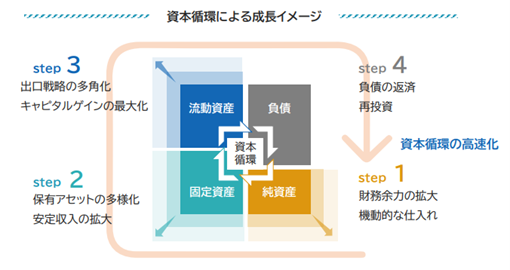
⚫増資により財務余力の拡大を図りつつ、優良案件の機動的な仕入を実施
⚫保有アセットの多様化とストックの積み上げを推進、棚卸高回転モデルを確立
⚫出口戦略の多角化によるキャピタルゲインの最大化、再投資による資本循環の高速化
資本循環による成長イメージ
固定資産純資産
流動資産負債
資本
循環
保有アセットの多様化
安定収入の拡大
出口戦略の多角化
キャピタルゲインの最大化
財務余力の拡大
機動的な仕入れ
step
負債の返済
再投資
1
3
2
4
step
step
step
資本循環の高速化
2030年度の成長イメージ
不動産事業セグメントに占める営業利益シェア15%
リニューアル再販成長プロセス
•新たなエリア戦略とハイブリッド業態の強みを活かし、不動産事業の限界収益拡大へ。
•ストック・フローの両輪収益モデルを強化し、拡大する住宅ストックへの付加価値創出で社会的使命を果たす。
・フォントサイズ16→18
28
Copyright © MIRARTH HOLDINGS Group. ALL RIGHTS RESERVED.
成長戦略の再定義新築分譲マンション事業/流動化事業
新築分譲マンション成長戦略流動化成長戦略
•人口100万人以上の都市の中心部
•通勤30~45分圏の城西・城北・城東エリア
•アッパーミドル層
金利上昇による調達コストの上昇
建設費の上昇
バランスシートの肥大化
工期の長期化
課題認識
×DX
•BSコントロールの徹底
•成長投資と財務健全性の両立
•収益性と効率性の向上
新会計システムの導入
資本効率と生産性の向上
ラグゼナプラスOTO 南千住
全戸防音ルーム設備付きのマンション
人口100万人都市
資金調達と出口の多様化
投資ターゲットの選別
コンセプト設定による付加価値の創出
アセットライト戦略の推進
ターゲット層を再定義
•建設費・金利上昇等の環境変化に対し、エリア選別による収益性確保と、出口の多様化およびDX推進による資産
回転率の向上を両立し、資本効率に優れた成長モデルを構築する。
・フォントサイズ16→18
Appendix
04
a p p e n d i x
30
Copyright © MIRARTH HOLDINGS Group. ALL RIGHTS RESERVED.
当社グループは、三位一体の戦略を基軸にサステナビリティ経営を実現させ、持続的な成長と
中長期的な企業価値の向上を目指す
⚫ROE/ROIC等資本効率を
意識した経営
⚫事業ポートフォリオの進化
成長構造の変革
⚫2030年までの
長期ビジョンの発信
⚫ステークホルダーへの
価値の創造と提供
⚫IR活動の質的向上
パーパス経営の実践
⚫ESGを基軸とした事業への落とし込み
ESG経営の推進
資本コストや株価を意識した経営の実現に向けて
31
Copyright © MIRARTH HOLDINGS Group. ALL RIGHTS RESERVED.
当社グループの2030年までの長期ビジョンを策定
サステナブルな環境をデザインする力で、
人と地球の未来を幸せにする。
Our Purpose
2030年
長期ビジョン
不動産デベロッパーには、どんなミライがあるのか。
現場で鍛えたチカラは地域社会の価値になるのか。
ミラースは2030年に向け、自らを改革し答えを出す。
フロー型をストック循環型へつなぎ、私たちはモデルを進化させる。
不動産を街・地域・環境へつなぎ、私たちはドメインを拡張する。
不動産収益を社会価値へつなぎ、私たちはバリューを再定義する。
ミラースは各地域に根ざした「らしさ」を徹底的に学び、
「点」の開発を「線」でつなぎ、「面」の活性化を推進することで、
地域社会にとってタカラのような存在になる。
地域を元気に、日本を元気に、そして世界を元気にする。
事業展開エリアで「地域活性に資する循環型ビジネスモデル」を創出する
地域社会のタカラであれ。
不動産
事業
その他
事業
エネルギー
事業
アセット
マネジメント
事業
2030年までに目指す姿
32
Copyright © MIRARTH HOLDINGS Group. ALL RIGHTS RESERVED.
やりがいのある職場環境の構築
⚫多様性のある組織、職場環境の構築
⚫グループタレントマネジメントの推進
⚫地域採用の強化
⚫柔軟な働き方、環境の更なる推進
人材の育成
⚫サクセッションプランの推進
⚫戦略的ジョブローテーションの推進
⚫階層別研修制度の更なる充実
⚫コーポレート・ガバナンスの強化
⚫リスクマネジメントの強化
⚫企業倫理、コンプライアンスの徹底
ESG及び非財務戦略
⚫地域社会の持続的な成長の実現
⚫少子高齢化、労働人口減少への対応
⚫従業員の健康と安全の確保
⚫DE&Iの推進
⚫人権の尊重、サプライチェーンへの対応
⚫気候変動・脱炭素化への対応
⚫再生可能エネルギーの安定供給と利用促進
E
S
G
HR
前掲経営計画のアップデートを踏まえ、以下の戦略を重点施策としてその推進を強化
グループ全体のリスクマネジメント機能をアップデート
その推進体制を強化し、一層のリスクの極小化とリターンの最大化を図る
成長牽引事業に人的資本を積極的に投下するとともに、
グループ人材の科学的な把握と積極的な配置政策を推進
人的資本の更なる強化と配置の最適化
環境
社会
ガバナンス
人材戦略
リスクマネジメントの強化
①リスクマネジメント委員会の対応強化
個別案件に対する諮問基準を策定し、事業推進リスクをコントロール
②リスクマネジメントと経営戦略の結合推進
リスクアペタイト・フレームワーク(RAF)を導入し、事業ポートフォリオの適正化を推進
③組織・人事の改革
内部統制管理部門を新設し、第2線の機能を強化
ボードメンバー(取締役) からCROを選任し、経営中核にてその機能を発揮できる体制を構築
①タレントマネジメントシステムを最大活用したグループ人材適性の把握
②研修制度と連動したアセスメントの導入による人材育成の加速
③専門人材の積極登用
33
Copyright © MIRARTH HOLDINGS Group. ALL RIGHTS RESERVED.
5,114戸
3,561戸
マンションエリア戦略と実績(用地取得状況)
ランドバンク
全国合計8,675戸
(JV含む)
Phase2
(2027年3月期~2028年3月期)
首都圏
1
25.3%
中部圏
2
5.9%
近畿圏
3
15.0%
北海道圏
4
12.7%
東北圏
5
12.6%
関東甲信越圏
6
1.8%
北陸圏
7
6.7%
中国圏
8
5.7%
四国圏
9
4.3%
九州圏
10
9.9%
大都市圏比率
46.2%
※大都市圏:首都圏・中部圏・近畿圏
※2026年3月末時点
タカラレーベンの営業拠点
既供給・仕入済エリア
全国40都道府県に進出済み
本中計期間中の新築分譲マンション用地として5,114戸を確保済み
全国で安定的な供給を実現するとともに、市場をけん引する大都市圏比率も46.2%をキープ
(大都市圏比率: 44.5%)
1
2
3
4
5
6
7
8
9
10
5,114戸
レーベン小田原SKYSTHETOWER (共同事業総戸数286戸)仙台THE GRAND SKY (共同事業総戸数476戸)
34
Copyright © MIRARTH HOLDINGS Group. ALL RIGHTS RESERVED.
再開発事業の進展
事業名称所在地引渡時期
川越南台建替事業埼玉県川越市
2019年3月
松が谷マンション建替事業東京都八王子市2018年3月
小田原駅前分譲共同ビルマンション建替事業
(優良建築物等整備事業)
神奈川県小田原市2024年6月
南小岩六丁目地区第一種市街地再開発事業東京都江戸川区2026年3月
川口元郷1丁目2番地区優良建築物等整備事業埼玉県川口市2026年3月
浦和駅西口南高砂地区第一種市街地再開発事業埼玉県さいたま市2026年10月(予定)
町方町・通横町第一地区第一種市街地再開発事業静岡県沼津市2028年11月(予定)
小田原市栄町二丁目中央地区
優良建築物等整備事業
神奈川県小田原市
2028年3月(予定)
甲府市丸の内一丁目地区優良建築物等整備事業山梨県甲府市2028年度(予定)
事業名称所在地引渡時期
中央通りf地区第一種市街地再開発事業
富山県富山市2012年3月
桜町一丁4番目地区第一種市街地再開発事業
富山県富山市2018年6月
末広西地区暮らし・にぎわい再生事業
富山県高岡市2019年3月
中央通三丁目地区優良建築物等整備事業
岩手県盛岡市2020年8月
新浜町地区優良建築物等整備事業
福島県福島市2022年2月
大崎市古川七日町西地区第一種市街地再開発事業
宮城県大崎市2022年3月
新町一丁目地区優良建築物等整備事業
青森県青森市2023年3月
細沼町地区地域生活拠点型再開発事業
福島県郡山市2023年7月
高岡駅前東地区優良建築物等整備事業
富山県高岡市2023年11月
福井駅前電車通り北地区B街区
第一種市街地再開発事業
福井県福井市2026年2月
千秋久保田町地区優良建築物等整備事業秋田県秋田市2026年3月
函館駅前東地区第一種市街地再開発事業北海道函館市2029年7月(予定)
中心市街地活性化基本計画の第1号認定を受けた富山市における再開発事業を皮切りに、
全国の第一種市街地再開発事業や優良建築物等整備事業、マンション建替事業へ参画
関東・中部エリア
南小岩六丁目地区第一種市街地再開発事業
川越南台建替事業
小田原駅前分譲共同ビルマンション建替事業
北海道・東北・北陸エリア
・フォントサイズ統一
35
Copyright © MIRARTH HOLDINGS Group. ALL RIGHTS RESERVED.
海外事業の進展
東南アジア諸国を当面のターゲットとし、ベトナム・タイでのコンドミニアム開発に加え、
フィリピンでの戸建開発を展開
プロジェクト名称事業所在地総戸数竣工時期
ベトナム
THE MINATO RESIDENCE CT2(南棟)コンドミニアムハイフォン市462戸2021年12月
THE MINATO RESIDENCE CT1(北棟)
コンドミニアム
ハイフォン市462戸2024年2月
タイ
Atmoz Flow Minburi
コンドミニアム
バンコク市739戸2023年11月
Modiz Vault Kaset Sripatum
コンドミニアム
バンコク市
798戸
(商業店舗11区画含む)
2026年6月
Malton Reserve Pinklao-Kanchana
戸建バンコク市
25 戸
2026年7月
フィリピン
SAVANA SOUTH
戸建ラグナ州サンパブロ市657戸2024年12月
Sentro
戸建ラグナ州サンパブロ市758 戸2025年10月
ANARA
戸建ブラカン州バリワグ市268戸2026年12月
37%
46%
17%
ベトナムタイフィリピン
Modiz Vault Kaset
Sripatum
総事業費
(当社持分)
約180億
Sentro
36
Copyright © MIRARTH HOLDINGS Group. ALL RIGHTS RESERVED.
56,813
11,824
69,192
2,057
開発既存土地など
2026年
3月末簿価
83,074
百万円
流動化事業資産規模
2,057 2,057
44,524
78,208
14,255
14,255
11,130
17,164
11,107
16,378
0
20,000
40,000
60,000
80,000
100,000
120,000
140,000
2026年3月末簿価完成簿価
土地などレジデンスオフィスホテル商業・物流
83,074
128,063
既存・開発
流動化事業資産規模
アセット別資産推移
0
5,000
10,000
15,000
50期4Q51期4Q52期4Q53期4Q54期4Q
完成前完成後
※販売用不動産に計上されている流動化資産を含む
完成後簿価
128,063
百万円
0
20,000
40,000
60,000
80,000
100,000
50期4Q51期4Q52期4Q53期4Q54期2Q
完成前完成後
(百万円)
0
10,000
20,000
30,000
40,000
50期4Q51期4Q52期4Q53期4Q54期4Q
完成前完成後
(百万円)
0
5,000
10,000
15,000
50期4Q51期4Q52期4Q53期4Q54期4Q
完成後完成前
(百万円)
(百万円)
(百万円)
開発案件の進捗により資産規模は830億円から1,280億円へ拡大
更新済み
37
Copyright © MIRARTH HOLDINGS Group. ALL RIGHTS RESERVED.
資産運用規模
2026年3月末には、再エネ・REIT・私募にて3,390億円を運用
※取得価格ベースにて集計(再エネは2022年11月11日付で成立したTOBによる影響を考慮しております)
738
800
1,930
2,400
722
1,600
2017年3月末2018年3月末2019年3月末2020年3月末2021年3月末2022年3月末2023年3月末2024年3月末2025年3月末2026年3月2028年3月末2031年3月末
再エネ
REIT
私募
3,390
7,000
83
230
980
1,486
1,619
2,099
2,494
2,665
4,800
37%
27%
16%
20%
レジデンス
オフィス
ホテル
商業施設・その他
(億円)
3,113
38
Copyright © MIRARTH HOLDINGS Group. ALL RIGHTS RESERVED.
(百万円)
2024年3月末2025年3月末2026年3月末
販売用資産
47,44653,61772,354
新築分譲マンション
6,5137,10514,286
流動化
23,81830,40631,909
新築戸建
3,0762,2772,096
リニューアル再販
13,97213,76223,104
発電施設
6565956
(百万円)
2024年3月末2025年3月末2026年3月末
流動化資産
57,58565,39883,074
レジデンス
21,67031,93544,524
オフィス
22,60821,95614,255
ホテル
4,8723,44911,130
商業・物流
5,7595,47211,107
土地など
2,6742,5852,057
仕掛販売用資産
76,59892,72996,702
新築分譲マンション
69,75584,72983,764
流動化
492131684
新築戸建
5,6867,80612,010
リニューアル再販
663798
発電施設
―55144
有形固定資産
117,759127,201134,019
新築分譲マンション
403428
流動化
33,27434,86050,480
発電施設
82,94090,36881,560
その他
1,5041,9381,950
借入金・社債
210,212226,780268,077
新築分譲マンション
55,21466,52976,531
流動化
36,56740,82155,931
新築戸建
7,0128,17212,494
リニューアル再販
11,93610,31718,186
発電施設
76,91272,74866,987
資産に紐づかない
借入金・社債
22,57028,19137,946
連結貸借対照表(推移)
・23,104→31,909
39
Copyright © MIRARTH HOLDINGS Group. ALL RIGHTS RESERVED.
198219881994200120042012201320162022201820171972
株
式
会
社
宝
工
務
店
を
設
立
•
戸
建
分
譲
事
業
中
古
再
販
事
業
を
開
始
持
株
会
社
化
に
よ
る
商
号
変
更
創
業
50
周
年
タ
カ
ラ
レ
ー
ベ
ン
不
動
産
投
資
法
人
が
上
場
ベ
ト
ナ
ム
ハ
ノ
イ
駐
在
員
事
務
所
を
設
立
新
マ
ン
シ
ョ
ン
ブ
ラ
ン
ド
「
N
E
B
E
L
」
を
発
表
タ
カ
ラ
レ
ー
ベ
ン
・
イ
ン
フ
ラ
投
資
法
人
が
イ
ン
フ
ラ
フ
ァ
ン
ド
市
場
に
第
一
号
上
場
第
一
号
案
件
レ
ー
ベ
ン
ソ
ー
ラ
ー
塩
谷
発
電
所
の
稼
働
開
始
•
発
電
事
業
を
開
始
新
マ
ン
シ
ョ
ン
ブ
ラ
ン
ド
「
L
E
B
E
N
」
「
T
H
E
L
E
B
E
N
」
を
発
表
東
京
証
券
取
引
所
市
場
第
一
部
上
場
J
A
S
D
A
Q
上
場
自
社
分
譲
マ
ン
シ
ョ
ン
「
レ
ー
ベ
ン
ハ
イ
ム
」
シ
リ
ー
ズ
を
発
表
•
分
譲
マ
ン
シ
ョ
ン
事
業
を
開
始
(株)
レ
ー
ベ
ン
コ
ミ
ュ
ニ
テ
ィ
を
設
立
•
不
動
産
管
理
事
業
を
開
始
•
不
動
産
賃
貸
事
業
を
開
始
1
9
7
2
年
に
戸
建
分
譲
事
業
か
ら
始
ま
り
、
分
譲
マ
ン
シ
ョ
ン
事
業
を
機
軸
に
事
業
を
展
開
2023
「
タ
カ
ラ
レ
ー
ベ
ン
・
イ
ン
フ
ラ
投
資
法
人
」
を
株
式
公
開
買
付
に
よ
り
上
場
廃
止
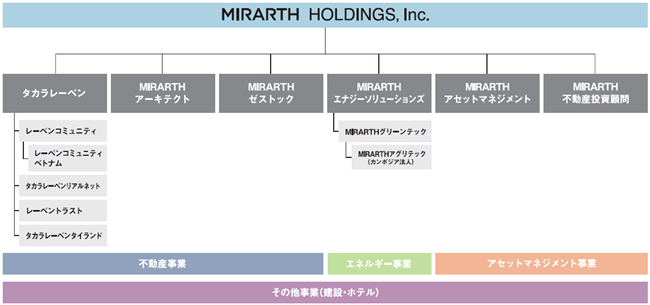
タカラレーベンリアルネットMIRARTHエナジーソリューションズ
レーベンゼストック
MIRARTHアセットマネジメント
MIRARTH不動産投資顧問
レーベンホームビルド
タカラレーベンMIRARTH Agri Tech
レーベンコミュニティ
MIRARTHグリーンテック
MIRARTHホールディングスグループのあゆみ
Takara Leben(Thailand)レーベントラスト
40
Copyright © MIRARTH HOLDINGS Group. ALL RIGHTS RESERVED.
社名
MIRARTHホールディングス株式会社
代表者
代表取締役島田和一
所在地
〒100-0005
東京都千代田区丸の内1-8-2
鉃鋼ビルディング16階
設立
1972年9月21日
資本金
9,056百万円
上場市場
東京証券取引所プライム市場
(証券コード:8897)
従業員数
1,475名
(連結)※ 2026年3月末現在
事業内容
グループ会社の経営管理等
社名
株式会社タカラレーベン
代表者
代表取締役秋澤昭一
所在地
〒100-0005
東京都千代田区丸の内1-8-2
設立
1989年8月29日
資本金
400百万円
従業員数
503名※ 2026年3月末現在
事業内容
新築分譲マンションの企画・開発並びに販売、不
動産流動化事業、賃貸事業、流通事業
会社概要
本資料の取扱いについて
本資料は、情報提供を目的としたものであり、特定の商品についての募集・勧誘・営業等を
目的としたものではありません。本資料の内容には将来の計画及び予測等を含んでおりま
す。これらは、資料作成時点の当社の判断であり、その実現および達成を保証、約束するも
のではなく、また、その情報の正確性、完全性を保証し又は約束するものではありません。
なお、今後、新しい情報や将来の出来事等があった場合であっても、当社は本資料に含ま
れる情報の更新・修正を行う義務を負うものではありません。
MIRARTHホールディングス株式会社IR室
E-mail: [email protected]