Financial Results and Business Highlights for Summary of 2Q, FY2026 November 2026 https://www.mitsuifudosan.co.jp/english/corporate/ir/ 1 目次/Contents 1.ハイライト Highlights 2.経営方針 Management Policy 本資料における掲載データの時点表記…
Financial Results and Business Highlights
for Summary of 2Q, FY2026
November 2026
https://www.mitsuifudosan.co.jp/english/corporate/ir/
1
目次/Contents
1.ハイライト
Highlights
2.経営方針
Management Policy
本資料における掲載データの時点表記
Reference Dates for Data in This Document
P.3
2026年9月末時点(ただし、個別データに表記のある場合を除く)
As of Sep. 30, 2026(Except for the case of specific notation on each page)
P.6
免責事項
Disclaimer
✓ グループ概要・⾧期経営方針/Mitsui Fudosan Group Overview and Long-Term Vision
(資本政策・成⾧投資とポートフォリオ・資金調達状況/Capital Policy, Growth Investment
and Portfolio, and Financial Situation)
3.事業状況
Business Situation
本資料には、将来の業績見通し、開発計画、計画目標等に関する記述が含まれています。
こうした記述は、本資料作成時点で入手可能な情報、および不確実性のある要因に関する一定の
主観的な仮定に基づき当社が判断した予想であり、潜在的なリスクや不確実性を内包するほか、
記述通りに将来実現するとの保証はありません。
経済情勢、市場動向、経営環境の変化などにより、実際の結果は本資料にある予想と異なる
可能性があることにご留意ください。
また、本資料の内容については細心の注意を払っておりますが、本資料に関する全ての事項について、
新規性、正当性、有用性、特定目的への適合性、機能性、安全性に関し、一切の保証をいたしか
ねますのでご了承ください。
また、本資料は投資勧誘を目的としたものではありません。
投資に関する決定は、ご利用者自身の判断においておこなわれるようお願い申し上げます。
P.25
✓ 三井不動産の主なアセットクラス/Mitsui Fudosan Group Main Asset Classes
✓ オフィス/Office
✓ シェアオフィス/Shared Office
✓ ライフサイエンス事業/Life Science Business
✓ 商業施設/Retail Facilities
✓ 物流施設・データセンター/Logistics Facilities・Data Centers
✓ 国内住宅分譲/Residential Property Sales to Individuals (Domestic)
✓ 投資家向け分譲等/Property Sales to Investors, etc.
✓ プロパティマネジメント/Property Management
✓ 仲介・アセットマネジメント/Brokerage, Asset Management
✓ ホテルリゾート/Hotels and Resorts
✓ スポーツ・エンターテインメント/Sports & Entertainment
✓ 海外事業/Overseas Business
4.サステナビリティへの取り組み
Sustainability Initiatives
5.決算・企業情報等
Financial Results and Corporate Information, etc.
This presentation contains forward-looking statements including details
regarding the Company’s business results forecasts, development plans, and
targets. All forward-looking statements are based on judgments derived from
the information available to the Company at the time this presentation was
issued, and are subject to a variety of risks and uncertainties.
As a result, actual results may differ materially from the Company’s forecasts
due to a number of factors including changes in economic conditions, market
trends, and shifts in the operating environment.
Although we exercised all due care in the preparation of this presentation, we
assume no obligation to update, revise, or correct any of the statements and do
not attest to or guarantee their usefulness, suitability for a specific purpose,
functionality, or reliability.
P.52
Moreover, this presentation is not intended to solicit investment of any kind.
Investment decisions should be based solely on the judgments of investors.
P.62
✓ 決算実績/Financial Results
✓ 企業データ・事業データ/Corporate and Business Data
✓ 主な当社稼働物件一覧/List of Major Properties in Operation
✓ マーケット動向/Market Trends
MITSUI FUDOSAN CO., LTD.
2
決算ハイライト:2027年3月期第2四半期(中間期)決算サマリー
1 ハイライト
Highlights
Financial Highlights : Summary of 2Q, FY2026 Financial Results
■第2四半期決算ハイライト / Second Quarter Financial Highlights
Although revenue from operations, business income, ordinary income, and net income1 decreased year on year, mainly due to the absence of gains from property sales recorded in the same period of the previous fiscal year,
revenue from operations, business income, and net income1 remained at their second-highest levels, following the record highs achieved in the same period of the previous fiscal year.
Segment business income from Leasing and Facility Operations reached record highs for the first half of the fiscal year.
Office
"Leasing": Business income increased ¥10.9 billion year on year to ¥99.5 billion, driven by growth in revenue and income from office properties in Japan
and overseas, as well as higher sales at retail facilities in Japan and overseas. (Progress toward full-year forecast of ¥180.0 billion: 55.3%)
Our vacancy rate
in the Tokyo metropolitan area
"Property Sales": Business income decreased ¥27.5 billion year on year to ¥96.7 billion, mainly reflecting the absence of property sales recorded
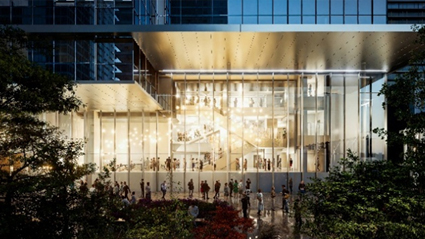
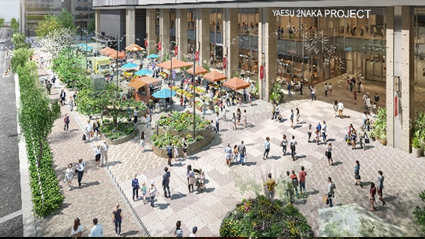
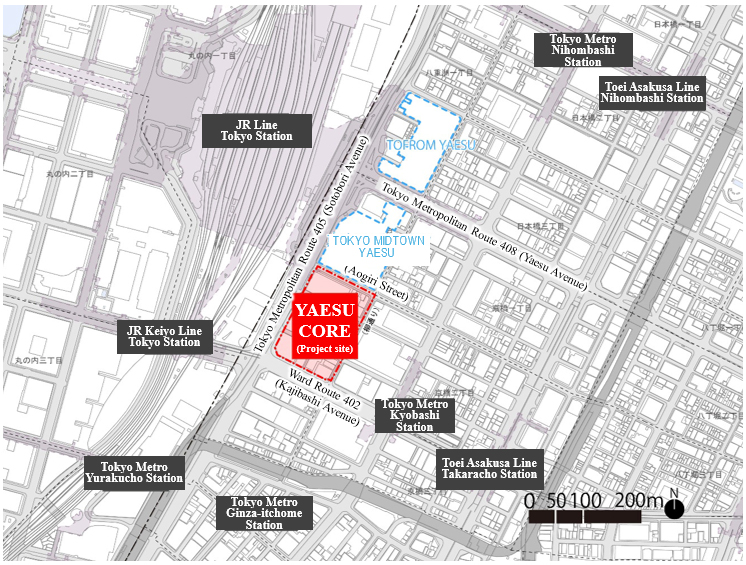
in the same period of the previous fiscal year, despite the partial sale of the Company's ownership interest in YAESU CORE, which was classified as a fixed asset.
(Progress toward full-year forecast of ¥210.0 billion: 46.1%)
"Management": Business income decreased ¥0.2 billion year on year to ¥38.3 billion, mainly due to the absence of a one-time management fee recorded
in the same period of the previous fiscal year, despite an increase in the number of property management contracts and growth in both transaction volume
and average transaction value at Rehouse (residential brokerage). (Progress toward full-year forecast of ¥75.0 billion: 51.1%)
Management
Number of
Contract Progress Rate
brokerage transactions
0.8%
93%
+1.6%
As of Jun. 30, 2026 : 0.9%
2,350 units planned in FY2026
YoY Comparison
Retail facilities
Property Sales to
to investors
Domestic
lodging-focused hotels
YoY in Domestic Facility Revenue
Contract Progress Rate
ADR
Approx.
"Facility Operations": Business income increased ¥0.7 billion year on year to ¥24.0 billion, driven by higher ADR at domestic and overseas hotels,
as well as growth in revenue and income at Tokyo Dome. (Progress toward full-year forecast of ¥45.0 billion: 53.5%)
Property Sales to
individuals (Domestic)
+6%
Approx.
90%
Approx.
Comparison based on
+6%
YoY Comparison
existing domestic properties
The Company decided to pay an interim dividend of ¥18.5 per share, as announced at the beginning of the fiscal year, and approved an additional ¥20.0 billion in share repurchases.
Together with the ¥40.0 billion in share repurchases already completed, total share repurchases for the fiscal year will amount to ¥60.0 billion, bringing the projected total shareholder return ratio to 56.0%.
*1 Profit attributable to owners of the parent
(十億円/Billions of Yen)
当第2四半期実績(A)
2Q, FY2026 Results(A)
前年同期実績(B)
2Q, FY2025 Results(B)
2026.4.1-2026.9.30
2025.4.1-2025.9.30
営業収益
Revenue from operations
営業利益
Operating Income
事業利益
Business Income
賃貸
Leasing
Record
High
分譲
Property Sales
国内
/to individuals
*2
投資家
/to investors*2
マネジメント
Management
施設営業
Facility Operations
その他
Other
消去他
Elimination or Corporate
経常利益
Ordinary Income
親会社株主に帰属する中間純利益
Profit attributable to owners of parent
Record
High
増減(率)
Change(Rate)
(A)-(B)
(A)/(B)-1
進捗率
Progress(Rate)
2026.4.1-2027.3.31
(A)/(C)
■Progress in reducing strategic shareholdings
1,215.4
1,353.4
-137.9
-10.2%
2,800.0
43.4%
176.1
218.7
-42.6
-19.5%
410.0
43.0%
224.7
246.4
-21.6
-8.8%
450.0
50.0%
99.5
88.5
+10.9
+12.4%
180.0
55.3%
96.7
124.2
-27.5
-22.1%
210.0
46.1%
42.5
87.5
-44.9
-51.4%
65.0
65.4%
54.2
36.7
+17.4
+47.6%
145.0
37.4%
38.3
38.5
-0.2
-0.5%
75.0
51.1%
24.0
23.3
+0.7
+3.1%
45.0
53.5%
1.5
2.0
-0.4
-22.3%
10.0
15.6%
-35.4
-30.3
-5.1
–
-70.0
–
137.0
183.5
-46.5
-25.3%
315.0
43.5%
139.1
152.1
-12.9
-8.5%
285.0
48.8%
*2:投資家向け・海外住宅分譲等 to investors and individuals (Overseas),etc.
MITSUI FUDOSAN CO.,LTD.
2027年3月期通期予想(C)
FY2026 Forecast (C)
3
FY2025
Results
FY2026
Forecast
FY2026
2Q Results
Cumulative
reduction of
around 40%
Cumulative
reduction of
50% or higher
Cumulative
reduction of
50%
■Shareholder Returns
Share
Repurchases
Annual
Dividend
per Share
Total Payout
Ratio
¥20.0 billion(planned)
Repurchase Period: Nov. 9, 2026 – Oct. 31, 2027
(Total of ¥60.0 billion, including
¥40.0 billion already repurchased)
¥37.0(planned)
Interim: ¥18.5 / Year-end: ¥18.5
(Unchanged from the initial forecast)
56.0% (planned)
決算ハイライト:2027年3月期第2四半期(中間期)決算実績
1 ハイライト
Highlights
Financial Highlights:Summary of 2Q, FY2026 Financial Results
単位:十億円
Billions of Yen
2027年3月期 2Q実績
2Q, FY2026 Results
2026年3月期 2Q実績
2Q, FY2025 Results
(A)
(B)
前年同期比 / Y on Y
増減 / Change
増減率 / Rate
(A)-(B)
(A)/(B)-1
2027年3月期通期予想
FY2026 Forecast
進捗率
Progress Rate
(C)
(A)/(C)
1,215.4
1,353.4
-137.9
-10.2%
2,800.0
43.4%
176.1
218.7
-42.6
-19.5%
410.0
43.0%
-39.0
-35.1
-3.8
-95.0
41.1%
-38.5
-37.0
-1.5
-85.0
45.4%
-0.4
1.8
-2.3
-10.0
137.0
183.5
-46.5
85.9
67.0
+18.8
–
-16.6
+16.6
-83.8
-81.8
-2.0
親会社株主に帰属する中間純利益
Profit attributable to owners of parent
139.1
152.1
-12.9
-8.5%
285.0
48.8%
事業利益
Business Income
224.7
246.4
-21.6
-8.8%
450.0
50.0%
営業利益
Operating Income
176.1
218.7
-42.6
-19.5%
持分法投資損益
Equity in Net Income/Loss of Affiliated Companies
0.2
1.1
-0.9
-83.0%
48.4
26.5
21.9
+82.8%
営業収益
Revenue from Operations
営業利益
Operating Income
営業外損益
Non-operating Income / Expenses
純金利負担
Interest Income / Expenses, in Net
その他
Other, in Net
経常利益
Ordinary Income
特別利益
Extraordinary Income
特別損失
Extraordinary Loss
法人税等ほか
Income Taxes and the others
●
固定資産売却損益 Gain / Loss on Sales of Fixed Assets
MITSUI FUDOSAN CO.,LTD.
4
-25.3%
315.0
43.5%
105.0
81.8%
-135.0
決算ハイライト:連結業績予想(2026年5月13日公表)
Financial Highlights : Consolidated Statements of Earnings Forecast (Announced : May 13, 2026)
1 ハイライト
Highlights
Consolidated financial results are expected to reflect growth in leasing income driven by upward rent revisions for domestic and overseas offices and increased revenue at domestic and overseas
retail facilities, as well as growth in income from property sales through accelerated asset turnover achieved by treating real property for sale and fixed assets on an integrated basis. As a result,
revenue from operations, operating income, business income, ordinary income, and net income attributable to shareholders of the Company are all expected to reach record highs.
*1:Projected new record highs: 15th consecutive year for revenue from operations; 3rd consecutive year for business income; and 5th consecutive year for operating income, ordinary income and net profit.
過去最高
2027年3月期
通期予想
2026年3月期
通期実績
(2026/5/13公表)
FY2026 Forecast
Affiliated
2,800.0
2,709.7
+90.2
+3.3%
410.0
397.7
+12.2
+3.1%
-95.0
-84.4
-10.5
-85.0
-10.0
-73.4
-10.9
-11.5
Ordinary Income
315.0
313.3
+1.6
特別損益
Extraordinary Income/Loss
Income Taxes and the others
83.6
-118.3
+21.3
法人税等ほか
105.0
-135.0
285.0
278.6
+6.3
+2.3%
450.0
❶ 180.0
❷ 210.0
445.1
177.0
193.1
+4.8
+1.1%
+2.9
+1.7%
to the impact caused by one-time management fees, etc. recorded in
+16.8
+8.7%
the current fiscal year.
112.0
81.1
-47.0
+63.8
-42.0%
+78.6%
80.8
46.3
10.1
-62.4
-5.8
-7.3%
-1.3
-2.9%
robust demand at hotels and resorts, the segment is expected to
-0.1
-1.7%
remain revenue from operations and business income at roughly the
-7.5
+12.0%
Revenue from Operations
営業利益
Operating Income
Non-operating Income/Expenses
その他
経常利益
Other, in Net
Companies
Gain (Loss) on
Sale of Fixed
Assets
and leasing properties in the U.S.A. increased, the segment is expected
(B)
営業収益
固定資産売却損益
(A)/(B)-1
Although the expenses associated with completion of domestic offices
(A)
純金利負担 Interest Income/Expense, in Net
Income (Loss) of
(A)-(B)
❶ "Leasing" segment
FY2025 Result
営業外損益
Equity in Net
増減率
Rate of
Change
(As of May 13, 2026)
(単位:十億円)
(Billions of Yen)
持分法投資損益
増減
Change
親会社株主に帰属する当期純利益
Profit attributable to owners of parent
事業利益
Business Income
賃貸
Leasing
分譲
Property Sales
国内
投資家
65.0
145.0
/to individuals(Domestic)
*2
/to investors*2
マネジメント Management
施設営業
Facility Operations
その他
Other
消去他
Elimination or Corporate
❸
❹
75.0
45.0
10.0
-70.0
rent revisions for domestic offices and increases in revenue at domestic
and overseas retail facilities.
❷ "Property Sales" segment
Although there is an impact caused by sale of centrally located, high-
+0.9
priced and large-scale properties in residential property sales to
+0.5%
individuals (domestic) recorded in the current fiscal year, the segment
is expected to record an increase in revenue and business income due
to the accelerated asset turnover achieved by treating real property for
-16.6
sale and fixed assets on an integrated basis in property sales to
investors and residential property sales to individuals (overseas), etc.
*2:投資家向け・海外住宅分譲等 to investors and individuals (Overseas),etc.
MITSUI FUDOSAN CO., LTD.
to record an increase in revenue and business income due to upward
5
❸ "Management" segment
The segment is expected to record a decrease in business income due
❹ "Facility Operations" segment
Although further expansion of revenue and income is supported by
same level as the current fiscal year, due to anticipated increases in
costs associated with the completion of new large-scale properties.
経営方針
2 Management
Policy
三井不動産グループの資産と収益(2026年3月期)
Assets and Revenues of the Mitsui Fudosan Group(FY2025)
三井不動産グループの資産
収益構造
Assets of the Mitsui Fudosan Group
Revenue Structure
約10.1兆円
● 連結総資産
Total Consolidated Assets
Approx.¥10.1 trillion
● 有形・無形固定資産
(うち、賃貸等不動産3.7兆円)
Tangible and Intangible Fixed Assets
(Including Approx. ¥3.7 trillion in rental property)
● 販売用不動産
(うち投資家向け約1.8兆円、個人向け約0.7兆円)
Real Property for Sale
約4.6兆円
Approx.¥4.6 trillion
スポーツ・エンタメ
New
Sports&
Construction
Entertainment
under
2%
Consignment
Hotels & Resorts
7%
5%
Approx.¥4.6 trillion
46%
約2.8 兆円
Other
Facility
11%
9%
マネジメント
約2.7兆円
Retail Leasing
12%
Revenue from Operations
その他賃貸
PM
販売用不動産
約2.6 兆円
26%
Others
商業賃貸
34%
分譲
Other Leasing
Property Sales
4%
27%
Total Assets
Approx.¥10.1 trillion
Approx.¥2.8 trillion
28%
賃貸
Leasing
連結営業収益
総資産
28%
MITSUI FUDOSAN CO., LTD.
施設営業
14%
約10.1兆円
その他資産
その他
Management Approx. ¥2.7 trillion
19%
Tangible and Intangible Fixed Assets
46%
ビル賃貸
Office Leasing
Operations
AM,Brokerage
約4.6 兆円
2%
18%
ホテル・リゾート
約2.6兆円
AM・仲介
有形・無形固定資産
Others
9%
Approx.¥2.6 trillion
(Approx. ¥1.8 trillion for investors;
Approx. ¥0.7 trillion for individuals)
その他
新築請負
投資家向け分譲等
国内住宅分譲
Property Sales to
Residential Property
Investors, etc.
Sales to Individuals
11%
(Domestic)
16%
Real Property for Sale
Approx.¥2.6 trillion
26%
6
2 経営方針
Management Policy
持続的な成⾧を実現するビジネスモデル
Business Model that Realizes Sustainable Growth
不動産の「インカムゲイン」「キャピタルゲイン」「マネジメント」を最適、かつ柔軟に組み合わせ、利益の最大化を実現
Maximize Profits through an Optimal and Flexible Combination of Real Estate “Income Gain Business”,“Capital Gain Business” and “Management”
投資家・不動産オーナー
三井不動産グループ
Investors, Property owners
Mitsui Fudosan Group
分譲・売却
Property Sales
キャピタルゲイン
Capital Gain
Business
Tangible and Intangible
Fixed Assets
Approx.¥4.6 trillion
46%
約10.1兆円
Approx.¥10.1
trillion
約2.8 兆円
28%
Others
Approx.¥2.8 trillion
28%
売却売上
約4.6 兆円
総資産
その他資産
投資家
有形・無形固定資産
Investors
Sales Revenue
46%
販売用不動産
26%
Real Property for Sale
Approx.¥2.6 trillion
26%
管理・運営・仲介等
Cash
Flow
約2.6 兆円
Management
Operation
Brokerage, etc.
インカムゲイン
マネジメント
Income Gain
Business
Management
Business
不動産オーナー
Property
owners
手数料
Commissions
Mitsui Fudosan Group
Total Assets
(Approx. ¥10.1 trillion)
三井不動産グループ総資産
(約10.1兆円)
賃貸
賃貸収入
Leasing
Leasing Revenue
テナント Tenants
オフィステナント/Office tenants
約3,000社/Approx. 3,000 companies
テナント
Tenants
商業テナント/Retail tenants
約2,500社/Approx. 2,500 companies
2026年9月末時点 / As of Sep. 30, 2026
- 時点の記載がない数値は2026年3月期末時点のものです。/Values without a noted time are as of the end of FY2025.
MITSUI FUDOSAN CO., LTD.
7
預かり資産(約5.31兆円)
Assets Under Management (AUM)
(Approx. ¥5.31 trillion)
*「インカムゲイン・キャピタルゲイン・マネジメント」とは
インカムゲイン:稼働資産の保有を通じた、安定的な「賃貸利益」「施設営業利益」の享受
キャピタルゲイン:資産の売却による付加価値の顕在化、「開発利益(売却益)」の享受
マネジメント:預かり資産等を通じた、継続的な「マネジメント利益」の享受
*What is Income Gain Business, Capital Gain Business and Management Business?
Income Gain Business:
Generate stable leasing income and facility operating income through the ownership of operating assets.
Capital Gain Business:
Realize added value through the sale of assets and development profit (gain on sale).
Management Business:
Generate continuous management profit through assets under management, etc.
2 経営方針
Management Policy
市場とのデカップリング
Decouple from the market
マーケットやエリアの価値を牽引する市場とのデカップリングを実現
We generate new demand and decouple from the market in a bid to drive value.
Office (mixed-use properties in city centers)
Retail & Sports and Entertainment
■Strength of the customer base
■Collaboration between retail facilities and
sports/ entertainment that only we can provide
●Tenant companies across various industries Approx. 3,000
Ticket purchases
■Planning, development, and management skills
●Favorably located,
Retail
Event awareness
Event day
Sports and
Entertainment
Housing (Homes and Living)
■Robust development and sales capabilities of central
urban, large-scale, high-end condominiums
Total number of units handled in
Tokyo’s six central wards.*6
Market share:
Approx.
Merchandise
purchases
40%(FY2025)
●Intangible services
high specification
●Newer, mixed-use properties
●Places and communities
■Market-leading leasing capabilities
<Rental Rates in Our Major Development Areas>
(Compared to 2010)12
●Attract more customers and increase sales by
increasing the attractiveness of real facilities
●Visitor traffic at some commercial facilities
increased to 140% of the normal level on arena
event days.
Through “The creation of neighborhoods” that enhances the value
●Buoyed by increases in central urban,
large-scale, high-end condominium
profit margins
●Property Sales to Individuals (Domestic)
profit margin reached a record high of 25.5%
in FY2025.
of the area, rental rates in development areas have increased. The
area has achieved one of the highest growth rates in central
Hotels and Resorts
Logistics
Tokyo, and asking rents in the ”Yaesu, Nihonbashi, and
Kyobashi” area the highest among major Tokyo areas.
(As of Oct. 2026)
●Yaesu / Nihonbashi / Kyobashi:206% (¥57,235/tsubo)
●Nihonbashi Honcho & Muromachi:194% (¥43,778/tsubo)
Our offices are being leased at levels well above asking
rents in each area.
■Attractive portfolio of properties with highly
competitive tangible (favorably located, high-specification
real estate) and intangible (services)
strong customer base / strong relationships with
Office leasing revenue
Neighborhood creation-type
(as of the end of FY2025)
Approx. 1.4 times in 6 years
facilities
Cases of contracts with rents
(Tokyo metropolitan area, non-consolidated)
1.6%
⇄ Market (Central Tokyo 5 wards) 2.2%*3
FY2025 : ¥486.5 billion
⇄ FY2019: ¥360.2 billion
from upscale to upper upscale
Luxury
Upper upscale
Upscale
Up-mid scale
Mid-scale
Economy
■Capturing demand from inbound travelers
Inbound travelers lodging ratio (Tokyo)
60% level (end of FY2018) → Approx. 85% (end of FY2025)
●High competitiveness
Office vacancy rate
Mitsui Fudosan
Brand recognition has elevated
■Direct sales to cargo owners utilizing the Group’s
logistics companies
●Low vacancy rates, stable rental income,
and sources of further top-line growth
■Shift in brand positioning(Mitsui Garden Hotels)
Vacancy rate
(Tokyo metropolitan area, over 1 year old)
As of Mar. 2026
Development properties
1.3 times
1.7%
higher than the market*4
⇄ Market 9.2%*5
●High ADR growth rate
FY2025 : Approx. +¥2,000 (compared with FY2024)
Amounts are record highs
⇄ Hotel REIT (ADR) + Approx. ¥1,000 *7
●4 of the 7 highest-rated facilities in Japan by
MICHELIN Guide are our facilities → P.41
*1:Source:Sanko Estate Co., Ltd. *2 : Asking rents including CAM charges for buildings with a typical floor area of 200 tsubo or more *3:Source: Miki Shoji Co., Ltd. *4:Example of MFLP・LOGIFRONT TOKYO ITABASHI・MFLP FUNABASHI・MFIP HANEDA
*5:Source:CBRE(2026.1Q vacancy rate of large multi-tenant logistics facilities in the Tokyo metropolitan area (more than 1 years old)) *6:In the case of JV properties, units are counted by the lead company. *7:Jan.–Dec. 2025
MITSUI FUDOSAN CO., LTD.
8
2 経営方針
Management Policy
成⾧投資とポートフォリオ
Growth Investment and Portfolio
Creation of Added Value through Growth Investment
3,729.5
37%
Investment and Development
Focal points in portfolio
building
Tangible and Intangible
Fixed Assets
Guideline for
Investment Criteria
4,679.1
Other Tangible
Fixed Assets
✓Sourcing of properties with high
potential for added value
✓Adding value and improving margin
through development investment
✓Strengthening of resilience to market
changes through area-product
combinations; awareness of balance
between risk and returns
A. Rental Properties
and Intangible
(Domestic example: NOI yield)
Central Tokyo prime office buildings
Total Assets
9%
¥10,103
≈5%
1,846.8
18%
FY2025
Retail Facilities (land holding)
B. Real Property for Sale
(For Property Sales to Investors)
Real Property
≈8%
for Sale
Others
Retail Facilities (lease-land type)
2,603.0
≈12%
C. Real Property for Sale
2,821.2
28%
(For Property Sales to Individuals
(Domestic))
756.2
8%
Asset Portfolio of the Mitsui Fudosan Group
Area
Central Tokyo
Suburbs
Domestic
Overseas
Europe and
North America,
Asia and Other Regions
Unit: Billions of yen
Product Category
Office
Buildings
Logistics
Facilities
Retail
Facilities
Hotels,etc.
Tangible and Intangible Fixed Assets+Real Property for Sale
Housing
Sports and
Entertainment
0%
MITSUI FUDOSAN CO., LTD.
7,282.1
10%
9
Office
Retail Facilities
Housing
Other
47%
16%
21%
6%
20%
30%
40%
50%
Logistics Facilities
Hotels & Resorts
7%
3%
60%
70%
80%
90%
100%
2 経営方針
Management Policy
成⾧投資とポートフォリオ
Growth Investment and Portfolio
Realization of unrealized gain from the timely sale of income-generating real estate holdings (Approx. ¥5.5 trillion)
Change in
Leasing segment Business Income
A. Rental Properties
Change in Gains on Sales
(Tangible and Intangible Fixed Assets)
(Billions of Yen)
*Operating income is disclosed for FY2023 and prior.
(Billions of Yen)
200
200.0
Under
Development
180.0
8.1%
170
Domestic
8.3%
160
28%
160.0
Overseas
7.9%
150
140.0
Approx.
149.1
145.8
141.9
138.3
135.7
Book value at
the end of March 2026
¥3.72 trillion*1
120.7
Domestic
Domestic
63%
Domestic
120.0
130
Operating Asset
Operating Asset
91%
Office Retail Other
Under
Develop
Overseas
ment
40% 17% 6% 28%
Overseas
9%
Total
121.4
120
6.8
110
100% ¥3.72
trillion
Under Development
96.7
97.9
100
93.8
90
82.8
20.7
82.4
4.4 73.5
80
100.0
70
B. Real Property for Sale (for Property Sales to Investors)
62.4
60
80.0
53.3
Under
Development
35%
40.0
Book value at
the end of March 2026
Approx.
20.0
Domestic
¥1.84 trillion*2
43%
Overseas
FY
FY
FY
FY
FY
FY
FY
FY
FY
2015 2016 2017 2018 2019 2020 2021 2022 2023 2024 2025
Domestic
22%
Overseas
Domestic
7.6%
10
Overseas
5.8%
0
53.3
20.5
44.3
34.6
30.6
20.5
FY
FY
FY
FY
FY
FY
FY
FY
FY
FY
Cap rate Examples of Major Assets
Sold in the Past
Operating Asset
Domestic
Rental
OfficeRetail Logistics Housing Other
8% 7% 15% 12% 1%
Under Development
MITSUI FUDOSAN CO., LTD.
20
*2 Asset breakdown
65%
FY
7.0%
78.4
77.2
62.4
FY
2015 2016 2017 2018 2019 2020 2021 2022 2023 2024 2025
Operating Asset
FY
30
Expected NOI yield
34.6
51.7
96.7
93.8
40
Operating Asset
29.1
114.5
50
60.0
0.0
Gain on sales of Real Property for Sale
(Excluding Residential use for Individuals)
140
*1 Asset breakdown
129.9
124.1
Gains on Sales of Fixed Assets
180
Expected NOI yield
167.8
Overseas
190
Operating Asset
9%
177.0
176.4
Residential Property Sales to Individuals
(Domestic) Operating income
10
Under
Develo
Over
pment
seas
Total
22
35% 100% ¥1.84
trillion
%
(FY2022-2026 results)
Office
2.7~3.5%
Retail Facilities
4.2~4.7%
Logistics Facilities
3.3~4.6%
グループ⾧期経営方針 & INNOVATION 2030 *2024年4月策定
Mitsui Fudosan Group Long-Term Vision:& INNOVATION 2030 ⋆Announced in Apr. 2024
2 経営方針
Management Policy
Structure of & INNOVATION 2030
Please refer to the following URL link for details
https://www.mitsuifudosan.co.jp/english/corporate/innovation2030/
MITSUI FUDOSAN CO., LTD.
11
グループ⾧期経営方針 & INNOVATION 2030 *2024年4月策定
Mitsui Fudosan Group Long-Term Vision:& INNOVATION 2030 ⋆Announced in Apr. 2024
経営方針
2 Management
Policy
Quantitative Targets: Around FY2030
Growth
Indicator
EPS*1 growth rate +8% or higher, CAGR
FY2023 (forecast as of Feb.9, 2024)–FY2030(forecast)CAGR
Efficiency
Indicator
ROE 10% or higher
Efficiency
Indicator
ROE
*1: Earnings Per Share
Quantitative Targets: FY2026
Growth
Indicator
PL
BS
Efficiency Indicator
EPS growth rate +8% or higher, CAGR
FY2023 (forecast as of Feb.9, 2024)–FY2026(forecast)CAGR
Business income
Profit attributable to
owners of parent
Total assets
Interest-bearing debt
ROA
¥440 billion or higher*2
8.5% or higher
Total payout ratio
¥270 billion or higher
Dividend payout ratio
Shareholder Returns
Around ¥9 trillion
(FY2024-FY2026)
Around ¥4.5 trillion
50% or higher each period
Around 35% each period
Stable dividend increases linked to sustainable profit growth
(continuous and progressive dividends)
Flexible and continuous repurchase of own shares
5% or higher*3
*2: Operating income +Equity in earnings/losses of affiliates (including Gain/loss on sales of shares of subsidiaries and affiliates for the purpose of real estate sales)+Gain/loss on sales of fixed assets
*3: Business income / Average total assets over period
Balance Sheet Control
Fixed Assets/
Real Property for Sale
Marketable
Securities
MITSUI FUDOSAN CO., LTD.
Asset turnover with no exceptions
(Scope not limited to only real property
for sale; fixed assets to also be considered)
(FY2024-FY2026)
Strategic
shareholdings
(FY2024-FY2026)
Stocks held purely for
investment
Around
¥2 trillion
D/E Ratio
Maintain financial
soundness
while conscious of ratings
Around
1.2-1.5 times
Accelerate efforts to reduce strategic shareholdings ;reduce current holdings by 50%
over the three-year period to FY2026. Continue to actively reduce strategic
shareholdings from FY2026 onward.
Reduction of
50%
Reflecting our track record to date, we will continue to take a flexible and sustainable
approach to selling over time, allocating proceeds to invest for future growth while
also taking the share price into account.
Sell at the right time
12
& INNOVATION 2030 2026年3月期通期実績および2027年3月期業績予想
2 経営方針
Management Policy
“& INNOVATION 2030” FY2025 Results & FY2026 Forecast
「Progress Toward the Fiscal Year 2026 Goals of “& INNOVATION 2030”
& INNOVATION 2030 KPI
Growth
Indicator
Efficiency
Indicator
EPS growth rate*1
*1 Base for calculation:
FY2023 EPS forecast of ¥78.5
FY2024 Results
FY2025 Results
+13.7%/year
+13.4%/year
・CAGR
(EPS:¥89.3)
(EPS:¥101.0)
FY2026 Forecast
Approx.
FY2026 Goals
+10.3%/year
・CAGR
+8%/year or
higher・CAGR
8.5% or
8.5% or
(EPS:Approx. ¥105)
ROE
8.0%
8.7%
Business income
¥398.6 billion
¥445.1 billion
¥450.0 billion
¥440.0 billion
or higher
Profit attributable
to owners of parent
¥248.7 billion
¥278.6 billion
¥285.0 billion
¥270.0 billion
or higher
BS
Interest bearing
debt
Approx. ¥4.42
trillion
Approx. ¥4.63
trillion
¥4.80 trillion
Around
¥4.5 trillion
D/E Ratio
Maintain financial
soundness while
conscious of ratings
1.40X
1.41X
In the 1.4X
Range*2
PL
Marketable
Securities
Strategic
shareholdings
Cumulative
reduction of
Approx. 23%
reduction
around 40%
higher*2
Cumulative
reduction of
50%
higher
Around
1.2-1.5 times
50% reduction
(3-year cumulative)
or higher
*2 Calculated based on certain assumptions
MITSUI FUDOSAN CO., LTD.
13
「& INNOVATION 2030」
2 経営方針
Management Policy
主要なKPIの推移
"& INNOVATION 2030" Main KPI Trends
Status and outlook of Net profit, ROE, Total Assets and Debt
ROE
Net Profit
(Billions of Yen)
10.0%
285.0
278.6
9.5%
280.0
248.7
9.0%
224.6
8.5%
8.0%
7.5%
7.0%
300.0
7.4%
168.6
7.7%
176.9
240.0
220.0
8.0%
200.0
180.0
6.9%
6.6%
129.5
8.5% or higher
7.5%
6.5%
6.0%
8.7%
196.9
183.9
260.0
160.0
140.0
5.5%
120.0
5.0%
FY2018
FY2019
100.0
5.2%
FY2020
FY2021
FY2022
FY2023
FY2024
FY2025
FY2026
(Billions of Yen)
11,000.0
10,000.0
8,841.4
1.42
8,000.0
7,000.0
9,489.5
1.45
9,000.0
7,395.4
9,859.9
8,208.0
7,742.0
1.40
1.55
10,103.4
1.4x Level
1.42
1.40
1.45
1.41
1.40
6,802.7
1.35
1.31
6,000.0
5,000.0
1.50
1.30
1.24
3,481.1
4,000.0
3,667.2
3,623.4
4,430.4
4,048.5
4,416.0
4,632.5
4,800.0
1.20
2,906.6
3,000.0
1.25
1.15
2,000.0
1.10
FY2018
FY2019
FY2020
FY2021
Total Assets
MITSUI FUDOSAN CO., LTD.
FY2022
FY2023
Interest bearing debt
14
FY2024
D/E ratio
FY2025
FY2026
「& INNOVATION 2030」
2 経営方針
Management Policy
主要セグメント 利益成⾧の推移
"& INNOVATION 2030" Profit Growth in Major Segments
Each segment's income is expected to remain steady toward achieving FY2026 Business Income Goals, over ¥440 billion
Property Sales
Leasing
FY2024Results
¥176.4 billion
FY2025Results
¥177.0 billion
FY2026Forecast
¥180.0 billion
& INNOVATION 2030
FY2026 Goals
Around
¥180.0 billion
(Billion)
FY2025Results
FY2026Forecast
¥167.0 billion
¥193.1 billion
¥210.0 billion
& INNOVATION 2030
FY2026 Goals
Around
¥210.0 billion
(Billion)
200
¥180.0
billion
180
250
¥210.0
billion
200
160
150
140
100
¥104.3
120
FY2024Results
¥23.0
50
billion
billion
0
100
Management
FY2024Results
¥71.6 billion
FY2025Results
¥80.8 billion
FY2026Forecast
¥75.0 billion
Facility Operations
& INNOVATION 2030
FY2026 Goals
FY2025Results
FY2026Forecast
¥38.6 billion
¥46.3 billion
¥45.0 billion
Around
¥70.0 billion
(Billion)
& INNOVATION 2030
FY2026 Goals
Around
¥30.0 billion
(Billion)
90
60
¥75.0
billion
80
55
¥45.0
50
70
billion
45
60
50
FY2024Results
40
¥41.5
billion
35
40
30
30
25
20
20
¥26.3
billion
*Until FY2022, based on operating income; from FY2023 onward, based on business income.
MITSUI FUDOSAN CO., LTD.
15
2 経営方針
Management Policy
「& INNOVATION 2030」 キャッシュアロケーションの状況
“& INNOVATION 2030” Status of Cash Allocation
Approximately ¥2.2 Trillion in Both Cash Inflows and Outflows Achieved Over Two Years,
Representing Around 80% of the Three-Year Cumulative Forecast
"& INNOVATION 2030" 3-Year Cumulative
Cumulative Progress for FY2025
(FY2024-FY2026)
Cash Out
Growth
asset turnover
investments
Around
Around
¥2 trillion
¥2 trillion
Approx. ¥2.2 trillion
Proceeds from
Cumulative Progress
Item
Cash Inflows
Cash In
Proceeds
from asset
turnover
FY2024
FY2025
Approx.
¥610.0 billion
Approx.
¥630.0 billion
Approx.
¥1,240.0 billion
(Approx. 60%)
Basic cash
flow from
operating
activities
Approx.
¥490.0 billion
Approx.
¥530.0 billion
Approx.
¥1,010.0 billion
Key Details
Through accelerated asset turnover, including both
real estate for sale and fixed assets, properties
such as Otemachi One Tower, LaLaport Aichi Togo,
and Yokohama Mitsui Building were sold in FY2024,
while properties such as Mita Garden Hills,
(Former) Hibiya U-1 Building, U.S. rental housing
assets, and DiverCity Tokyo PLAZA were sold in
FY2025, along with progress in the sale of
investment securities.
Profit attributable to owners of the parent of
¥248.7 billion in FY2024 and ¥278.6 billion in
FY2025, together with depreciation of fixed assets
and real estate for sale, etc.
from operating
Funds for
strategic purposes
Around
activities
¥0.6 trillion
Around
Shareholder returns
¥1 trillion
Around
MITSUI FUDOSAN CO., LTD.
¥0.4 trillion
Approx. ¥2.2 trillion
Basic cash flow
Cash Outflows
(Approx. 100%)
Growth
investments
+
Funds for
strategic
purposes
Approx.
¥930.0 billion
Approx.
¥1,040.0
billion
Approx.
¥1,970.0 billion
(Approx. 80%)
Approx.
¥130.0 billion
Shareholder
returns
Approx.
¥190.0 billion
Approx.
¥320.0 billion
(Approx. 80%)
(FY2024)
New investments such as "Lalaport Anjo" by Mitsui
Fudosan and "Park Wellstate Nishiazabu" and
condominium projects by Mitsui Fudosan Residential, etc.
(FY2025)
New investments such as the redevelopment investment
in “LaLaport TOKYO-BAY” by Mitsui Fudosan, the new
investment in “Mita Garden Hills” by Mitsui Fudosan
Residential, as well as the acquisition of shares in MitsuiSoko HOLDINGS Co., Ltd. in connection with the capital
and business alliance, and the acquisition of shares in
Toyota Automall Development Co., Ltd. *1, etc.
・Shareholder Returns for FY2023:
Year-end dividends and Repurchase of own
shares totaling ¥40.0 billion.
・Shareholder Returns for FY2024:
Interim dividend, Year-end dividends and partial
repurchase of own shares totaling ¥45.0 billion.
・Shareholder Returns for FY2025:
Interim dividends and repurchase of own
shares totaling ¥57.0 billion.
*1 Toyota Automall Development Co., Ltd. changed its company name to MF Automall Development Co., Ltd. effective April 1, 2026, following the change in its parent company on August 29, 2025.
16
グループ⾧期経営方針 & INNOVATION 2030 *2024年4月策定
Mitsui Fudosan Group Long-Term Vision:& INNOVATION 2030 ⋆Announced in Apr. 2024
経営方針
2 Management
Policy
Executive summary of Financial Strategy
Manage with an equal focus on the three key objectives
: enhance growth, efficiency and shareholder returns
Achieve stable and continuous profit growth and
enhance cash-generating capabilities
●Achieve stable and continuous leasing income growth
through various measures, including the development of new
properties and existing property top-line growth.
●Realize development added value through the stable and
continuous turnover of assets, while taking into consideration
the balance between leasing income and sales profit.
●Enhance cash-generating capabilities through business
planning, property development, and management
capabilities that are the source of the Company’s competitive
advantage.
Expand shareholder returns
based on growth and efficiency
Improve efficiency and maintain financial soundness
by managing the Company’s balance sheet
●Further enhance the quality of the asset portfolio by
considering and executing asset turnover, reviewing not only
real property for sale but fixed assets and investment
securities.
●Maintain an “A” rating as a measure of financial
soundness and appropriately control financial leverage.
X
●Undertake the flexible and continuous repurchase of own
shares.
●Implement measures to increase the proportion of long-term
shareholders.
●Steadily and sustainably improve ROE to a level that
exceeds the cost of capital.
MITSUI FUDOSAN CO., LTD.
●Improve the dividend payout ratio and achieve stable dividend
increase linked to profit growth (continuous and progressive
dividends).
17
グループ⾧期経営方針 & INNOVATION 2030 *2024年4月策定
経営方針
2 Management
Policy
Mitsui Fudosan Group Long-Term Vision:& INNOVATION 2030 ⋆Announced in Apr. 2024
Improve efficiency and maintain financial soundness
■Accelerate asset turnover and realize added value (valuation gains), while taking into consideration the balance between leasing income
and sales profit.
(Sale of fixed assets and real property for sale without exception; reduction of strategic shareholdings; sell at the right time stocks held purely for
investment purposes)
Work to increase management revenue by expanding assets under management.
■Maintain a highly efficient and sound financial structure while controlling the balance sheet (BS).
Assets under management
Total assets
Interest-bearing debt/Equity
Expand assets under management (AUM)
⇒Expand management income
Accelerate asset turnover
⇒Realize added value (valuation gains)
Financial leverage Maintain an “A” rating
Fixed assets/ Real property for sale
Sale without exception
Our affiliated REITs, PFs, business
corporations, individuals, etc.
Trillion
yen
Proceeds from asset turnover Around ¥2 trillion
(FY2024-FY2026)
Marketable securities
Steady growth in total assets under management
8
Strategic shareholdings
Reduction of around 50% (FY2024-FY2026)
Accelerate efforts to reduce strategic shareholdings; reduce current
holdings by 50% over the three-year period to FY2026. Continue to
actively reduce strategic shareholdings from FY2026 onward.
6
Stocks held purely for investment purposes
4
Sell at the right time
Reflecting our track record to date, we will continue to take a
flexible and sustainable approach to selling over time, allocating
proceeds to invest for future growth while also taking the share
price into account.
2
0
FY2002
FY2007
FY2012
FY2017
FY2022
%
ROE Results and Future Targets
11.0
10.0
Cost of
shareholders’
equity
(As of 2024:Around
7%)
8.0
7.4
Active IR dialogue
Social impact
Social value
Competitive
advantage
Differentiation
strategy
Promote ESG
initiatives
Enhance
the quality of
the portfolio
Future performance
stability and
continuity
Enhance growth,
efficiency and
shareholder returns
7.7
6.6
7.0
6.0
6.9
5.2
5.0
4.0
FY2018 FY2019 FY2020 FY2021 FY2022 FY2026 FY2030
MITSUI FUDOSAN CO., LTD.
Return of profits to shareholders
taking into consideration financial
soundness
and capital efficiency
10.0
8.5 or higher
9.0
Improve
ROE
Shareholder returns
FY2030
●Steadily and sustainably improve ROE to
a level that exceeds the cost of shareholders’ equity
Expand
spread
D/E ratio
Around 1.2-1.5 times
18
Gain the trust and confidence of stakeholders
グループ⾧期経営方針 & INNOVATION 2030 *2024年4月策定
Mitsui Fudosan Group Long-Term Vision:& INNOVATION 2030 ⋆Announced in Apr. 2024
経営方針
2 Management
Policy
Characteristics of the Mitsui Fudosan Group’s Assets
Assets under development
Assets in central cities*2
Development from scratch is
necessary to create new value
No profit is generated during
development
Innovation and excitement
through the integration of
people, goods, money and
information
Continued possession based on
the concept of getting better
with age, leading to the
evolution of the neighborhoods
Relatively high cost of land
Securing the freedom for
additional investment and
demonstration experiments
Stabilization of cash flow and
reduction of capital cost
Source of future growth
Our Guideline
Ratio to real estate assets*1
Large unrealized/realized gain
Ratio to real estate assets*1
Approx.
Assets to be held
Necessary to control the
balance sheet
Income Gain Capital Gain
Business: Management
Business:
Approx.
Conceptual Image of profit structure
Efficiency Indicators
• Balancing social and economic values
• Pursuing a good balance between growth
and efficiency
• Appropriate D/E ratio of around 1.2 to 1.5
ROE Target 8.5% or higher
ROA Target 5% or higher
Around FY2030 ROE Target 10% or higher
FY2026
*3
*1 Real estate assets=Fixed assets, real property for sale, etc *2 Assets in central cities=assets in the three wards of central Tokyo and New York, USA *3 Business income / Average total assets over period
MITSUI FUDOSAN CO., LTD.
19
経営方針
2 Management
Policy
グループ⾧期経営方針 & INNOVATION 2030 *2024年4月策定
Mitsui Fudosan Group Long-Term Vision:& INNOVATION 2030⋆Announced in Apr. 2024
Realize added value (gain on sales)
Enhance the quality of the asset portfolio for further growth and improved efficiency.
Accelerate asset turnover of not only real property for sale but fixed assets and investment securities
(including strategic shareholdings and stocks held purely for investment purposes).
Continuously realize added value.
Fixed assets
Rental
Properties
Approx.
¥3.4 trillion
(FY2022)
Tokyo Dome,
Hotels and resorts
Other
Trends in book value and valuation gains on rental properties as a
result of development
Fixed assets, real property for sale,
(Trillions of yen)
8.0
6.0
Book value
marketable securities
Valuation gains
Approx.
Approx.
¥3.2 trillion
4.0
¥2.7 trillion
2.0
Approx.
Approx.
¥3.0 trillion
¥3.4 trillion
0.0
FY2018
FY2019
FY2020
FY2021
Asset
Turnover
¥8.8trillion
(FY2022)
Real property for sale
Total assets
Approx.
¥1.4 trillion
(FY2022)
Book value
Image of Valuation gains
Asset
Turnover
2.0
1.0
0.0
Approx.
Approx.
150
¥1.4 trillion
¥0.9 trillion
FY2019
FY2020
FY2021
Added
value realization
FY2022
Image of trends in book value and valuation gains on property sales to
individuals’ assets as a result of development
¥99.6 billion
(Trillions of yen)
1.2
Book value
100
Estimated gain on sales
Property
sales
0.8
0.4
Approx.
Approx.
¥0.6 trillion
¥0.6 trillion
Three years (FY2024-FY2026)
50
0.0
FY2018
(Trillions of yen)
FY2019
FY2020
FY2021
FY2022
1.0
0.5
0.0
Approx.
Approx.
Sale
¥1.2 trillion
¥0.8 trillion
FY2018
FY2019
FY2020
FY2021
FY2022
*Mainly marketable equity securities and equity method investments in real estate holdings and developments.
MITSUI FUDOSAN CO., LTD.
20
Cumulative total
Approx.¥
Investment securities*
1.5
Other assets
¥191.0 billion
200
3.0
¥0.6 trillion
(FY2022)
250
(Trillions of yen)
FY2018
Property
Sales to
Individuals
(Domestic)
Approx.
Billions of Yen
FY2022
Image of trends in book value and valuation gains on property sales to
investors’ assets as a result of development
Property
Sales to
Investors
Approx.
Accelerate the generation of gains
0
670.0 billion
経営方針
2 Management
Policy
グループ⾧期経営方針 & INNOVATION 2030 *2024年4月策定
Mitsui Fudosan Group Long-Term Vision:& INNOVATION 2030⋆Announced in Apr. 2024
Expand shareholder returns (FY2024-FY2026)
Expand shareholder returns Stable
and continuous
shareholder returns
Strengthen dividends Increase in
dividends linked to
sustainable profit growth
Total payout ratio
50% or higher each period
Dividend payout ratio Around 35%
each period, introduce continuous
and progressive dividends
Trends in Profit Attributable to Owners of Parent
and Dividend per Share*1
(Forecast)
40
37
35
35
31
300,000
250,000
28
30
21
18
20
56.0%
60.0%
54.9%
150,000
45.0%
10
10
7 7 7 7 7
7 7
11
8
5
5
2 2 2 2
100,000
3
Profit Attributable to owners of parent (Right)
50,000
25.0%
*2
96,047
42,837
58,372
20.0%
39,527
33,596
29,643
Dividend per Share (Left)
Total Dividend
*1 Due to a stock split on 4/1/2024 (from 1 share to 3 shares), FY2001-2023 figures are adjusted to post-split basis and rounded to the nearest whole number
MITSUI FUDOSAN CO., LTD.
15,000
21
80,000
30,000
15,000
43,218
0
0
25.5%
25.2%
16,000
30,000
25,000
52,538
120,000
100,000
36.9%
35.0%
30.0%
40,000
45,000
40,000
40.0%
160,000
140,000
57,000
46.6%
44.9%
44.2%
35.0% 35.1%
13
20,000
52.7% 52.7%
55.0%
15 15 15
15
(In principle, repurchased own shares will be cancelled.)
50.0%
200,000
25
Flexible and continuous
repurchase of own shares
Trends in Total Dividend Amount, Share Repurchase
Amount and Total Payout Ratio
(Millions of Yen)
(Forecast)
(Millions of Yen)
(Yen)
Growth and increase
in value per share
60,000
99,511
40,000
86,152
78,459
20,000
42,334
0
Share Repurchase
Total Payout Ratio
*2:After reflecting the share repurchase announced on November 6, 2026 (total shareholder return ratio: 56.0%)
グループ⾧期経営方針 & INNOVATION 2030 *2024年4月策定
Mitsui Fudosan Group Long-Term Vision:& INNOVATION 2030 ⋆Announced in Apr. 2024
経営方針
2 Management
Policy
Enhance cash-generating capabilities (FY2024-FY2026)
Maximize basic cash flow* generated by mainstay businesses. Strengthen stable and continuous cash-generating capabilities.
Enhance the quality of the asset portfolio, accelerate asset turnover, and realize added value.
Appropriately allocate basic cash flow from operating activities and proceeds from asset turnover to growth investments, strategic funds
and shareholder returns with a focus on growth and efficiency while controlling increases in outstanding debt.
*Basic cash flow from operating activities: Cash flow minus changes in such items as working capital (including increase/decrease in real property for sale) from operating cash flows, plus gains/losses on asset turnover.
3 years
Stable expansion of
cash-generating capabilities
Growth investments in existing core business areas
(FY2024-FY2026)
●Domestic: Mixed-use developments,
office buildings, retail facilities,
logistics facilities, etc.,
housing with a focus on metropolitan,
high-grade, large-scale condominiums
4,500
4,000
●Overseas: Mainly real property for sale
¥ 370.7 billion
3,500
3,000
Enhance the quality of the asset portfolio
and strengthen the earnings platform
Proceeds from
asset turnover
Around ¥2 trillion
Growth
investments
Around ¥2 trillion
Set aside funds for strategic purposes
Respond flexibly, taking into account such factors
as the business and financial environment
●Budget for expansion into new asset classes
2,500
¥ 190.2 billion
●Budget for capturing business opportunities
in new business domains (M&As, etc.)
Enhance the Portfolio
●Funds set aside for balance sheet control
(maintain financial discipline and improve ROE)
Accelerate
2,000
1,500
1,000
500
Basic cash flow from
operating activities
Around ¥1 trillion
Maximize
Stable and continuous
0
MITSUI FUDOSAN CO., LTD.
Funds for
strategic purposes
Around ¥0.6 trillion
Total payout ratio 50% or higher each period
Provide stable and continuous returns to shareholders
with the aim of EPS growth and improving ROE
●Dividend payout ratio Around 35% each period
Shareholder returns
Around ¥0.4 trillion
22
●Introduce continuous and progressive dividends,
Increase in dividends linked to profit growth
●Flexible and continuous repurchase of own shares
資金調達状況
2 経営方針
Management Policy
Financial Situation
財務状況 /Financial Situation
資金調達 /Financing (2026年3月期末時点/FY2025)
連結有利子負債
Interest-Bearing Debt *Consolidated
● 格付を意識しながら、投資好機に向け財務健全性を維持
Maintain financial soundness for investment opportunities while being
conscious of the rating
ノンリコース(円貨)
ノンリコース(外貨)
Non-Recourse - JPY
Non-Recourse -
2.6%
● 有利子負債は、D/Eレシオ:1.2-1.5倍程度によりコントロール
⾧期・短期比率
Ratio of Long/Short-term Debt
*ノンリコースを除く
*Excl. non-recourse
短期
Others
Short-term
5.0%
10.0%
To control interest-bearing debt, referring to D/E ratio around 1.2 to 1.5
コーポレート(外貨)
Corporate - Others
● 直接・間接を含め、柔軟に資金調達を実施
29.4%
Flexible financing, including direct and indirect financing
⾧期
コーポレート(円貨)
Long-term
Corporate - JPY
90.0%
62.9%
平均残存期間 4.72年
Average Duration 4.72 Years
● 借入残高における高い⾧期・固定比率を維持
Maintain a high long-term/fixed ratio of outstanding loans
固定・変動比率
Ratio of Fixed/Floating-Interest Debt
● 未使用のコミットメントライン4,000億円
*ノンリコースを除く
*Excl. non-recourse
The unused commitment line is ¥400 billion
自己資本(左軸)
Interest-bearing debt(Left)
Shareholders' equity(Left)
4,500
1.45 3,623
3,500
3,000
2,500
1.16
2,226
1.15
2,287
2,000
1,500
4,430
4,416
1.42
1.40
4,632
1,922
1,984
1.18
2,604
2,204
1.31
1.24
3,481
2,408
1.40
2,555
2,796
2,900
3,110
3,146
1.41
1.6
【調達金利の状況】
円貨+外貨
円貨
外貨
3,277
1.2
発行日
/Issue Date
0.8
500
0.2
0
0.0
FY2018
FY2019
FY2020
FY2021
FY2022
FY2023
FY2024
FY2025
第95回普通社債(グリーンボンド)
Jun. 4, 2026
第94回普通社債(グリーンボンド)
2026/6/4
94th Straight Bonds (Green Bond)
第93回普通社債(グリーンボンド)
Jun. 4, 2026
2026/6/4
発行額
/Issue Amount
335億円
JPY 33.5 billion
320億円
JPY 32.0 billion
261億円
93rd Straight Bonds (Green Bond)
Jun. 4, 2026
JPY 26.1 billion
第92回普通社債(グリーンボンド)
2026/3/12
232億円
92nd Straight Bonds (Green Bond)
第91回普通社債(グリーンボンド)
23
2026/6/4
95th Straight Bonds (Green Bond)
91st Straight Bonds (Green Bond)
MITSUI FUDOSAN CO., LTD.
【Funding Interest Rate Situation】
1.84%
All currency
0.99%
Japanese currency
Foreign currency
3.45%
1.84%
0.99%
3.45%
直近の調達実績(Recent Financing Results)
1.0
0.6
FY2017
74.1%
1.8
0.4
FY2016
Borrowing
80.6%
2.0
1,000
FY2015
Bank
Fixed
1.4
1.42
2,906
2,342
3,667
借入
固定
倍
Time
4,048
4,000
25.9%
19.4%
有利子負債(左軸)
Debt/Equity ratio(Right)
社債,SB
Floating
D/Eレシオ(右軸)
5,000
*ノンリコース・短期借入を除く
*Excl. non-recourse and short-term borrowings
変動
D/Eレシオ等の推移 /Trend of D/E ratio, etc.
十億円
Billions of Yen
借入・社債比率
Ratio of Bank Borrowing
Mar. 12, 2026
2026/3/12
Mar. 12, 2026
JPY 23.2 billion
211億円
JPY 21.1 billion
ベースレート スプレッド
/Spread
/Total
合計
発行年限
2.644%
0.350%
2.994%
10年/years
1.932%
0.260%
2.192%
5年/years
1.536%
0.240%
1.776%
3年/years
1.637%
0.220%
1.857%
5年/years
1.372%
0.190%
1.562%
3年/years
/Base Rate
/Tenor
2 経営方針
Management Policy
資金調達状況
Financing Situation
格付の状況
返済予定額
Credit Rating
Amount Scheduled to be Repaid
*ノンリコースローンを除く 2026年3月期末時点
*Excl. Non-recourse FY2025
*2026年11月6日時点
*As of Nov. 6, 2026
十億円/Billions of Yen
格付け機関
Rating Agencies
⾧期
Long-term
短期
Short-term
アウトルック
Outlook
ムーディーズ
Moody's
A3
P-2
安定的
Stable
スタンダード&プアーズ
Standard & Poor’s
A-
A-2
安定的
Stable
安定的
Stable
⾧期借入 /Long-term Borrowing
700.0
社債 /SB
600.0
129.9
500.0
400.0
フィッチ・レーティングス
Fitch Ratings
A
格付投資情報センター
Rating and Investment
Information (R&I)
AA-
a-1+
安定的
Stable
129.0
138.2
511.0
495.7
AA
J-1+
安定的
Stable
163.0
48.0
200.0
40.0
309.3
日本格付研究所
Japan Credit Rating Agency
(JCR)
60.0
300.0
310.7
100.0
195.2
160.0
FY2026
FY2027
FY2028
FY2029
FY2030
60.0
246.4
172.8
91.8
0.0
68.8
FY2031
FY2032
FY2033
151.2
FY2034
179.0
190.5
FY2035
FY2036~FY2069
有利子負債残高と調達金利の推移
Trends in Interest-Bearing Debt and Funding Interest Rates
十億円/Billions of Yen
5,000.0
4,048.5
3.61%
4,500.0
3.42%
4,000.0
3,481.1
3,500.0
3,000.0
2.66%
2.24%
2.25%
2,500.0
2,000.0
1,500.0
1,000.0
500.0
2,226.2
1.22%
2,906.6
3.01%
3,623.4
2.34%
1.21%
1.08%
3.45%
4.50%
4.00%
3.50%
3.00%
2.50%
1.69%
1.21%
4,632.5
2.37%
2,287.4
1.35%
4,416.0
3.71%
3,667.2
2,604.6
1.27%
4,430.4
3.81%
1.80%
1.87%
1.84%
2.00%
1.50%
1.19%
1.00%
1.05%
0.96%
0.83%
0.72%
0.62%
0.64%
0.63%
0.62%
FY2018
FY2019
FY2020
FY2021
FY2022
0.73%
0.79%
FY2023
FY2024
0.99%
0.0
0.50%
0.00%
FY2015
FY2016
FY2017
FY2025
有利子負債(左軸)
調達金利(円貨+外貨右軸)
調達金利(円貨右軸)
調達金利(外貨右軸)
Interest-Bearing Debt (Left)
Interest Rate (Consolidated, Right)
Interest Rate (Japanese Yen, Right)
Interest Rate (Foreign Currency, Right)
MITSUI FUDOSAN CO., LTD.
24
三井不動産の主なアセットクラス
3 事業状況
Business Situation
Mitsui Fudosan Group Main Asset Classes
分譲
マネジメント
Property Sales
●主に収益を上げているカテゴリ
●Main revenue-generating categories
主要データ
Key Data*1
オフィス
Office
Buildings
商業施設
Retail
Facilities
貸付面積*2
テナント企業数
Tenant Companies
3,586K㎡
Approx. 3,000
貸付面積*2
(2026年9月末時点)
3,586千㎡
Leased floor space*2
3,048千㎡
3,048K㎡
物流施設
データ
センター
総施設数*3
(2026年9月末時点)
Total Facilities*3
Logistics
Facilities
Data
Centers
(As of Sep. 30, 2026)
90施設
Total 90
約3,000社
投資家向け・海外住宅等
国内住宅
(個人)
Domestic
housing
(individuals)
To investors・Overseas
housing
投資家向け
海外住宅
To investors
(Domestic・
Overseas)
Overseas
housing
(国内・海外)
(個人)
施設営業
仲介/Brokerage
プロパティ
マネジメント
Property
Management
法人向け
●
To corp.
(To individuals)
個人向け
To
individuals
アセット
マネジメント
Asset
Management
賃料収入
Leasing Revenue
リート等への分譲収入
Sales Revenue
●
●
●
賃料収入
Leasing Revenue
リート等への分譲収入
Sales Revenue
●
●
●
●
賃料収入
Leasing Revenue
リート等への分譲収入
Sales Revenue
●
●
●
●
Facility
Operations
Delivered
Condominiums
●
Tenant Companies
(As of Sep. 30, 2026)
約2,500社
Approx. 2,500
総延床面積
Total Floor Space
約650万㎡
Approx.
6.5 million ㎡
2,747戸
引渡戸数
36,220件
Delivered Detached
Housing
Number of Deals
Brokered*4
36,220
407戸
個人・リート等への
分譲収入
Sales Revenue
賃料収入
Leasing Revenue
仲介手数料
Broker Commissions
管理費
Management Fees
●
●
●
●
●
●
●
●
●
●
407 units
Hotels and
Resorts
スポーツ・
エンターテイ
ンメント
Sports and
Entertainment
Other
テナント企業数
仲介取扱件数*4
2,747 units
住宅
Housing
ホテル・
リゾート
その他
引渡戸数
中
高
層
戸
建
Sources of
Revenue
Main Brands
Leased floor space*2
Leasing
収益の源泉
主なブランド
*1
賃貸
Management
当社直営施設 (2026年9月末時点)
Facilities Directly Operated by the Company
(As of Sep. 30, 2026)
52施設/Total 52
約13,100室/Approx.13,100 rooms
東京ドームシティ年間来場者数(2019年度)
Annual Number of Visitors to Tokyo Dome City
(FY2019)
約4,000万人/Approx.40,000,000
宿泊料
Accommodation
Fees
イベント開催収入
Event revenue
飲食/物販収入
●
Food and beverage/
merchandise revenue
広告収入
Advertising revenue
*1 時点の記載がない数値は2026年3月期末時点のものです。/Values without a noted time are as of the end of FY2025.
*3 既存施設および開発中の施設を含みます。/Includes existing facilities and facilities under development.
MITSUI FUDOSAN CO., LTD.
●
*2 転貸面積を含みます。/Includes subleased floor space.
*4 三井不動産リアルティグループの消去前仲介件数です。/Number of Mitsui Fudosan Realty Group brokered sales prior to eliminations.
25
リスク・機会・競争優位性
3 事業状況
Business Situation
Risks, Opportunities, and Competitive Advantages
Risks
Business
Opportunities
Competitive Advantages
Office
Buildings
✓Increases in such expenditures as construction,
operating, and maintenance costs
✓Impacts on project schedules due to conditions in the
Middle East, labor shortages, etc.
✓Heightened mindset toward human capital management
✓Need for high-specification office buildings aimed at
improving work engagement and attracting talent
✓Diversification of times, places, etc. for working associated
with changes in working styles
✓Expansion of corporate initiatives to achieve carbon
neutrality
Retail
Facilities
✓Decline in domestic consumer spending due to population
decline, declining birthrate, and an aging society
✓Concerns about the impact of EC market growth on
physical retail facility sales
✓Impact on business caused by soaring construction costs,
conditions in the Middle East, and labor shortages
✓Increasingly established consumer behavior that
distinguishes between and uses the real and digital
✓Expansion of inbound demand
✓Balanced consumption of hobbies and experiences
becoming more common under inflation
✓Retail tenants : Approx. 2,500 , Tenant Stores : Approx. 11,600
✓Mitsui Shopping Park members : Approx. 14.50 million
✓Customer contact points that combine digital and real facilities,
such as the MSP app and &mall official online shopping site
Logistics
Facilities
Data Centers
✓Intensification of competition for land acquisition due to
entry of new players
✓Overheating of leasing competition due to the supply of
new properties
✓Increases in such expenditures as construction, operating,
and maintenance costs
✓Shifts in technological trends and changes in laws and
regulations
✓Capturing demand for the relocation and/or reconstruction of facilities in
line with improvements in logistics efficiency, as well as demand for
warehouse automation owing to such factors as EC market growth
✓Sales activities aimed at securing business opportunities and tenants
through consulting services in areas such as logistics strategy, facility
design, and operations
✓Growing demand for data centers driven by advances in generative AI
and cloud Technologies
✓Expansion of data center supply areas driven by initiatives such as
the government’s digital transformation (DX) strategy
✓Track record of advanced logistics facility development extending
to 90 properties in Japan and overseas
✓Close tenant relationships that enable provision of CRE solutions
and direct sales to cargo owners
(Office tenants: Approx. 3,000*, Retail tenants: Approx. 2,500)
✓Ability to propose logistics solutions that leverage DX
✓Contraction of domestic housing-related market due to
population decline
✓Decline in housing-related demand due to rising interest
rates and worsening business sentiment
✓Soaring housing prices due to rising construction costs, etc.
✓Impact of changes in global conditions on the procurement
of construction materials
✓Heightened awareness concerning housing associated with diversification
of customers’ lifestyles
✓Increased use of customer sales approaches (online business
negotiations, AI-use, etc.) and product planning (select housing, etc.)
that emphasize cost performance and time performance
✓Focusing on environment-friendly product planning to realize a
decarbonized society
✓Focusing on the stock market due to a decrease in the number of
new properties and aging buildings
✓Condominium unit sales : Approx. 260,000*
✓Planning and development capabilities for realizing a product
lineup of city center, large-scale, and redevelopment
✓Impacts of geopolitical risks on international and
domestic travelers
✓Increase in operating costs due to rising prices and labor
costs
✓High evaluation of Japan’s tourism resources from home
and abroad
✓Expectations for further growth in foreign visitors to Japan
✓Critical need to carefully identify and assess the timing of
investments and capital recovery in light of the risks posed by such
factors as conditions in the Middle East, tariff policies, and persistent
inflation coupled with high interest rates, which are creating
uncertainty in the trading market.
✓In addition to risks common to Europe and the United States, such
as interest rates, exchange rates, and inflation, it is necessary to
carefully assess market conditions in light of geopolitical risks,
including developments in nearby Ukraine.
✓In addition to a large market size and high levels of
liquidity and transparency, medium- to long-term business
opportunities are anticipated in such sectors as office
buildings, rental housing, and logistics, driven by
demographic trends and housing demand.
✓In light of the market’s high transparency and liquidity,
medium- to long-term business opportunities exist in prime
office and residential properties, particularly in London.
✓In addition to geopolitical risks specific to each country, there
is a critical need to comprehensively monitor the impact of
such factors as interest rates, foreign currency exchange
rates, and inflation, much like in Europe and the United
States, and to assess market conditions for each country on
an individual basis.
✓Medium- to long-term growth opportunities driven by
population growth, rising personal consumption, and
advancing urbanization.
Housing
(Residential
Property Sales to
Individuals
(Domestic))
Hotels and
Resorts
Global
(Europe and
North America)
Global
(APAC)
✓Medium- to long-term relationships with about 3,000 tenant* companies
✓WORKSTYLING members : Approx. 340,000
Number of office locations : 596 (nationwide)
(WORKSTYLING 126, Partnership with STATION BOOTH/DESK 470)
✓Highly competitive property portfolio (locations, product performance,
etc.)
✓Mitsui Garden Hotel members : Approx. 1,350,000
✓Number of directly managed guest rooms: Approx. 13,100
(domestic and overseas)
✓Development of 14 hotel and resort brands meeting diverse
customer needs, from luxury to lodging-focused brands
✓“Engaged in Every Asset Class,” “an Expansive Value Chain,”
and “Development Capabilities Necessary for
Creating Neighborhoods”
✓A History of Over 50 Years in Overseas Business
✓Promoting Localization by Recruiting and Promoting
Excellent Local Employees
MITSUI FUDOSAN CO., LTD.
26
オフィス
主要セグメント
Main segments
Office
賃貸
分譲
マネジメント 施設営業
Leasing
Sales
Management
Facility Operations
○
○
○
○
3 事業状況
Business Situation
事業戦略
都心を中心とする優良なオフィスポートフォリオ
Business Strategies
An excellent office portfolio centering on central Tokyo
● 「行きたくなる街」にある「行きたくなるオフィス」の実現による付加価値の顕在化
Realize added value by creating offices that people want to work in, located in cities people want to visit.
● ミクストユースの街づくりを進め、街全体で差別化
貸付面積首都圏比率
賃貸収益
貸付面積
Leasing Revenue
Leased Floor Space
Leased Floor Space Tokyo
metropolitan area Ratio
Differentiate entire cities by promoting the creation of mixed-use neighborhoods.
約4,864億円
約3,586千㎡
約90%
働く場の選択肢を多様化し、顧客ごとに最適なワークスタイルを提供
Approx. ¥486.4 billion
Approx. 3,586 K ㎡
Approx. 90 %
Strengthen solution proposals and service menus tailored to tenant companies.
(2026年3月期:連結)
(FY2025;Consolidated)
(2026年3月期:連結)
(FY2025; Consolidated)
(2026年3月期:単体)
(FY2025; Non-consolidated)
● テナント企業に寄り添ったソリューション提案、サービスメニューを強化
Diversify workplace options to provide optimal workstyles for each customer.
テナント リレーション
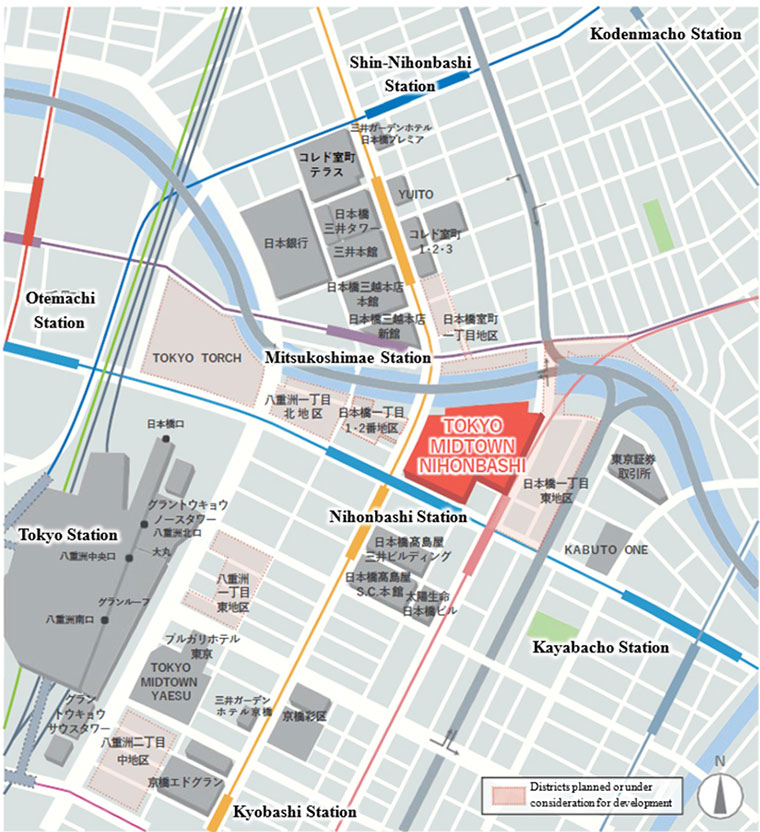
新日本橋駅
Shin-Nihombashi Sta.
■IT・Web
Tenant Relations
■コンサルティング/Consulting
13%
29%
Otemachi One
■建設・建築/Construction
■金融業界/Finance
当社単体テナント
業種別割合
Mitsukoshimae Sta.
■商社/Trading
■飲食/Food & Beverage
Tenant Composition
by Industry
(Non-Consolidated)
日本橋一丁目1・2番地区
■医療・福祉/Medical and welfare
8%
Nihonbashi 1-Chome
1, 2 District Project
日本橋一丁目東地区
東京ミッドタウン日本橋 Nihonbashi 1-Chome
■小売・卸売/Retail & Wholesale
3%
2026年3月末時点
(As of Mar. 31, 2026)
3%
8%
3%
3%
6%
4%
5% 5%
Nihonbashi Muromachi
1-Chome District Project
三越前駅
■不動産/Real estate
10%
日本橋室町一丁目地区
日本橋室町三井タワー
Nihonbashi Muromachi
Mitsui Tower
■機械/Machinery
TOKYO MIDTOWN
NIHONBASHI
■人材/HR
東京駅
■資材・素材/Materials & Raw Materials
Tokyo Sta.
日本橋駅
Nihonbashi Sta.
■その他/Other
East District Project
日本橋髙島屋三井ビルディング
Nihonbashi Takashimaya
Mitsui Building
東京ミッドタウン八重洲
TOKYO MIDTOWN YAESU
YAESU CORE
オフィス平均契約年数の推移
平均契約期間
Trends in Average Office Contract Duration
(2026年3月期:単体)
Average Contract Duration
(FY2025; Non-consolidated)
4.1
4.5
4.8
4.9
4.9
5.0
5.2
5.1
有楽町駅
Yurakucho Sta.
■5年超/Over 5 years
37%
■2年超-5年以下
5.1年
/Over 2 years to 5 years or less
5.1 years
49%
■2年以下/Up to 2 years
2018
MITSUI FUDOSAN CO., LTD.
東京ミッドタウン日比谷
TOKYO MIDTOWN HIBIYA
2019
2020
2021
2022
2023
2024
2025
14%
27
HIBIYA CROSSPARK
2026年度以降の新規プロジェクト(当社関連)
New projects since FY2026
(Involving Mitsui Fudosan)
その他保有物件
Other Group-owned properties
オフィス
主要セグメント
Main segments
Office
賃貸
分譲
マネジメント 施設営業
Leasing
Sales
Management
Facility Operations
○
○
○
○
3 事業状況
Business Situation
空室率の推移
Vacancy Rate
都心5区(資料:三⿁商事)
Central Tokyo 5 Wards(Source: Miki Shoji)
12/6
10.00%
9.43%
03/6, 03/8
9.00%
8.57%
当社(首都圏・単体)
Mitsui Fudosan(Tokyo metropolitan area; non-consolidated)
13/3
8.56%
8.00%
14/3
23/3
6.70%
7.00%
6.00%
6.11%
03/9
14/9
5.8%
5.9% 15/3
21/3
22/3
5.30%
5.42%
6.37%
5.00%
16/3
4.34%
4.00%
13/3
2.49%
3.00%
3.8%
14/3
15/3
3.2%
2.00%
1.00%
0.00%
03/3
04/3
05/3
06/6
07/6
0.9%
0.9%
06/3
07/3
16/3
17/3
2.6%
3.4%
18/3
2.2%
22/3
19/3 20/3
1.78% 1.50%
19/3
1.7%
08/3
09/3
10/3
11/3
12/3
13/3
14/3
15/3
16/3
17/3
18/3
Vacancy Rate
3.86%
18/3
2.80%
3.3%
空室率
(2026年9月末時点)
25/3
17/3
3.60%
07/11
24/3
5.47%
19/3
26/3
3.2%
21/3
2.22%
3.1%
26/9
1.85%
24/3
20/3
2.2
1.9%
20/3
(As of Sep. 30, 2026)
26/9
25/3
26/3
1.3
21/3
22/3
23/3
24/3
0.8%
0.8%
1.6%
25/3
26/3
資料:三⿁商事 /Source: Miki Shoji
今後の開発パイプライン
Future Development
Pipeline
国内
Domestic
主な新規プロジェクト/Major New Projects
*2
竣工年度
FY Completed*2
2026
13物件
13 properties
2027
海外
海外プロジェクト/Overseas projects
*2
所在
Location
プロジェクト名
Project name*2
延床面積*2
Total Floor Space*2
㎡
福岡県福岡市
Fukuoka, Fukuoka
博多新三井ビル建替計画
Hakata Shin-Mitsui Building Redevelopment Plan
約
22,100 ㎡
≈
東京都中央区
Chuo-ku, Tokyo
東京ミッドタウン日本橋
TOKYO MIDTOWN NIHONBASHI
約
386,700 ㎡
≈
東京都港区
Minato-ku, Tokyo
西新橋一丁目6番計画
Nishishinbashi 1-chome District 6 Project
約
18,000 ㎡
≈
東京都中央区
Chuo-ku, Tokyo
日本橋本町三井ビルディング & forest
Nihonbashihoncho Mitsui Building & forest
約
28,000 ㎡
≈
東京都中央区
Chuo-ku, Tokyo
八重洲二丁目中地区
Yaesu 2-Chome Central District Project
約
389,290 ㎡
≈
米国、ボストン
Boston, U.S.
Innovation Square Phase III
約
38,000 ㎡
≈
東京都港区
Minato-ku, Tokyo
高輪三丁目品川駅前地区
Takanawa 3-chome Shinagawa Ekimae District Project
約
186,900 ㎡
≈
東京都中央区
Chuo-ku, Tokyo
日本橋本町一丁目5番街区
Nihonbashihoncho 1-chome District 5 Project
約
18,000 ㎡
≈
東京都港区
Minato-ku, Tokyo
田町駅西口駅前地区
Tamachi Station West Exit Ekimae Area District Project
約
98,570 ㎡
≈
英国、ロンドン
London, U.K.
South Molton Triangle
約
24,000 ㎡
≈
東京都千代田区
Chiyoda-ku, Tokyo
内幸町一丁目北地区
Uchisaiwaicho 1-Chome North District Project
約
270,000 ㎡
≈
55 Pitt Street
約
70,000 ㎡
≈
日本橋室町一丁目地区
Nihonbashi Muromachi 1-Chome District Project
約
115,470 ㎡
≈
日本橋一丁目1・2番地区
Nihonbashi 1-Chome 1, 2 District Project
約
78,330 ㎡
≈
東京都中央区
Chuo-ku, Tokyo
日本橋一丁目東地区
Nihonbashi 1-chome East District Project
約
274,000 ㎡
≈
東京都中央区
Chuo-ku, Tokyo
築地地区
Tsukiji District Project
約
≈
㎡
東京都港区・新宿区
神宮外苑地区
Minato-ku,
Jingu Gaien District Project
Shinjuku-ku, Tokyo
約
≈
㎡
英国、ロンドン
London, U.K.
1-5 Earl Street
約
44,600 ㎡
≈
英国、ロンドン
London, U.K.
大英図書館再開発事業
British Library Redevelopment Project
約
97,000 ㎡
≈
豪州、シドニー
Sydney, Australia
9
*2 竣工年度および延床面積は今後変更となる可能性があります。プロジェクト名は仮称を含みます。
*2 Each FY completed, total floor space may change in the future.
Some project names are tentative.
(2026年6月末時点)
(As of Jun. 30, 2026)
MITSUI FUDOSAN CO., LTD.
延床面積*2
Total Floor Space*2
約
≈
*1 非開示物件を含みます。
*1 Includes undisclosed properties.
9 properties*1
プロジェクト名2
Project name2
所在
Location
東京都中野区
中野M-SQUARE
Nakano-ku, Tokyo Nakano M-SQUARE
Overseas
物件*1
竣工年度*2
FY Completed*2
28
東京都中央区
2028以降
Chuo-ku, Tokyo
2028 or later
東京都中央区
Chuo-ku, Tokyo
オフィス(トピックス)
主要セグメント
Main segments
Office(Topics)
賃貸
分譲
マネジメント 施設営業
Leasing
Sales
Management
Facility Operations
○
○
○
○
3 事業状況
Business Situation
東京ミッドタウン日本橋
YAESU CORE
TOKYO MIDTOWN NIHONBASHI
YAESU CORE
・The first phase of the Nihonbashi River redevelopment project,
comprising a large-scale mixed-use complex positioned to serve as a new landmark.
・Office space is fully leased.
Overall development is scheduled to commence operations in autumn 2027.
・A large-scale mixed-use development directly connected to surrounding facilities,
including TOKYO MIDTOWN YAESU.
・Mitsui Fudosan’s leasing capabilities and ability to plan and provide various physical features
and soft services, etc. have led to multiple tenant contracts at ¥100,000/month per tsubo.
Completion in
Completion in
Sep. 2026
Jan. 2029
48F-51F Residential facility
40F-47F Hotel
(planned)
40F-43F Serviced Apartments
3F-38F Office
3F-6F Theater
10F-38F Office
Zone C
7F-8F Business support facility
3F-4F International school
TOKYO
MIDTOWN
YAESU
5F-7F MICE
B1F-4F Retail facility
B1F-3F Retail facility
B2F-B1F Bus terminal
TOKYO MIDTOWN
NIHONBASHI
YAESU CORE
Zone B
Zone A
Zone A
Zone B
Zone C
Site Area
Approx. 14,747 ft2
(1,370 m2)
Approx. 22,174 ft2
(2,060 m2)
Approx. 167,486 ft2
(15,560 m2)
Site Area
Approx. 210,542 ft2
(19,560 m2)
Total Floor Area
Approx. 57,049 ft2
(5,300 m2)
Approx. 71,042 ft2
(6,600 m2)
Approx. 4,034,314 ft2
(374,800 m2)
Total Floor Area
Approx. 4,190,282 ft2
(389,290 m2)
Number of Floors
4 floors above ground,
2 floors below ground
7 floors above ground,
2 floors below ground
52 floors above ground,
5 floors below ground,
Number of Floors
43 floors above ground,
3 floors below ground
Height
Approx. 33 m
Approx. 32 m
Approx. 284 m
Height
Approx. 227 m
MITSUI FUDOSAN CO., LTD.
29
シェアオフィス
主要セグメント
Main segments
Shared Office
賃貸
分譲
マネジメント 施設営業
Leasing
Sales
Management
Facility Operations
○
○
○
○
3 事業状況
Business Situation
新しい働き方を実現するサービス 法人向けシェアオフィス WORKSTYLING
Services for Realizing New Working Styles: Corporate Shared Offices “WORKSTYLING”
WORKSTYLING 126拠点の分布
/Distribution of 126 WORKSTYLING sites
拠点型
オフィス
Site-based
office
在宅勤務
Work From
Home
法人向けサービスオフィス
Corporate service office
首都圏
98拠点/Sites
近畿圏
12拠点/Sites
その他エリア
16拠点/Sites
Tokyo metropolitan area
Kinki area
法人向け多拠点型サテライトオフィス
Multi-site satellite office for corporations
Other areas
ワークスタイリング SOLO
ワークスタイリング FLEX
ワークスタイリング SHARE
WORKSTYLING FLEX
WORKSTYLING SHARE
個室特化型
札幌
Sapporo
新潟
Niigata
WORKSTYLING SOLO
Private room only type
近畿圏
Kinki area
仙台
Sendai
広島
Hiroshima
会員数
会員企業数
人
member
Members
Member Companies
400,000
約34万人
約1,400社
Approx. 340,000
Approx. 1,400
会員数の推移
Approx. 23 times
596
126
STATION WORKとの提携
470
Partnership with STATION WORK
和歌山
Wakayama
*2 1都3県(東京、神奈川、千葉、埼玉)
*2 Tokyo and 3 prefectures (Kanagawa, Chiba, Saitama)
150,000
WORKSTYLING
名古屋
Nagoya
宮崎
Miyazaki
首都圏2の拠点/Sites in Tokyo metropolitan area2
250,000
200,000
全国拠点数 / Nationwide Sites
首都圏
Tokyo metropolitan area
熊本
Kumamoto
約23倍
350,000
300,000
福岡
Fukuoka
Trends in Number of Members
28
拠点
Sites
都心3区(オフィス集積エリア)
70
拠点
Sites
都心3区外(ターミナル・住宅近傍エリア)
100,000
50,000
0
4/2018
4/2019
4/2020
4/2021
3 wards of central Tokyo
(office aggregation area)
Outside 3 wards of central Tokyo
(Terminal/residential vicinity area)
9/2026
●SHARE LOUNGEおよびRISE-Aとの共同モデル拠点の開設。ワークスタイリングとして空港施設内に初出店。
Opening of a joint-model hub with SHARE LOUNGE and RISE-A. This marks WORKSTYLING’s first location within an airport facility.
中央線 /Chuo Line
ワークスタイリングとカルチュア・コンビニエンス・クラブ株式会社が展開する
東京駅
「SHARE LOUNGE」が連携する共同モデルをベースに、RISE-Aが会員向けの
Tokyo
Station
山手線
サービスオフィスとコミュニティ機能を組み合わせた拠点を新千歳空港内に開設。
Yamanote Line
Based on a collaborative model linking WORKSTYLING and “SHARE
LOUNGE” operated by Culture Convenience Club Co., Ltd., RISE-A has
established a member-focused hub within New Chitose Airport that
combines serviced office and community functions.
MITSUI FUDOSAN CO., LTD.
東海道線 /Tokaido Line
30
ライフサイエンス事業
主要セグメント
Main segments
Life Science Business
賃貸
分譲
マネジメント 施設営業
Leasing
Sales
Management
Facility Operations
○
○
○
○
3 事業状況
Business Situation
ライフサイエンス分野の取り組み
Initiatives in the Field of Life Sciences
■事業方針 / Business Policy
●場の整備 / Developing Sites
2016年、アカデミア有志と共にライフサイエンスに関する一般社団法人「LINK-J」を設立。
「コミュニティの構築」「場の整備」「資金の提供」を通じて、ライフサイエンス領域におけるイノベーション創出を
支援し、新たな需要の創造を目指す。
In 2016, Mitsui Fudosan, together with volunteers from academia, established LINK-J,
a general incorporated association for life sciences. LINK-J supports the creation of
innovation in the life sciences through the building of communities, the development of
places and the provision of funds. The aim is to create new demand.
Number of life science buildings
(Nihonbashi area)
13 buildings
Building Communities
Number of life science–
related Company tenants
(Tokyo and Osaka areas)
Developing Sites
Providing Capital
254 organizations
(As of the end of Sep. 2026)
Lab & Office : Positioned for growth under "& INNOVATION 2030," expanding globally.
Japan:
●コミュニティの構築 / Building Communities
一般社団法人「LINK-J」と連携し、ライフサイエンス
領域での「オープンイノベーションの促進」と
「エコシステムの構築」を目的とした「交流・連携」
および「育成・支援」事業を推進
In cooperation with the general
incorporated association LINK-J, we
promote "interact and cooperate" and
provide "foster and support" projects
aimed at "promoting open innovation"
and "building an ecosystem" in the life
science domain.
Overseas:
6 properties
Number of events in 2025
1,254 times
Changes in membership
1,200
1,041
1,000
854
950
Mitsui Link Lab Toyocho 1
955
(Tentative name) British Library Redevelopment Project
*Including sold and planned properties
800
612
600
200
●資金の提供 / Providing Capital
450
320
400
・Established and have been managing a CVC fund with independent venture
capital firm Axil Capital Group since July 2026, aiming to foster new
102
industries and further invigorate the life sciences ecosystem.
・Executed LP investments in venture capital funds that invest in companies in
the life sciences sector.
0
MITSUI FUDOSAN CO., LTD.
12 properties
31
商業施設
主要セグメント
Main segments
Retail Facilities
賃貸
分譲
マネジメント 施設営業
Leasing
Sales
Management
Facility Operations
○
○
○
○
事業戦略
日本・アジアに広がる施設ポートフォリオ
Business Strategies
Facility Portfolio Spanning Japan and Asia
● 商業施設、スポーツ・エンターテインメント、EC等の各種サービスを組み合わせた、唯一無二の
オムニチャネル基盤を構築。顧客ごとの新たな体験価値を創出する
3 事業状況
Business Situation
施設売上
賃貸収益
貸付面積
Build a one-of-a-kind omni-channel platform that combines various services,
including retail facilities, sports and entertainment, and e-commerce; create
new experiential value by customer.
Facility Revenue
Leasing Revenue
Leased Floor Space
● これまでの事業を通じて培ったリレーションを活かし、出店者・ビジネスパートナーの事業課題を
解決するサービスを提供
Approx. ¥1.9 trillion
Approx.¥334.9 billion
約3,349億円
約3,048千㎡
Leverage relationships cultivated to date through business activities and provide
services to resolve business issues for retail tenants and business partners.
(2026年3月期:連結)
(2026年3月期:連結)
(2026年3月期:連結)
(FY2025; Consolidated)
(FY2025; Consolidated)
(FY2025; Consolidated)
約1.9兆円
● 「商業施設デベロッパー」から「コマーシャル・サービス・プラットフォーマー」への進化を目指し、幅
広く価値提供することにより、収益源を多様化、ビジネスモデル革新を図る
会員数
Members
Work to evolve from a retail facility developer to a commercial service platform
provider; diversify revenue sources and innovate business models by providing a
wide range of value.
約1,450万人
Approx. 14.50 million
テナントとの厚いリレーション
(As of Sep. 30, 2026)
総テナント数(2026年9月末時点)
総出店店舗数(2026年9月末時点)
Total Tenants (As of Sep. 30, 2026)
Total No. of Stores Opened (As of Sep. 30, 2026)
Approx. 11,600
固定賃料と変動賃料比率/Ratio of Fixed & Sales-Linked Rent by Category
2026年3月期(単体) /FY2025 (Non-consolidated)
100%
24%
80%
36%
12%
24%
60%
40%
76%
20%
64%
88%
76%
0%
ららぽーと
アウトレット
その他
全施設計
LaLaport
Outlet
Other
All Facilities
固定賃料/Fixed rent
MITSUI FUDOSAN CO., LTD.
出店分布(ららぽーと・三井アウトレットパーク)
Store Distribution (LaLaport/MITSUI OUTLET PARK)
約11,600店舗
Approx. 2,500
国内22施設
22 domestic facilities
(2026年9月末時点)
Stable Relationships with Tenant Companies
約2,500社
Approx. 3,048 K ㎡
変動賃料/Sales-linked rent
32
国内14施設
14 domestic facilities
商業施設
主要セグメント
Main segments
Retail Facilities
賃貸
分譲
マネジメント 施設営業
Leasing
Sales
Management
Facility Operations
○
○
○
○
3 事業状況
Business Situation
施設売上の比率・推移
Proportion/Trends in Facility Revenue
当社施設(国内)売上高前年同期対比
11%
/Mitsui Fudosan: Year-on-Year Change in Domestic Facility Revenue
年度 /FY
9%
15.0%
2015
2016
2017
2018
2019
2020
2021
2022
2023
2024
2025
2025年度:全国主要SC売上高ランキング
上位10施設中 3施設が当社所有施設
/ FY2025:National Commercial Sales Ranking
3 out of the Top 10 Facilities Owned by Mitsui Fudosan
10.0%
施設種別ごとの
売上比率
5.0%
Facility Revenue Ratio
by Category
56%
3位/3rd
ラゾーナ川崎プラザ
LAZONA Kawasaki plaza
992億円
/¥99.2 B
4位/4th
三井アウトレットパーク木更津
MITSUI OUTLET PARK KISARAZU
792億円
/¥79.2 B
5位/5th
ららぽーとTOKYO-BAY
LaLaport TOKYO-BAY
790億円
/¥79.0 B
0.0%
-5.0%
-10.0%
24%
-15.0%
-20.0%
-25.0%
2026年3月期(単体)
FY2025 (Non-consolidated)
ららぽーと(既存施設)+アウトレット(既存施設 *増床含む)
LaLaport (Existing facilities) & Outlet Park (Existing facilities *Includes expansion of existing facilities)
*当社施設のみ抜粋/Excerpt from our facilities only
(資料:繊研新聞 2026年8月10日付)
Source: SENKEN SHIMBUN, August 10, 2026 Edition
今後の開発パイプライン
Future Development
Pipeline
主な新規プロジェクト/Major New Projects
*1
開業年度
FY Opened*1
国内
Domestic
8物件
8 properties
海外
Overseas
2物件2
2 properties2
2027以降
2027 or
later
海外プロジェクト/Overseas projects
*1
所在
Location
プロジェクト名
Project name*1
店舗面積(延床面積)*1
Store Floor Space
(Total Floor Space)*1
千葉県船橋市
Funabashi, Chiba
ららぽーとTOKYO-BAY 北館(建替え) 2期
LaLaport TOKYO-BAY North Wing
(Reconstruction)(Phase2)
約
≈
60,200
福岡県福岡市
Fukuoka, Fukuoka
三井アウトレットパーク 福岡マリノア
MITSUI OUTLET PARK FUKUOKA
MARINOA
約
≈
43,000
東京都府中市
Fuchu, Tokyo
府中市朝日町商業施設計画
Fuchu-shi Asahicho Project
約
(117,000 ㎡)
≈
台湾、高雄市
Kaohsiung City,
Taiwan
ららぽーと高雄
LaLaport KAOHSIUNG
約
≈
70,000
大規模複合物件プロジェクト/Mixed-use development projects
開業年度*1
FY Opened*1
㎡
㎡
*1 開業年度および面積は今後変更となる可能性があります。プロジェクト名は仮称を含みます。
*1 FY of opening and floor space may change in the future.
Some project names are tentative.
中野M-SQUARE
Nakano M-SQUARE
約
≈
東京都中央区
Chuo-ku, Tokyo
東京ミッドタウン日本橋
TOKYO MIDTOWN NIHONBASHI
約
386,700 ㎡
≈
八重洲二丁目中地区
Yaesu 2-Chome Central District Project
約
389,290 ㎡
≈
内幸町一丁目北地区
Uchisaiwaicho 1-Chome North District
約
270,000 ㎡
≈
東京都中央区
Chuo-ku, Tokyo
築地地区
Tsukiji District Project
約
≈
㎡
東京都港区・新宿区
Minato-ku,
Shinjuku-ku, Tokyo
神宮外苑地区
Jingu Gaien District Project
約
≈
㎡
㎡
大規模リニューアル物件/Large-scale renewal projects
*2 非開示物件を含みます。
*2 Includes undisclosed properties.
実施時期
Execution Period
所在
Location
神奈川県川崎市
Kawasaki, Kanagawa
(2026年6月末時点)
(As of Jun. 30, 2026)
東京都江東区
Koto-ku, Tokyo
2026以降
2026 or later 千葉県柏市
Kashiwa, Chiba
物件名
Project name
33
店舗面積
Store Floor Space
ラゾーナ川崎プラザ
LAZONA Kawasaki plaza
約
79,000 ㎡
≈
ららぽーと豊洲
LaLaport TOYOSU
約
69,000 ㎡
≈
ららぽーと柏の葉
LaLaport KASHIWANOHA
約
42,020 ㎡
≈
神奈川県横浜市
ららぽーと横浜
Yokohama, Kanagawa LaLaport YOKOHAMA
MITSUI FUDOSAN CO., LTD.
延床面積*1
Total Floor Space*1
東京都中野区
Nakano-ku, Tokyo
東京都中央区
Chuo-ku, Tokyo
2027以降
2027 or later 東京都千代田区
Chiyoda-ku, Tokyo
㎡
プロジェクト名1
Project Name1
所在
Location
約
93,000 ㎡
≈
物流施設・データセンター
主要セグメント
Main segments
Logistics Facilities ・ Data Centers
賃貸
分譲
マネジメント 施設営業
Leasing
Sales
Management
Facility Operations
○
○
○
○
事業戦略
展開エリア
Business Strategies
Business Development Area
●街づくり型物流施設の開発や、ソリューション提供による物流業界の課題解決を通じ、
物流事業の成⾧を加速する
全体
Overall
90
Domestic
71
首都圏
Tokyo metropolitan area
42
中京圏
Chukyo area
5
近畿圏
Kinki area
9
九州圏
Kyushu area
3
その他
Other
12
Overseas
19
国内
Accelerate the growth of our logistics business by developing neighborhood creation-type
logistics facilities and addressing challenges in the logistics industry through the provision of solutions.
●データセンター事業を主軸に研究開発領域等のインダストリアル領域への事業拡大を通じ、
新たな成⾧基盤を構築する
Build a new foundation for growth by expanding our business into the industrial asset domain,
including research and development (R&D) facilities, with our data center business at its core.
3 事業状況
Business Situation
海外
米国
U.S.
英国
U.K.
4
3
APAC
APAC
12
優良なポートフォリオ
An Excellent Portfolio
当社過去開発物件を含む累計
Cumulative totals including properties previously developed by the Company
国内外の開発・運営施設数
当社保有・稼働中の国内施設(ML含む)
Facilities under development or operation
in Japan and overseas
Domestic facilities owned and in
operation(Including master leases)
施設数
Number of Properties
累計総投資額
Cumulative Investment
施設数
Number of Properties
計90物件
Total 90 properties
約1兆4,500億円
Approx. ¥1.45 trillion
計19物件
Total 19 properties
総延床面積
Total Floor Space
総延床面積
Total Floor Space
約650万㎡
Approx. 6.5 million ㎡
約230万㎡
Approx. 2.3 million ㎡
MITSUI FUDOSAN CO., LTD.
*上記の国内71物件(物流施設62物件、データセンター9物件)に、
海外19物件(米国・英国・APAC)を加えた全90物件が当社開発・運営施設
*The above 71 domestic properties (62 logistics facilities and 9 data centers)
and 19 overseas properties (in the U.S., U.K., and APAC) comprise a total of 90 properties
developed and operated by our company.
34
物流施設・データセンター
主要セグメント
Main segments
Logistics Facilities ・ Data Centers
厚い荷主ネットワーク
Strong Shipper Network
事業拡大の実績
賃貸
分譲
マネジメント 施設営業
Leasing
Sales
Management
Facility Operations
○
○
○
○
当社保有・開発中(右軸)
売却済(右軸)
Owned and under development (right axis)
Business Expansion
Sold (right axis)
3 事業状況
Business Situation
90物件/
総延床面積(左軸)
Properties
Total floor space (left axis)
87物件/
76物件/
オフィステナント数
(2026年3月期末時点)
Office Tenants(FY2025)
約3,000社
Approx. 3,000
properties
67物件/
600
56物件/
500
三井不動産ロジスティクスパーク投資法人設立
ロジスティクス・データセンター
事業開始
400
22物件/
)
約2,500社
Approx. 2,500
約200万㎡
22物件/ Approx.
2.0Mil. ㎡
7物件/
約80万㎡
9物件/
Approx. 0.8Mil. ㎡ properties
0
(10,000㎡)
9
2012
2013
properties
31
27
16
20
13
19
20
2017
2018
15
40
24
7
22
13
60
34
properties
9
40
40
properties
properties
13物件/
properties
100
7
properties
47物件/
33物件/
28物件/
properties
Properties
200
46物件/
properties
Properties
商業施設テナント数
40物件/
Mitsui Fudosan Logistics Park Inc. established
Logistics・Data centers
Business started
(As of Sep. 30, 2026)
80
properties
300
(2026年9月末時点)
約650万㎡
properties Approx. 6.5Mil. ㎡
24
26
23
2019
2020
2021
29
36
42
47
50
2025
2026
20
0
2014
2015
2016
2022
2023
2024
(物件)
(Property)
(2026年9月末時点
(As of Sep. 30, 2026)
今後の開発パイプライン
Future Development Pipeline
海外プロジェクト/Overseas projects
主な新規プロジェクト(物流施設)/Major New Projects(Logistics Facilities)
竣工年度*2
FY Completed*2
国内
Domestic
12物件*1
12 properties*1
海外
Overseas
13
物件*1
13 properties*1
(2026年6月末時点)
(As of Jun. 30, 2026)
MITSUI FUDOSAN CO., LTD.
2026
所在
Location
プロジェクト名2
Project name2
延床面積*2
Total Floor Space*2
神奈川県海老名市
Ebina, Kanagawa
MFIP 海老名 &forest
MFIP EBINA &forest
約
40,000 ㎡
≈
埼玉県三郷市
Misato, Saitama
MFLP三郷
MFLP MISATO
約
47,000 ㎡
≈
京都府八幡市
Yawata, Kyoto
MFLP・LOGIFRONT 京都八幡Ⅰ
MFLP・LOGIFRONT
KYOTOYAWATAⅠ
約
80,000 ㎡
≈
埼玉県北葛飾郡
Kitakatsushika, Saitama
MFLP杉戸
MFLP SUGITO
約
13,000 ㎡
≈
大阪府大阪市
Osaka, Osaka
SGリアルティ・MFLP大阪加島
SG Realty・MFLP OSAKA
KASHIMA
約
211,000 ㎡
≈
茨城県ひたちなか市
Hitachinaka, Ibaraki
(仮称)水戸ロジセンター
(Tentative)MITO LOGI CENTER
約
125,000 ㎡
≈
MFLP・LOGIFRONT 京都八幡Ⅱ
MFLP・LOGIFRONT
KYOTOYAWATAⅡ
約
162,000 ㎡
≈
Wilson’s Lane
約
50,000 ㎡
≈
英国、ヒースロー
Heathrow,U.K.
Heathrow Central Way
約
≈
㎡
英国、ウォリントン
Warrington,U.K.
Hardwick Grange
約
≈
㎡
マレーシア、スバン
Subang, Malaysia
約
23,600 ㎡
Subang MRO & Logistics Facility
≈
2027以降
2027 or later 京都府八幡市
Yawata, Kyoto
英国、コベントリー
Coventry, U.K.
35
主な新規プロジェクト(データセンター)/Major New Projects(Data centers)
竣工年度*2
FY Completed*2
2026
所在
Location
プロジェクト名2
Project name2
延床面積*2
Total Floor Space*2
神奈川県相模原市
Sagamihara, Kanagawa
相模原データセンター計画
Sagamihara Data Center Project
インド、ムンバイ
Mumbai, India
CapitaLand DC Mumbai
約
85,100 ㎡
≈
東京都日野市
Hino-Shi, Tokyo
日野データセンター計画
Hino Data Center Project
未定
TBD
データセンター計画
Data Center Project
未定
TBD
地中型データセンター事業
Underground Data Center Business
未定
TBD
関西エリア
Kansai Area
2027以降
兵庫県神戸市
2027 or later
Kobe, Hyogo
未定
TBD
インド、ハイデラバード
Hyderabad, India
CapitaLand DC Hyderabad
約
43,500 ㎡
≈
インド、チェンナイ
Chennai, India
CapitaLand DC Chennai
約
43,700 ㎡
≈
*1 非開示物件を含みます。
*1 Includes undisclosed properties.
*2 竣工年度および延床面積は今後変更となる可能性があります。プロジェクト名は仮称を含みます。
*2 Each FY completed, total floor space may change in the future.
Some project names are tentative.
国内住宅分譲
主要セグメント
Residential Property Sales to Individuals(Domestic) Main segments
賃貸
分譲
マネジメント 施設営業
Leasing
Sales
Management
Facility Operations
○
○
○
○
3 事業状況
Business Situation
事業戦略
計上予定戸数と進捗状況
Business Strategies
Planned Units to be Recorded and Progress
● 「あたかも一つの会社」のようにグループ各社の連携を継続強化することで顧客への提案力を強化
マンション契約計上戸数
Further strengthen collaboration among Group companies to enhance the ability to make
proposals to customers, operating as if they were a single company.
Contract Progress Rate
2,350戸
2,350 units
93%
●三井のすまいLOOP会員制度の見直しによる会員との接点・ロイヤルティ強化
Strengthen customer touchpoints and loyalty by reviewing the Mitsui Housing Loop
membership program.
●お客様のあらゆるニーズにワンストップでサービスを提供
2027年3月期:通期予想
FY2026, Full-year Forecast
Provide one-stop services to meet every customer need.
住宅分譲営業利益・営業利益率の推移
Residential Property Sales to Individuals Operating Income and Operating Margin
マンション計上戸数、完成在庫、平均販売価格の推移
Condominiums – Trend of Units booked , Year-End Inventories , and Average Sales Price
営業利益(左軸)
営業利益率(右軸)
計上戸数(左軸)
期末完成在庫戸数(左軸)
平均販売価格(右軸)
Operating income (Left)
OP margin (Right)
Unit booked (Left)
Year-end inventories (Left)
Average sales price (Right)
十億円
Billions of yen
25.0
112.0
140.0
130.0
4,391
120.0
20.0
4,000
3,283
14.6
11.3
9.7
11.0
8.1
65.0
12.3
9.8
9.3
40.0
40.0
30.6
31.1
23.9
26.6
3,775
3,707
15.8
80.0
49.7
150.0
5,000
21.0
96.4
100.0
145.9
5,200
23.3
120.0
百万円
Millions of yen
戸
Units
%
25.5
60.0
契約進捗率
Number of Condominium
Contracts Booked
15.0
3,693
3,194
3,208
3,196
10.0
2,000
90.0
2,747
76.8
57.7
53.3
85.5
64.4
76.8 73.9
2,350
80.0
70.0
73.7
66.6
60.0
29.6
50.0
24.0
5.0
20.0
1,000
40.0
321
88
0.0
108
141
128
150
82
55
24
32
30.0
36
0
0.0
20.0
FY
FY
FY
FY
FY
FY
FY
FY
FY
FY
FY
FY
FY
FY
FY
FY
FY
FY
FY
FY
FY
FY
FY
FY
2015
2016
2017
2018
2019
2020
2021
2022
2023
2024
2025
2026
2015
2016
2017
2018
2019
2020
2021
2022
2023
2024
2025
2026
予想
(Forecast)
MITSUI FUDOSAN CO., LTD.
110.0
100.0
102.2
3,000
39.3
114.8
3,280
予想
(Forecast)
36
国内住宅分譲
Residential Property Sales to Individuals (Domestic)
マンションブランド・地域別売上比率*1
Sales by Brand & Region
主要セグメント
Main segments
賃貸
分譲
マネジメント 施設営業
Leasing
Sales
Management
Facility Operations
○
○
○
○
3 事業状況
Business Situation
再開発を中心とした豊富なパイプライン
An Abundant Pipeline Focusing Mainly on Redevelopment
ブランド別売上割合
PARK HOMES
Sales by Brand
PARK LUXE
短期回転型中小型物件
Middle-grade
condominiums
22%
主な計上年度3
Major FY to be
Reported3
PARK MANSION
PARK COURT
大規模物件
Large-scale
developments
20%
高額物件
High-grade
condominiums
2026
58%
PARK TOWER
PARK CITY
地域別売上割合
その他・地方
Other regions
関西・中部
3%
Kansai and Chubu
8%
2027
Tokyo Metropolitan Area
89%
パークシティ中野 ザ タワー エアーズ/ザ タワー ブリーズ
東京都品川区
Shinagawa-ku, Tokyo
パークコート池田山*5
東京都港区
Minato-ku, Tokyo
パークコート青山高樹町 ザ タワー
50
千葉県市川市
Ichikawa, Chiba
リーフシティ市川 ザ・タワー
670
東京都江戸川区
Edogawa-ku, Tokyo
パークシティ小岩 ザ タワー
520
An Abundant Land Bank
8,800
9,000
約24,600
9,00戸*2
0
Approx. 24,600
戸
units
26-28年度
FY2026-28
29-31年度
FY2029-31
32年度以降
FY2032 or later
6,800
*2 計画段階の再開発事業を含む
Incl. redevelopment project in the planning phase
MITSUI FUDOSAN CO., LTD.
PARK COURT EBISU
PARK CITY NAKANO THE TOWER AIRZ/THE TOWER BREEZE
PARK COURT IKEDAYAMA
PARK COURT AOYAMA TAKAGICHO THE TOWER
LEAF CITY ICHIKAWA THE TOWER
PARK CITY KOIWA THE TOWER
① THE TOYOMI TOWER MARINE&SKY
400
20
1,510
パークタワー大阪堂島浜
360
千葉県柏市
Kashiwa, Chiba
パークタワー柏の葉キャンパス
600
千葉県千葉市
Chiba, Chiba
幕張ベイパーク ブルームテラスタワー
650
PARK TOWER OSAKA DOJIMAHAMA
PARK TOWER KASHIWANOHA CAMPUS
MAKUHARI BAY-PARK BLOOM TERRACE TOWER
② PARK TOWER SHIBUYA SASAZUKA
パークタワー渋谷笹塚
640
東京都千代田区
Chiyoda-ku, Tokyo
パークコート千代田麹町
40
東京都文京区
Bunkyo-ku, Tokyo
パークコート御茶ノ水 ザ タワー
260
京都府向日市
Muko, Kyoto
J.GRAN TOWER 京都向日町
270
PARK COURT CHIYODA KOJIMACHI
PARK COURT OCHANOMIZU THE TOWER
J.GRAN TOWER KYOTO MUKOMACHI
③ CENTRAL GARDEN TSUKISHIMA THE TOWER
千葉県船橋市
Funabashi, Chiba
東京都港区
Minato-ku, Tokyo
BLUE FOREST RESIDENCE MINAMI FUNABASHI
④ PARK COURT AZABUJUBAN TOKYO THE TOWER NORTH/THE TOWER SOUTH
パークコート麻布十番東京 ザ タワー ノース/ザ タワー サウス
一番町ロイアルハイツ建替え事業*5
Ichibancho Royal Heights Redevelopment Project
東京都中央区
Chuo-ku, Tokyo
勝どき東地区 B棟*5
東京都足立区
Adachi-ku, Tokyo
パークタワー千住大川端
東京都渋谷区
Shibuya-ku, Tokyo
幡ヶ谷二丁目計画*5
東京都荒川区
Arakawa-ku, Tokyo
三河島駅前北地区*5
東京都葛飾区
Katsushika-ku, Tokyo
東金町一丁目西地区*5
東京都港区
Minato-ku, Tokyo
Honda青山ビル共同建替え計画*6
Kachidoki East District Project, Building B
PARK TOWER SENJU OKAWABATA
Hatagaya 2-Chome Project
Mikawashima Station North District Project
Higashikanamachi 1-Chome West District Project
Joint Redevelopment Plan for the Honda Aoyama Building
*3 計上年度、総販売戸数は今後変更となる可能性があります。プロジェクト名は仮称を含みます。
FY to be reported and total number of units sold may change in the future. Some project names are tentative.
*4 シェア勘案前 The total number of units is before taking into account the Company's share.
*5 地権者住戸等を含む総戸数 Total number of units including units owned by landowners, etc.
*6 共同事業による建替計画(現時点でアセット詳細未定)Reconstruction plan through a joint project (details of the asset are undecided at this stage)
37
①
80
大阪府大阪市
Osaka, Osaka
2028以降
東京都千代田区
2028 or later Chiyoda-ku, Tokyo
豊富なランドバンク
Total No. of Units
Sold34
東京都中野区
Nakano-ku, Tokyo
東京都中央区
Chuo-ku, Tokyo
*1 2025年度末時点三井不動産レジデンシャル実績に基づく
Based on Mitsui Fudosan Residential results (FY2025)
総販売戸数34
パークコート恵比寿*5
東京都渋谷区
Shibuya-ku, Tokyo
首都圏
Major large-scale projects and high-end projects*3
東京都渋谷区
Shibuya-ku, Tokyo
東京都中央区
Chuo-ku, Tokyo
Sales by Region
主な大規模プロジェクト・ハイエンド向けプロジェクト*3
所在
Location
②
③
510
910
760
50
400
590
430
600
860
ー
④
投資家向け分譲等
主要セグメント
Main segments
Property Sales to Investors, etc.
賃貸
分譲
マネジメント 施設営業
Leasing
Sales
Management
Facility Operations
○
○
○
○
3 事業状況
Business Situation
販売用不動産資産残高・稼働物件利回り・売却実績(2026年3月期)
Real Property for Sale Outstanding Assets/Returns from Operating Properties/Sale Results(FY2025)
オフィス
Office 8%
過去に売却した主な資産の事例 / Examples of major assets sold in the past
売却年度
FY to be
sold
商業
Retail 7%
FY2022
FY2023
開発中資産
Under Development
35%
2026年3月期末簿価
Book value at
the end of Mar. 2026
1.84兆円1
¥1.84trillion1
国内
Domestic
43%
物流
Logistics
15%
FY2025
FY2026
稼働資産
Operating Asset
65%
賃貸住宅
Rental Housing
海外
Overseas
22%
稼働資産 / Operating Asset
期待NOI利回り
Expected NOI yield
7.0%
うち、国内 / Domestic
7.6%
うち、海外 / Overseas
5.8%
MITSUI FUDOSAN CO., LTD.
12%
その他
Other 1%
FY2024
十億円
Billions of yen
*1 資産割合の内訳 / Asset breakdown
38
用途
Use
物件名
Project Name
利回り2
Yield2
オフィス
Office
豊洲ベイサイドクロスタワー
TOYOSU BAYSIDE CROSS
TOWER
3.3%
オフィス
Office
飯田橋グラン・ブルーム
Iidabashi Grand Bloom
2.7%
物流
Logistics
物流施設5物件
5 logistics facility buildings
商業
Retail
新川崎スクエア
Shin-Kawasaki Square
4.2%
オフィス
Office
豊洲ベイサイドクロスタワー
TOYOSU BAYSIDE CROSS
TOWER
3.3%
商業
Retail
ららぽーと愛知東郷
LaLaport AICHI TOGO
4.7%
オフィス
Office
横浜三井ビルディング
Yokohama Mitsui Building
3.5%
物流
Logistics
物流施設3物件
3 logistics facility buildings
4.0~4.2%
オフィス
Office
豊洲ベイサイドクロスタワー
TOYOSU BAYSIDE CROSS
TOWER
3.3%
オフィス
Office
日本橋本町M-SQUARE
Nihonbashi Honcho
M-SQUARE
3.2%
物流
Logistics
物流施設2物件
2 logistics facility buildings
*2 売却先にて開示された、当該物件の鑑定評価に基づく直接還元利回りを記載
*2 Describes the direct capitalization yield based on the appraisal value of the property,
disclosed by the buyer.
3.3~4.6%
3.8~4.5%
プロパティマネジメント
主要セグメント
Main segments
Property Management
賃貸
分譲
マネジメント 施設営業
Leasing
Sales
Management
Facility Operations
○
○
○
○
3 事業状況
Business Situation
貸し駐車場の運営管理(リパーク事業)、オフィス・商業・住宅等の預かり資産の運営管理など
Operation and Management of Car Park Leasing (Repark), Assets in Custody (Office, Retail, Housing, etc.)
プロパティマネジメントの営業利益推移
貸し駐車場(リパーク)
Trends in Operating Income for Property Management
Car Park Leasing (Repark)
「三井のリパーク」は1994年のスタート以来、日本全国で駐車場事業を展開。駐車場経営のサポートを
通じて土地の有効活用を行うなど、活気ある街づくりに貢献。
In the years since it was first established in 1994, Mitsui Repark has expanded its parking business
throughout Japan. We are contributing to creating neighborhoods full of vitality by making
effective use of land with the support of our parking area management.
十億円
Billions of yen
44.3
45
40
37.5
35
30
32.7
32.5
29.9
28.9
38.5
管理台数
Managed Units
38.4
約25万台
Approx. 250 K units
31.2
30.2
リパーク駐車場管理台数推移
Car Park Leasing Track Record
台
Units
268,771
273,704
251,506 250,515
245,511
250,000
247,046 247,740
252,857
226,125
25
21.8
210,549
200,000
20
191,450
15
150,000
10
5
0
100,000
FY
FY
FY
FY
FY
FY
FY
FY
FY
FY
FY
FY
FY
FY
FY
FY
FY
FY
FY
FY
FY
FY
2015
2016
2017
2018
2019
2020
2021
2022
2023
2024
2025
2015
2016
2017
2018
2019
2020
2021
2022
2023
2024
2025
運営管理委託(オフィス・商業・住宅等)(2026年3月期)
Contracted Operation and Management (Office, Retail, Housing, etc.) (FY2025)
オフィス/Office Buildings
商業/ Retail Facilities
貸付面積
Leased Floor Space
貸付面積
Leased Floor Space
マンション分譲戸数
Condominium Units Sold
マンション管理戸数
Condominium Units Managed
約3,586千㎡
Approx. 3,586 K ㎡
約3,048千㎡
Approx. 3,048 K ㎡
約26万戸1
Approx. 260 K units1
約30万戸
約16万戸
Approx. 300 K units
Approx. 160 K units
(連結)
(Consolidated)
(連結)
(Consolidated)
*1 1984年以降、共同事業のシェア考慮前の数値
*1 Since 1984; does not take into
account sharing businesses
⾧年の実績の中で培われたノウハウに加え、当社グ
ループの総合力を活かしたマンション管理サービスを
提供
Our condominium management service
draws on the know-how we have
accumulated through years of successful
operations, and the collective strengths of
the group as a whole.
建物オーナー・入居者の双方に対して、賃貸マンショ
ンの運営・仲介に関するサービスを提供
We provide rental condominium operation
and brokerage services for building
owners and tenants.
MITSUI FUDOSAN CO., LTD.
住宅/ Housing
39
賃貸住宅管理戸数
Rental Housing Units Managed
仲介・アセットマネジメント
主要セグメント
Main segments
Brokerage, Asset Management
賃貸
分譲
マネジメント 施設営業
Leasing
Sales
Management
Facility Operations
○
○
○
○
3 事業状況
Business Situation
個人向け仲介(リハウス事業)、REIT等のアセットマネジメントなど
Brokerage for Individuals (Rehouse), Asset Management such as REITs, etc.
仲介・アセットマネジメントの営業利益の推移
REIT等からの預かり資産の拡大
Trends in Operating Income from Brokerage and Asset Management
Expanded Assets under Custody through REITs, etc.
十億円
Billions of yen
40.0
36.5
33.1
35.0
兆円
Trillions of yen
6.00
30.0
25.0
預かり資産残高・比率(2026年3月期)
Assets under Management (FY2025)
25.9 25.8
22.4
21.2
20.0
27.7
5.00
23.2 22.8
19.8
4.00
18.0
3.47 3.61
3.73
3.92 3.98
4.35
4.59 4.65 4.72
5.12
プライベートファンド等
Private fund, etc.
5.31
29%
29%
3.00
15.0
10.0
2.00
5.0
1.00
0.0
Mitsui Fudosan
Accommodations
Fund
6%
オリジネーター
Originator
7%
18%
11%
0.00
FY
FY
FY
FY
FY
FY
FY
FY
FY
FY
FY
FY
2015 2016 2017 2018 2019 2020 2021 2022 2023 2024 2025
FY
FY
FY
FY
FY
FY
FY
FY
FY
FY
2015 2016 2017 2018 2019 2020 2021 2022 2023 2024 2025
*18/3期以前の数値は旧セグメント「三井ホーム」の賃貸管理における営業利益を除く。 19/3期は組み換え後の数値を基に算出
*Figures for FY2017 and earlier exclude operating income in the former segment "Mitsui Home" for rental
management. In FY2018, figures were calculated based on the reclassified segments
Mitsui Fudosan Logistics Park Inc.
仲介取扱件数40年*連続No.1「三井のリハウス」
リハウス仲介件数推移
Trends in Number of Brokerages for Rehouse
Mitsui Rehouse No.1 for 40 consecutive years * (number of brokerages handled)
売買仲介実績/Brokerage Market( 2025年度/FY2025 )
手数料収入(十億円)
Fee/Revenue
(Billions of yen)
件/Brokerages
取扱件数(件)
Transactions
(Units)
取扱高(十億円)
Transaction volume
(Billions of yen)
44,000
店舗数(店)
Number of stores
1
三井不動産リアルティ
Mitsui Fudosan Realty
106.9
36,220
2,287.9
269
2
A社/Company A
109.3
33,922
2,563.5
229
3
B社/Company B
73.2
28,848
1,488.4
168
4
C社/Company C
62.8
10,643
1,587.0
99
5
D社/Company D
32.9
9,268
771.0
73
資料:(株)不動産経済研究所『日刊不動産経済通信(2026.5.25)』
Source: “Fudousan Keizai Tsushin (The Real Estate Business Daily),” May 25, 2026,
Real Estate Economic Institute Co., Ltd.
MITSUI FUDOSAN CO., LTD.
*1986年度から2025年度まで/FY1986-FY2025
42,818
41,533
42,000
40,000
38,000
41,183
40,658
38,612
39,106
38,507
37,827
38,680
38,103
36,220
36,000
34,000
32,000
40
FY
FY
FY
FY
FY
FY
FY
FY
FY
FY
FY
2015
2016
2017
2018
2019
2020
2021
2022
2023
2024
2025
ホテル・リゾート
主要セグメント
Main segments
Hotels and Resorts
賃貸
分譲
マネジメント 施設営業
Leasing
Sales
Management
Facility Operations
○
○
○
○
3 事業状況
Business Situation
事業戦略
稼働率・ADRの推移(国内宿泊主体型ホテル)
Business Strategies
Trends in Occupancy Rate/ADR(Lodging-focused domestic hotels)
●顧客体験・提供サービスを向上することで、上質な滞在価値を提供
さらに、ホテルのブランド力を強化することで、顧客拡大・収益拡大を実現
国内宿泊主体型ホテル 稼働率(2027年3月期第2四半期平均)
84%
Lodging-focused domestic hotels Occupancy Rate
(Average of 2Q, FY2026)
Provide high-quality stay value by improving the customer experience and available services.
Expand the customer base and earnings by further enhancing the brand strength of hotels.
●顧客データ活用により、パーソナライズされた滞在体験を提案、国内外の顧客層を拡大
稼働率(左軸)
Average Occupancy Rate(Left)
(%)
Propose personalized stay experiences through the use of customer data and expand the
domestic and international customer bases.
ADR(右軸)
ADR(Right)
(円/Yen)
100
30,000
90
25,000
80
優良なポートフォリオ
70
20,000
当社直営施設(国内外含む)
60
Facilities Directly Operated by the Company
(Domestic and overseas)
15,000
50
An Excellent Portfolio
10,000
40
52施設約13,100室
30
Total 52 Approx. 13,100 rooms
FY2015
FY2016
FY2017
FY2018
FY2019
FY2020
FY2021
FY2022
FY2023
FY2024
FY2025
5,000
(室数/Approx. Rooms)
全体
Overall
13,100
リゾート・ラグジュアリー
Resorts and Luxury hotels
2,100
宿泊主体型ホテル
Lodging-focused hotels
11,000
首都圏
Tokyo metropolitan area
6,700
近畿圏
Kinki area
1,600
その他
Other
2,700
Future Development Pipeline
約920室
Approx. 920 rooms
海外プロジェクト/Overseas projects
主な新規プロジェクト/Major New Projects
100室以下を四捨五入しているため合計が一致しない場合があります
The totals may not add up due to rounding to the
nearest 100 rooms.
開業年度
FY Opened
所在
Location
HOTEL THE MITSUI HAKONE
2026
神奈川県足柄下郡
Ashigarashimo-gun,
Kanagawa
約
室
130
≈
Rooms
大阪府大阪市
Osaka, Osaka
大阪市北区堂島浜二丁目計画
Osaka City Kita-ku Dojimahama 2-Chome Project
約
室
220
≈
Rooms
東京都中央区
Chuo-ku, Tokyo
ウォルドーフ・アストリア東京日本橋
Waldorf Astoria Tokyo Nihonbashi
約
室
200
≈
Rooms
岐阜県高山市
Takayama, Gifu
岐阜県高山市ホテル計画
Takayama City, Gifu Prefecture Hotel Project
約
室
190
≈
Rooms
神奈川県三浦市
Miura,Kanagawa
三浦半島油壺エリアリゾートホテル事業計画
Miura Peninsula Aburatsubo Resort Hotel Business
未定
TBD
東京都港区
Minato-ku, Tokyo
神宮外苑地区野球場併設ホテル計画
Jingu Gaien Area Hotel Project with an Adjacent Baseball Stadium
未定
TBD
東京都中央区
Chuo-ku,Tokyo
築地地区
Tsukiji District Project
未定
TBD
台湾、台北市
Taipei City, Taiwan
敦化北路ホテル
Dunhua North Road Hotel Project
●ミシュランガイドによる国内最高評価7施設中、4施設*が当社施設
4* of the 7 highest rated facilities in Japan
2027以降
2027 or
later
by MICHELIN Guide are our facilities
*BVLGARI HOTEL TOKYO、FOUR SEASONS HOTEL TOKYO AT OTEMACHI、
AMANEMU、HOTEL THE MITSUI KYOTO
MITSUI FUDOSAN CO., LTD.
客室数(海外を含む)
No. of rooms(Including overseas)
今後の開発パイプライン
41
プロジェクト名
Project Name
客室数
No. of Rooms
約
室
180
≈
Rooms
スポーツ・エンターテインメント
主要セグメント
Main segments
Sports & Entertainment
賃貸
分譲
マネジメント 施設営業
Leasing
Sales
Management
Facility Operations
○
○
○
○
東京ドーム
3 事業状況
Business Situation
アリーナ事業
Tokyo Dome
Arena
Kasuga Sta.
Korakuen
Sta.
●近隣の商業施設や当社ECモールと連携した取り組みにより、
お客様の体験価値を最大化
LaQua
area
N
By leveraging initiatives in collaboration with our nearby commercial facilities
and our EC mall, we maximize the value of the customer experience.
Approx.
10,000- LaLa arena TOKYO-BAY
person
(Completed in Apr. 2024)
capacity
LaLaport TOKYO-BAY
Tokyo Dome
東京ドームシティ来場者(FY2019)
SuidoBashi
Sta.
Attractions
area
Visitors to Tokyo Dome City(FY2019)
約 4,000万人/年
Approx. 40M people/year
東京都心の広大な敷地
Korakuen Prism Hall
Hall Building
Approx.
10,000-
Tokyo Dome
Hotel
MEETS PORT
area
IMM THEATER
Yellow
Building
Vast site in central Tokyo
person
capacity
(Tentative name)
Nagoya Arena
(Scheduled for completion in fall 2027)
LaLaport NAGOYA
Minato Aquls
約 13 ha
Approx. 13 ha
●東京ドームシティ事業収益の源泉 / Tokyo Dome City Business Sources of Revenue
Tokyo Dome
・Revenue from events
(professional baseball games and music concerts, etc.)
・Food and beverage
/merchandise revenue
・Advertising revenue
LaQua
Tokyo Dome Hotel
Others*
●大規模アリーナの開発パイプライン /Large-scale arena development pipeline
Approx.
20,000・Revenue from facility operations
(attractions, hot baths, etc.)
・Retail tenant leasing revenue
・Accommodation revenue
・Food and beverage revenue
・Revenue from hall use
・Revenue from facility operations
(attractions, amusement facilities, etc.)
person
capacity
(Tentative name)
New Prince Chichibu Memorial Rugby Stadium
(Scheduled to open in 2030)
・Retail tenant leasing revenue
・Revenue from hall use
*Yellow Building, Korakuen Hall Building, Tokyo Dome City Attractions, MEETS PORT, PRISM HALL, IMM THEATER, etc.
●大規模リニューアル / Large-scale renovation
外観イメージ
Exterior image
ラグビー利用時のイメージ
Image for rugby use
Approx.
12,500- (Tentative name)
person
capacity
魅力溢れる観客席の新設
Installation of attractive seating
MITSUI FUDOSAN CO., LTD.
LaQua(商業&アトラクション)
LaQua Retail & Amusement park
東京ドームホテル 客室リニューアル
Tokyo Dome Hotel : Guest Room Renovation
42
Kubota LaLa arena
Kubota, Mitsui Fudosan, and Kanden Realty & Development have entered into a basic
agreement regarding the redevelopment of the former Kubota headquarters site in Naniwa
Ward, Osaka. The companies will begin detailed studies on a mixed-use development centered
around a multipurpose arena, with plans also including a hotel and retail facilities.
海外事業
主要セグメント
Main segments
Overseas Business
賃貸
分譲
マネジメント 施設営業
Leasing
Sales
Management
Facility Operations
○
○
○
○
3 事業状況
Business Situation
海外事業展開エリア
At a Glance of Our Overseas Business
Maple Terrace / Dallas
Housing
50&55Hudson Yards / New York
エリア別資産残高
Overseas Assets By Area
(2026年3月期末時点)
(As of the end of FY2025)
海外
Overseas
国内
Domestic
68%
Television Centre/ London
Office
Office
総資産
10.1兆円
Housing
MITSUI OUTLET PARK LINKOU / Taipei
Retail
Office
LaLaport TAIPEI NANGANG/ Taipei
Retail
U.S.
● 当社グローバルネットワーク(現地拠点)
Our Global Network (Local Offices)
¥1.9trillion
3.1兆円
U.K.
¥3.1trillion
¥0.4trillion
32%
Total Assets
¥10,103 billion
APAC
¥0.7trillion
2026年6月末時点稼働物件数
Number of properties in operation as of
the end of Jun. 2026
Europe
and
the U.S.
APAC
Office
16
2
Retail Facilities
11
Rental Housing
19
1
Hotels,SA,
Logistics Facilities
4
10
Halekulani / Honolulu
Hotel and Resort
MITSUI FUDOSAN CO., LTD.
Mission Rock / San Francisco
Housing
Office
1251 Avenue of
the Americas / New York
RMZ Ecoworld 30 /Bengaluru
Office
Office
43
Somerset Rama 9 /Bangkok
SA
55 Pitt Street /Sydney
Office
海外事業
主要セグメント
Main segments
Overseas Business
米国事業のポートフォリオ
Our Portfolio in the U.S.
分譲
マネジメント 施設営業
Leasing
Sales
Management
Facility Operations
○
○
○
○
3 事業状況
Business Situation
50 Hudson Yards / 55 Hudson Yards / 1251 Avenue of the Americas
(As of the end of FY2025)
Others, Cash and Deposits,
and Other Current Assets
Approx.10%
●Prime Office Portfolio in New York City's Manhattan
❸Sun Belt
50&55
Hudson Yards
Approx.10%
❷West Coast
Approx. 20%
賃貸
●The unrealized gain from these
Total of 3 properties:
1251
Avenue of the Americas
900 billion
Approx.¥
Slightly less than 1/4 of the total
Asset Balance
Breakdown
by Area in the U.S.
3
properties
❶ East Coast
Approx. 60%
1.2
¥
trillion
●Investment Balance Breakdown by Area and Asset Type
(Aggregated for completed operating properties and properties
under development)
❶East Coast
Rental
Housing
Condominiums
other
Office
Owning Three
Prime Office
Properties
in NY and Others
Office
Approx.90%
Total Unrealized Gain
from Rental Properties
Among the top-rated office buildings
in Manhattan
Maintaining and enhancing its market
redevelopments projects
in Manhattan
Operating at full occupancy
Maintaining a high occupancy over the
Office
●Location
●Overview
Condominiums
A traditional area lined
with landmarks.
Rental Housing
Office
Over 90%
Over 50%
An Area Led by Technology Companies
Promoting Balance Sheet Control through
Asset Repositioning
MITSUI FUDOSAN CO., LTD.
Others
long term
Property
Name
50 Hudson
Yards
55 Hudson
Yards
1251
Avenue of
the Americas
Building
Scale
58F/3B
51F/1B
54F/4B
❸Sun Belt
Logistics
Facilities
Over 30%
3.9 trillion
(As of end of FY2025)
value through continuous upgrades
1 trillion
Rental Housing
Approx. ¥
in the heart of Rockefeller Center
One of the largest mixed-use
¥
❷West Coast
(Consolidated Basis)
The historic office building located
An area popular among young people.
A Promising Area with Corporate
Concentration and Population Inflow
Accelerating Investment in the
Rental Housing Business
44
Approx.
Leasable
Floor Area 272,000 m²
Completion
Date
Approx.
133,000 m²
June 2022 October 2018
Approx.
211,000 m²
1970
海外事業
主要セグメント
Main segments
Overseas Business
賃貸
分譲
マネジメント 施設営業
Leasing
Sales
Management
Facility Operations
○
○
○
○
3 事業状況
Business Situation
英国・APAC事業のポートフォリオ
Our Portfolio in the U.K. and APAC
●英国事業 U.K.
●APAC事業 APAC
Total Assets:
¥430 billion
6 office properties
Office Investments Balance:
over 80%
Main Asset Classes
Total Assets:
¥760 billion
in operation
(As of the end of FY2025)
Retail Facilities and Condominiums
(As of the end of FY2025)
Indonesia・
Philippines
■Television Centre Redevelopment Project (Phase1)
China
India
Cash and Other
Current Assets
Taiwan
40%
Thailand
Just under
10%
APAC
Asset Balance
Breakdown
by Country
Malaysia
10%
Singapore
Over 10%
London’s largest-scale urban development by a Japanese company
Completion November 2018
Office Floors
10F Office Fully Leased
Total
Floor Area
Residential
Floors
9F、432 units All Units Sold
125,000㎡
■1 Angel Court, London
Office
■Sancroft, London
Australia
Over 15%
Examples of Our Past Development Projects
Office
Housing
Retail
■LaLaport TAIPEI NANGANG, Taiwan
Completion
February 2017
Completion
July 2023
Total
Floor Area
45,000㎡
Total
Floor Area
39,000㎡
Number
of Floors
27F/2B Office Fully Leased
Number
of Floors
8F/2B Office Fully Leased
Partner
Stanhope
MITSUI FUDOSAN CO., LTD.
Opening
March 2025
Total Floor Area 157,000㎡(Retail area)
Number
of Floors
Number
of Stores
6F/1B(Retail area)
Approx. 300 shops
The 5th Retail Facility in Taiwan
Renovation of the Existing Office Building by the Company
45
■MAC, Australia
Completion February 2024
Number
of Units
Number
of Floors
269Units
Partner
Frasers Property
24F
All 269 Units Sold
海外事業
主要セグメント
Main segments
Overseas Business
賃貸
分譲
マネジメント 施設営業
Leasing
Sales
Management
Facility Operations
○
○
○
○
3 事業状況
Business Situation
今後の注目エリア・物件(米国)
Future Focus Areas and Assets(U.S.)
●賃貸住宅/サンベルト Rental Housing/Sun Belt
Housing
●賃貸ラボ&オフィス/東海岸 Rental Lab & Office East Coast
■Innovation Square PhaseⅢ, Boston
To Exceed a Cumulative
Total of
Approx.
Developing
21 Properties
across
9 Cities in total
(As of the end of Jun. 2026)
Amount:
¥500 Billion
Rental Housing
Business
(From FY2024 Onward)
*(Including Properties under
Construction)
*Including Properties under
Construction
Total Investment
Accelerating Investment
in the
7,000 Units
Office
Range
(Estimated)
Over 7,000 Units in Total
)
(Cumulative)
New Supply:
Over
2,000 Units
New Supply:
Just Under
Denver
Centennial
Phoenix
Nashville
Dallas
1,500 Units
Raleigh
The Fourth U.S. Lab & Office Project
New Supply:
Over
Atlanta
2,000 Units
Fully Leased
Before Completion
New Supply:
Just Under
Houston
Fort Lauderdale
To Be Fully Occupied
by Vertex Pharmaceuticals,
One of the World’s Leading
Pharmaceutical Companies
1,500 Units
FY2024
FY2025
FY2026
After FY2027
Reference 1
Torrey Heights, San Diego
Schedule
Scheduled for
completion in 2026
Leased
area
32,700㎡
Number
of Floors
7F/2B
100% Leased
Hanover Buffalo Bayou
(Houston、TX)
Total Units: 317
MITSUI FUDOSAN CO., LTD.
The Oliver
(Dallas、TX)
Total Units: 351
Hanover Riverwalk
(Fort Lauderdale、FL)
Total Units: 380
46
Innovation Square PhaseⅡ,
Boston
Reference 2
Sold in FY2023
Building
Use
Lab & office
(4-Building Complex)
Building
Use
Lab & office
Completion
2023
Completion
2021
Leased
area
47,800㎡
Leased
area
25,000㎡
海外事業
主要セグメント
Main segments
Overseas Business
賃貸
分譲
マネジメント 施設営業
Leasing
Sales
Management
Facility Operations
○
○
○
○
3 事業状況
Business Situation
今後の注目物件(英国)
Future Focus Assets(U.K.)
■(Tentative name)British Library Redevelopment Project, London
A Total Project Cost:
Exceeding
¥200 Billion
Large-Scale Mixed-Use
Development:
Library, Offices, and Lab & Office Functions
1
Schedule
Typical Floor Plate:
Approx. 6,600 m²
(≈2,000 tsubo)
Scheduled for
completion in 2032
Total Floor Area
97,000㎡
Number of
Floors
11F/1B
Development
Manager
Stanhope
Project Partner
British Library
■South Molton Triangle , London
2
2
24,000㎡
Partner
Grosvenor
4
3
5
City
West
End
Construction
started in 2023
Scheduled for
completion in 2027
Total Floor Area
Kings
Cross
6
Participation in a Large-Scale
Mixed-Use Development Project
in the Mayfair District, West End
■ 1-5 Earl Street, London
Office
High-Performance Office
in the Shoreditch Area of the City,
Adjacent to the Financial District
and Close to the Station
Schedule
Total Floor Area
Partner
MITSUI FUDOSAN CO., LTD.
1
Office
Schedule
6
●Locations of Mitsui Fudosan’s Office Properties in Central London
Office
British Library
1 Redevelopment Project New
2 South Molton Triangle
Scheduled for
completion around
2030
3 5 Hanover Square
44,600㎡
EDGE
47
New
4 Sancroft
5 1 Angel Court
6 1-5 Earl Street New
海外事業
主要セグメント
Main segments
Overseas Business
賃貸
分譲
マネジメント 施設営業
Leasing
Sales
Management
Facility Operations
○
○
○
○
3 事業状況
Business Situation
今後の注目物件(APAC)
Future Focus Areas and Assets(APAC)
●オーストラリア Australia
■55 Pitt Street, Sydney
Office
●インド India
■RMZ Ecoworld 30, Bengaluru
Grade
Leasing Progressing Smoothly
as Planned
●シンガポール Singapore
Office
Scheduled for
completion in 2027
Total Floor
Area
70,000㎡
Number
of Floors
55F
Share
Mitsui Fudosan
66.67%
Mirvac 33.33%
■Zion Road , Singapore
Participation in data center projects
in major Indian cities decided
Phase 1: Fully Leased
Housing
Grade
Building Use
Premium Grade
Phase 1:
706
Schedule
Condominium Units
373
Serviced Apartment Units
Schedule
Scheduled for
completion in 2030
Two Condominium
Towers(62F)
Number
of Floors
Large-Scale Mixed-Use Development
with Over 1,000 Residential Units
●台湾 Taiwan
Total Floor Area
Share
Data Center
Completed in 2024
Schedule
Tower1:Occupancy certificate obtained
Tower2:Under development
Completion in 2026
Total Floor
Area
85,100㎡ total for Towers 1 and 2
Partner
CapitaLand Investment Limited
Phase 2:
426,400㎡
Mitsui Fudosan 50%, RMZ 50%
(Tentative name)
■ CapitaLand DC Chennai, Chennai
Data
Center
(Tentative name)
■ CapitaLand DC Hyderabad, Hyderabad
One Serviced
Apartment Tower
(36F)
City Development
Limited
■LaLaport KAOHSIUNG, Kaohsiung
The Sixth Retail Facility in Taiwan
MITSUI FUDOSAN CO., LTD.
Partner
Data
Center
Premium Grade
Schedule
Building
Use
(Tentative name)
■ CapitaLand DC Mumbai, Mumbai
Retail
Building
Use
Regional Shopping
Center
Schedule
Scheduled to Open
in 2027
Total Floor
Area
70,000㎡
Participation in data center projects
in major Indian cities decided
Building Use
Schedule
Data Center
Participation in data center projects
in major Indian cities decided
Building Use
Data Center
Under development
Schedule
Under development
43,500㎡
CapitaLand Investment Limited
Number
of Floors
6F/2B
Total Floor
Area
43,700㎡
Total Floor
Area
Number
of Stores
Approx. 280 shops
Partner
CapitaLand Investment Limited
Partner
48
Data
Center
海外事業
主要セグメント
Main segments
Overseas Business
賃貸
分譲
マネジメント 施設営業
Leasing
Sales
Management
Facility Operations
○
○
○
○
3 事業状況
Business Situation
今後の開発パイプライン:米国・英国
Future Development Pipeline: U.S. and U.K.
●Future Development Pipeline (Number of Projects)
(Includes undisclosed properties) (As of the end of Jun. 2026)
Office Buildings
8
5
properties
Condominiums
Logistics Facilities
/Data centers
Retail Facilities
主な新規プロジェクト:オフィス・物流施設/データセンター・分譲住宅・賃貸住宅
/Major New Projects: Office, Logistics facilities, Data centers, Condominiums, Rental Housing
竣工年1
Expected
Completion1
2026
用途
Use
オフィス
Office
米国 マサチューセッツ州 ボストン
Boston, Massachusetts, U.S.
英国 ロンドン
properties
London, U.K.
オフィス
Office
Hotels and Resorts
Rental Housing
所在地
Location
英国 ロンドン
London, U.K.
英国 ロンドン
600
14
units
London, U.K.
properties
米国 ヴァージニア州 アーリントン
Arlington, Virginia, U.S.
米国 カリフォルニア州 サンディエゴ
San Diego, California, U.S.
当社オフィスの平均契約期間
Average Contract term of Our Office
Office
17.8
米国 テキサス州 ヒューストン
Houston, Texas, U.S.
years
賃貸住宅
Rental Housing
Phoenix, Arizona, U.S.
米国 アリゾナ州 フェニックス
2027 以降
2027 or later
●Locations of Major New Projects (U.S.)
米国 アリゾナ州 フェニックス
Phoenix, Arizona, U.S.
米国 ノースカロライナ州 ローリー
Raleigh, North Carolina, U.S.
米国 ヴァージニア州 アーリントン
Arlington, Virginia, U.S.
英国 コベントリー
Coventry, U.K.
Boston
物流
Logistics Facilities
英国 ヒースロー
Heathrow, U.K.
英国 ウォリントン
Arlington
Warrington, U.K.
Raleigh
英国 ロンドン
分譲住宅
Condominiums
London, U.K.
米国 アリゾナ州 フェニックス
San Diego
Phoenix, Arizona, U.S.
Houston
Phoenix
Fort Lauderdale
●Locations of Major New Projects (U.K.)
Coventry
London
Heathrow
MITSUI FUDOSAN CO., LTD.
49
延床面積/総戸数12
Total Floor Space or
Units12
Innovation Square Phase III
約
≈
38,000
㎡
South Molton Triangle
約
≈
24,000
㎡
大英図書館再開発事業
British Library Redevelopment Project
約
≈
97,000
㎡
1-5 Earl Street
約
≈
44,600
㎡
J Rivelle
約
≈
420
戸
Units
Broderick
約
≈
260
戸
Units
Tanglewood
約
≈
240
戸
Units
Astria Tempe
約
≈
380
戸
Units
Montclair Scottsdale
約
≈
210
戸
Units
The Strand
約
≈
360
戸
Units
4600 Fairfax
約
≈
420
戸
Units
Wilson's Lane
約
≈
50,000
㎡
Heathrow Central Way
約
≈
㎡
Hardwick Grange
約
≈
㎡
テレビジョンセンター再開発計画 (2期)
Television Centre Redevelopment Project
(Phase2)
約
≈
350
戸
Units
Optima McDowell Mountain Village 3
約
≈
戸
Units
*1 竣工年、延床面積、総戸数は今後変更となる可能性があります。プロジェクト名は仮称を含みます。
*1 Each expected completion, total floor space and total number of units may change in the future. Some project names are tentative.
*2 シェア勘案前
*2 The total number of units is before taking into account the Company's share.
Warrington
プロジェクト名1
Project Name1
海外事業
主要セグメント
Main segments
Overseas Business
今後の開発パイプライン:APAC
(Includes undisclosed properties) (As of the end of Jun. 2026)
Condominiums
Logistics Facilities
/Data centers
Retail Facilities
2
properties
Sales
Facility Operations
○
○
○
○
2026
データセンター
Data
Centers
インド
India
ムンバイ
Mumbai
CapitaLand DC Mumbai
延床
gross
約
≈
85,100
㎡
商業
Retail
Facilities
台湾
Taiwan
高雄市
Kaohsiung City
ららぽーと高雄
LaLaport KAOHSIUNG
店舗
Store
約
≈
70,000
㎡
ホテル
Hotel
台湾
Taiwan
台北市
Taipei City
敦化北路ホテル計画
Dunhua North Road Hotel Project
約
≈
180
オフィス
Office
オーストラリア
Australia
シドニー
Sydney
55 Pitt Street
延床
gross
約
≈
70,000
㎡
物流
Logistics
マレーシア
Malaysia
スバン
Subang
Subang MRO & Logistics Facility
延床
gross
約
≈
23,600
㎡
インド
India
ハイデラバード
Hyderabad
CapitaLand DC Hyderabad
延床
gross
約
≈
43,500
㎡
インド
India
チェンナイ
Chennai
CapitaLand DC Chennai
延床
gross
約
≈
43,700
㎡
Hotels and Resorts*
1
ー
2027 以降
2027 or later
property
データセンター
Data
Centers
- Includes serviced apartment buildings
主な新規プロジェクト:分譲住宅
●Locations of Major New Projects (APAC)
2023-
2025-
Taiwan
(Kaohsiung,Taipei,New Taipei)
Mumbai
Hyderabad
Bengaluru
Chennai
2026
Bangkok
Quezon,Makati CBD
分譲住宅
Condo
miniums
Kuala Lumpur
Selangor
Singapore
(Bukit Merah)
Bekasi
2027 以降
2027 or later
Tangerang
Sydney
MITSUI FUDOSAN CO., LTD.
3 事業状況
Business Situation
用途
Use
properties
Rental Housing
units
Leasing
開業年/竣工年1
Expected
Completion1
8
properties
25,000
マネジメント 施設営業
Management
/Major New Projects: Office, Retail facilities, Logistics facilities, Data centers, Hotels and Resorts, Rental Housing
●Future Development Pipeline (Number of Projects)
1
分譲
主な新規プロジェクト:オフィス・商業施設・物流施設/データセンター・ホテルリゾート・賃貸住宅
Future Development Pipeline: APAC
Office Buildings
賃貸
所在地
Location
プロジェクト名1
Project Name1
面積/客室数/総戸数1
Total Floor or Store
Space/Rooms/Units1
/Major New Projects: Condominiums
フィリピン
Philippines
ケソン
Quezon City
The Arton
約
≈
1,700
戸
Units
インドネシア
Indonesia
ブカシ県
Bekasi Province
Three clusters in Jababeka Sports
City*2
約
≈
800
戸
Units
タイ
Thailand
バンコク
Bangkok
Narasiri Bangna km.10
約
≈
50
戸
Units
タイ
Thailand
バンコク
Bangkok
Burasiri Chatuchot
約
≈
120
戸
Units
オーストラリア
Australia
シドニー
Sydney
Treehouse ほか3棟
Treehouse and 3 other buildings
約
≈
880
戸
Units
台湾
Taiwan
新北市
New Taipei City
META PARK(1期)/METRO PARK
(2期)ほか13物件
META PARK(Phase1)/
METRO PARK(Phase2) and
13 other buildings
約
≈
戸
Units
マレーシア
Malaysia
クアラルンプール
Kuala Lumpur
Setia Federal Hill
約
≈
1,300
戸
Units
インドネシア
Indonesia
タンゲラン
Tangerang
Citra Raya*2
約
≈
2,400
戸
Units
シンガポール
Singapore
ブキメラ
Bukit Merah
Zion Road
約
≈
1,000
戸
Units
マレーシア
Malaysia
セランゴール
Selangor
Setia EcoHill*2
約
≈
680
戸
Units
インド
India
ベンガルール
Bengaluru
Mahindra Blossom
約
≈
730
戸
Units
フィリピン
Philippines
マカティCBD
Makati CBD
SONDRIS
約
≈
250
戸
Units
マレーシア
Malaysia
クアラルンプール
Kuala Lumpur
The Ashbourne
約
≈
460
戸
Units
*1 開業年、竣工年、延床面積、店舗面積、客室数、総戸数は、今後変更となる可能性があります。プロジェクト名は仮称を含みます。分譲住宅の総戸数はシェア勘案前になります。
*1 Each expected completion or opening, total floor space, store floor space, number of rooms, and total number of units may change in the future.
Some project names are tentative. The total number of condominium units for sales is before taking into account the Company's share.
*2 タウンシップ型の段階開発となります。
*2 This is a township-type staged development.
50
室
Roo
ms
海外事業
主要セグメント
Main segments
Overseas Business
三井不動産グループの強み
賃貸
分譲
マネジメント 施設営業
Leasing
Sales
Management
Facility Operations
○
○
○
○
3 事業状況
Business Situation
回転型投資モデルの加速
Strengths of Mitsui Fudosan Group
Accelerate the merchant development investment model
●2つの顔を併せ持つ
エリアや商品のバランスを図りながら、「回転型」を中心に新規取得を加速
Combining two perspectives
Accelerate new acquisitions focusing largely on merchant development purchases while balancing
areas and products.
付加価値を創出し利益を早期に顕在化。資金回収、BSコントロールを強化
Generate added value and promptly realize profits. Strengthen cash collection and BS control
endeavors.
(Capital-raising capability)
(Real Estate Expertise)
●歴史と経験の蓄積
A wealth of history and experience
(Credibility)
(Network)
Maple Terrace(Mixed-Use)
Mission Rock(Mixed-Use)
ローカル化の推進
Promotion of Localization
●50年以上の海外事業の歴史
A History of Over 50 Years
in Overseas Business
●海外パートナー戦略
Overseas Partnership Strategy
現地パートナー数*1
No. of Overseas Partners
約50年
米国
●現地社員の積極的な採用・登用
Recruitment and promotion of local employees
海外事業人員数*2
No. of Overseas business staff
Approx.
U.S.
50 Years
(1973~)
英国
約35年
U.K.
Approx.
(1990~)
アジア
Asia
(1972~)
FY2017
40
35 Years
約50年
Approx.
50 Years
FY2025
8年間で約1.8倍
Approx. 1.8 times
in 8 years
主なパートナー企業
Major Partner Companies
米国 / U.S.
Related, Tishman Speyer, Hines
英国 / U.K.
Stanhope, EDGE Technologies
シンガポール / Singapore
Hong Leong Group
FY2025
総人数(概算)
Total(approximation)
250
450
うち現地採用
Number of local hires
うち現地採用
Number of local hires
140
*2 施設運営会社を除く / Excluding facility management companies
*1 概数/ Approximate number
MITSUI FUDOSAN CO., LTD.
FY2017
総人数(概算)
Total(approximation)
51
8年間で約1.8倍
Approx. 1.8 times
in 8 years
2.1倍
うち現地採用約
local hires
Approx. 2.1 times
気候変動・脱炭素
4 サステナビリティへの取り組み
Sustainability Initiatives
Climate Change and Decarbonization
当社グループの温室効果ガス排出量削減目標
温室効果ガス排出量進捗状況
Mitsui Fudosan Group's Greenhouse Gas Emission Reduction Targets
Greenhouse Gas Emissions Progress
■脱炭素社会実現への取り組みの詳細は、当社WEBサイトを参照
https://www.mitsuifudosan.co.jp/esg_csr/carbon_neutral/
■For details on our efforts to realize a decarbonized society,
please refer to our website
千t-CO2
1,000 t-CO2
https://www.mitsuifudosan.co.jp/english/esg_csr/carbon_neutral/
5,503
● 2030年度までに40%削減(2019年度比)
*1
40% reduction in Group’s GHG emissions
by FY2030 (Compared to FY2019) *1
6%
基準年度
5,000
5%
Acquired SBT Initiative Certification
for “1.5°C target”
● 2050年度までにネットゼロ
CO2 emissions without action
0
*2
-40%
FY2019
6%
17%
472
3822
245
6%
5%
15%
696
216
40%削減
202
40%
Reduction
50%
49%
2,173
2,303
14%
13%
621
594
12%
10%
49%
59%
48%
58%
60%
2,000
対策未実施の場合のCO2排出量
目標とするCO2排出量/Targeted CO2 emissions
3,941
291
3,000
1,000
0t-CO2
1,029
7%
210
10%
592
*1
*1 SCOPE1+SCOPE2は2030年度までに46.2%削減(2019年度比)
*1 SCOPE1+SCOPE2: 46.2% reduction by FY2030 (Compared to FY2019)
263万t-CO2
2.63Mt-CO2
5%
4,199
22%
831
4,611
695
285
240
19%
Net Zero by FY2050
438万t-CO2
4.38Mt-CO2
6%
4,000
*1
(CO2排出量)
(CO2 emissions)
13%
4,690
4,383
SBTイニシアティブより「1.5℃目標」認定取得済
316
Base year
2,044
14%
589
3,266
1,907
11%
15%
586
581
14%
12%
16%
518
479
579
640
616
FY2019
FY2020
FY2021
FY2022
FY2023
2,207
2,774
17%
14%
ネットゼロ
661
627
Net Zero
14%
11%
528
536
FY2024
FY2025
その他/Other
FY2030
FY2050
(目標/Target)
(目標/Target)
Scope3-11:売却時排出/Emissions during sales
Scope3-1, 3-2:建築時排出/Emissions during construction
-100%
FY2030
Scope3-13:運用時排出/Emissions during operation
Scope1, 2:運用時排出/Emissions during operation
FY2050
■3年平均/3-year average
*2 ✓ 物件の環境性能向上
FY2018 – FY2020
Improve environmental performance of properties
約/Approx.
✓ 再エネ活用・電力グリーン化
2
増減率/Change Rate
約/Approx.
4,125,000 t-CO
約/Approx.
3,822,000 t-CO
2
-12.5%
■2019年度比/Compared to FY2019
Utilization of renewable energy and greening of electricity
FY2019
✓ メガソーラー拡大
約/Approx.
Expansion of mega-solar
✓ 建築時排出量削減、洋上風力・新技術など
Reduction of emissions during construction, offshore wind & new technologies, etc
MITSUI FUDOSAN CO., LTD.
FY2023 - FY2025
4,716,000 t-CO
52
FY2025
4,383,000 t-CO
2
増減率/Change Rate
2
-12.8%
気候変動・脱炭素
4 サステナビリティへの取り組み
Sustainability Initiatives
Climate Change and Decarbonization
「グリーン電力化」2025年度よりさらなる拡大
保有森林による二酸化炭素の吸収
Further Expansion of "Green Electrification” from FY2025
Absorption of CO2 by Company-Owned Forest
● 対象エリア:全国に拡大
● 北海道の道北地方を中心に 約5,000ha の森林を保有・管理
Owns and manages approx. 5,000 ha of forests,
mainly in the northern region of Hokkaido
Target areas : Expansion to nationwide
● グリーン電力化対象施設:約200施設*
● 当社グループの森が吸収・固定した二酸化炭素量:約21,315t-CO 2 /年*
Green Power Target Facilities : Approx. 200 facilities*
Amount of CO2 absorbed and stored by forests owned
*
by the Mitsui Fudosan Group: Approx. 21,315 t-CO2 /year
*グループ会社除く / Excluding group companies
*フォレストック協会による2023年1月1日付の認定数字
*Figures certified by FORESTOCK Association as of Jan. 1, 2023
● 累計供給計画量(2030年度時点):約9.6億kWh
Planned cumulative supply (As of FY2030) : Approx. 960 million kWh
● 当社グループが保有する森林資源を木造物件「&forest」へ積極的に活用
Active use of forest resources owned by the Mitsui Fudosan Group
in our wooden properties, "&forest."
● 共用部分のグリーン化に加え、入居テナントの要望により対応可能な
「グリーン電力の提供サービス」を実施。2025年度より商業テナントへの導入も始まり、
契約済テナント区画数は550(2026年4月時点)
In addition to greening the common areas, a "Green Power Supply Service" has
been implemented to meet tenant needs. The service was also introduced to retail
tenants in FY2025, with contracts in place for 550 tenant spaces as of April 2026.
北海道
Hokkaido
森の面積
Forest area
約5,000 ha
Approx. 5,000 ha
グリーン電力化の仕組み(イメージ)
Green Power Conversion System (image)
電源
Power Supply
各要望テナント
共用部
Requested
Tenants,
Public area
小売電気事業者
System
Electricity
Retail
Electricity
Providers
● フォレストック認定を取得(2023年1月1日付)
Acquired FORESTOCK certification (As of Jan. 1, 2023)
環境価値
フォレストック認定は、2009 年に日本林業経営者協会が創設した認定制度。
Environmental value
環境価値
Environmental value
森林のCO2 吸収量や生物多様性などを第三者機関が多面的に調査、評価の上
オフィス、商業施設等
Office Buildings,
Retail Facilities, etc.
認定するもので、現在は一般社団法人フォレストック協会が運営している認定制度です。
FORESTOCK Certification is a certification system created in 2009 by the
Forest Management Association of Japan. The certification system involves a
third-party organization conducting multifaceted studies and assessments on
matters such as forests’ CO2 absorption and biodiversity, and is currently
operated by the FORESTOCK Association.
MITSUI FUDOSAN CO., LTD.
53
気候変動・脱炭素
4 サステナビリティへの取り組み
Sustainability Initiatives
Climate Change and Decarbonization
三井不動産グループの木造建築ブランド 「&forest」
Mitsui Fudosan Group's wooden construction brand, "&forest"
複数テナント型物流用途を含む施設
国内最大・最高層の木造賃貸オフィスビル 日本橋本町三井ビルディング &forest
MFIP 海老名 &forest
“MFIP Ebina &forest,” a multi-tenant facility that includes logistics space,
has been completed in Ebina City, Kanagawa Prefecture.
The "Nihonbashi Honcho Mitsui Building &forest,"
Japan's largest and tallest wooden rental office building currently under construction in Nihonbashi
〈MFIP海老名 &forest 計画概要〉
〈日本橋本町三井ビルディング &forest 計画概要〉
所在地 :神奈川県海老名市中央5丁目2番
規模構造:地上4階建て・鉄骨造一部木造
敷地面積:約19,823 ㎡
延床面積:約40,219 ㎡
用
途:事務所、倉庫
竣工時期:2026年6月30日
所在地 :東京都中央区日本橋本町一丁目3番地
建築規模:地上18 階・約84m
延床面積:約28,000 ㎡
用
途:事務所、研究所、店舗
竣工時期:2027年1月予定
〈Outline of MFIP Ebina &forest〉
Location : 5-2, Chuo, Ebina, Kanagawa
Scale and structure: 4 aboveground floors,
〈Outline of the Nihonbashi Honcho Mitsui building &forest〉
Location : 3, Nihonbashihoncho, Chuo-ku, Tokyo
Building scale : 18 floors above ground, Approx. 84m
Total floor area:Approx. 28,000㎡
Uses : Office, laboratory, Retail
Completion date : Jan. 2027 (scheduled)
Partially wooden steel construction
Site Area:Approx. 19,823㎡
Total floor area:Approx. 40,219㎡
Uses : Office and warehouses
Completion date : June 30, 2026
・複数テナント型の物流(マルチ型倉庫)用途を含む施設として国内で初めて、建物構造の一部に木造を採用。
また、構造材や内装材の一部には、三井不動産グループの保有林から採取したトドマツ材等を使用しています。
It is Japan’s first multi-tenant logistics facility to incorporate timber into part of its building structure.
In addition, some of the structural and interior materials are made from Sakhalin fir and other timber
外観イメージ
Exterior Rendering
エントランスイメージ
専有部イメージ
Entrance Rendering
Tenant Space Rendering
harvested from forests owned by the Mitsui Fudosan Group.
・現存する木造高層建築物として国内最大・最高層
To be the largest and tallest amongst existing wooden high-rise buildings in Japan
・構造材に使用する木材量は国内最大規模1,100 ㎥ 超えの見込み
The amount of lumber used for structural materials is expected to exceed 1,100 ㎥, one of the largest in Japan
・建築時のCO2 排出量:約30%削減効果を想定
CO2 emissions during construction: Assumed reduction of approx.30%
その他の木造オフィスビル
〈(仮称)日本橋本町一丁目5番街区計画概要〉
木造共用部内観
木造共用部外観
Interior Rendering
Exterior Rendering
木質化した屋内階段
Wood-finished Interior
Staircase
・三井不動産として初めて、当社グループの保有林を含む森林における伐採・搬出から現場施工までの商流をつなぐことで、
所在地 :東京都中央区日本橋本町一丁目5番地
建築規模:地上11 階/地下1階・約56m
延床面積:約18,000 ㎡
用
途:事務所、店舗等
竣工時期:2028年2月予定
SGECプロジェクトCoC認証※1を取得しました。森林資源の調達から施工に至るまで、持続可能な木材利用のトレーサビリティを
確保しています。
Mitsui Fudosan obtained SGEC Project CoC certification*1 for the first time by establishing an integrated supply chain
from timber harvesting and transportation in forests, including those owned by the Mitsui Fudosan Group, through to
〈Outline of the Nihonbashi Honcho 1-chome 5 project(Tentative name)〉
Location : 5, Nihonbashihoncho, Chuo-ku, Tokyo
Building scale : 11 floors above ground, 1 floor below ground, Approx. 56m
Total floor area:Approx. 18,000㎡
Uses : Office, Retail, etc.
Completion date : Feb.2028 (scheduled)
on-site construction. This ensures traceability for the sustainable use of timber from sourcing through construction.
※1 SGEC/PEFC認証森林由来の木材が、加工・流通を経て建築物等のプロジェクトで使用されるまで、適切に管理・追跡されていることをプロジェクト単位で第三者が証明するCoC認証の一形態
※1 A form of CoC certification under which a third party verifies, on a project-by-project basis, that timber sourced from SGEC/PEFC-certified forests is
appropriately managed and traceable throughout processing and distribution through to its use in a construction project.
MITSUI FUDOSAN CO., LTD.
54
サステナブルファイナンスの推進
4 サステナビリティへの取り組み
Sustainability Initiatives
Promotion of Sustainable Finance
累計1兆円超の資金調達をサステナブルファイナンスで実施
Sustainable Financing Totals over ¥1,000 billion
PIF 3,400億円
GB 6,419億円
¥340.0 billion
¥641.9 billion
GB グリーンボンド/Green Bond GL グリーンローン/Green Loan
●グリーンプロジェクトへの投資資金を資金使途として発行する社債・借入
総額
Bonds to be issued for investment in green projects.
Total
SLL 3,907億円
¥390.7 billion
SLL サステナビリティ・リンク・ローン/Sustainability Linked Loan
●サステナビリティ目標の達成により金利優遇を得られる借入
¥1,765.4 billion
Borrowings with preferential interest rates based on achievement of sustainability goals.
(2026年9月末時点)
(As of Sep. 30,2026)
●2024年5月にサステナビリティ・リンク・ボンドフレームワークを統合したサステナビリティ・リンク・
ファイナンス・フレームワークを策定
GL 3,928億円
Sustainability Linked Finance Framework integrated with Sustainability Linked Bond
Framework in May 2024.
¥392.8 billion
【グリーンボンド(GB)グリーンローン(GL)充当済み物件事例 Example of properties allocated to Green Bonds / Loans】
PIF ポジティブ・インパクト・ファイナンス/Positive Impact Finance
●環境・社会・経済にインパクトを及ぼす企業活動について中⾧期的な目標・KPIを策定し、
金融機関から評価を受けて実行される借入
Borrowings to be implemented after evaluation by financial institutions based on medium- to
long-term goals and KPIs for corporate activities that have an impact on the environment,
society, and the economy.
評価テーマ: Evaluation themes
環境負荷の低減とエネルギーの創出、街づくりを通した「超スマート社会」の実現、健やか・安全・
安心な暮らしの実現、多様な人材が活躍できる社内の実現
LaLa arena TOKYO-BAY
Reduction of environmental burden and energy generation; realization of a “super-smart
society" through urban development; realization of healthy, safe, and secure
lifestyles; realization of a society in which diverse human resources can play an active role.
50ハドソンヤード
50 Hudson Yards
MITSUI FUDOSAN CO., LTD.
東京ミッドタウン八重洲
八重洲セントラルタワー
Tokyo Midtown Yaesu,
Yaesu Central Tower
55
人材への取り組み
4 サステナビリティへの取り組み
Sustainability Initiatives
Initiatives for Human Resources
社員エンゲージメント 当社で働くことを誇りに思う社員の割合
フルタイム従業員の自己都合離職率(単体)
Employee Engagement Percentage of employees who take pride
in working for our company
Full-time staff voluntary turnover rate (non-consolidated)
■1%程度の低水準で推移/Remained at a low level of about 1%.
FY2025
目標 / Target
94%
80%
15.00%
12.1%
11.8%
11.4%
11.6%
11.3%
12.1%
11.9%
11.4%
10.7%
11.5%
11.1%
11.4%
日本国内平均*
Average in Japan
10.00%
男性育児休業等取得率
Percentage of male employees taking childcare leave
国内平均に対し常に10%以上低水準
Consistently more than 10% below the
目標 / Target
100%
FY2025
national average
5.00%
103.2%
Over 100%
0.67%
0.60%
2014
2015
0.29%
0.79%
0.77%
0.53%
0.51%
2017
2018
2019
2020
0.81%
0.66%
0.93%
1.31% 1.28%
三井不動産(単体)
0.00%
2016
2021
2022
2023
2024
2025
Mitsui Fudosan
(年度/FY)
配偶者が出産した年度と、育児休業等を取得した年度が異なる男性社員がいる場合、100%を超えることがあります。
Where there are male employees who take childcare leave, etc. in a different fiscal year from that of
their child’s birth, this rate might exceed 100%.
*出典:厚生労働省「令和7年雇用動向調査結果の概況」離職率(一般)
Source: Ministry of Health, Labour and Welfare, Summary of Results of the 2025 Survey of Employment Trends, Turnover rate (general).
その他の重点施策と進捗状況(単体)
Other Priority Measures and Progress (Non-consolidated)
重点施策
Priority measures
KPIs(単体/Non-consolidated)
指標/Indicators
女性管理職比率
Women in management positions ratio
ダイバーシティ&インクルージョン
Diversity and Inclusion
人材育成・スキル向上
Human Resource Development and
the Improvement of Skills
多様な働き方
Diverse Work Styles
健康経営
Health and Productivity Management
MITSUI FUDOSAN CO., LTD.
進捗状況/Progress
(2025年度/FY2025)
達成時期/Period
目標 /Target
2025年 / 2025
10%
11.1%
2030年 / 2030
20%
2026年4月1日付
As of Apr. 1,2026
女性採用比率
Ratio of female hires
毎年/Annual
40%
40.9%
障がい者雇用率
Employment rate of people with disabilities
毎年/Annual
2.5% 以上/or above
2.55%
1人当たり研修時間
Training time per employee
毎年/Annual
前年実績水準 / Last year’s level
32.1時間/hours
1人当たり研修投資額
Training expenses per employee
毎年/Annual
前年実績水準 / Last year’s level
¥134,000
育児休業取得者の復帰率
Return rate from childcare leave
毎年/Annual
100%
100%
有給休暇取得日数
Number of paid leave days taken
毎年/Annual
年間14日 / 14 days annually
15.6日/days
健康診断/人間ドック受診率
Health checkup and screening rate
毎年/Annual
100%
100%
56
取締役会の実効性発揮
4 サステナビリティへの取り組み
Sustainability Initiatives
Achieving the Potential of the Board of Directors
Institutional Design and Composition of Board of Directors
■Institutional Design:The company has a Board of Auditors
■Board of Corporate Auditors
■Board of Directors
Composition of
Board of Directors
Gender Ratio:
Board of Directors
38% outside directors
Gender Ratio: Board
of Corporate Auditors
Majority outside
Women
3
23%
Board of
Directors
Outside
5
Board of
38% Directors
13
Composition of Board
of Corporate Auditors
13
Internal
8
62%
Internal
2
Corporate
40%
Auditors
5
Outside
3
60%
Men
10
77%
Women
2
40% Corporate
Auditors
5
Core
competence
Urban
Attendance at
Treasury,
development
Board of Directors Corporate
Risk
accounting
(real estate
Meetings
Management
Management development,
and finance
(FY2025)
etc.)
Role
Masanobu Komoda
Chairman of the Board
12/12
Takashi Ueda
President and Chief
Executive Officer
Takashi Yamamoto
Managing Director and
Executive Vice President
Shingo Suzuki
Managing Director
12/12
Men
3
60%
Internal 2
29%
Reasons for the appointment of Outside Directors
Management related skills
Name
Chairperson
Outside 5
71%
Skill Matrix, etc. of Directors*1
●
●
12/12
●
●
12/12
●
●
Global
●
●
●
●
●
●
●
●
Makoto Tokuda
Managing Director
12/12
●
Managing Director
12/12
●
●
●
Akiko Kaitou
Managing Director
10/10
●
●
Mizuho Wakabayashi
Managing Director
Newly*2
Eriko Kawai
Outside Director
12/12
●
Outside Director
12/12
●
●
●
Outside Director
12/12
●
●
●
Yo Honma
Outside Director
10/10
●
Tsuyoshi Nagano
Outside Director
Newly*2
●
●
●
●
●
●
●
●
●
●
●
Re-elected as a Director in the expectation that, drawing on many years of overseas experience as
well as extensive experience and broad insight gained through roles as a management consultant
and with international organizations and universities, they will continue to provide advice and
observations, as they currently do as a Director of the Company, from an objective and professional
perspective on matters such as diversity, ESG, and sustainability, and will continue to play an
appropriate role in strengthening the supervisory function of the Board of Directors and ensuring its
transparency.
●
Re-elected as a Director in the expectation that, drawing on extensive experience and broad insight
gained through roles as an analyst and consultant at securities companies and think tanks, they will
continue to provide advice and observations, as they currently do as a Director of the Company,
from an objective and professional perspective on matters such as internal control, risk
management, and finance, and will continue to play an appropriate role in strengthening the
supervisory function of the Board of Directors and ensuring its transparency.
Takashi
Hibino
●
Re-elected as a Director in the expectation that, drawing on many years of experience as a business
executive, as well as extensive experience and broad insight, they will continue to provide advice
and observations, as they currently do as a Director of the Company, from an objective and
professional perspective on matters such as finance and risk management, and will continue to play
an appropriate role in strengthening the supervisory function of the Board of Directors and ensuring
its transparency.
Yo
Honma
●
Re-elected as a Director in the expectation that, drawing on many years of experience as a business
executive, as well as extensive experience and broad insight, they will continue to provide advice
and observations, as they currently do as a Director of the Company, from an objective and
professional perspective on matters such as IT, digital technology, and risk management, and will
continue to play an appropriate role in strengthening the supervisory function of the Board of
Directors and ensuring its transparency.
Tsuyoshi
Nagano
●
Elected as a Director in the expectation that, drawing on many years of service as an executive in
the insurance industry, as well as extensive experience and broad insight, they will provide advice
and observations from an objective and professional perspective on matters such as risk
management and global business development, and will play an appropriate role in strengthening
the supervisory function of the Board of Directors and ensuring transparency.
Eriko
Kawai
Mami
Indo
●
●
●
●
●
●
●
Reasons for the appointment
●
●
Mami Indo
Sustainability
●
●
Takashi Hibino
Human
resources
strategy
●
●
●
●
Technology
and
innovation
Independent
Officer
Name
Expert skills
●
Nobuhiko Mochimaru
●
●
*1 The above list does not represent all the expertise and experience each person has.
*2 Newly appointed as a director on 26 June 2026.
MITSUI FUDOSAN CO., LTD.
■Compensation Advisory Committee and
Nomination Advisory Committee
57
役員報酬制度の改定について
4 サステナビリティへの取り組み
Sustainability Initiatives
Revision of the Officer Compensation System
The Officer Compensation system will be revised for directors and corporate auditors to encourage their contribution to
the realization of the Group’s Long-term Vision, “& INNOVATION 2030.“ (From FY2025)
● Key Points of the Revision
・Strengthen the linkage of performance-based compensation with the KPIs of the Group's long-term vision.
・To further enhance the operability of the stock compensation system, introduce Restricted Stock Units (RSU) and set limits for RS and RSU within the maximum limit
currently approved for Restricted Stock (RS).
*RSUs are calculated as one unit per share, and monetary compensation will be provided based on the number of RSUs held at the time of retirement.
● Basic Policy on the Officer Compensation system
Strong motivation for short, medium, and long-term corporate value
enhancement in a bid to realize of the Group's long-term vision
The sharing of further value with shareholders
An objective and transparent
compensation system
A competitive levels of recruitment and
the retention of human resources
● Method of resolution regarding directors' compensation (unchanged)
: Matters related to directors' compensation are referred to the Compensation Advisory Committee, chaired by an outside director, and decided by the Board of Directors.
● Key Revisions (Target: Internal Directors) For details, please refer to our news release dated March 27, 2025:https://www.mitsuifudosan.co.jp/english/corporate/news/2025/0327/download/20250327.pdf
❶In the compensation system, RSUs have been added to the payment method for “stock compensation,” which previously consisted only of RS.
In conjunction with this, upper limits for RS and RSU are set within the range of the number of shares and monetary compensation claims approved as RS.
Fixed
Types of Compensation
Performance-Based
Basic Compensation
Bonuses
Monetary
Monetary
Payment Method
Stock Compensation
Stocks (Restricted Stock)
Monetary (Restricted Stock Units)
❷Set target compensation composition ratios by position. (The composition ratios for bonuses and stock compensation are also disclosed.)
After
Before
Chairman
Board
/
Chairman of of
thethe
Board
/ President
President
Fixed
Performance-Based
Approx. 30 - 40%
Approx. 60 - 70%
Approx. 40 - 50%
Average
of internaldirectors
directors
Average
of internal
0%
10%
20%
30%
Fixed
Chairman
Board
/
Chairman ofof
thethe
Board
/ President
President
Approx. 50 - 60%
40%
50%
60%
70%
80%
0%
Bonuses 30 - 35%
Around 40%
10%
20%
Stock 30 - 35%
Bonuses 30 - 35%
30 - 35%
Other internal
directors
Other internal
directors
90% 100%
Performance-Based
30%
40%
50%
60%
Stock Around 25%
70%
80%
90% 100%
❸In calculating the payment levels for "bonuses" and "stock compensation," KPIs aligned with the Group's long-term vision are set, and the calculation formulas are disclosed.
(Previously, they were not disclosed.)
Bonuses
Amounts of paid
by individual
(
Business income
payment ratio
(0 -150%)
MITSUI FUDOSAN CO., LTD.
=
×50%+
Standard amount
by officer position
Net profit
payment ratio
(0 -150%)
×50%)×
Stock Compensation (RS:RSU=75:25)
×
Payment ratio based on
KPI evaluation
ESG initiative
payment ratio
(90 - 110%)
×
Number of allotted
by individual
Individual
evaluation results
payment ratio
(
(95 - 105%)
EPS
payment ratio
(0 - 150%)
58
=
Standard amount
by officer position
×50%+
ROE
payment ratio
(0 - 150%)
×
Payment ratio based on
KPI evaluation
×50%)×
ESG initiative
payment ratio
(90 - 110%)
投資有価証券(株式)
4 サステナビリティへの取り組み
Sustainability Initiatives
Investment Securities (Share)
The Definition and reduction policy of Strategic shareholdings
Sale results(Non-consolidated)
Strategic shareholdings
+Investment stocks held for pure investment purposes
●We own stocks considered effective in management strategy from a medium- to long- term perspective to
improve the Group's corporate value by comprehensively taking into account business strategy, the relationships
with clients and other factors as Strategic shareholdings.
●We review our Strategic shareholdings on an ongoing basis with a view to reduce our holdings.
FY2019 FY2020 FY2021 FY2022 FY2023 FY2024 FY2025
We assess the rationale for owning the stocks based on a quantitative evaluation and our relationship with the
issuer.
●We have a policy to reduce strategic share holdings by 50% from fiscal year 2024 until fiscal year 2026 and
continues to actively promote reduction thereafter.
Number of
stocks sold
13
3
4
3
7
21
19
Sales amount
20.3
45.9
50.7
46.5
59.9
75.9
60.8
( Billions of yen)
The standard for "Investment stocks held for pure investment purposes" and the stock to be reclassified
●The reason for setting standard of "Investment stocks held for pure investment purposes"
・In our business model, in addition to investing directly in real estate and benefiting from the increased value of real estate,
we may also invest in businesses in the form of equity capital and benefit from the increase in value of the shares.
・We had classified such equity capital as "Strategic shareholdings", but these investments are considered to be in our core business same as investments
in real estate, so it is suitable to classify them differently from strategic shareholdings.
・We have reorganized the classification of investment stocks based on our actual business model, and set the standard for "Investment stocks held for pure investment purposes"
Investment stocks held for purposes other than pure investment purposes
(Strategic shareholdings, No changed from before)
Classification
Investment stocks held for pure investment purposes
Standard
Stocks, as part of business investments, held for the purposes of benefiting
from medium to long term increase in share value etc.
Stocks held for purposes other than those listed on the left
*Stocks considered effective in management strategy from a medium- to long- term perspective
to improve the Group's corporate value by comprehensively taking into account business strategy,
the relationships with clients and other factors, etc.
●Main stock to be classified as "Investment stocks held for pure investment purposes."
Stock name
The reason
for classified
Oriental Land Co., Ltd.
- Mitsui Fudosan was involved in the establishment of the Oriental Land Co., Ltd., in 1960.
We invested in the form of equity capital for the purpose of developing urban resorts and implementing an entertainment business.
- This investment was made as part of our core business, real estate investments
- We hold these shares for the purpose of benefiting from the medium to long term increase in share value etc.
●Sell at the right time
Reflecting our track record to date, we will continue to take a flexible and sustainable approach to selling over time, allocating proceeds to invest for future growth
while also taking the share price into account.
MITSUI FUDOSAN CO., LTD.
59
社外からのESG評価等
4 サステナビリティへの取り組み
Sustainability Initiatives
External Assessments, etc.
ESG指数への主な組み入れ
Main inclusion in ESG Indexes
●GPIFが採用する6つのESG指数(日本株対象)全ての構成銘柄に選定
/Selected as a constituent of all six ESG indexes (covering Japanese equities) used by the GPIF
●「MSCI日本株女性活躍指数(WIN)」の構成銘柄に8年連続で選定、「Morningstar日本株式ジェンダー・ダイバーシティ・ティルト指数(除くREIT)」最高位評価に4年連続で格付け
/Selected as a constituent brand of MSCI Japan Empowering Women Index (WIN) for the 8th continuous year,
Selected as the Morningstar Japan ex-REIT Gender Diversity Tilt Index and rated at the highest rating for four consecutive years.
三井不動産を構成銘柄とするESG指数 / ESG index with Mitsui Fudosan as a constituent
GPIFが採用するESG指数(日本株対象)/ ESG indexes (covering Japanese equities) used by the GPIF
FTSE Russell confirms that Mitsui Fudosan Co., Ltd. has been independently assessed
according to the index criteria, and has satisfied the requirements to become a
constituent of the FTSE JPX Blossom Japan Index. Created by the global index and
data provider FTSE Russell, the FTSE JPX Blossom Japan Index is designed to measure
the performance of companies demonstrating specific Environmental, Social and
Governance (ESG) practices. The FTSE JPX Blossom Japan Index is used by a wide
variety of market participants to create and assess responsible investment funds and
other products.
FTSE Russell confirms that Mitsui Fudosan Co., Ltd. has been independently assessed
according to the index criteria, and has satisfied the requirements to become a
constituent of the FTSE JPX Blossom Japan Sector Relative Index. The FTSE JPX
Blossom Japan Sector Relative Index is used by a wide variety of market participants
to create and assess responsible investment funds and other products.
THE INCLUSION OF MITSUI FUDOSAN CO., LTD. IN ANY MSCI INDEX, AND THE USE OF
MSCI LOGOS, TRADEMARKS, SERVICE MARKS OR INDEX NAMES HEREIN, DO NOT
CONSTITUTE A SPONSORSHIP, ENDORSEMENT OR PROMOTION OF MITSUI FUDOSAN CO.,
LTD. BY MSCI OR ANY OF ITS AFFILIATES.
THE MSCI INDEXES ARE THE EXCLUSIVE PROPERTY OF MSCI. MSCI AND THE MSCI
INDEX NAMES AND LOGOS ARE TRADEMARKS OR SERVICE MARKS OF MSCI OR ITS
AFFILIATES.
Morningstar, Inc., and/or one of its affiliated companies (individually and collectively, “Morningstar”) has authorized Mitsui Fudosan Co., Ltd. to use of
the Morningstar® Japan ex-REIT Gender Diversity Tilt Index Logo (“Logo”) to reflect the fact that, for the designated ranking period, Mitsui Fudosan
Co., Ltd. ranks within the top group of companies comprising the Morningstar® Japan ex-REIT Gender Diversity Tilt Index (“Index”) on the issue of
gender diversity in the workplace. Morningstar is making the Logo available for use by Mitsui Fudosan Co., Ltd. solely for informational purposes. Mitsui
Fudosan Co., Ltd.’s use of the Logo should not be construed as an endorsement by Morningstar of Mitsui Fudosan Co., Ltd. or as a recommendation,
offer or solicitation to purchase, sell or underwrite any security associated with Mitsui Fudosan Co., Ltd. The Index is designed to reflect gender
diversity in the workplace in Japan, but Morningstar does not guarantee the accuracy, completeness or timeliness of the Index or any data included in
it. Morningstar makes no express or implied warranties regarding the Index or the Logo, and expressly disclaims all warranties of merchantability or
fitness for a particular purpose or use with respect to the Index, any data included in it or the Logo. Without limiting any of the foregoing, in no event
shall Morningstar or any of its third-party content providers have any liability for any damages (whether direct or indirect), arising from any party’s use
or reliance on the Index or the Logo, even if Morningstar is notified of the possibility of such damages. The Morningstar name, Index name and the
Logo are the trademarks or services marks of Morningstar, Inc. Past performance is no guarantee of future results.
MITSUI FUDOSAN CO., LTD.
60
社外からのESG評価等
4 サステナビリティへの取り組み
Sustainability Initiatives
External Assessments, etc.
環境・気候変動を始めとした各種イニシアチブへの加盟・賛同、評価取得
Joining and endorsing various initiatives, including environmental and climate change initiatives, and obtaining recognition
●2026年 GRESBリアルエステイト評価 / 2026 GRESB Real Estate Assessments
「GRESBスタンディング・インベストメント・ベンチマーク」と「GRESBディベロップメント・ベンチマーク」の双方において4スターを取得。
Mitsui Fudosan received four stars for both the GRESB Standing Investment Benchmark and the GRESB Development Benchmark in the GRESB Real Estate Assessment.
多様な人材・働き方に関する認定
Certification for Diverse Human Resources and Work Styles
●女性活躍推進 / Promoting the empowerment of women
女性活躍推進に優れた上場企業として、経済産業省と東京証券取引
所から、「なでしこ銘柄」に5年連続選定されています。
Our company has been selected by the Ministry of
Economy, Trade and Industry and the Tokyo Stock
Exchange as one of the “Nadeshiko Brand” companies for
five consecutive years, in recognition of its excellence in
promoting women’s success in the workplace.
「女性の職業生活における活躍の推進に関する法律(女性活躍推進
法)」に基づく取り組みの実施状況が優良な企業として、厚生労働大
臣から認定を受けています。
*グループ複数社が取得。当社単体は2段階目
Our company has been certified by the Minister of Health,
Labour and Welfare as a company with excellent
implementation of initiatives based on the Law
Concerning the Promotion of Women's Advancement in
Employment (Women's Activity Promotion Law).
*Multiple group companies have acquired it. Our
company has acquired it in the second phase.
MITSUI FUDOSAN CO., LTD.
●育児支援 / Childcare Support Initiatives
厚生労働大臣から子育てサポート企業として、「プラチナくるみん」の認定を受けています。
*当社単体および三井不動産レジデンシャルにて取得
Our company has acquired “Platinum Kurumin” certification from the Minister of Health,
Labour and Welfare as a company that supports childcare.
*Acquired by Mitsui Fudosan Co.,Ltd. and Mitsui Fudosan Residential Co.,Ltd.
●多様な人材の活躍の推進/Promote the activities of diverse personnel
経済産業省と日本健康会議から、
「健康経営優良法人 ホワイト500」の認定を
10年連続受けています。
Our company has been certified by the
Ministry of Economy, Trade and Industry
and the Nippon Kenko Kaigi as a “White
500” corporation for excellent health and
productivity management for 10
consecutive years.
61
企業や団体におけるLGBTQ+に関する取組み評価制度で
ある「PRIDE指標2025」にて、最高評価である「ゴールド」
認定を受賞しております。
We have received the highest-level “Gold”
certification in the PRIDE Index 2025, an
evaluation system that assesses initiatives
related to LGBTQ+ inclusion at companies and
organizations.
2027年3月期第2四半期(中間期)決算概要:連結業績概要
5 決算・企業情報等
Financial Results and
Corporate Information, etc.
Summary of 2Q, FY2026 Financial Results:Consolidated Financial Summary
2027年3月期第2四半期(中間期)決算の連結業績/Consolidated Financial Results for 2Q FY2026
(1)連結経営成績(累計)/Consolidated Result of Operations (year-to-date)
営業収益
Revenue from Operations
(%表示は対前年同四半期増減率/Percentages indicate year-on-year changes)
営業利益
Operating Income
事業利益
Business Income
経常利益
Ordinary Income
親会社株主に帰属する中間純利益
Profit Attributable to Owners of Parent
百万円/Millions of Yen
%
百万円/Millions of Yen
%
百万円/Millions of Yen
%
百万円/Millions of Yen
%
百万円/Millions of Yen
%
2Q, FY2026
1,215,494
-10.2
176,129
-19.5
224,785
-8.8
137,079
-25.3
139,155
-8.5
2Q, FY2025
1,353,420
16.4
218,780
29.1
246,463
42.3
183,587
33.7
152,153
72.3
*包括利益/Comprehensive Income 2Q, FY2026 : 157,821百万円/¥ 157,821 million(26.8%); 2Q, FY2025:124,445百万円/¥ 124,445 million(28.9%)
*事業利益=営業利益+持分法投資損益(不動産分譲を目的とした関係会社株式売却損益含む)+固定資産売却損益
Business income = Operating income + Equity in earnings/losses of affiliates (including Gain/loss on sales of shares of subsidiaries and affiliates for the purpose of real estate sales)+Gain/loss on sales of fixed assets
1株当たり中間純利益
Earnings per Share
潜在株式調整後1株当たり中間純利益
Diluted net income per share
円/Yen
円/Yen
2Q, FY2026
51.57
51.56
2Q, FY2025
54.88
54.86
(2)連結財政状態/Consolidated Financial Position
総資産
Total Assets
純資産
Net Assets
自己資本比率
Equity Ratio
1株当たり純資産
Net Assets Per Share
百万円/Millions of Yen
百万円/Millions of Yen
%
円/Yen
2Q, FY2026
10,674,485
3,453,802
31.4
1,243.75
FY2025
10,103,474
3,384,844
32.4
1,206.06
(参考/Reference)自己資本/Shareholders’ Equity 2Q, FY2026 : 3,348,578百万円/¥ 3,348,578 million; FY2025: 3,277,508百万円/¥ 3,277,508 million
配当の状況/Cash Dividends
年間配当金/Cash Dividends per Share
1st Quarter
2nd Quarter
3rd Quarter
期末/Year-End
合計/Total
円/Yen
円/Yen
円/Yen
円/Yen
円/Yen
―
17.00
―
18.00
35.00
FY2026
―
18.50
―
―
―
FY2026(予想/Plan)
―
―
―
18.50
37.00
FY2025
(注)直近に公表されている配当予想からの修正の有無:無 (Note) Revisions to the forecast of cash dividends since the latest announcement: None
2027年3月期の連結業績予想/Forecast for the Year Ending March 31, 2027
営業収益
Revenue from Operations
通期/Full year
営業利益
Operating Income
(%表示は、対前期増減率 / % figures denote the previous fiscal year change)
事業利益
Business Income
経常利益
Ordinary Income
親会社株主に帰属する当期純利益
Profit Attributable to Owners of Parent
百万円/Millions of Yen
%
百万円/Millions of Yen
%
百万円/Millions of Yen
%
百万円/Millions of Yen
%
百万円/Millions of Yen
%
円/Yen
2,800,000
3.3
410,000
3.1
450,000
1.1
315,000
0.5
285,000
2.3
105.79
(注)直近に公表されている業績予想からの修正の有無:無 (Note) Revisions to the earnings forecasts since the latest announcement: None
発行済株式数(普通株式)/Number of outstanding shares (common stocks)
(株/Shares)
期末発行済株式数(自己株式を含む)
Total number of shares outstanding at the end of the period (including treasury stocks)
2Q, FY2026
2,693,184,033
FY2025
2,755,914,511
期末自己株式数
Number of treasury stocks at the end of the period
2Q, FY2026
863,524
FY2025
38,378,428
期中平均株式数
Average number of shares outstanding during the period
2Q, FY2026
2,698,233,979
MITSUI FUDOSAN CO., LTD.
1株当たり当期純利益
Earnings per Share
62
2Q, FY2025
2,772,376,376
2027年3月期第2四半期(中間期)決算概要:連結PL概要
5 決算・企業情報等
Financial Results and
Corporate Information, etc.
Summary of 2Q FY2026 Financial Results : Summary of Consolidated Statements of Income
連結損益計算書
特別損益
Consolidated Statements of Income
Extraordinary Income (Losses)
2Q FY2026
営業収益 Revenue from Operations
2Q FY2025
1,215,494 1,353,420
単位:百万円/Yen in millions
増減/Change 増減率/Change Rate
-137,925
-10.2%
[特別利益/Extraordinary Income]
固定資産売却益
単位:百万円/Yen in millions
48,454
Gain on Sale of Non-current Assets
賃貸
Leasing
487,919
456,266
+31,652
分譲
Property Sales
216,132
398,772
-182,639
マネジメント
Management
256,459
246,721
+9,738
施設営業
Facility Operations
126,260
120,257
+6,003
その他
Other
128,721
131,403
-2,681
224,785
246,463
-21,678
-8.8%
公表(進捗率)
176,129
218,780
-42,651
-19.5%
Progress toward Full-Year Forecast
201
1,182
-981
48,454
26,500
+21,953
*1
事業利益
Business Income*1
営業利益
Operating Income
*2
持分法投資損益
Equity in Net Income (Loss) of Affiliated Companies*2
固定資産売却損益
Gain (Loss) on Sale of Non-current Assets
(セグメント別事業利益)
投資有価証券売却益
合計
単位:百万円/Yen in millions
2Q FY2026
Business Income by Segment
Leasing
99,526
88,578
+10,947
営業収益
分譲
Property Sales
96,746
124,251
-27,504
Revenue from
マネジメント
Management
38,348
38,557
-209
施設営業
Facility Operations
24,093
23,367
+725
1,562
2,010
-448
Corporate Expenses and Eliminations
-35,491
-30,301
-5,189
Non-operating Income (Expenses)
-39,049
-35,192
-3,856
Other
全社費用・消去
営業外損益
持分法投資損益
Equity in Net Income (Loss) of
Affiliated Companies
475
1,182
-707
純金利負担
Interest Income (Expense), Net
-38,587
-37,047
-1,540
その他
Other, Net
-937
671
-1,608
137,079
183,587
-46,507
Extraordinary Income (Losses)
85,927
50,398
+35,528
特別利益
Extraordinary Income
85,927
67,072
+18,854
特別損失
Extraordinary Losses
-16,673
+16,673
223,007
233,986
-10,979
経常利益 Ordinary Income
特別損益
税金等調整前中間純利益
Income before Income Taxes
法人税等
Income Taxes
-83,094
-90,060
+6,965
中間純利益
Net Income
139,912
143,926
-4,014
-756
8,227
-8,983
139,155
152,153
-12,997
非支配株主に帰属する
中間純損益
85,927
Total
賃貸
その他
Net Income (Loss) Attributable
Non-controlling Shareholders
親会社株主に帰属する中間純利益
Net Income Attributable to Shareholders of the Company
MITSUI FUDOSAN CO., LTD.
37,472
Gain on Sale of Investment Securities
通期予想
2026年5月13日公表
Full-year Forecast
Announced on May. 13,
2026
進捗率
Progress
1,215,494
2,800,000
43.4%
176,129
410,000
43.0%
224,785
450,000
50.0%
137,079
315,000
43.5%
139,155
285,000
48.8%
Operations
営業利益
Operating Income
事業利益
Business Income
経常利益
Ordinary Income
親会社株主に帰属する
中間純利益
-25.3%
Net Income Attributable to
Shareholders of the Company
*1 事業利益=営業利益+持分法投資損益(不動産分譲を目的とした関係会社株式売却損益含む)+固定資産売却損益
*2 不動産分譲を目的とした関係会社株式売却損益含む
*1 Business Income = Operating Income + Equity in Net Income (Loss) of Affiliated Companies (Including Gain (Loss) on Sale of
Investments in Equity Securities of Affiliated Companies for the Purpose of Real Property Sales) + Gain (Loss) on Sale of
Non-current Assets
*2 Including Gain (Loss) on Sale of Investments in Equity Securities of Affiliated Companies for the Purpose of Real Property Sales
-8.5%
63
2027年3月期第2四半期(中間期)決算概要:連結PL概要
5 決算・企業情報等
Financial Results and
Corporate Information, etc.
Summary of 2Q FY2026 Financial Results : Summary of Consolidated Statements of Income
連結包括利益計算書
Consolidated Statements of Comprehensive Income
単位:百万円/Yen in millions
2Q FY2026
2Q FY2025
中間純利益
139,912
143,926
Other Comprehensive Income
17,909
-19,481
その他有価証券評価差額金
Net Unrealized Holding Gains (Losses) on Available-for-sale Securities
-19,554
51,187
繰延ヘッジ損益
Deferred Gains (Losses) on Hedging Instruments
-57
-2,685
為替換算調整勘定
Foreign Currency Translation Adjustments
17,975
-29,256
退職給付に係る調整額
Remeasurements of Defined Benefit Plans
-3,260
-2,334
22,807
-36,391
157,821
124,445
Net Income
その他の包括利益
持分法適用会社に対する持分相当額 Equity in Other Comprehensive Income (Loss) of Affiliated Companies
中間包括利益
Comprehensive Income
(うち親会社株主に係る中間包括利益)
(Comprehensive Income Attributable to Shareholders of the Company)
(156,909)
(133,362)
(うち非支配株主に係る中間包括利益)
(Comprehensive Income Attributable to Non-controlling Shareholders)
(912)
(-8,916)
(参考)単体・営業損益
(Reference) Non-consolidated Operating Income
賃貸事業
2Q FY2026
Leasing
単位:百万円/Yen in millions
2Q FY2025
増減/Change
400,589
381,497
+19,091
9,347
56,422
-47,075
営業収益
分譲事業(業務施設等) Property Sales
Revenue from Operations
その他
Other
20,316
19,621
+695
合計
Total
430,253
457,541
-27,288
賃貸事業
Leasing
18.5%
17.4%
+1.1pt
分譲事業(業務施設等) Property Sales
-11.0%
22.8%
-33.8pt
その他
20.0%
21.4%
-1.4pt
45,895
56,338
-10,442
粗利益率
Gross Profit Margin
Other
営業利益
Operating Income
MITSUI FUDOSAN CO., LTD.
64
2027年3月期第2四半期(中間期)決算概要:連結PL概要
単位:百万円/Yen in millions
賃貸/Leasing
The Leasing segment reported an increase in revenue of
¥31.6 billion and an increase in business income of ¥10.9
billion, mainly due to higher revenue and income from
domestic and overseas office properties and growth in
leasing income driven by increased sales at domestic and
overseas retail facilities. At the end of the second quarter of
the current fiscal year, the vacancy rate for the Company’s
office buildings in the metropolitan area was 0.8%.
当第2四半期における主要な新規・通期稼働物件
Major Projects during the Period
【新規稼働(当期稼働物件)】
・中野M-SQUARE
・MFIP海老名 &forest
Financial Results and
Corporate Information, etc.
Leasing
Summary of 2Q FY2026 Financial Results : Summary of Consolidated Statements of Income
国内外オフィスの収益・利益の拡大、国内外商業施設の
売上増加に伴う賃貸利益の伸⾧等により、セグメント全体
では316億円の増収、109億円の増益。なお、当第2四
半期末における当社の首都圏オフィス空室率は0.8%。
5 決算・企業情報等
賃貸
2Q FY2026
営業収益
Revenue from Operations
2Q FY2025
増減/Change
オフィス
Offices
253,245
241,046
+12,199
商業施設
Retail Facilities
173,654
158,785
+14,868
その他
Other
61,019
56,434
+4,584
487,919
456,266
+31,652
105,654
89,330
+16,324
-6,128
-752
-5,376
99,526
88,578
+10,947
合計/Total
営業利益
Operating Income
持分法投資損益
Equity in Net Income (Loss) of Affiliated Companies
事業利益 Business Income
空室率推移/Vacancy Rate
連結オフィス・商業
9/2026
Offices & Retail Facilities (Consolidated)
単体オフィス首都圏
Offices in Tokyo Metropolitan Area (Non-consolidated)
6/2026
3/2026
3/2025
3/2024
3/2023
2.8%
2.7%
3.0%
3.5%
3.8%
4.3%
0.8%
0.9%
1.6%
1.3%
2.2%
3.8%
【通期稼働(前期稼働物件)】
・表参道Grid Tower
・ららぽーと安城
・ららテラス川口
・三井アウトレットパーク木更津(4期)
・ららテラス北綾瀬
・ららぽーとTOKYO-BAY 北館(建替え)1期
・三井アウトレットパーク岡崎
・BASEGATE横浜関内
・ららぽーと台北南港(台湾台北市)
2Q FY2026
所有
転貸
所有
商業施設
Retail Facilities 転貸
オフィス
Offices
貸付面積(千㎡)
Leased Floor Space (1,000㎡)
Owned
Sublease
Owned
Sublease
合計/Total
2,074
1,537
2,260
811
6,683
2Q FY2025
2,065
1,539
2,167
800
6,571
増減/Change
+9
-2
+93
+11
+112
[Newly Operational Properties (Commenced Operations in the Current
Fiscal Year)]
・Nakano M-SQUARE
・MFIP Ebina &forest
[Properties Operational for the Full Year (Commenced Operations in the
Previous Fiscal Year)]
・Omotesando Grid Tower
・LaLaport ANJO
・LaLa Terrace KAWAGUCHI
・MITSUI OUTLET PARK KISARAZU (4th phase expansion)
・LaLa Terrace KITAAYASE
・LaLaport TOKYO-BAY North Building Phase I (Rebuilt)
・MITSUI OUTLET PARK OKAZAKI
【参考】単体・賃貸総括表/Breakdown of Leasing (Non-consolidated)
総計/Total
2Q FY2026
2Q FY2025
オフィス/Offices
Number of Buildings
棟数
貸付面積(千㎡) Leased Floor Space (1,000㎡)
Leasing Revenue (¥ millions)
賃貸収益
Vacancy Rate
空室率
115
2,866
180,814
1.0%
113
2,830
178,044
1.1%
首都圏/Tokyo Metropolitan Area
2Q FY2026
2Q FY2025
94
2,589
169,055
0.8%
92
2,554
165,893
0.9%
地方/Local Area
2Q FY2026
2Q FY2025
21
276
11,759
3.1%
21
276
12,150
3.2%
・BASEGATE YOKOHAMA KANNAI
・LaLaport TAIPEI NANGANG (Taipei, Taiwan)
総計/Total
2Q FY2026
2Q FY2025
商業施設/Retail Facilities
Number of Buildings
棟数
貸付面積(千㎡) Leased Floor Space (1,000㎡)
Leasing Revenue (¥ millions)
賃貸収益
Vacancy Rate
空室率
MITSUI FUDOSAN CO., LTD.
108
2,636
152,645
2.0%
65
104
2,565
141,598
2.3%
首都圏/Tokyo Metropolitan Area
2Q FY2026
2Q FY2025
77
1,569
96,168
2.2%
74
1,536
89,628
2.4%
地方/Local Area
2Q FY2026
2Q FY2025
31
1,067
56,476
1.6%
30
1,029
51,970
2.0%
2027年3月期第2四半期(中間期)決算概要:連結PL概要
単位:百万円/Yen in millions
分譲/Property Sales
Residential Property Sales (Domestic) reported a decrease in
revenue and business income, mainly due to the year-onyear impact of high-priced, large-scale properties in central
Tokyo recorded in the corresponding period of the previous
fiscal year. Property Sales to Investors and Residential
Property Sales (Overseas), etc., including gain on sale of
non-current assets, reported a decrease in revenue but an
increase in business income, mainly due to the sale of a
portion of the interest in YAESU CORE, a non-current asset.
Overall, the Property Sales segment reported decreases of
¥182.6 billion in revenue and ¥27.5 billion in business
income. Additionally, the contract progress rate for 2,350
units scheduled to be recorded in the current fiscal year for
new condominium developments in Japan was 93%, and the
contract progress rate for Property Sales to Investors was
2Q FY2026
国内住宅分譲
Residential Property Sales (Domestic)
営業収益
Revenue from Operations
投資家向け・海外住宅分譲等
Property Sales to Investors and Residential Property Sales (Overseas), etc.
合計/Total
国内住宅分譲
Residential Property Sales (Domestic)
営業利益
持分法投資損益
Equity in Net Income (Loss) of Affiliated Companies
固定資産売却損益
Gain (Loss) on Sale of Non-current Assets
事業利益 Business Income
【海外住宅分譲】
・Cortland(米国ニューヨーク市)
【投資家向け分譲】
・YAESU CORE
・パークアクシス 7物件
[Residential Property Sales (Domestic)]
中高層分譲
Condominium Sales
Single-family Home Sales
国内住宅分譲合計
Total Residential Property (Domestic)
・Cortland (New York, U.S.A.)
[Property Sales to Investors]
営業収益
Revenue from Operations
戸数(戸)
Number of Units (Units)
戸数(戸)
Number of Units (Units)
戸当たり単価(万円) Unit Price (\10 thousand)
Revenue from Operations
営業収益
戸数(戸)
Number of Units (Units)
戸当たり単価(万円) Unit Price (\10 thousand)
6/2026
45
13
58
中高層分譲 Condominium Sales
Single-family Home Sales
戸建分譲
合計/Total
MITSUI FUDOSAN CO., LTD.
3/2026
40
6
46
216,132
398,772
-182,639
42,535
87,534
-44,999
585
9,156
-8,571
43,121
96,691
-53,570
5,170
1,058
+4,112
48,454
26,500
+21,953
96,746
124,251
-27,504
273,869
1,526
17,947
16,742
179
9,354
290,612
1,705
17,045
-115,601
-272
-5,326
+2,988
+18
+662
-112,613
-254
-4,778
(戸/Units)
3/2025
36
10
46
3/2024
32
22
54
3/2023
24
22
46
国内住宅分譲契約戸数/Number of Units Contracted in Residential Property Sales (Domestic)
前期末契約済み
Contracts at the
Beginning of the Period
期中契約
3,701
102
3,803
中高層分譲 Condominium Sales
Single-family Home Sales
戸建分譲
合計/Total
66
契約累計
Contracts
Total Contracted
during the Period
・YAESU CORE
・Seven Park Axis properties
-70,026
158,268
1,254
12,621
19,731
197
10,016
177,999
1,451
12,267
戸当たり単価(万円) Unit Price (\10 thousand)
Revenue from Operations
営業収益
9/2026
・PARK CITY NAKANO THE TOWER BREEZE
[Residential Property Sales (Overseas)]
108,159
国内住宅分譲完成在庫推移/Completed Inventory in Residential Property Sales (Domestic)
・PARK CITY NAKANO THE TOWER AIRZ
・PARK HOMES ASAKUSABASHI
38,133
・Mita Garden Hills
・PARK COURT EBISU
-112,613
- Including gain (loss) on sale of investments in equity securities of affiliated companies for the purpose of real property sales
戸建分譲
・三田ガーデンヒルズ
・パークシティ中野 ザ タワー エアーズ
・パークシティ中野 ザ タワー ブリーズ
・パークコート恵比寿
・パークホームズ浅草橋
増減/Change
290,612
Property Sales to Investors and Residential Property Sales (Overseas), etc.
合計/Total
*
2Q FY2025
177,999
投資家向け・海外住宅分譲等
Operating Income
approximately 90%.
当第2四半期における主要な計上物件
Major Projects during the Period
【国内住宅分譲】
Financial Results and
Corporate Information, etc.
Property Sales
Summary of 2Q FY2026 Financial Results : Summary of Consolidated Statements of Income
国内住宅分譲は、前年同期の都心・高額・大規模な物
件の計上による反動等により減収減益。固定資産売却
益等を含む投資家向け・海外住宅分譲等は、固定資産
であるYAESU COREの持分の一部売却等により減収増
益。セグメント全体では1,826億円の減収、275億円の
減益。なお、国内の新築マンション分譲の当期計上予定
戸数2,350戸に対する契約進捗率は93%、投資家向
け分譲の契約進捗率は約90%。
5 決算・企業情報等
分譲
1,307
177
1,484
5,008
279
5,287
55
0
55
(戸/Units)
売上計上
当期末契約済み
期中新規発売
Reported No.
of Units
Contracts at the
End of the Period
Newly Launched
during the Period
3,754
82
3,836
1,381
177
1,558
1,254
197
1,451
2027年3月期第2四半期(中間期)決算概要:連結PL概要
マネジメント
Summary of 2Q FY2026 Financial Results : Summary of Consolidated Statements of Income
Management
マネジメント/Management
プロパティマネジメントは、運営管理受託件数の増加等の
影響により、増収増益。仲介・アセットマネジメント等は、リ
ハウス(個人向け仲介)における取引件数と取引単価
向上の一方で、前年同期に計上した一過性のマネジメン
トフィーの反動等により、増収減益。セグメント全体では97
億円の増収、2億円の減益。
Property Management reported an increase in revenue and
business income mainly due to an increase in the number of
properties under management. Brokerage & Asset
Management, etc. reported an increase in revenue but a
decrease in business income, as increases in the number of
transactions and the average transaction value at Rehouse
(brokerage for individuals) were offset by the absence of
one-time management fees recorded in the corresponding
period of the previous fiscal year, among other factors.
5 決算・企業情報等
Financial Results and
Corporate Information, etc.
単位:百万円/Yen in millions
2Q FY2026
プロパティマネジメント
Property Management
営業収益
仲介・アセットマネジメント等
Revenue from Operations
Brokerage & Asset Management, etc.
合計/Total
プロパティマネジメント
Property Management
営業利益
仲介・アセットマネジメント等
Operating Income
Brokerage & Asset Management, etc.
合計/Total
事業利益 Business Income
2Q FY2025
増減/Change
191,735
182,282
+9,452
64,724
64,438
+286
256,459
246,721
+9,738
22,487
20,356
+2,130
15,861
18,200
-2,339
38,348
38,557
-209
38,348
38,557
-209
Overall, the Management segment reported an increase of
¥9.7 billion in revenue and a decrease of ¥0.2 billion in
business income.
2Q FY2026
リパーク(貸し駐車場)台数
Repark (Car Park Leasing) - Total Managed Units (Units)
仲介件数
Number of Brokerages (Units)
販売受託件数
Consignment Sales (Units)
2Q FY2025
増減/Change
255,696
250,678
+5,018
17,677
17,419
+258
470
438
+32
- 仲介件数は外部顧客からの件数
(参考)三井不動産リアルティグループの消去前仲介件数:17,715件(前年同期比+276件)
- Number of Brokerages refers to brokerages to external customers
(Reference) Number of Brokerages for Mitsui Fudosan Realty Group before eliminations: 17,715 (+276 in comparison to the corresponding period of the previous fiscal year)
MITSUI FUDOSAN CO., LTD.
67
2027年3月期第2四半期(中間期)決算概要:連結PL概要
施設営業
Summary of 2Q FY2026 Financial Results : Summary of Consolidated Statements of Income
The Facility Operations segment reported an increase in
revenue of ¥6.0 billion and an increase in business income of
¥0.7 billion, mainly due to higher ADR at domestic and
overseas hotels and growth in revenue and income at Tokyo
Dome.
2Q FY2026
営業収益
Revenue from
Operations
ホテル・リゾート
Hotels & Resorts
スポーツ・エンターテインメント Sports & Entertainment
合計/Total
事業利益 Business Income
2Q FY2025
増減/Change
89,643
85,102
+4,540
36,617
35,154
+1,462
126,260
120,257
+6,003
24,093
23,367
+725
2Q FY2026
国内宿泊主体型ホテル 稼働率
2Q FY2025
84%
Lodging-focused Domestic Hotels Occupancy Rate
増減/Change
87%
-3pt
単位:百万円/Yen in millions
その他/Other
2Q FY2026
営業収益
Revenue from
Operations
新築請負・リフォーム等
New Construction under
Consignment & Renovations, etc.
その他
Other
合計/Total
事業利益 Business Income
68
増減/Change
111,489
-4,280
21,512
19,913
+1,599
128,721
131,403
-2,681
1,562
2,010
-448
57,956
Value of New Construction Orders Received
2Q FY2025
107,209
2Q FY2026
新築請負受注工事高
MITSUI FUDOSAN CO., LTD.
Financial Results and
Corporate Information, etc.
単位:百万円/Yen in millions
施設営業/Facility Operations
国内外ホテルのADR上昇や、東京ドームにおける収益・
利益の伸⾧等により、セグメント全体では60億円の増収、
7億円の増益。
Facility Operations
決算・企業情報等
5
Other
その他
2Q FY2025
62,925
増減/Change
-4,969
2027年3月期第2四半期(中間期)決算概要:連結PL概要
参考:海外事業
Summary of 2Q FY2026 Financial Results : Summary of Consolidated Statements of Income
Reference: Overseas Business
参考:海外事業
Reference: Overseas Business
Financial Results and
Corporate Information, etc.
単位:百万円/Yen in millions
2Q FY2026
賃貸
営業収益
Revenue from Operations
Leasing
事業利益①
Business Income (1)
分譲
営業収益
Property Sales
マネジメント・施設営業等
増減/Change
92,525
+13,135
23,524
20,231
+3,293
Revenue from Operations
7,513
59,290
-51,777
事業利益②
Business Income (2)
3,412
-354
+3,767
営業収益
Revenue from Operations
13,466
12,327
+1,139
178
10
+168
27,115
19,886
+7,229
12.1%
8.1%
+4.0pt
Business Income (3)
海外事業利益合計①+②+③
Total Overseas Business Income ( (1) + (2) + (3) )
海外事業利益比率
2Q FY2025
105,660
Management, Facility Operations, etc. 事業利益③
*1
*1
Overseas Business Income Ratio
*1 海外事業利益合計÷連結事業利益×100
*2 為替:期中平均レート 当第2四半期158.29円/㌦ 前年同期148.40円/㌦
*1 Total Overseas Business Income ÷ Consolidated Business Income × 100
*2 Foreign exchange: Average rate for 2Q FY2026 ¥158.29 to US$1 ; 2Q FY2025 ¥148.40 to US$1
MITSUI FUDOSAN CO., LTD.
5 決算・企業情報等
69
2027年3月期第2四半期(中間期)決算概要:連結BS概要
5 決算・企業情報等
Financial Results and
Corporate Information, etc.
Summary of 2Q FY2026 Financial Results : Summary of Consolidated Balance Sheets
■連結貸借対照表/Consolidated Balance Sheets
単位:百万円/Yen in millions
FY2025
増減
/Change
3,638,937
3,245,095
+393,842 流動負債
160,475
82,354
+78,121
77,690
85,739
-8,049
2,917,655
2,603,087
12,681
8,614
23,275
2Q FY2026
流動資産
現金・預金
2Q FY2026
FY2025
増減
/Change
+375,945
2,223,648
1,847,702
支払手形及び買掛金
Notes and Accounts Payable - Trade
140,214
185,403
-45,189
短期借入金
Short-term Debt
855,118
810,263
+44,855
+314,568
コマーシャルペーパー
Commercial Paper
281,184
132,794
+148,389
10,438
8,895
11,468
+2,242
-281
+11,806
短期償還社債
未払法人税等
契約負債
Bonds Payable Due within One Year
141,770
88,490
189,637
13,100
80,023
186,109
+128,670
+8,467
+3,527
5,662
5,670
-7
1,666
1,816
-150
434,843
-1,961
439,368
-1,927
-4,524
-34
525,566
438,190
+87,375
Allowance for Doubtful Accounts
4,997,035
4,870,928
+126,107
有形固定資産
建物及び構築物
機械装置・運搬具
土地
建設仮勘定
その他
Property, Plant and Equipment
4,721,055
4,551,721
+169,334
1,007,388
1,048,075
-40,687
Buildings and Structures
2,020,665
1,895,210
2,757,044
2,628,313
+128,731
Machinery, Equipment and Vehicles
101,156
2,197,778
167,713
233,741
81,112
2,139,048
209,090
227,258
無形固定資産
Intangible Assets
135,789
127,389
529,737
973
1,234
37,545
255,619
81,082
326,408
513,526
939
1,699
36,721
263,501
81,082
297,068
+16,211
+34
-464
+824
-7,882
+29,339
有形・無形固定資産
Property, Plant and Equipment and Intangible Assets
4,856,845
4,679,110
Interest-bearing Debt
5,042,506
4,632,547
+409,959
Non-recourse Debt
359,254
352,671
+6,583
350,106
+15,347
Current Assets
Cash and Deposits
Notes and Accounts Receivable
受取手形、売掛金及び契約資産
- Trade and Contract Assets
Real Property for Sale
販売用不動産・前渡金
(including Advances Paid for Purchases)
Expenditure on Contracts in Progress
未成工事支出金
その他の棚卸資産
短期貸付金
Other Inventories
営業出資金
Equity Investments in Properties for Sale
その他の流動資産
貸倒引当金
Other Current Assets
Short-term Loans Receivable
Land
Construction in Progress
Other
完成工事補償引当金
その他流動負債
2,178,702
2,179,269
1,442,787
1,480,844
Deferred Tax Assets
61,542
179,631
104,820
35,994
47,072
178,767
105,015
34,416
その他投資その他資産
Other Investments and Other Assets
355,068
334,352
+20,716
貸倒引当金
Allowance for Doubtful Accounts
-1,141
-1,200
+58
資産計
Investments and Other Assets
Investment Securities
Long-term Loans Receivable
Deposits and Security Deposits Paid
Retirement Benefit Asset
Total Assets
10,674,485
10,103,474
Accrued Income Taxes
Contract Liabilities
Provision for Warranty Repair on Completed
Construction
Other Current Liabilities
Non-current Liabilities
固定負債
Bonds Payable
社債
+125,454 ⾧期借入金
Long-term Debt
+20,044 預り敷金・保証金
Deposits and Security Deposits Received
Provision for Directors' Retirement Benefits
+58,729 役員退職慰労引当金
Provision for Stock Compensation
-41,377 株式報酬引当金
Retirement Benefit Liability
+6,482 退職給付に係る負債
Deferred Tax Liabilities
繰延税金負債
再評価に係る繰延税金負債 Deferred Tax Liabilities for Land Revaluation
Other Non-current Liabilities
+8,400 その他固定負債
有利子負債
うちノンリコース債務
余剰敷金・保証金
-566 負債計
-38,057 資本金
+14,470 資本剰余金
+863 利益剰余金
-195 自己株式
+1,578 土地再評価差額金
投資その他資産
投資有価証券
⾧期貸付金
差入敷金・保証金
退職給付に係る資産
繰延税金資産
Current Liabilities
+177,734
Total Liabilities
7,220,683
334,758
6,718,630
Common Stock
342,463
341,800
+662
Capital Surplus
207,946
2,012,837
-1,435
166,075
311,560
1,922,741
-67,463
165,931
-103,614
+90,095
+66,027
+144
315,910
335,470
-19,560
8,907
256,755
39,117
490
104,734
8,744
216,411
42,311
585
106,750
+163
+40,344
-3,193
-95
-2,016
3,453,802
3,384,844
+68,958
1.51
31.4%
1.41
32.4%
+0.10
-1.0pt
10,674,485
10,103,474
+571,011
Surplus Deposits and Security Deposits Received
Retained Earnings
Treasury Stock
Reserve on Land Revaluation
Net Unrealized Holding Gains (Losses) on
その他有価証券評価差額金 Available-for-sale Securities
繰延ヘッジ損益
Foreign Currency Translation Adjustments
為替換算調整勘定
退職給付に係る調整累計額 Remeasurements of Defined Benefit Plans
Share Acquisition Rights
新株予約権
Non-controlling Interests
非支配株主持分
Total Net Assets
純資産計
[D/E Ratio]
〔D/Eレシオ〕
[Equity Ratio]
〔自己資本比率〕
Deferred Gains (Losses) on Hedging Instruments
+571,011 負債・純資産計
Total Liabilities and Net Assets
(参考) 為替/Foreign Exchange
為替変動による増減を含む。当第2四半期の為替影響は+1,045億円。
Includes changes due to foreign exchange fluctuations. Foreign exchange impact for the Period: +\104.5 billion.
MITSUI FUDOSAN CO., LTD.
70
2026年6月末
162.39円/ドル
2025年12月末
156.56円/ドル
2026年6月末
215.05円/ポンド
2025年12月末
211.43円/ポンド
¥162.39 to US$1 as of June 30, 2026,
¥156.56 to US$1 as of December 31, 2025
¥215.05 to £1
¥211.43 to £1
as of June 30, 2026,
as of December 31, 2025
+502,052
2027年3月期第2四半期(中間期)決算概要:連結BS概要
5 決算・企業情報等
Financial Results and
Corporate Information, etc.
Summary of 2Q FY2026 Financial Results : Summary of Consolidated Balance Sheets
販売用不動産(前渡金含む)
有利子負債
Real Property for Sale (including Advances Paid for Purchases)
Interest-bearing Debt
単位:百万円/Yen in millions
2Q FY2026
単位:百万円/Yen in millions
増減
/Change
FY2025
2Q FY2026
FY2025
増減
/Change
3,724,275
1,058,118
895,000
3,461,627
1,053,564
+262,647
+4,553
752,500
+142,500
231,631
147,433
124,182
-5,007
+23,754
-2,300
+6,800
+5,532
-125,921
+97,399
三井不動産レジデンシャル Mitsui Fudosan Residential
Mitsui Fudosan
三井不動産
三井不動産アメリカグループ Mitsui Fudosan America Group
955,415
890,924
+64,491
902,580
414,084
805,102
+97,478
398,634
+15,450
Mitsui Fudosan
三井不動産
三井不動産アメリカグループ Mitsui Fudosan America Group
三井不動産レジデンシャル Mitsui Fudosan Residential
英国三井不動産グループ
SPC合計
その他・消去等
315,038
181,123
149,413
279,938
99,843
128,645
+35,100
+81,280
+20,768
英国三井不動産グループ
台湾三井不動産グループ
SPC合計
Mitsui Fudosan UK Group
SPCs Total
226,623
171,188
121,882
東京ドームグループ
Tokyo Dome Group
112,800
106,000
93,835
88,302
Mitsui Fudosan UK Group
SPCs Total
Other and Elimination
合計
2,917,655 2,603,087 +314,568
Total
Mitsui Fudosan Taiwan Group
三井不動産マレーシアグループ Mitsui Fudosan Malaysia Group
*1
期首残高
新規投資
Balance at the
Beginning of the
Period
Investments
New
原価回収
その他
期末残高
Cost Recovery
Other
Balance at the
End of the Period
*1
2Q FY2026
2,603,087
455,536
2Q FY2025
2,500,757
260,593
(参考)三井不動産レジデンシャルにおける用地取得関係費
子会社貸付金
その他・消去等
Other and Elimination
-1,650,460 -1,524,539
191,844
289,244
合計
Total
5,042,506 4,632,547 +409,959
(うちノンリコース債務)
(Non-recourse Debt of Total)
Loans to Subsidiaries
359,254
352,671
+6,583
-140,400
-568
2,917,655
為替変動による増減を含む。当第2四半期の為替影響は+245億円。
-271,142
-52,742
2,437,466
Includes changes due to foreign exchange fluctuations. Foreign exchange impact for the Period: +\24.5 billion.
〔当第2四半期 1,220億円〕
(Reference) Costs associated with land acquisition by Mitsui Fudosan Residential
(\122.0 billion for the Period)
有形・無形固定資産
Property, Plant and Equipment and Intangible Assets
有形・無形固定資産主な増減要因
単位:百万円/Yen in millions
三井不動産
Mitsui Fudosan
三井不動産アメリカグループ Mitsui Fudosan America Group
Mitsui Fudosan Taiwan Group
台湾三井不動産グループ
Tokyo Dome Group
東京ドームグループ
2Q FY2026
FY2025
増減
/Change
2,778,701
863,617
2,654,670
837,461
+124,030
+26,156
291,426
274,468
282,453
277,694
+8,972
-3,225
三井不動産レジデンシャル
Mitsui Fudosan Residential
164,573
149,884
+14,689
SPC合計
SPCs Total
146,229
88,554
249,274
147,599
86,608
242,738
-1,370
+1,946
+6,535
4,856,845 4,679,110
+177,734
三井不動産マレーシアグループ Mitsui Fudosan Malaysia Group
その他・消去等
Other and Elimination
合計
Total
三井不動産における「東京ミッドタウン日本橋」、「HOTEL THE MITSUI HAKONE」等への新規投資、三井不動産アメリカグ
ループ等の在外子会社における為替影響等。
Main Reasons for Changes in Property, Plant and Equipment and Intangible Assets
New investments by Mitsui Fudosan in properties including Tokyo Midtown Nihonbashi and HOTEL THE
MITSUI HAKONE, and the impact of foreign exchange rate movements on overseas subsidiaries,
including the Mitsui Fudosan America Group.
(再評価差額を含む/Incl. Differences from Reserve on Revaluation)
2Q FY2026
2Q FY2025
期首残高
新規投資
Balance at the
Beginning of the
Period
New
4,679,110
4,707,418
MITSUI FUDOSAN CO., LTD.
*2
Investments
減価償却
その他
期末残高
Depreciation
Other
Balance at the
End of the Period
*2
*1 新規投資には、子会社への出資に伴う販売用不動産の増加を含む。
*2 新規投資には、資本的支出および子会社への出資に伴う有形・無形固定資産の増加を含む。
*1 New investments include increases in real property for sale gained through investments in subsidiaries.
*2 New investments include capital expenditures and increases in property, plant and equipment and
246,854
108,701
-77,749
-73,815
8,629
-112,837
4,856,845
4,629,467
intangible assets gained through investments in subsidiaries.
71
2027年3月期第2四半期(中間期)決算概要:連結キャッシュ・フロー計算書
Summary of 2Q FY2026 Financial Results:Consolidated Statements of Cash Flows
5 決算・企業情報等
Financial Results and
Corporate Information, etc.
単位:百万円/Unit:Millions of Yen
2Q FY2026
税金等調整前中間純利益
Income before income taxes
減価償却費
Depreciation
減損損失
Impairment losses
223,007
単位:百万円/Unit:Millions of Yen
2Q FY2025
2Q FY2026 2Q FY2025
233,986
短期借入れによる収入
Proceeds from short-term debt
5,570,521
Repayments of short-term debt
-5,256,919 -2,759,979
2,808,680
77,749
73,815
短期借入金の返済による支出
-
16,673
⾧期借入れによる収入
Proceeds from long-term debt
180,304
300,380
Repayments of long-term debt
-201,230
-220,370
91,600
139,800
-841
-53,100
-48,898
-44,343
受取利息及び受取配当金
Interest and dividend income
-5,897
-5,990
⾧期借入金の返済による支出
支払利息
Interest expenses
40,273
38,832
社債の発行による収入
Proceeds from issuance of bonds
持分法による投資損益(-は益)
Equity in net loss (income) of affiliated companies
-475
-1,182
社債の償還による支出
Redemption of bonds
投資有価証券売却損益(-は益)
Loss (gain) on sale of investment securities
-37,443
-40,571
配当金の支払額
Dividends paid
補助金収入
Subsidy income
-2,849
-37
非支配株主からの払込みによる収入
Proceeds from share issuance to non-controlling
shareholders
5,966
1,609
非支配株主への配当金の支払額
Dividends paid to non-controlling shareholders
-6,459
-4,392
非支配株主への払戻による支出
Repayments to non-controlling shareholders
-4,432
-560
ファイナンス・リース債務の返済による支出
Repayments of finance lease liabilities
-8,572
-6,501
自己株式の増減額(-は増加)
Decrease (increase) in treasury stock
-40,000
-0
連結の範囲の変更を伴わない子会社株式の
取得による支出
Purchase of shares of subsidiaries not resulting in change in
scope of consolidation
-
-4,294
連結の範囲の変更を伴わない子会社株式の
売却による収入
Proceeds from sale of shares of subsidiaries not resulting in
change in scope of consolidation
-
2,755
財務活動によるキャッシュ・フロー
Net cash provided by (used in) financing activities
281,037
159,682
現金及び現金同等物に係る換算差額
Effect of exchange rate change on cash and cash equivalents
-17,131
13,246
現金及び現金同等物の増減額(-は減少)
Net increase (decrease) in cash and cash equivalents
78,121
-4,902
現金及び現金同等物の期首残高
Cash and cash equivalents at the beginning of the period
82,317
163,272
現金及び現金同等物の中間期末残高
Cash and cash equivalents at the end of the period
160,439
158,370
固定資産売却益
Gain on sale of non-current assets
売上債権及び契約資産の増減額(-は増加) Decrease (increase) in trade receivables and contract assets
仕入債務の増減額(-は減少)
Increase (decrease) in trade payables
販売用不動産の増減額(-は増加)
Decrease (increase) in real property for sale
-48,454
-26,500
8,340
6,390
-16,629
-14,756
-312,264
-82,519
その他
Other
-5,802
-186,313
小計
Subtotal
-80,445
11,827
利息及び配当金の受取額
Interest and dividends received
23,163
8,725
利息の支払額
Interest paid
-39,898
-37,610
法人税等の支払額又は還付額(-は支払)
営業活動によるキャッシュ・フロー
有形及び無形固定資産の取得による支出
有形及び無形固定資産の売却による収入
Income taxes refund (paid)
Net cash provided by (used in) operating activities
Purchase of property, plant and equipment and intangible
assets
Proceeds from sale of property, plant and equipment and
intangible assets
-72,221
-169,403
-68,471
-85,529
-130,510
-110,266
93,770
41,498
投資有価証券の取得による支出
Purchase of investment securities
-61,528
-58,581
投資有価証券の売却による収入
Proceeds from sale of investment securities
54,258
51,810
敷金及び保証金の差入による支出
Payments of deposits and security deposits paid
-9,255
-5,116
敷金及び保証金の回収による収入
Proceeds from refund of deposits and security deposits paid
8,260
4,563
預り敷金保証金の返還による支出
Refund of deposits and security deposits received
-16,855
-22,937
預り敷金保証金の受入による収入
Proceeds from deposits and security deposits received
33,059
34,214
貸付けによる支出
Loan advances
-26,585
-16,777
貸付金の回収による収入
Proceeds from collection of loans receivable
2,381
4,657
定期預金の預入による支出
Payments into time deposits
-
-2,895
定期預金の払戻による収入
Proceeds from withdrawal of time deposits
-
2,335
連結の範囲の変更を伴う子会社株式の
取得による支出
Purchase of shares of subsidiaries resulting in change in
scope of consolidation
-
-777
その他
Other
36,623
-14,027
投資活動によるキャッシュ・フロー
Net cash provided by (used in) investing activities
-16,381
-92,301
MITSUI FUDOSAN CO., LTD.
72
2027年3月期決算概要:連結業績予想 (2026年5月13日公表)
Summary of FY2026 Financial Results:Consolidated Earnings Forecasts (Announced on May 13, 2026)
5 決算・企業情報等
Financial Results and
Corporate Information, etc.
単位:百万円/Unit: Yen in millions
2027年3月期通期予想/FY2026 Forecast
営業収益
Revenue from Operations
FY2026
FY2025
増減
予想 / Forecast
実績 / Results
/Change
2,800,000
2,709,747
+90,252
賃貸
Leasing
970,000
936,601
+33,398
分譲
Property Sales
740,000
729,271
+10,728
マネジメント
Management
510,000
511,470
施設営業
Facility Operations
260,000
244,146
+15,853
その他
Others
320,000
288,257
+31,742
営業利益
Operating Income
410,000
397,788
+12,211
事業利益
Business Income
450,000
445,120
+4,879
賃貸
Leasing
180,000
177,011
+2,988
分譲
Property Sales
210,000
193,182
+16,817
マネジメント
Management
75,000
80,891
施設営業
Facility Operations
45,000
46,345
その他
Others
10,000
10,178
全社費用・消去
Corporate Expenses and Eliminations
Non-operating Income (Expenses)
営業外損益
純金利負担
Interest Income (Expense), in Net
その他
Others, in Net
+975
315,000
313,319
+1,680
経常利益
Ordinary Income
特別損益
Extraordinary Income (Losses)
105,000
83,695
+21,304
税前当期純利益
Income before Income Taxes
420,000
397,014
+22,985
法人税等
Income Taxes
当期純利益
Net Income
285,000
271,851
+13,148
0
6,833
285,000
278,684
+6,315
非支配株主に帰属する Net Loss Attributable to
Non-controlling Shareholders
当期純損失
親会社株主に帰属する当期純利益
Net Income Attributable to Shareholders of the Company
MITSUI FUDOSAN CO., LTD
73
2027年3月期決算概要:連結業績予想 (2026年5月13日公表)
5 決算・企業情報等
Financial Results and
Corporate Information, etc.
Summary of FY2026 Financial Results:Consolidated Earnings Forecasts (Announced on May 13, 2026)
■分譲セグメント内訳
■有形・無形固定資産
Breakdown of Property Sales Segment
Tangible and Intangible Fixed Assets
単位:百万円/Unit: Yen in millions
国内住宅分譲
Residential Property Sales to Individuals
(Domestic)
営業収益
Revenue from
Operations
中高層分譲 Condominium Sales
戸建分譲
Single-family Home Sales
単位:百万円/Unit: Yen in millions
FY2026
FY2025
予想 / Forecast
実績 / Results
310,000
439,356
-129,356
新規投資
270,000
400,848
-130,848
減価償却費
40,000
38,507
+1,492
FY2026
FY2025
予想 / Forecast
実績 / Results
New Investments
300,000
246,375
+53,624
Depreciation Expenses
160,000
150,976
+9,023
増減/Change
増減/Change
■販売用不動産・前渡金
営業利益
Operating Income
65,000
112,005
Real Property for Sale (including Advances Paid for Purchases)
-47,005
単位:百万円/Unit: Yen in millions
営業利益率
Operating Margin
21.0%
25.5%
■国内住宅分譲戸数
FY2026
FY2025
予想 / Forecast
実績 / Results
増減/Change
新規投資
New Investments
790,000
644,442
+145,557
原価回収
Cost Recovery
610,000
520,303
+89,696
Residential Property Sales to Individuals (Domestic Units)
単位:戸/Units
中高層
Condominiums
FY2026
FY2025
予想 / Forecast
実績 / Results
2,350
2,747
増減/Change
■有利子負債
Interest-bearing Debt
-397
単位:百万円/Unit: Yen in millions
戸建
合計
Single-family Homes
Total
350
2,700
407
3,154
-57
FY2025
実績 / Results
4,800,000
4,632,547
増減/Change
-454
有利子負債
MITSUI FUDOSAN CO., LTD.
FY2026
予想 / Forecast
74
Interest-bearing Debt
+167,452
2027年3月期第2四半期(中間期)決算概要:注記情報
Summary of 2Q, FY2026 Financial Results:Notes to Consolidated Financial Statements
Mitsui Fudosan Residential Co., Ltd. (hereinafter referred to as “Residential Company”), a consolidated
subsidiary of the Company, presumed some defects in the piles forming the foundation of a condominium
sold by it in Yokohama (hereinafter referred to as “the Condominium”). On April 11, 2016, the Residential
Company was informed by Sumitomo Mitsui Construction Co., Ltd. (currently Arsocia Construction Co.,
Ltd.), the construction company, that the current condition survey revealed some of the piles failed to
reach the supporting layer. Furthermore, on August 26, 2016, the Residential Company received a notice
from Yokohama stating that the Condominium was in violation of the Building Standards Act and that the
Residential Company was required to discuss corrective measures for the violation with the unit owners of
the Condominium and to take necessary actions to resolve the issue.
On May 8, 2016, the Residential Company entered into an agreement with the management association
of the Condominium regarding several corrective plans, including the reconstruction of the Condominium
due to the pile defects, and the policy on compensation, as well as an agreement that the Residential
Company would bear the costs related to the incident (hereinafter referred to as “the Agreement”).
Additionally, on September 19, 2016, the management association of the Condominium made a
resolution based on the Act on Building Unit Ownership, as a corrective method, and decided to
reconstruct all the buildings. Reconstruction was completed on February 25, 2021.
The Residential Company has received a report from Sumitomo Mitsui Construction Co., Ltd. (currently
Arsocia Construction Co., Ltd.), the construction company, stating that the construction records were
manipulated for the data of pile installation, and it has been confirmed that some of the piles did not
reach the supporting layer, and that the Condominium was in violation of the Building Standards Act.
Therefore, the Residential Company has been seeking compensation from Sumitomo Mitsui Construction
Co., Ltd. (currently Arsocia Construction Co., Ltd.), Hitachi High-Technologies Corporation (currently
Hitachi High-Tech Corporation), and ASAHI KASEI CONSTRUCTION MATERIALS CORPORATION, the
companies responsible for the pile installation, based on tort liability, warranty against defects, and other
grounds, for all costs incurred under the above Agreement, including the reconstruction costs of the
Condominium and temporary housing expenses during the construction period. Following this
compensation policy, on November 28, 2017, the Residential Company filed a lawsuit against the three
companies for damages.
On June 17, 2026, the Tokyo District Court handed down a first-instance judgment ordering the three
companies to pay approximately ¥1.3 billion to the Residential Company, among other things. Dissatisfied
with the judgment, the Residential Company filed an appeal with the Tokyo High Court on June 30, 2026.
The amount of the claim is approximately ¥50.5 billion. The amount that the Residential Company has
provisionally paid by the end of the second quarter of the fiscal year for the costs is recorded as current
assets in the Company’s semi-annual consolidated balance sheet.
In the future, depending on the progress of this incident, there is a possibility that it may affect the
consolidated results of operations of the Group. At present, however, it is difficult to reasonably estimate
the amount of the impact.
Accounting Treatment Specific to the Preparation
of Semi-annual Consolidated Financial Statements
中間連結財務諸表の作成に特有の会計処理の適用
税金費用については、当中間連結会計期間を含む連結会計年度の税引前当期純利
益に対する税効果会計適用後の実効税率を合理的に見積り、税引前中間純利益に当
該見積実効税率を乗じて計算しております。
MITSUI FUDOSAN CO., LTD.
Financial Results and
Corporate Information, etc.
Contingent Liabilities
偶発債務
当社連結子会社の三井不動産レジデンシャル株式会社(以下、「レジデンシャル社」とす
る。)が分譲した横浜市所在のマンション(以下、「当マンション」とする。)において、基礎
部分となる杭の一部の不具合が推定されておりましたが、2016年4月11日、レジデンシャ
ル社は、施工会社である三井住友建設株式会社(現 アルソシア建設株式会社)から、
現況調査として杭の一部が支持層に未達である旨の報告書を受領いたしました。また、
2016年8月26日、レジデンシャル社は、横浜市から当マンションが建築基準法に違反して
いること、および当該違反の是正措置について当マンションの区分所有者と協議を行い、責
任を持って解決にあたることを求める旨の通知書を受領いたしました。
レジデンシャル社は、2016年5月8日、当マンションの管理組合との間において、杭の不
具合に起因する当マンションの建替えを含めたいくつかの是正方法および補償に関する方針、
並びに当該事象にかかる費用をレジデンシャル社が負担する旨の合意書(以下、「合意
書」とする。)を締結いたしました。また、当マンションの管理組合は、2016年9月19日、
是正方法として建物の区分所有等に関する法律に基づく決議を行い、全棟建替えを行うこ
とを決定し、2021年2月25日に建替え工事が完了いたしました。
当マンションについては、施工会社である三井住友建設株式会社(現 アルソシア建設株
式会社)より杭施工時に施工記録のデータの転用・加筆等が行われたとの報告書を受領
し、また、杭の一部が支持層に未達であること、当マンションが建築基準法違反であることが
確認されております。このため、レジデンシャル社は、上記合意書に基づく当マンションの建替
え費用、建物工事期間中の仮住まい費用等発生費用のすべてについて、施工会社である
三井住友建設株式会社(現 アルソシア建設株式会社)並びに杭施工を行った株式会
社日立ハイテクノロジーズ(現株式会社日立ハイテク)および旭化成建材株式会社に対
し、不法行為責任、瑕疵担保責任等に基づき求償することとしておりました。レジデンシャル
社は、2017年11月28日、この求償方針に従って損害賠償を上記3社に請求する訴訟
を提起いたしました。
2026年6月17日、東京地方裁判所において第一審判決が言い渡され、上記3社に
対し、約13億円をレジデンシャル社に支払うこと等が命じられました。レジデンシャル社は、当
該判決を不服として、2026年6月30日、東京高等裁判所に控訴を提起いたしました。
請求金額は約505億円です。なお、上記発生費用のうち、レジデンシャル社が当中間期末
までに仮払いした金額については、当社中間連結貸借対照表の流動資産に計上しておりま
す。
今後、当該事象の進捗状況によっては、当社グループの連結業績に影響が生じる可能性
がありますが、現時点ではその影響額を合理的に見積ることは困難な状況にあります。
5 決算・企業情報等
For the calculation of tax expenses, the Company has reasonably estimated the effective tax rate
by applying tax effect accounting to the income before taxes for the fiscal year, including the six
months ended September 30, 2026. The tax expenses for the period are calculated by applying
this estimated effective tax rate to the income before income taxes for the six months ended
September 30, 2026.
75
5 決算・企業情報等
業績推移
Financial Results and
Corporate Information, etc.
Trends in Performance
十億円
Billions of yen
営業収益の推移
事業利益・親会社株主に帰属する当期純利益の推移
Trends in Revenues from Operations
Trends in Business income and Profit Attributable to Owners of Parent
予想
(Forecast)
3,000
2,625.3
2,500
2,269.1
2,000
1,567.9
1,704.4 1,751.1
1,861.1 1,905.6
2,007.5
2,709.7
2,800.0
2,383.2
十億円
Billions of yen
事業利益* /Business income*
800
親会社株主に帰属する当期純利益 /Profit Attributable to Owners of Parent
*2023年度以前は営業利益の数字を記載
*Operating income is disclosed for FY2023 and prior.
700
2,100.8
予想
1,500
400
202.4
232.6
245.9
262.1
200
500
117.7
131.8
FY2015
FY2016
450.0
278.6
285.0
FY2025
FY2026
398.6
305.4
280.6
244.9
203.7
300
1,000
445.1
339.6
600
500
(Forecast)
155.8
168.6
FY2017
FY2018
183.9
129.5
176.9
196.9
224.6
248.7
100
0
0
FY2015 FY2016 FY2017 FY2018 FY2019 FY2020 FY2021 FY2022 FY2023 FY2024 FY2025 FY2026
FY2019
FY2020
FY2021
FY2022
FY2023
FY2024
2026年5月13日時点
As of May 13, 2026
FY2026
FY2015
FY2016
FY2017
FY2018
FY2019
FY2020
FY2021
FY2022
FY2023
FY2024
FY2025
1,567.9
1,704.4
1,751.1
1,861.1
1,905.6
2,007.5
2,100.8
2,269.1
2,383.2
2,625.3
2,709.7
2,800.0
202.4
232.6
245.9
262.1
280.6
203.7
244.9
305.4
339.6
398.6
445.1
450.0
親会社株主に帰属する当期純利益
Profit Attributable to Owners of Parent
(十億円/Billion of yen)
117.7
131.8
155.8
168.6
183.9
129.5
176.9
196.9
224.6
248.7
278.6
285.0
EPS*2(円/yen)
39.7
44.5
52.6
57.1
62.8
44.8
61.5
69.3
80.2
89.3
101.0
約
105
≈
年間配当/株 2/Annual Dividend Per Share2
(円 /yen)
10
11
13
15
15
15
18
21
28
31
35
37
自己株式取得 /Share Repurchase
(十億円/Billion of yen)
15.0
16.0
25.0
15.0
30.0
30.0
40.0
45.0
57.0
60.0
総還元性向 *3
Total Payout Ratio *3(%)
25.2
25.5
35.0
35.1
36.9
44.2
46.6
44.9
52.7
52.7
54.9
56.0
ROA*4(%)
4.1
4.6
4.6
4.4
4.2
2.8
3.3
3.9
3.9
4.1
4.5
ROE*5(%)
6.2
6.8
7.4
7.4
7.7
5.2
6.6
6.9
7.5
8.0
8.7
営業収益/Revenues from Operations
(十億円/Billion of yen)
*1
事業利益 /Business income
(十億円/Billion of yen)
*1
*1 2023年度以前は営業利益の数字を記載 /Operating income is disclosed for FY2023 and prior.
*2 普通株式1株につき3株の株式分割を行っております。2022年度以前は前連結会計年度の期首に当該株式分割が行われたと仮定して、数値を算定しております。
/The Company conducted a 3-for-1 stock split for common shares, and calculated the figures for fiscal years prior to fiscal year 2022 as if the stock split had been conducted at the beginning of the previous fiscal year.
*3 総還元性向=(配当総額+自己株式取得総額)/親会社株主に帰属する当期純利益 /Total payout ratio=(Total dividends + Total amount of treasury stock acquired)/Profit Attributable to Owners of Parent
*4 2023年度以前:ROA=(営業利益+営業外収益)/総資産期首期末平均残高 2024年度以降:ROA=事業利益/総資産期首期末平均残高
/~FY2023:ROA=(Operating income + non-operating income)/average total assets over period FY2024~:ROA=Business income/average total assets over period
*5 ROE=親会社株主に帰属する当期純利益/自己資本期首期末平均残高 /ROE=Profit Attributable to Owners of Parent/Average shareholders‘ equity over the period
MITSUI FUDOSAN CO., LTD.
76
(予想/Forecast)
8.5%以上
8.5% or higher
賃貸等不動産
5 決算・企業情報等
Financial Results and
Corporate Information, etc.
Rental Properties
賃貸不動産の規模と評価益の推移
Trend in Size and Unrealized Gain from Rental Properties
■賃貸等不動産の評価益
有形・無形固定資産
Tangible and Intangible Fixed Assets
Unrealized Gain from Rental Properties
販売用不動産
Real Property for Sale
十億円/Billions of Yen
7,492.7
8,000.0
賃貸等不動産(保有・賃貸目的)
その他資産
Others
十億円/Billions of Yen
9,000.0
Rental Properties
(for Holding / Rental Purpose)
6,695.7 6,861.6
7,000.0
3,729.5
6,000.0
5,000.0
4,000.0
その他の有形・無形固定資産
Other Tangible
and Intangible Fixed Assets
7,714.6
5,436.1
4,560.6
5,773.6
6,089.5
5,856.1
6,136.8
4,828.5
2,475.4
2,749.6
2,918.4
2,826.5 3,030.3
3,262.6 3,268.9
3,685.5 3,985.1
1,912.2 2,183.4
3,000.0
三井不動産G総資産
949.6
2,000.0
10.1兆円
Mitsui Fudosan Group
Total Assets
1,000.0
販売用不動産
(投資家向け)
¥10.1 trillion
2,648.4 2,645.1 2,960.7
3,024.
3,592.7 3,807.2 3,729.5
3,171.1 3,029.6 3,106.5 3,433.1
0.0
Real Property for Sale
(to Investors)
FY2015 FY2016 FY2017 FY2018 FY2019 FY2020 FY2021 FY2022 FY2023 FY2024 FY2025
1,846.8
簿価 / Book Value
評価益 / Unrealized Gain
(参考)賃貸等不動産以外の資産も含めた時価評価
その他資産
Others
(Reference) Market price including assets other than rental properties
販売用不動産
(個人向け)
2,821.2
Real Property for Sale
(to Individuals)
① 賃貸等不動産 Rental Properties
756.2
十億円/Billions of Yen
期末簿価
2026年3月期
Year-end Book
Value
FY2025
国内
Domestic
稼働資産
Operating Assets
海外
Overseas
時価評価対象*1
開発中資産
Under Development
時価評価対象外
オフィス
Office
商業施設
Retail Facilities
その他
Other
Office
期末時価
2026年3月期
10.1兆円
差額(評価益)
Difference
Year-end Market (Unrealized Gain)
Price
FY2025
1,490.4
3,340.8
1,850.3
628.7
1,391.4
762.7
258.3
420.7
162.4
823.1
1,794.1
971.0
商業施設等 Retail Facilities, other
207.2
307.3
100.1
Subject to Valuation*1
64.9
203.4
138.5
Not Subject to Valuation
256.9
256.9
0
3,729.5
7,714.6
3,985.1
-77.7
+221.9
+299.6
オフィス
合計/Total
前期末からの差異/Difference from End of Last Year
*1 2027年3月期に竣工予定の国内における賃貸用不動産/Domestic rental properties scheduled to be completed in FY2026
MITSUI FUDOSAN CO., LTD.
77
¥10.1
trillion
② 賃貸等不動産以外の用途の不動産
Real Estate Other Than Rental Properties
③ 販売用不動産(投資家向け,稼働済)
Real Property for Sale (to Investors, Operational)
簿価
固定資産 / Fixed Assets
①賃貸等不動産
①Rental Properties
②賃貸等不動産以外の用途の不動産
②Real Estate Other Than Rental Properties
販売用不動産 / Real Property for Sale
③販売用不動産(投資家向け,稼働済)
③Real Property for Sale (to Investors, Operating)
合計 / Total
Book value
十億円/Billions of Yen
含み益
時価
Market Price
Unrealized Gain
4,260.1
8,878.5
4,618.3
3,729.5
7,714.6
3,985.1
530.6
1,163.9
633.2
1,087.2
1,789.5
702.3
1,087.2
1,789.5
702.3
5,347.3
10,668.0
5,320.6
5 決算・企業情報等
当社企業データ:株式情報
Financial Results and
Corporate Information, etc.
Company Data:Stock Information
3月末時点の株主構成比
Shareholder Composition as of March 31
個人/Individuals
金融機関/Financial Institutions
外国人/Foreign Nationals
その他/Other Companies, etc.
2026*
5.6
32.3
52.6
9.6
2025
5.3
34.3
49.9
10.4
2024
4.4
35.0
50.4
10.2
2023
4.7
34.5
2022
4.1
37.3
46.9
11.6
2021
4.3
37.1
46.0
12.6
2020
4.2
38.5
47.0
10.3
2019
4.0
37.6
47.9
10.5
2018
4.4
35.1
51.4
9.1
2017
4.6
34.6
50.8
10.0
2016
4.6
33.7
52.3
9.4
2015
5.0
31.9
54.0
9.1
0%
10%
20%
48.3
30%
40%
50%
*2026年9月末時点の株主構成比となります。/This is the ratio of shareholders as of Sep. 30, 2026.
MITSUI FUDOSAN CO., LTD.
78
60%
12.6
70%
80%
90%
100%
当社企業データ:賃貸事業の開発事例
5 決算・企業情報等
Financial Results and
Corporate Information, etc.
Company Data:Examples of Developments in Leasing Business
一般的な開発
市街地再開発事業
Standard-Type Development
Urban Area Redevelopment Project
【市街地再開発の特徴 /Overview of Urban Area Redevelopment】
Before
(事例)東京ミッドタウン八重洲
(case)TOKYO MIDTOWN YAESU
After
相対取引、入札等により
新たな事業機会を獲得
Before
①~④
従前権利者
Rights holders
①
イ
メ
ー
ジ
②
X
保留床取得者
③
④
Image
Acquire new business opportunities
through arm’s length transactions,
bidding, etc.
purchasers of reserved floorspace
公共施設
保有資産の建替
Y
public facility
地方公共団体
Reconstruction of Owned Assets
local government
After
権
利
形
態
①②
③④
権利床
Building
土
地
rights-holders’
floor space
①
建
物
①
②
③
②
③
④
Y
保留床
X
①②③④
グループ会社が保有する資産
を一体的に建て替え
Reserved
floor space
Integrally reconstruct multiple
assets held by the Group
X
Land
Type of rights
保留床取得者
purchasers of reserved floorspace
主な開発プロジェクトの開発期間 (参考例) /Development periods of main development projects(Reference example)
エリア
Area
種別
Type
海外
Overseas
所在地
Location
東京ミッドタウン八重洲
TOKYO MIDTOWN YAESU
東京都・中央区
Chuo-ku, Tokyo
日本橋室町三井タワー
Nihonbashi Muromachi Mitsui Tower
東京都・中央区
Chuo-ku, Tokyo
商業
Retail Facilities
ららぽーとみなとアクルス
LaLaport NAGOYA Minato AQULS
愛知県・名古屋市
Nagoya, Aichi
物流
Logistics
Facilities
MFLP・LOGIFRONT東京板橋
MFLP LOGIFRONT Tokyo Itabashi
東京都・板橋区
Itabashi-ku, Tokyo
中高層分譲
Condominiums
パークタワー西新宿
PARK TOWER NISHISHINJUKU
東京都・新宿区
Shinjuku-ku, Tokyo
55ハドソンヤード
55 Hudson Yards
米国・NY
New York, U.S.
複合型
Mixed use
国内
Domestic
プロジェクト名
Project Name
オフィス
Office
商業
Retail Facilities
MOP台湾台中港
MOP TAICHUNG PORT
事業スケジュール /Project Schedule
2002
台湾・台中市
Taichung City, Taiwan
*事業期間は、プロジェクトの事業化を決定した時点を起点としています。
また、再開発事業においては再開発の実現に向けた地権者との合意形成(勉強会等による協議)の期間を含みます。
MITSUI FUDOSAN CO., LTD.
2003
2004
2005
2006
2007
2008
2009
2010
2011
2012
2013
2014
2015
2016
2017
2018
★地権者勉強会開始
Initiate study groups with other landowners
2019
2020
2021
2022
2023
2024
事業期間
Project Periods
20.0
★準備組合設立
Establish preparation union
7.0
★入札参加
Take part in bidding
6.0
3.0
★準備組合設立
Establish preparation union
入札/From bidding to operator determination
地権者協議、事業検討など/Consultations with landowners, business reviews, etc.
設計、計画推進/Promotion of design and planning
建築工事期間(解体期間を含む)/Construction work period (including dismantling period)
★出資契約締結
Enter into investment agreement
★入札参加
Take part in bidding
11.0
4.0
3.0
*The project period starts from when commercialization as a company is decided to have been made.
In the case of redevelopment projects, the project period also includes the time needed to draw up an agreement (consultations by study groups, etc.) with landowners intending to bring the redevelopment to fruition.
79
当社企業データ:財務データ(過去11年)
5 決算・企業情報等
Financial Results and
Corporate Information, etc.
Company Data:Financial Data (Last 11 Years)
百万円/Millions of yen
2015
2016
2017
2018
2019
2020
2021
2022
2023
2024
2025
1,567,969
1,704,416
1,751,114
1,861,195
1,905,642
2,007,554
2,100,870
2,269,103
2,383,289
2,625,363
2,709,747
202,482
232,698
245,902
262,147
280,617
203,770
244,978
305,405
339,690
398,688
445,120
年度/FY
経営成績
Operating
Results
営業収益
Revenue from Operations
事業利益*1
Business Income*1
経常利益
Ordinary Income
182,521
219,607
240,341
254,106
258,510
168,865
224,940
265,358
267,890
290,262
313,319
親会社株主に帰属する当期純利益
Profit Attributable to Owners of Parent
117,722
131,815
155,874
168,661
183,972
129,576
176,986
196,998
224,647
248,799
278,684
総資産
Total Assets
5,363,477
5,551,751
6,284,723
6,802,731
7,395,359
7,741,972
8,208,012
8,841,396
9,489,527
9,859,856
10,103,474
*2
財務状態
Financial
Situation
*2
販売用不動産
Real Property for Sale
1,167,745
1,334,167
1,524,863
1,630,558
1,907,839
1,930,528
2,051,704
2,163,634
2,375,281
2,500,757
2,603,087
有形・無形固定資産
Tangible and Intangible Fixed Assets
2,968,975
2,967,788
3,318,928
3,500,482
3,753,141
3,796,800
3,914,135
4,293,130
4,405,526
4,707,418
4,679,110
資本的支出
Capital Expenditure
207,172
173,745
440,752
390,514
379,279
565,266
272,389
386,592
246,609
362,760
246,375
減価償却費
Depreciation
67,460
71,357
70,167
79,034
91,434
98,196
111,500
125,298
133,726
140,516
150,976
*3
キャッシュ・フロー
Cash Flow
*3
有利子負債
Interest-Bearing Debt
2,226,236
2,287,489
2,604,656
2,906,610
3,481,117
3,623,438
3,667,234
4,048,531
4,430,422
4,416,086
4,632,547
自己資本
Shareholders' Equity
1,922,305
1,984,635
2,204,882
2,342,512
2,408,679
2,555,885
2,796,474
2,900,726
3,110,088
3,146,837
3,277,508
営業活動によるキャッシュ・フロー
Cash Flows from Operating Activities
32,154
227,432
30,143
216,709
87,094
187,862
271,469
297,708
241,697
599,252
145,270
投資活動によるキャッシュ・フロー
Cash Flows from Investing Activities
-239,719
-201,583
-365,464
-388,895
-532,806
-131,035
-210,057
-422,034
-286,987
-321,970
-179,014
財務活動によるキャッシュ・フロー
Cash Flows from Financing Activities
201,110
15,071
289,150
231,238
467,751
-66,565
-139,600
111,448
59,988
-269,367
-59,118
現金及び現金同等物の期末残高
Balance for Cash and Cash Equivalents at
End of Period
109,966
148,546
100,708
157,682
179,472
187,723
142,682
132,310
179,249
163,272
82,317
39.7
44.5
52.6
57.1
62.8
44.8
61.5
69.3
80.2
89.3
101.0
648.5
669.5
743.7
794.9
826.8
885.5
980.7
1,035.8
1,109.9
1,135.1
1,206.1
10
11
13
15
15
15
18
21
28
31
35
4.14
4.59
4.58
4.44
4.18
2.84
3.31
3.86
3.94
4.12
4.46
*4
1株当たり指標
Indicators
per Share
EPS(1株当たり純利益)(円)
*4
*4
BPS (Book-value Per Share) (Yen)
配当金(円)*4
Cash Dividends (Yen)*4
ROA(%)
*6
Financial
Indexes
EPS (Earnings Per Share) (Yen)
BPS(1株当たり純資産)(円)
*5
財務指標
*4
*5
ROA(%)
ROE(%)
*6
ROE(%)
6.20
6.75
7.44
7.42
7.74
5.22
6.61
6.92
7.47
7.95
8.68
D/Eレシオ(倍)*7
D/E Ratio (Times)*7
1.16
1.15
1.18
1.24
1.45
1.42
1.31
1.40
1.42
1.40
1.41
自己資本比率(%)
Equity Ratio (%)
35.8
35.7
35.1
34.4
32.6
33.0
34.1
32.8
32.8
31.9
32.4
総還元性向(%)
Total Payout Ratio (%)
25.2
25.5
35.0
35.1
36.9
44.2
46.6
44.9
52.7
52.7
54.9
*1 事業利益= 営業利益+持分法投資損益(不動産分譲を目的とした関係会社株式売却損益含む)+固定資産売却損益
なお、2023年度以前は営業利益の数字を記載しております。
Business income = Operating income + Equity in earnings/losses of affiliates (including Gain/loss on sales of shares of affiliates for the purpose of real estate sales) + Gain/loss on sales of fixed assets.
Operating income is disclosed instead for fiscal 2023 and prior years
*2 販売用不動産=販売用不動産+仕掛販売用不動産+開発用土地+前渡金/Real property for sale = Real property for sale + real property for sale in progress + land for development + advances paid for purchases
*3 有利子負債=短期借入金+NR短期借入金+CP+短期償還社債+NR短期償還社債+社債+NR社債+⾧期借入金+NR⾧期借入金
Interest-bearing debt = Short-term debt + non-recourse short-term debt + commercial paper+ bonds redeemable within one year + non-recourse bonds redeemable within one year + corporate bonds + non-recourse bonds + long-term debt
- non-recourse long-term debt
*4 普通株式1株につき3株の株式分割を行っております。2022年度以前は前連結会計年度の期首に当該株式分割が行われたと仮定して、数値を算定しております。配当金については小数点以下を四捨五入しております。
The Company conducted a 3-for-1 stock split for common shares, and calculated the figures for fiscal years prior to fiscal year 2022 as if the stock split had been conducted at the beginning of the previous fiscal year.Cash dividends are rounded
to the nearest yen.
*5 2023年度以前:ROA=(営業利益+営業外収益)/総資産期首期末平均残高 2024年度以降:ROA=事業利益/総資産期首期末平均残高
~FY2023:ROA=(Operating income + non-operating income)/average total assets over period FY2024~:ROA=Business income/average total assets over period
*6 ROE=親会社株主に帰属する当期純利益/自己資本期首期末平均残高/ROE=Profit attributable to owners of parent /average shareholders’ equity over the period
*7 D/Eレシオ=有利子負債/自己資本/Debt Equity ratio=Interest-bearing debt/shareholders’ equity
MITSUI FUDOSAN CO., LTD.
80
当社企業データ:非財務データ
5 決算・企業情報等
Financial Results and
Corporate Information, etc.
Company Data:Non-Financial Data
詳細は、「サステナビリティレポート」を参照
https://www.mitsuifudosan.co.jp/esg_csr/report/
年度/FY
温室効果ガス(GHG)排出量
(SBT基準に基づく)
環境指標*1
Environmental Indicators *1
Greenhouse gas (GHG) emissions
(based on SBT standards)
単位/Unit
2019
2020
2021
2022
2023
2024
2025
1,000t-CO2
4,383
4,690
4,199
5,503
3,941
4,611
3,822
うちScope1
Of these, Scope 1
1,000t-CO2
104
115
140
183
186
209
213
うちScope2
Of these, Scope 2
1,000t-CO2
413
363
438
457
430
319
323
Of these, Scope 3
1,000t-CO2
3,865
4,211
3,621
4,863
3,325
4,083
3,285
うちScope 3
*2
*2
エネルギー消費量
Energy usage
*2
Water usage (intake volume)
*2
*2
水使用量(排水量)
Water usage (discharge volume)
*2
1,488,256
1,433,237
3,653,327
3,935,352
4,135,836
4,240,123
4,391,512
1,000㎥/年
1,000 ㎥/year
5,726
5,365
11,849
14,210
15,347
16,145
16,902
1,000㎥/年
1,000 ㎥/year
5,539
4,711
10,445
12,546
13,714
14,417
15,025
t/年
t/year
47,188
38,080
112,375
127,369
137,986
141,460
144,905
MWh
*2
水使用量(取水量)
*2
廃棄物排出量
Waste emissions volume
従業員数(連結)
No. of employees (Consolidated)
人/persons
20,864
23,992
24,408
24,706
25,593
26,630
27,704
うち三井不動産(単体)
Of these, Mitsui Fudosan Co., Ltd.
人/persons
1,678
1,776
1,898
1,973
2,049
1,928
1,981
%
4.5
5.7
6.8
7.7
9.2
10.2
11.1
%
12.5
14.3
16.5
18.0
19.7
18.9
22.4
日/days
14.9
13.8
15.0
16.2
16.2
15.7
15.6
(Non-consolidated)
Women in management positions ratio
女性管理職比率(単体)*3
(Non-consolidated)*3
女性総合職比率(単体)*3
人材指標
Human
Resources Indicators
For details, please refer to the latest Sustainability Report
https://www.mitsuifudosan.co.jp/english/esg_csr/report/
Women in general positions ratio (Non-consolidated)*3
有給休暇取得日数
Number of paid leave days taken
*4
育児休業取得者数(比率) 男性 (単体)
Number (percentage) of persons taking childcare
leave, men (Non-consolidated)*4
人/persons
25(61.0%)
28(70.0%)
38(79.2%)
59(122.9%)
63(116.6%)
Number (percentage) of persons taking childcare
leave, women (Non-consolidated)
人/persons
10(100%)
13(100%)
20(95.2%)
22(100%)
25(96%)
23(100%)
25(100%)
育児休業取得者の復帰率(単体)
Return rate from childcare leave (Non-consolidated)
%
100
100
100
100
100
100
100
健康診断・人間ドック受診率(単体)
Health checkup and screening rate (Non-consolidated)
%
99.8
99.5
100
100
100
100
100
離職率(正社員)(単体)
Employee turnover rate (full-time employees)
%
0.53
0.51
0.81
0.66
0.93
1.31
1.28
育児休業取得者数(比率) 女性 (単体)
(Non-consolidated)
*1 三井不動産および連結子会社のうち、建物保有会社もしくは従業員100人以上の会社が保有する施設となります。集計範囲・方法の見直し等により数値が変動する可能性があります。
*1 Facilities owned by Mitsui Fudosan and its consolidated subsidiaries that either own properties or have 100 or more employees. Values are subject to change due to revisions to aggregation range and methods.
*2 FY2018~FY2020:対象範囲は原則として「エネルギーの使用の合理化等に関する法律」に基づいて報告義務のある施設となります。ただし、一部の施設を除きます。
*2 FY2018-FY2020 : In principle, the scope of the project covers facilities that are required to report based on the Law Concerning the Rational Use of Energy. However, some facilities are excluded.
*3 各年度とも翌年度期初4月1日の数値となります。
*3 Figures for each fiscal year are those for the beginning of the fiscal year starting April 1 of the following year.
*4 育児目的休暇の取得率。分母:該当年度に配偶者が出産した人数、分子:該当年度に育児目的休暇を取得した人数
*4 Percentage of persons taking leave intended for childcare.
Denominator: Number of people whose own spouse gave birth in the relevant year, Numerator: number of persons who took leave for childcare purposes in the relevant year.
MITSUI FUDOSAN CO., LTD.
81
50(100%) 64(103.2%)
主な稼働物件一覧(国内)
5 決算・企業情報等
Financial Results and
Corporate Information, etc.
List of Main Properties in Operation (Domestic)
オフィス
貸付面積約2,069,000㎡ (連結、当社グループ保有物件、2026年3月末時点)
Office Buildings
Leased floor space Approx. 2,069,000㎡ (Consolidated, Own Properties, as of March 31, 2026)
■延床面積1 上位15物件2(2026年3月末時点)
Total floor space1 Top 15 properties2 (As of March 31, 2026)
*1:建物延床面積に当社持分を乗じて算出/Calculated by multiplying the total floor space of the building by our interest
*2:当社が持分を保有する施設を対象/Facilities in which we hold an interest
名称/Name
所在/Location
延床面積(約) /Total Floor Space (Approx.)
竣工/Completion
オフィス以外の用途/Main applications
東京ミッドタウン
TOKYO MIDTOWN
東京都港区
Minato-ku, Tokyo
⋍ 282,000㎡
2007年1月
Jan. 2007
商業、ホテル、住宅
Retail, Hotel, Housing
東京ミッドタウン日比谷
TOKYO MIDTOWN HIBIYA
東京都千代田区
Chiyoda-ku, Tokyo
⋍ 189,000㎡
2018年2月
Feb. 2018
商業
Retail
日本橋室町三井タワー
Nihonbashi Muromachi Mitsui Tower
東京都中央区
Chuo-ku, Tokyo
⋍ 152,000㎡
2019年3月
Mar. 2019
商業
Retail
霞が関ビルディング
Kasumigaseki Building
東京都千代田区
Chiyoda-ku, Tokyo
⋍ 145,000㎡
1968年4月
Apr. 1968
商業
Retail
日本橋三井タワー
Nihonbashi Mitsui Tower
東京都中央区
Chuo-ku, Tokyo
⋍ 134,000㎡
2005年7月
Jul. 2005
商業、ホテル
Retail, Hotel
東京ミッドタウン八重洲
TOKYO MIDTOWN YAESU
東京都中央区
Chuo-ku, Tokyo
⋍ 108,000㎡
2022年8月
Aug. 2022
商業、ホテル
Retail, Hotel
日本橋一丁目三井ビルディング
Nihonbashi 1-Chome Mitsui Building
東京都中央区
Chuo-ku, Tokyo
⋍ 93,000㎡
2004年1月
Jan. 2004
商業
Retail
日本橋髙島屋三井ビルディング
Nihonbashi Takashimaya Mitsui Building
東京都中央区
Chuo-ku, Tokyo
⋍ 84,000㎡
2018年6月
Jun. 2018
商業
Retail
グラントウキョウノースタワー
GranTokyo North Tower
東京都千代田区
Chiyoda-ku, Tokyo
⋍ 82,000㎡
2007年10月
Oct. 2007
商業
Retail
三井住友銀行本店ビルディング
Sumitomo Mitsui Banking Corporation Head Office
Building
東京都千代田区
Chiyoda-ku, Tokyo
⋍ 80,000㎡
2010年7月
Jul. 2010
–
msb Tamachi 田町ステーションタワーS
msb Tamachi Tamachi Station Tower South
東京都港区
Minato-ku, Tokyo
⋍ 75,000㎡
2018年5月
May 2018
商業、ホテル
Retail, Hotel
ゲートスクエア
GATE SQUARE
千葉県柏市
Kashiwa, Chiba
⋍ 48,000㎡
2014年4月
Apr. 2014
商業、住宅
Retail, Housing
北海道札幌市
Sapporo, Hokkaido
⋍ 48,000㎡
2014年8月
Aug. 2014
商業
Retail
室町東三井ビルディング
Muromachi Higashi Mitsui Building
東京都中央区
Chuo-ku, Tokyo
⋍ 40,000㎡
2010年10月
Oct. 2010
商業
Retail
淀屋橋三井ビルディング
Yodoyabashi Mitsui Building
大阪府大阪市
Osaka, Osaka
⋍ 39,000㎡
2008年3月
Mar. 2008
商業
Retail
札幌三井JPビルディング
Sapporo Mitsui JP Building
MITSUI FUDOSAN CO., LTD.
82
主な稼働物件一覧(国内)
5 決算・企業情報等
Financial Results and
Corporate Information, etc.
List of Main Properties in Operation (Domestic)
商業施設
貸付面積約2,248,000㎡ (連結、当社グループ保有物件、2026年3月末時点)
Retail Facilities
Leased floor space Approx. 2,248,000㎡ ( Consolidated , Own Properties, as of March 31, 2026)
■リージョナル型施設店舗面積上位10物件(2026年3月末時点)/Top 10 regional facilities by shop area (As of March 31, 2026)
名称
Name
ららぽーとTOKYO-BAY *1
LaLaport TOKYO-BAY *1
千葉県船橋市
所在
Location
店舗面積(約)
Shop Area
(Approx.)
店舗数(約)
No. of shops
(Approx.)
Funabashi, Chiba
⋍ 133,000㎡
⋍ 420
開業年月
Opening date
1981年4月
Apr. 1981
店舗売上
(10億円単位、2025年度)
Store sales,
Billions of yen, FY2025
79
ららぽーと横浜
LaLaport YOKOHAMA
神奈川県横浜市
Yokohama, Kanagawa
⋍ 93,000㎡
⋍ 280
2007年3月
Mar. 2007
46
ららぽーとEXPOCITY
LaLaport EXPOCITY
大阪府吹田市
Suita, Osaka
⋍ 88,000㎡
⋍ 310
2015年11月
Nov. 2015
57
ららぽーと富士見
LaLaport FUJIMI
埼玉県富士見市
Fujimi, Saitama
⋍ 80,000㎡
⋍ 290
2015年4月
Apr. 2015
56
ラゾーナ川崎プラザ
LAZONA Kawasaki Plaza
神奈川県川崎市
Kawasaki, Kanagawa
⋍ 79,000㎡
⋍ 330
2006年9月
Sep. 2006
99
ららぽーと福岡
LaLaport FUKUOKA
福岡県福岡市
Fukuoka, Fukuoka
⋍ 73,000㎡
⋍ 220
2022年4月
Apr. 2022
48
ららぽーと豊洲
LaLaport TOYOSU
東京都江東区
Koto-ku, Tokyo
⋍ 67,000㎡
⋍ 210
2006年10月
Oct. 2006
52
ららぽーと門真
/ MOP大阪門真23
LaLaport Kadoma
/ MOP Osaka Kadoma23
大阪府門真市
Kadoma, Osaka
⋍ 66,000㎡
⋍ 250
2023年4月
Apr. 2023
45
ららぽーと沼津
LaLaport NUMAZU
静岡県沼津市
Numazu, Shizuoka
⋍ 64,000㎡
⋍ 210
2019年10月
Oct. 2019
35
ららぽーと愛知東郷
LaLaport AICHI TOGO
愛知県愛知郡
Aichi-gun, Aichi
⋍ 63,000㎡
⋍ 200
2020年9月
Sep. 2020
29
*1:ららぽーとTOKYO-BAY North Gateを含む数値/Including LaLaport TOKYO-BAY North Gate
■アウトレット型施設店舗面積上位10物件(2026年3月末時点)/Top 10 Outlet-type Facilities by shop area (As of March 31, 2026)
名称 *3
Name
MOP木更津
MOP KISARAZU
千葉県木更津市
所在
Location
店舗面積(約)
Shop Area
(Approx.)
店舗数(約)
No. of shops
(Approx.)
Kisarazu, Chiba
⋍ 53,100㎡
⋍ 330
2012年4月
Apr. 2012
開業年月
Opening date
店舗売上
(10億円単位、2025年度)
Store sales,
Billions of yen, FY2025
79
MOPジャズドリーム⾧島
MOP JAZZ DREAM NAGASHIMA
三重県桑名市
Kuwana, Mie
⋍ 46,000㎡
⋍ 300
2002年3月
Mar. 2002
58
MOP滋賀竜王
MOP SHIGA RYUO
滋賀県蒲生郡
Gamo-gun, Shiga
⋍ 37,000㎡
⋍ 240
2010年7月
Jul. 2010
31
MOP岡崎
MOP OKAZAKI
愛知県岡崎市
Okazaki, Aichi
⋍ 35,000㎡
⋍ 180
2025年11月
Nov. 2025
14 *4
MOP札幌北広島
MOP SAPPOROKITAHIROSHIMA
北海道北広島市
Kitahiroshima, Hokkaido
⋍ 30,000㎡
⋍ 180
2010年4月
Apr. 2010
30
MOP横浜ベイサイド
MOP YOKOHAMA BAYSIDE
神奈川県横浜市
Yokohama, Kanagawa
⋍ 27,000㎡
⋍ 170
1998年9月
Sep. 1998
24
MOP北陸小矢部
MOP HOKURIKU OYABE
富山県小矢部市
Oyabe, Toyama
⋍ 26,000㎡
⋍ 170
2015年7月
Jul. 2015
11
MOPマリンピア神戸
MOP MARINE PIA KOBE
兵庫県神戸市
Kobe, Hyogo
⋍ 23,000㎡
⋍ 140
1999年10月
Oct. 1999
22
MOP幕張
MOP MAKUHARI
千葉県千葉市
Chiba, Chiba
⋍ 23,000㎡
⋍ 140
2000年10月
Oct. 2000
22
MOP仙台港
MOP SENDAI PORT
宮城県仙台市
Sendai, Miyagi
⋍ 20,000㎡
⋍ 120
2008年9月
Sep. 2008
15
*2 「ららぽーと」と「三井アウトレットパーク」の複合物件、数値は全て合算し算出。 / Complex property of “LaLaport” and “MITSUI OUTLET PARK". All figures are combined.
*3 MOP=三井アウトレットパーク / MITSUI OUTLET PARK
*4 2025年11月開業後の店舗売上 / Store Sales Following the Opening in November 2025
MITSUI FUDOSAN CO., LTD.
83
主な稼働物件一覧(国内)
5 決算・企業情報等
Financial Results and
Corporate Information, etc.
List of Main Properties in Operation (Domestic)
物流施設
稼働施設延床面積約2,200,000㎡(連結、当社グループ保有物件、2026年3月末時点)
Logistics Facilities
Operating Facilities Total Floor Space Approx. 2,200,000㎡ (Consolidated,Own Properties, as of March 31, 2026)
■延床面積上位10物件*1(2026年3月末時点)/Total floor space Top 10 properties *1 (As of March 31, 2026)
名称/Name
MFLP船橋Ⅰ
MFLP船橋Ⅱ
*1:当社が持分を保有する施設を対象/Facilities in which we hold an interest
延床面積(約)/Total Floor
Space(Approx.)
所在/Location
MFLP FUNABASHIⅠ
千葉県船橋市
Funabashi, Chiba
⋍ 198,000㎡
MFLP FUNABASHIⅡ
千葉県船橋市
Funabashi, Chiba
⋍ 229,000㎡
MFLP船橋Ⅲ
MFLP FUNABASHIⅢ
千葉県船橋市
Funabashi, Chiba
MFLP・LOGIFRONT東京板橋
MFLP・LOGIFRONT TOKYO ITABASHI
東京都板橋区
Itabashi-ku, Tokyo
MFLP日野
MFLP HINO
東京都日野市
MFLP市川塩浜Ⅱ
MFLP ICHIKAWA SHIOHAMAⅡ
東京レールゲートEAST
MFLP座間
竣工/Completion
テナント構成/Tenant Composition
2016年10月 Oct. 2016
マルチテナント
Multi-tenant
2019年10月 Oct. 2019
マルチテナント
Multi-tenant
⋍ 271,000㎡
2021年6月
Jun. 2021
マルチテナント
Multi-tenant
⋍ 256,000㎡
2024年9月
Sep. 2024
マルチテナント
Multi-tenant
Hino-shi, Tokyo
⋍ 205,000㎡
2015年10月 Oct. 2015
マルチテナント
Multi-tenant
千葉県市川市
Ichikawa, Chiba
⋍ 184,000㎡
2022年3月
Mar. 2022
マルチテナント
Multi-tenant
TOKYO RAIL GATE EAST
東京都品川区
Shinagawa-ku, Tokyo
⋍ 174,000㎡
2022年7月
Jul. 2022
マルチテナント
Multi-tenant
MFLP ZAMA
神奈川県座間市
Zama, Kanagawa
⋍ 134,000㎡
2023年9月
Sep. 2023
マルチテナント
Multi-tenant
MFLP海老名Ⅰ
MFLP EBINA Ⅰ
神奈川県海老名市
Ebina, Kanagawa
⋍ 122,000㎡
2022年9月
Sep. 2022
マルチテナント
Multi-tenant
MFLPつくばみらい
MFLP TSUKUBAMIRAI
茨城県つくばみらい市
Tsukubamirai, Ibaraki
⋍ 98,000㎡
2025年4月
Apr. 2025
一棟
Entire building rental
ホテル・リゾート
稼働施設室数約13,300室(連結、2026年3月末時点)
Hotels and Resorts
Number of rooms in operation Approx. 13,300 (Consolidated, as of March 31, 2026)
■宿泊主体型ホテル施設室数上位10物件(2026年3月末時点)/Top 10 Lodging-focused Hotels by rooms (As of March 31, 2026)
名称/Name*2
東京ドームホテル
Tokyo Dome Hotel
所在/Location
東京都文京区
室数(約)/Rooms(Approx.)
Bunkyo-ku, Tokyo
開業/Opening Date
⋍ 1000
2000年6月
Jun. 2000
スキーム/Scheme
土地・建物保有
Land and buildings owned
MGHプラナ東京ベイ
MGH PRANA Tokyo Bay
千葉県浦安市
Urayasu, Chiba
⋍ 550
2007年6月
Jun. 2007
建物賃借
Leased building
MGH汐留イタリア街
MGH Shiodome Italia-gai
東京都港区
Minato-ku, Tokyo
⋍ 370
2007年4月
Apr. 2007
建物賃借
Leased building
Leased land and own building
MGH五反田
MGH Gotanda
東京都品川区
Shinagawa-ku, Tokyo
⋍ 370
2018年6月
Jun. 2018
借地・建物保有
MGH横浜みなとみらいプレミア
MGH Yokohama Minatomirai PREMIER
神奈川県横浜市
Yokohama, Kanagawa
⋍ 360
2023年5月
May 2023
建物賃借
Leased building
MGH神宮外苑の杜プレミア
MGH Jingugaien Tokyo PREMIER
東京都新宿区
Shinjuku-ku, Tokyo
⋍ 360
2019年11月
Nov. 2019
借地・建物保有
Leased land and own building
MGH銀座プレミア
MGH Ginza PREMIER
東京都中央区
Chuo-ku, Tokyo
⋍ 360
2005年11月
Nov. 2005
土地・建物保有
Land and buildings owned
MGH京都四条
MGH Kyoto Shijo
京都府京都市
Kyoto, Kyoto
⋍ 340
1997年10月
Oct. 1997
建物賃借
Leased building
MGH銀座五丁目
MGH Ginza-gochome
東京都中央区
Chuo-ku, Tokyo
⋍ 340
2019年9月
Sep. 2019
土地・建物保有
Land and buildings owned
ミレニアムMGH東京
Millennium MGH Tokyo
東京都中央区
Chuo-ku, Tokyo
⋍ 330
2014年12月
Dec. 2014
建物賃借
Leased building
*2:MGH=三井ガーデンホテル/Mitsui Garden Hotel
■主なリゾート・ラグジュアリー施設(2026年3月末時点)/Main Operating Resort and Luxury Facilities (As of March 31, 2026)
名称/Name
ハレクラニ沖縄
Halekulani Okinawa
HOTEL THE MITSUI KYOTO
所在/Location
室数(約)/Rooms(Approx.)
開業/Opening Date
スキーム/Scheme
沖縄県国頭郡
Kunigami-gun, Okinawa
⋍ 360
2019年7月
Jul. 2019
土地・建物保有
Land and buildings owned
京都府京都市
Kyoto, Kyoto
⋍ 160
2020年11月
Nov. 2020
土地・建物保有
Land and buildings owned
フォーシーズンズホテル東京大手町
Four Seasons Hotel Tokyo at Otemachi
東京都千代田区
Chiyoda-ku, Tokyo
⋍ 190
2020年9月
Sep. 2020
土地・建物保有
Land and buildings owned
ブルガリ ホテル 東京
Bvlgari Hotel Tokyo
東京都中央区
Chuo-ku, Tokyo
⋍ 100
2023年4月
Apr. 2023
土地・建物保有
Land and buildings owned
MITSUI FUDOSAN CO., LTD.
84
主な稼働物件一覧(海外)
5 決算・企業情報等
Financial Results and
Corporate Information, etc.
List of Main Properties in Operation (Overseas)
■欧米(2026年3月末時点)/Europe and North America (As of March 31, 2026)
アセット
Asset
オフィス
Office
Buildings
賃貸住宅
Rental
Housing
名称
Name
所在
Location
建物延床面積(約)または戸数
Total Floor Space(Approx.) for lease
or Number of Units
竣工
Completion
50 Hudson Yards
New York, US
⋍ 270,000㎡
2022年 /2022
55 Hudson Yards
New York, US
⋍ 118,000㎡
2018年 /2018
1251 Avenue of the Americas
New York, US
⋍ 215,000㎡
1970年 /1970
Waterfront Corporate Center Ⅲ
Hoboken, US
⋍ 54,000㎡
2015年 /2015
The Homer Building
Washington D.C., US
⋍ 46,000㎡
1913年 /1913
1200 17th Street, NW Seventeenth
Washington D.C., US
⋍ 22,000㎡
2014年 /2014
270 Brannan
San Francisco, US
⋍ 20,000㎡
2016年 /2016
5 Hanover Square,W1
London, UK
⋍ 8,000㎡
2012年 /2012
1 Angel Court
London, UK
⋍ 45,000㎡
2017年 /2017
Television Centre
London, UK
⋍ 55,000㎡
2017年 /2017
Maple Terrace
Dallas, US
⋍ 340 戸 /Units
2024年 /2024
160Madison
New York, US
⋍ 320 戸 /Units
2015年 /2015
■APAC(2026年3月末時点)/APAC (As of March 31, 2026)
アセット
Asset
商業施設
Retail
Facilities
MITSUI FUDOSAN CO., LTD.
名称
Name
所在
Location
店舗面積(約)
Shop Area (Approx.)
店舗数(約)
Shops(Approx.)
開業
Opening Year
三井アウトレットパーク台湾林口
MITSUI OUTLET PARK LINKOU
台湾
Taiwan
⋍ 72,000㎡
⋍ 300
2016年 /2016
ららぽーと台北南港
LaLaport TAIPEI NANGANG
台湾
Taiwan
⋍ 70,000㎡
⋍ 300
2025年 /2025
ららぽーと台中
LaLaport TAICHUNG
台湾
Taiwan
⋍ 68,000㎡
⋍ 300
2023年 /2023
三井アウトレットパーク台南
MITSUI OUTLET PARK TAINAN
台湾
Taiwan
⋍ 44,000㎡
⋍ 236
2022年 /2022
三井アウトレットパーク台中港
MITSUI OUTLET PARK TAICHUNG PORT
台湾
Taiwan
⋍ 43,000㎡
⋍ 220
2018年 /2018
三井アウトレットパーク クアラルンプール国際空港 セパン
MITSUI OUTLET PARK KLIA Sepang
マレーシア
Malaysia
⋍ 34,000㎡
⋍ 200
2015年 /2015
ららぽーと ブキッ・ビンタン シティ センター
LaLaport BUKIT BINTANG CITY CENTRE
マレーシア
Malaysia
⋍ 82,600㎡
⋍ 400
2022年 /2022
ららぽーと上海金橋
LaLaport SHANGHAI JINQIAO
中国
China
⋍ 55,000㎡
⋍ 180
2021年 /2021
ららステーション上海蓮花路
LaLa Station SHANGHAI LIANHUA ROAD
中国
China
⋍ 16,500㎡
⋍ 90
2021年 /2021
85
5 決算・企業情報等
マーケット動向:オフィス
Financial Results and
Corporate Information, etc.
Market Trends:Office
都心5区のオフィス市況(平均賃料・空室率)
資料:三⿁商事
Source: Miki Shoji
Office Building Market Trend (Average Rent / Vacancy Rate) - 5 Wards of Central Tokyo
平均賃料(左軸)/Average rent (Left)
円/坪 Yen/Tsubo
空室率(右軸)/Vacancy rate (Right)
(%)
10
25,000
2003年6月/Jun. 2003
8.57%
2012年6月/Jun. 2012
9.43%
9
8
20,000
7
2020年7月:23,014円/坪
2008年8月:22,901円/坪
15,000
6
July 2020:23,014 Yen/Tsubo
Aug.2008:22,901 Yen/Tsubo
5
4
10,000
3
2
5,000
1
0
0
03/3
04/3
05/3
06/3
07/3
08/3
09/3
10/3
11/3
オフィスビル新規供給量(東京23区大規模、暦年)
12/3
13/3
14/3
15/3
16/3
百万㎡/Million ㎡
過去(‘86~’25) 平均102万㎡/年(延床面積ベース)
‘26年~’30年平均82万㎡/年(延床面積ベース)
Past (‘86~’25) supply volume (Annual average)
1.02 million m2/year (Total floor space)
Forecast supply volume ’26~’30 (Annual average)
0.82 million ㎡/year (Total floor space)
2
2.0
1.5
1.79
1.75
1.54
1.0
1.41
1.5
1.19
1
0.77
1.17
0.86 0.85
0.65
0.5
1.25
1.09
0.87
0.58
0.97
0.84
0.15
0.61
0.48
0.5
0.17
0.99
0.85
0.69
1.17
1.17
0.67
0.43
0.0
0.44
1
0.84
0.84
0.06
0.67
-0.5
0.38
0
-1.0
'05 '06 '07 '08 '09 '10 '11 '12 '13 '14 '15 '16 '17 '18 '19 '20 '21 '22 '23 '24 '25 '26 '27 '28 '29 '30
未竣工(その他18区)/Uncompleted (other 18 wards)
未竣工(都心5区)/Uncompleted (5 wards of central Tokyo)
竣工済/Completed
MITSUI FUDOSAN CO., LTD.
19/3
20/3
21/3
22/3
Net Absorption Trend
(5 wards of Central Tokyo, Calendar year)
百万㎡/Million ㎡
2.5
18/3
23/3
24/3
25/3
26/3
都心5区のネットアブソープション(暦年)
資料:森ビル 2026.5.29
Source: Mori Building Co., Ltd.
(As of May 29, 2026)
Trend of Supply Volume of Large-Scale Office
Buildings within Tokyo’s 23 Wards (Calendar year)
17/3
86
資料:三幸エステート
Source: Sanko Estate
マーケット動向:オフィス
5 決算・企業情報等
Financial Results and
Corporate Information, etc.
Market Trends:Office
Desired areas for new renters*2 (Top 10 areas)
Tokyo Major Area Office Rent Trends*1
20
18
(Yen/Month・Tsubo)
60,000
17
16
15
Yaesu,Nihonbashi
and Kyobashi
*For 2019 and 2020, the survey was conducted on a single-year basis.
From 2021 onward, the survey is based on a 3-year average.
14
14
13
12
12
10
10
55,000
*2 Average of survey results for 2023-2025
Multiple responses allowed
400 companies responded each year
10
5
Marunouchi and Otemachi
50,000
0
(%)
45,000
Nihonbashi-Honcho and
Muromachi
• The desired areas for companies seeking new accommodation continue to be major business districts such as
Sakurabaoka and
Nanpeidai
40,000
Nihonbashi, Marunouchi, Otemachi, and Toranomon, where large-scale redevelopment projects have taken place or
are in progress.
Shibuya and Dogenzaka
Shinbashi and
Toranomon
35,000
Roppongi and Azabu
Nishi-shinjuku
30,000
These areas have been the focus of large-scale redevelopment projects, and their popularity reflects high expectations for benefits
such as convenient transport links stemming from the construction of new stations, roads and other infrastructure, as well as
the attraction of highly functional mixed-use developments that bring work, living and recreation closer together.
Extracted from Mori Building Co., Ltd. "2025 Survey of Office Needs in Tokyo’s Core 23 Cities"
Reasons for Planning to Lease New Office Space
(companies with 300 or more employees)*3(Top 10 reasons)
50
40
25,000
30
*3 Multiple answers allowed, n=61
38
33
31
31
28
26
25
25
23
20
20,000
10
0
(%)
15,000
Source:Mori Building Co., Ltd. "2025 Survey of Office Needs in Tokyo’s Core 23 Cities"
Target : Approximately 10,000 companies with headquarters in the 23 wards of Tokyo
(approx. 1,700 valid responses)
Source: Prepared by the Company based on data from Sanko Estate
*1 Asking rent including common service fees for large buildings of at least 200 tsubo per floor
MITSUI FUDOSAN CO., LTD.
87
23
5 決算・企業情報等
マーケット動向:住宅
Financial Results and
Corporate Information, etc.
Market Trends:Housing
首都圏分譲マンションの新規発売戸数と戸当たり平均価格および中古マンションの成約戸数(暦年)
資料:不動産経済研究所、東日本不動産流通機構
Source: Real Estate Economic Institute、
Real Estate Information Network for East Japan
Tokyo Metropolitan Area Condominium Market:New Units Launched and Average Price per Unit ,
and Existing Condo Units Sold (Calendar year)
千戸
Thousands of units
100.0
95.6
89.3
90.0
中古成約戸数(左軸)
新築マンション平均価格(首都圏)(右軸)(括弧内、対前年比)
New units launched (Left)
Resale units sold (Left)
Average New Condominium Price: Tokyo Metropolitan Area (Right)
88.5
85.4
83.2
80.0
61.0
46.4
50.0
40.6
40.2
-0.2
-0.6
40.0
40.6
41.0
47.7
47.1
45.7
45.3
(2.8%)
42.0 (10.6%)
(4.0%)
(-2.9%)
(-0.8%)
(-5.0%)
(0.1%) (2.2%)
56.5
41.0
40.0
30.0
25.8
25.5
25.6
26.8
28.3
26.7
80.0
60.8
70.0
-2.5
90.0
(-3.5%)
(28.8%)
62.8
62.6 (0.4%)
59.8
59.0
58.7
(2.9%)
55.1
54.9 (7.6%)
(1.9%)(1.7%)
(-0.6%)
50.6
(9.1%)
(-0.5%)
49.2
45.4
(8.6%)(2.7%)
74.5
60.0
(17.4%)
78.2
81.0
(Figures in bracket indicate YoY change)
84.1
百万円
Millions of yen
91.8
新規発売戸数(左軸)
29.7
28.7
43.7
28.9
44.9
36.8
36.4
45.6
44.5
44.5
32.4
31.3
30.0
29.6
37.2
37.3
37.2
37.1
35.9
34.8 35.8
40.4
33.3
38.1
31.2
35.8
39.8
32.9
27.2
70.0
60.0
49.1
26.8
40.0
37.2
36.0
35.4
28.6
50.0
23.0
22.0
21.9
30.0
20.0
20.0
10.0
10.0
0.0
0.0
2000
2001
2002
2003
2004
2005
2006
2007
2008
2009
2010
2011
2012
2013
2014
2015
2016
2017
2018
2019
2020
2021
2022
2023
2024
2025
2026
(予測)
(E)
首都圏分譲マンションの初月契約率と販売在庫数
資料:不動産経済研究所
Source: Real Estate Economic Institute
Condominium Market in the Tokyo Metropolitan Area:Initial Month Contract & Unsold Inventory
千戸 / Thousands of units
(%)
12
100.0
在庫(左軸)
初月契約率(右軸)
Inventories(Left)
Initial month contract rate(Right)
90.0
10
80.0
70.0
8
60.0
6
50.0
40.0
4
30.0
20.0
2
10.0
0
07/1
07/7
08/1
08/7
MITSUI FUDOSAN CO., LTD.
09/1
09/7
10/1
10/7
11/1
11/7
12/1
12/7
13/1
13/7
14/1
14/7
15/1
15/7
16/1
16/7
17/1
88
17/7
18/1
18/7
19/1
19/7
20/1
20/7
21/1
21/7
22/1
22/7
23/1
23/7
24/1
24/7
25/1
25/7
26/1
26/7
26/9
0.0
5 決算・企業情報等
マーケット動向:商業施設
Financial Results and
Corporate Information, etc.
Market Trends:Retail
業態別の売上高前年対比
資料:百貨店協会、日本ショッピングセンター協会、チェーンストア協会
Source: Japan Department Stores Association,
Japan Council of Shopping Centers, Japan Chain Stores Association
Year-on-Year Change in Sales by Category
2015
2016
2017
2018
2019
2020
2021
2022
2023
2024
2025
2026
20.0%
百貨店
Department stores
SC総合
General shopping centers
15.0%
チェーンストア
Chain stores
10.0%
5.0%
0.0%
-5.0%
-10.0%
-15.0%
-20.0%
1Q
2Q
3Q
4Q
1Q
2Q
3Q
4Q
1Q
2Q
3Q
4Q
1Q
2Q
3Q
4Q
1Q
2Q
3Q
4Q
1Q
2Q
3Q
4Q
1Q
2Q
3Q
4Q
1Q
2Q
3Q
4Q
1Q
2Q
3Q
4Q
1Q
2Q
3Q
4Q
1Q
2Q
3Q
4Q
1Q
*<SC総合>1Q,FY2020:-48.8% / 1Q,FY2021:42.7% <百貨店>1Q,FY2020:-51.7% / 2Q,FY2020:-25.6% / 1Q,FY2021:44.9%
*<General shopping centers>1Q,FY2020:-48.8% / 1Q,FY2021:42.7% <Department stores>1Q,FY2020:-51.7% / 2Q,FY2020:-25.6% / 1Q,FY2021:44.9%
世界のEC化率 20.5%
日本のEC市場規模の推移(BtoC)(暦年)
EC Market in Japan (BtoC) (Calendar year)
十億円
Billions of yen
25,000
EC市場規模(左軸)*1
EC化率(右軸)*2
Sales in EC market (Left)*1
EC ratio (Right)*2
Global EC rate 20.5%
資料:経済産業省
Source: METI
20,000
15,000
10,000
5,000
4.37%
3.40%
9,513
4.75%
5.43%
5.79%
6.76%
6.22%
8.08%
11,166
12,797
13,774
15,135
2014
2015
2016
16,505
17,984
9.13%
9.38%
9.78%
9.80%
10.00%
8.00%
3.85%
19,360
8.78%
19,277
20,695
22,744
24,843
26,122
27,558
6.00%
4.00%
2.00%
0
0.00%
2012
2013
*1:EC市場規模には物販系分野、サービス系分野、デジタル系分野を含む
*2:EC化率データの対象は物販系分野のみ
MITSUI FUDOSAN CO., LTD.
2017
2018
2019
2020
2021
*1 Scope of e-commerce market includes online ordering, services and digital
*2 Data on shift to e-commerce is for online ordering only
89
2022
2023
2024
2025
5 決算・企業情報等
マーケット動向:不動産売買
Financial Results and
Corporate Information, etc.
Market Trends:Real Property Sales
金利の推移(日本・米国・英国):2014/1/1~2026/9/30
Interest Rate Trends (Japan, the U.S., and the U.K.) : Jan. 1, 2014 - Sep. 30, 2026
日本/Japan
米国/U.S.
6.0%
6.0%
4.0%
4.0%
3.03%
2.0%
-2.0%
5.29%
4.00%
2.0%
1.00%
0.87%
0.0%
英国/U.K.
6.0%
2.92%
0.0%
5.42%
4.0%
3.75%
2.0%
1.92%
0.0%
-2.0%
-2.0%
-4.0%
実質金利 Real Interest Rate
実質金利 Real Interest Rate
実質金利 Real Interest Rate
政策金利 Policy Interest Rate
政策金利 Policy Interest Rate
政策金利 Policy Interest Rate
10年国債利回り 10-Year Government Bond Yield
10年国債利回り 10-Year Government Bond Yield
10年国債利回り 10-Year Government Bond Yield
実質金利は10年物価連動債利回りを使用 / The real interest rate is based on the 10-year
inflation-linked bond yield
資料:Bloomberg掲載データより当社作成
Source: Prepared by our company based on data published by Bloomberg.
国内・米国・英国における不動産期待利回りのベンチマーク
Benchmark of Expected Real Estate Yields in Japan, the U.S., and the U.K.
日本/Japan
7.5%
プライムエリアオフィス
米国/U.S.
(2026年10月時点)
(As of Oct. 2026)
7.5%
Offices in prime locations
賃貸住宅(西海岸・東海岸・サンベルト)
英国/U.K.
(2026年6月末時点)
(As of Jun. 2026)
7.5%
Rental Housing (West Coast, East Coast, Sunbelt)
6.5%
6.5%
5.5%
5.5%
4.5%
4.5%
3.5%
3.5%
3.5%
2.5%
2.5%
1.5%
1.5%
プライムオフィス(ウエストエンド)
Prime Offices(West End)
(2026年6月末時点)
(As of Jun. 2026)
6.5%
5.4%
5.3%
5.2%
5.5%
4.5%
4.0%
2.5%
2.3%
1.5%
プライムエリアオフィス:東京都心プライムエリア(基準階200坪以上)の中規模・上位グレードオフィス
利回りベンチマーク(NCFベース):大和不動産鑑定が還元利回りの査定においてベースとする各用途・
各地域ごとの利回りを指す
Offices in prime locations: Mid-sized and upper-grade office buildings located in the prime areas
of central Tokyo, with a standard floor area of 200 tsubo or more.
Yield benchmark (on an NCF basis): Yield by use and region based on an assessment of
西海岸(SF)
東海岸(BOS)
サンベルト(ダラス)
West Coast (SF)
East Coast (BOS)
Sunbelt (Dallas)
資料:Bloomberg掲載データより当社作成
Source: Prepared by our company based on data published by Bloomberg.
capitalization rates by Daiwa Real Estate Appraisal Co., Ltd.
資料:大和不動産鑑定
Source: Survey by Daiwa Real Estate Appraisal Co., Ltd.
MITSUI FUDOSAN CO., LTD.
90
資料:ジョーンズ ラング ラサール提供データより当社作成
Source: Prepared by our company based on data by Jones Lang LaSalle.
5 決算・企業情報等
マーケット動向:ホテル・リゾート
Financial Results and
Corporate Information, etc.
Market Trends:Hotels and Resorts
外国人・日本人延べ宿泊者数の推移(暦年)
資料:観光庁
Source: Japan Tourism Agency
Total number of foreign and Japanese guests (Calendar year)
百万人泊
Million guest nights
日本人延べ宿泊者数
外国人延べ宿泊者数
Total number of Japanese guests
Total number of foreign guests
700
600
500
400
309
301
300
22
18
200
100
287
283
2008
2009
413
417
27
18
439
465
473
33
44
26
504
492
509
65
69
79
537
115
94
398
413
432
2010
2011
2012
2013
428
438
423
331
429
117
164
179
499
494
481
2023
2024
2025
16
317
4
480
443
661
450
20
385
659
617
596
433
311
313
2020
2021
0
2014
2015
2016
2017
2018
2019
2022
訪日外国人旅行者数・出国日本人数の推移(暦年)
資料:日本政府観光局
Source: Japan National Tourism Organization
Number of Foreign Visitors to Japan and Japanese Travelers Going Abroad (Calendar year)
2030年における訪日外国人数の目標は6,000万人
百万人
Million people
60
The target for the number of foreign visitors to Japan in 2030 is 60 million
出国日本人数
訪日外国人旅行者数
Number of Japanese people going abroad
Number of foreign travelers visiting Japan
50
40
41
50
26
8
10
13
16
18
17
16
16
17
17
18
20
2011
2012
2013
2014
2015
2016
2017
2018
2019
25
20
8
6
16
2010
23
19
24
28
31
91
34
36
0.76
7
4
3
0
MITSUI FUDOSAN CO., LTD.
49
31
27
30
10
30
35
46
57
51
2020
0
0.25
0
2021
0.51
25
9
2022
42
2023
13
14
2024
2025




























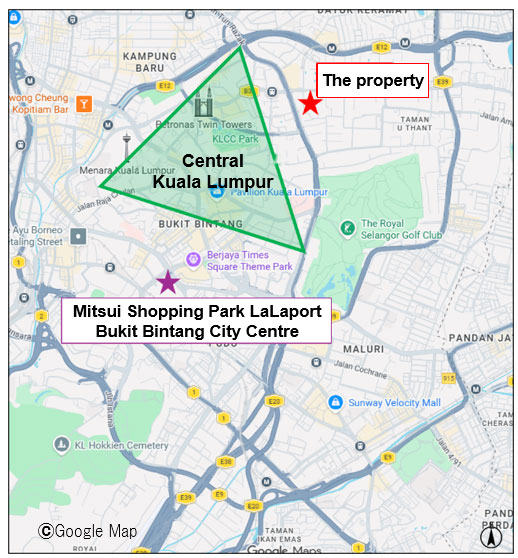
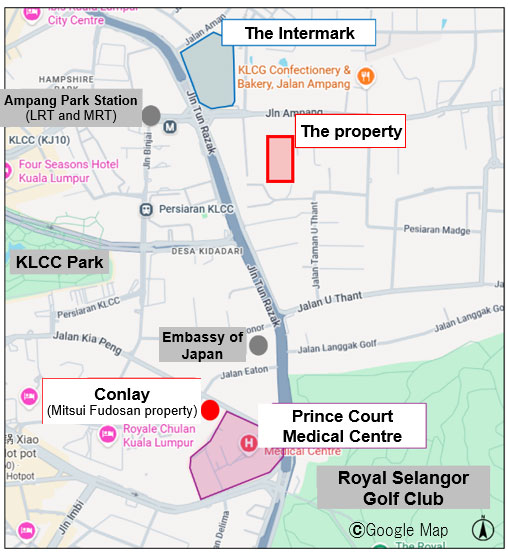
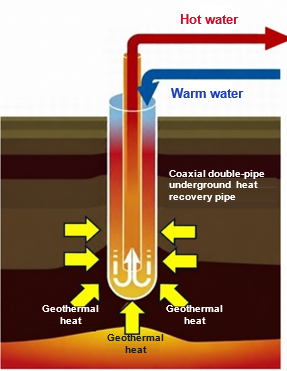
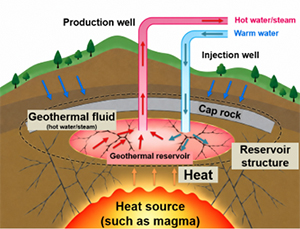 * Created using generative AI