SUSTAINABILITY DATA BOOK 2026 2025.4.1 2026.3.31 Introduction イントロダクション Sustainability Environment Social Governance トップコミットメント…
SUSTAINABILITY
DATA BOOK
2026
2025.4.1 2026.3.31
Introduction
イントロダクション
Sustainability
Environment
Social
Governance
トップコミットメント
東京センチュリーグループは、2026年度、新たなパーパス(存在意義)として「青い地球の未来をつくる」を掲げ
ました。このパーパスは、私たちが100年後の未来においても社会から必要とされる企業であり続けるための、揺
るぎない「北極星」であり、SDGsを経営の中核に据えるというコミットメントの表れでもあります。
今後さらなる飛躍を遂げるために、私たちは、これまでの延長線上にはない成長を目指す「挑戦する組織」へと生
まれ変わらなければなりません。「第二創業期」にある私たちは、自らを「地球規模の社会課題を解決に導く“永遠の
ベンチャー企業”」と定義。社会価値・人財価値の極大化が、経済価値を創出し、企業価値の極大化をもたらす「サス
テナビリティ経営」をさらに深化させてまいります。
社会課題解決型ビジネスによる価値創造の深化
私たちは、脱炭素社会への貢献、技術革新に対応した新事業創出や持続可能な資源利用など、5つのマテリアリ
ティ(重要課題)を経営の中核に据えています。世界有数のパートナーとの「共創力」と、当社の強みである「モノ価
値の目利き力」に専門人材を掛け合わせ、サーキュラーエコノミーの構築をはじめとする「社会課題解決型ビジネス」
を強力に推進します。これらを通じて創出される「社会的インパクト」を可視化し、成長投資を促し、非財務価値を
財務価値へと確実に繋げていくプロセスを深化させてまいります。
変革を支える「人財価値」と「ガバナンス」
サステナビリティ経営を支える真の基盤は、役職員一人ひとりの「志」と「挑戦」に他なりません。私たちは「人財
力」を経済価値の先行指標と捉え、多様な専門性を持つプロフェッショナルが前例のない領域に挑戦できるよう、新
人事制度を構築し、人的資本の最大化を図ってまいります。
同時に、この非連続な成長を支えるのは、健全かつ透明性の高い経営基盤です。CxO体制への移行によるグルー
プガバナンスの強化と、リスクアペタイト・フレームワークの本格導入により、高度な意思決定とリスク管理を両
立させ、ステークホルダーの皆さまからの信頼に応える強靭な組織を築いてまいります。
ステークホルダーの皆さまとともに
すべての礎は「信頼」です。役職員、そして、パートナーとともに道徳経済合一のもと、新たなストーリーを描く。
これが私たちの歩み方です。お客さま、株主・投資家、地域社会の皆さまとの対話を深め、100年先まで続く持続可
能な未来への挑戦を続けてまいります。
東京センチュリーの挑戦に、どうぞご期待ください。
代表取締役社長 CEO
藤原 弘治
「青い地球の未来をつくる」
—地球規模の社会課題を解決に導く
“永遠のベンチャー企業”でありたい
1
Introduction
イントロダクション
Sustainability
Environment
Social
Governance
編集方針
SUSTAINABILITY DATA BOOKの位置付け
本データブックは、株主・投資家、お客さま、お取引先をはじめとする幅広いステークホルダーの皆さまに、
東京センチュリーグループのサステナビリティに関する考え方や推進体制、2025年度の主な取り組み、
およびESGパフォーマンスデータをご報告することを目的として作成しています。
東京センチュリーグループは、事業活動を通じて社会課題の解決に取り組み、持続可能な社会の実現と企
業価値の向上の両立を目指しています。本データブックでは、そうした取り組みの状況や成果を具体的に
紹介しています。
なお、当社の価値創造ストーリーや中長期的な経営戦略については「統合レポート」にてご報告しており、
本データブックは、ESGの客観的な定量データや詳細なパフォーマンスを網羅的に開示する役割を担っ
ています。関連する方針や定性的な取り組み事例については、当社コーポレートサイト等のリンク(URL)
を適宜記載し、必要な情報へスムーズにアクセスいただける構成としています。
本データブックを通じて、東京センチュリーグループのサステナビリティへの取り組みに対する理解を
深めていただくとともに、ステークホルダーの皆さまとの建設的な対話の促進に繋がれば幸いです。
報告の対象
対象組織
原則として東京センチュリー株式会社および連結子会社を対象としています。一部、
東京センチュリー株式会社単体もしくは特定の範囲を対象としているものがあり、そ
の場合は個別に対象範囲を明示しています。
対象期間
2025年4月1日~2026年3月31日
(一部対象期間以降の活動内容を含みます)
発行2026年10月
環境パフォーマンスデータの情報の信頼性を確保するため、GHG排出量スコープ1・2および3(カテゴ
リー1、4、5、13、15)、エネルギー使用量、産業廃棄物排出量、ならびに京セラTCLソーラー合同会社の
太陽光発電事業による年間発電量およびCO
2
削減貢献量について、デロイト トーマツ サステナビリティ
株式会社による第三者保証を受けています。
詳細はP15~18「算定基準」「第三者保証」をご参照ください。
第三者保証
凡例
※ 東京センチュリー(株)、EPC Japan(株)、TCエージェンシー(株)、エス・ディー・エル(株)、FLCS(株)、(株)アイテックリース、
(株)IHIファイナンスサポート
(エス・ディー・エル(株)は2026年4月1日をもって東京センチュリー(株)に吸収合併となりました)
: 東京センチュリーの環境マネジメントシステム(EMS)適用範囲7社
※
EMS
: 東京センチュリー単体
TC
※国内48社、海外49社を対象としています。
: 東京センチュリーグループ97社
※
Gr
: 第三者保証の対象項目
・GRIスタンダード
・環境省「環境報告ガイドライン2018年版」
・TCFD(気候関連財務情報開示タスクフォース)提言
・国連グローバル・コンパクト(10原則)
参考ガイドライン
2
Introduction
イントロダクション
Sustainability
Environment
Social
Governance
目次
■ トップコミットメント .......................................................................................1
■ 編集方針 .........................................................................................................2
■ 会社基本情報 ...................................................................................................4
■ 経営理念体系 ...................................................................................................5
■ サステナビリティに対する理念・考え方 ...............................................................6
■ マテリアリティ ................................................................................................7
■ 環境政策 .........................................................................................................11
■ 生物多様性への取り組み ....................................................................................12
■ 持続可能な資源の活用 .......................................................................................12
■ 環境パフォーマンス ..........................................................................................13
■ 算定基準 .........................................................................................................15
■ 第三者保証 ......................................................................................................18
■ 気候変動戦略 ...................................................................................................19
■ 環境市場機会 ...................................................................................................20
サステナビリティ
/ Sustainability
環境
/ Environment
■ 人権 ...............................................................................................................21
■ ダイバーシティ ................................................................................................21
■ 人財育成 .........................................................................................................22
■ 健康経営 .........................................................................................................23
■ 労働安全衛生 ...................................................................................................23
■ ファイナンシャルインクルージョン .....................................................................23
■ 社会貢献活動 ...................................................................................................24
■ 人材関連データ ................................................................................................25
■ 環境・社会に配慮した投融資 ..............................................................................27
■ サステナブル調達 .............................................................................................27
■ 株主・投資家・顧客向け活動 ..............................................................................27
■ コーポレート・ガバナンス .................................................................................28
■ リスクマネジメント ..........................................................................................29
■ コンプライアンス .............................................................................................30
■ 情報セキュリティ .............................................................................................31
■ 個人情報保護 ...................................................................................................31
■ コミットメントと外部評価 .................................................................................31
社会
/ Social
ガバナンス
/ Governance
3
Introduction
イントロダクション
Sustainability
Environment
Social
Governance
会社基本情報
会社概要 事業セグメント
商号東京センチュリー株式会社
事業内容
国内ビジネス、海外ビジネス、社会インフラ、トランスポート、
モビリティ、企業投資
本社所在地
東京都千代田区神田練塀町3番地
ヒューリック秋葉原タワービルディング
設立1969年7月1日
代表者
代表取締役会長 共同CEO 雪矢 正隆
代表取締役社長 CEO 藤原 弘治
資本金81,129 百万円
上場区分(証券コード)東京証券取引所プライム市場(8439)
主要株主
伊藤忠商事株式会社、中央日本土地建物株式会社、NTT株式会社、
株式会社みずほ銀行
グローバルネットワーク世界30以上の国と地域
国内ビジネス部門
国内における情報通信機器、事務用機器等のリースや各種サービス、リユー
ス・リサイクルのサーキュラービジネスなど、各種事業等
海外ビジネス部門
海外における情報通信機器等の多様なアセットを対象に、FMVリースやファ
イナンス、IT機器処分を中心としたライフサイクルサービスなど、モノのラ
イフサイクル全般に関連する各種事業等
社会インフラ部門
国内外の不動産(オフィスビル、データセンター、ホテルなど)、再生可能エ
ネルギー領域を対象とした事業運営、リース・ファイナンスおよびアセット
マネジメント、各種事業等
トランスポート部門
国内外における航空機、船舶等を対象としたリース・ファイナンスおよびア
セットマネジメント、各種事業等
モビリティ部門
国内外における法人・個人向けのオートリースおよびレンタカー、車両の整
備・サービスなど、モビリティのライフサイクル全般に関連する各種事業等
企業投資部門
国内外におけるエクイティ・メザニン等の企業投資および投資先企業のバ
リューアップ支援、ファンドの組成・運用、各種事業等
4
Introduction
イントロダクション
Sustainability
Environment
Social
Governance
経営理念体系
地球規模の社会
課題へ挑戦します
誠心誠意、
努力し続けます
新しい価値を
創出します
挑戦
共創信頼
大切にする
価値
Purpose
青い地球の
未来をつくる
前例に縛られることなく新しいことに挑み、
失 敗を学びに換えながら成長し続けます。
挑戦
多様な従業員やパートナーの力を掛け合わせ、
世の中にない新しい価値を創出し続けます。
共創
お客さまと社会からの信頼を第一に考え、
より良 い 社 会・世 界 の 実 現 のため に 、
誠 心 誠 意 、努 力 し 続 け ま す 。
信頼
Values
(大切にする価値)
Vision
地球規模の社会課題を解決に導く
“永遠のベンチャー企業”
Purpose
青い地球の未来をつくる
企業行動規範
https://www.tokyocentury.co.jp/jp/sustainability/our-sustainability/sustainability-management.html#anc_corporateCodeOfConduct
詳しくは東京センチュリーNEWS「青い地球の未来をつくる」-藤原社長がパーパスに込めた想いとは?-をご覧ください。
https://www.tokyocentury.co.jp/tc-news-jp/life/purpose/
5
Introduction
Sustainability
サステナビリティ
Environment
Social
Governance
社会課題
SDGsを踏まえた
マテリアリティ
(重要課題)の
着実な実施
中長期視点に基づく
社会動向を継続把握、
課題解決に向けた
具体的な取り組みを
実践
サステナビリティ経営の考え方
東京センチュリーのサステナビリティの根源は、金融·サービス企業としてステークホルダーの皆さまと
ともに持続的な成長と企業価値の向上を図り、新しい経営理念体系としてPurpose(パーパス)に定めた、
「青い地球の未来をつくる」ことにあります。SDGsの目標を読み解き、10年後·20年後の未来を想定し、
必要とされる金融·サービスの創出を志向するバックキャスティングのもと、サステナビリティ経営を推
進しています。
サステナビリティに対する理念・考え方
事業活動を通じて社会課題の解決に貢献
社内基盤の強化
サステナビリティ推進
体制の強化
リ ス ク 管 理
人 材 力 基 盤
(ダイバーシティ、
働き方改革など)
コーポレート・
ガバナンス 等
エンゲージメント強化
非財務情報の開示充実
ステークホルダーとの
エンゲージメント強化
各事業の強みを発揮、
課題解決推進
高い専門性
金融×サービス×事業
グローバルな拠点網
優良パートナー
厚い顧客基盤
持続的な
成長実現
企業価値の
向上
サステナビリティ経営の推進体制
当社は、サステナビリティ経営を推進し、持続的な成長を目指すため、特定した五つのマテリアリティに紐
付く経営戦略の進捗状況の確認や、改善に向けた提言を行っていくモニタリング体制を構築しています。
適切なガバナンスとPDCAサイクルの推進を図り、サステナビリティ経営の実効性を向上していきます。
サステナビリティ委員会の役割
当社は、サステナビリティ経営に関わる審議機関としてサステナビリティ委員会を設置し、原則年2回開催していま
す。サステナビリティ委員会で審議された重要事項については、経営会議および取締役会へ報告・審議を行い、取締
役会の監督を受ける体制を構築しています。サステナビリティ委員会は共同CSOが委員長を務め、サステナビリティ
を重要な経営課題と認識し、マテリアリティへの対応をはじめとするさまざまな取り組みを進めています。なお、当
社は、社長直属のCAEを独立した組織として設置し、当社およびグループ会社に対し内部監査(サステナビリティ関
連事項の監査も含む)を実施しています。常勤監査役は、原則毎月1回、CAEおよび監査部と情報交換を行っており、
これらの情報のうち重要なものは、監査役会で社外監査役へ報告を行っております。
サステナビリティ委員会メンバーおよび開催状況(主な議案)
詳細はWebサイトをご覧ください。
https://www.tokyocentury.co.jp/jp/sustainability/our-sustainability/sustainability-management.html#anc_committeeRole
CEO:Chief Executive Officer(最高経営責任者) CSO:Chief Strategy Officer(最高戦略責任者)
CRO:Chief Risk Officer(最高リスク管理責任者) CAE:Chief Audit Executive(最高監査責任者)
会計監査人
取締役会監査役会(監査役)
社長(CEO)
経営会議
当社およびグループ会社
(事務局:サステナビリティ推進部)
内部監査、内部統制評価
委員会など
連携
連携
監査
監査
報告
連携
その他、各委員会など
サステナビリティ委員会
(委員長:共同CSO)
リスク管理委員会
(委員長:CRO)
CAE
サステナビリティ委員会
および経営会議での
討議内容につき報告・審議
サステナビリティへの
取り組み状況につき
報告・審議
サステナビリティへの
取り組み・実践
全社サステナビリティの
企画・推進・総括
マテリアリティ(重要課題)に
関する事項
6
Introduction
Sustainability
サステナビリティ
Environment
Social
Governance
SDGsに対応するマテリアリティ マテリアリティ特定プロセス
事業活動を通じて社会課題の解決に貢献し、社会と当社の持続的な成長と企業価値向上を図るサステナ
ビリティ経営を進めることを目的として特定を進めました。
※1 参照した主要なESG評価・非財務情報開示基準 Dow Jones Sustainability Index/FTSE4Good Index/MSCI Index/SASB
※2 SDGsの17の目標・169のターゲット
※3 パートナー企業とともに多種多様なビジネスを展開する当社のビジネスモデル(パートナーシップ戦略)
各種会議体などでの議論
(関係部署インタビュー、サステナビリティ委員会、経営会議、取締役会)
5項目のマテリアリティとそれを支える共通基盤
※3
を特定
●
2つの軸をもとにSDGsの17目標・169ターゲットを点数に応じてマップ上にプロット化し、
マテリアリティマップを作成
●
プロット化したSDGs目標をシンプルな用語に修正
マテリアリティ特定のプロセス
マテリアリティマップを活用したマテリアリティの特定
マテリアリティ
ステークホルダーにとっての重要度
当社にとっての重要度
共通基盤
技術革新に対応した
新事業創出
2
脱炭素社会
への貢献
社 会インフラ
整備への貢献
持続可能な
資源利用への対応
人材力強化に繋がる
職場環境整備
1
3
4
5
ステークホルダーにとっての重要度(縦軸)
●
主要なESG評価や非財務情報開示基準
※1
の
項目をSDGs
※2
と紐付け、重要度に応じて点
数化
当社にとっての重要度(横軸)
●
当社の経営理念をはじめとする方針類をベー
スに、関連度の高いSDGsを抽出
●
当社事業の財務情報と上記で抽出したSDGs
を紐付け、事業ごとの財務情報などに応じて
点数化
マテリアリティ
マテリアリティ目指す姿(2035年のありたい姿)
1
脱炭素社会への貢献
国内外での再生可能エネルギーや蓄電池・エネ
ルギーマネジメント事業を推進し、気候変動・
エネルギー問題の解決に貢献する。
2
技術革新に対応した
新事業創出
AIやデータ基盤を最大限に活用し、自社のオペ
レーションを抜本的に変革して圧倒的な生産
性向上を実現する。
3
社会インフラ整備
への貢献
不動産、モビリティ、航空・海運などの幅広い
領域において、高付加価値なアセットマネジメ
ントやプラットフォームを提供する。
4
持続可能な資源利用
への対応
「モノ」の価値を見極める力を活かし、ライフサ
イクル全体を掌握するサーキュラー・エコノ
ミーをグローバルに拡大する。
5
人材力強化に繋がる
職場環境整備
多様なプロフェッショナルが失敗を恐れず挑
戦し、自律的に成長できる環境を整備すること
で、人的資本の価値を最大化する。
共通基盤
7
Introduction
Sustainability
サステナビリティ
Environment
Social
Governance
ロジックモデル-社会的インパクトへの道筋
※ 当社の事業活動において提供している「モノ・サービス」
外部環境アウトプット
※
リース物件の使用に伴い発生する
CO
2
のオフセット推進
GHG削減に向けた
資金循環の促進
GHG削減に向けた
取り組みの拡大
安全性向上による
社会的損失の低減
ライフサイクル全体での
環境負荷低減
社会全体の安定と
持続的発展の実現
エネルギー使用削減・
CO
2
排出量削減
地域経済・産業のレジリエンスと
防災機能向上
電動車の保有・利用台数拡大
資金供給などを通じた
企業のサステナビリティ推進
環境負荷の低い移動・
輸送手段の拡大
持続可能な
社会インフラ・アセットの拡大
再生可能エネルギー発電の推進、再生可能
エネルギー・省エネルギーへの転換促進クリーンエネルギーの導入加速
公共機関・民間企業のITインフラ整備デジタル活用による業務効率化・
品質向上・リスク低減
社会基盤を支える設備や機器の導入促進新産業・新規雇用創出・
まちづくり・地域活性化の加速
利便性や安全性の高い
移動手段の利用
移動・交通手段の
選択肢拡大と質の向上
再生可能エネルギーの導入/
エネルギーマネジメントの高度化
持続可能なエネルギー基盤の確立と
エネルギー供給システムの安定化
顧客の目的に応じた柔軟・
効率的なモノの利用
モノの再利用・中古市場への
売却による廃棄物削減
管理負担の軽減と
適正な資産処分の実現
資産管理の高度化
バージンマテリアル(新規原材料)の
使用量削減
中古市場の活性化と
資源循環の促進
シェアリングエコノミー推進
(所有から利用へ)
ライフサイクル全体での
環境負荷低減
廃棄物削減と資源利用効率の向上
脱炭素社会への
移行
気候変動・環境への
取り組みを通じた
脱炭素社会への
貢献
社会インフラ整備への
対応
強靭かつ
安心・安全な
社会インフラの
構築
持続可能な資源利用への
対応
モノ価値に
着目した
サーキュラー・
エコノミーの
拡大への
貢献
直接アウトカム中間アウトカム最終アウトカムインパクト
カーボンクレジット付
リース
さまざまなモノの
リース
再生可能エネルギー
発電事業
ITADサービス
情報関連機器
モビリティ
(自動車・航空機・船舶)
不動産、
データセンター
蓄電池事業
EV関連サービス
PCリサイクル
カーボンクレジットの購入量
太陽光発電事業におけるCO
2
削減への貢献
公的機関向けリース契約高
データセンターの受電容量
蓄電池事業における蓄電容量
再リース率(継続契約率)
プラスチック使用製品産業廃棄物等の再資源化率
JCM案件採択時の想定GHG削減量
電動車リースへのシフトによるCO
2
削減への貢献
1
3
5
6
7
8
9
4
2
はインパクトKPI
国連の持続可能な開発目標(SDGs)に対応する「マテリアリティ(重要課題)」のうち、当社事業領域と関連性の高
い3分野(「脱炭素」「社会インフラ」「サーキュラーエコノミー」)について、当社が創出している社会的価値(社会
的インパクト)やその道筋(ロジックモデル)を可視化し、創出価値を図る指標(インパクトKPI)を設定しました
詳細はWebサイトをご覧ください。
https://www.tokyocentury.co.jp/jp/sustainability/materiality/
マテリアリティ
8
Introduction
Sustainability
サステナビリティ
Environment
Social
Governance
脱炭素社会への貢献
KPI対象会社単位目標年度目標2023年度2024年度2025年度
アウトプットKPI
契約高等(リース契約高、融資実行高、投資額など)
TC単体および
主要な子会社15社
億円——3,4473,2404,761
電動車(EV、FCEV、PHEV、HV)比率NCS・NRS
※1
%204060%20.322.423.7
航空機事業における省燃費機材
※2
の資産残高比率
※3
ACG%202572.0%61.966.379.0
再エネ設備(太陽光・バイオマス等)の発電容量(年度末時点)TCグループ関与46案件MW——8881,0791,157
GHG排出量Scope1,2排出量
※4
(温室効果ガス排出量削減)
TCグループ97社t-CO
2
2040基準年度2024年度対比62%削減
937,784
(ー)
1,347,617
(ー)
1,223,879
(▲9.2%)
2050カーボンニュートラル達成
CDP(気候変動)スコアTCグループ97社ー2025
リーダーシップレベル
(AまたはA-)取得・維持
BBA-
オフィス活動を通じた環境貢献
電気使用量・CO
2
排出量の削減EMS適用会社
kWh20281,600,300kWh以下1,612,0321,658,6561,490,011
t-CO
2
2028200t-CO₂以下216285244
本社オフィスにおける床面積あたりの電気使用量・
CO
2
排出量の削減(原単位目標)
TC単体
kWh/㎡2030
56.9kWh/㎡以下
(2009年度対比38%削減)
66.9461.9164.65
t-CO
2
/㎡ーー000
ガソリン使用量の削減
(ガソリン使用量・CO
2
排出量・燃費)
EMS適用会社
L202650,000L以下48,78946,76844,279
t-CO
2
2026115t-CO₂以下112107102
km/L202616km/L以上17.318.018.3
紙使用量の削減(A4サイズ換算)EMS適用会社千枚20268,500千枚以下8,7038,0577,325
インパクトKPI
カーボンクレジット購入量 TC単体およびTCCS
※5
t-CO
2
ーー89,1625813,598
電動車(EV、HV)リースへのシフトによるCO
2
削減への貢献 NCS
※1
千t-CO
2
ーー115122124
太陽光発電事業の推進を通じたCO
2
削減への貢献
(年間発電量・CO
2
削減量〔通常火力発電対比〕)
太陽光発電事業会社
「京セラTCLソーラー合同会社」
を含む11社
MWh2026524,600MWh以上560,575589,967668,317
t-CO
2
2026198,036t-CO₂以上218,344231,562252,290
JCM(二国間クレジット制度)およびJCM以外の補助制度、
カーボンクレジット等を活用した環境投資による案件採択時の
想定GHG排出削減量(累計)
TC単体t-CO
2
ーー――52,357
※1 NCS:日本カーソリューションズ株式会社、NRS:ニッポンレンタカーサービス株式会社
※2 省燃費機材 : 従来機比で燃費効率の高い機種である、A220、A320neo、A321neo、A330neo、A350、737MAX、787が対象
※3 資産残高比率 : ACG(Aviation Capital Group LLC)の保有機材アセットに占める省燃費機材の資産残高割合
※4 2026年9月11日付ニュースリリース『「カーボンニュートラルに向けた中長期目標」の策定について』をご参照ください。
https://ssl4.eir-parts.net/doc/8439/ir_material12/285679/00.pdf
※5 TCCS:TC Car Solutions (Thailand) Co., Ltd.
マテリアリティ
9
Introduction
Sustainability
サステナビリティ
Environment
Social
Governance
社会インフラ整備への貢献
KPI対象会社単位2023年度2024年度2025年度
アウトプットKPI
契約高等(リース契約高、融資実行高、投資額など)TC単体および主要な子会社15社億円6,4125,6846,974
レンタカーの普及(レンタカー保有台数)ニッポンレンタカーサービス株式会社台35,15834,52134,162
安全装置(自動ブレーキ等)を付帯したレンタカー車両の導入比率ニッポンレンタカーサービス株式会社%97.499.499.9
テレマティクスサービスの導入台数
日本カーソリューションズ株式会社・
ニッポンレンタカーサービス株式会社
台88,35988,94991,290
テレマティクスサービスを利用した安全運転講習日本カーソリューションズ株式会社
実施回数(回)1,0491,1631,040
参加者数(人)14,14917,74021,900
インパクトKPI
公的機関向けリース契約高
※
TC単体およびFLCS株式会社億円1,4421,6812,005
データセンター(DC)における受電容量
(年度末時点におけるサービス提供済みDC)
TC単体(パートナー企業との共同事業)MW587076
蓄電池事業における蓄電容量
(年度末時点における稼働済みの蓄電池事業)
TC単体および京セラTCLソーラー合同会社MWhー1143
※ TC(国内リース)およびFLCSにおける官公庁・独立行政法人・学校法人・医療法人等の公共性の高い機関との契約高
マテリアリティ
持続可能な資源利用への対応
KPI対象会社単位目標年度目標2023年度2024年度2025年度
アウトプットKPI
契約高等(リース契約高、融資実行高、投資額など)TC単体および主要な子会社15社億円——4,7304,8195,482
リファービッシュ事業の推進 (中古PC年間販売台数)TC単体、EPC Japan株式会社、およびFLCS株式会社台2028730,000台350,813425,066571,053
ITADによるデータ消去の推進 (ITAD実施台数)CSI子会社のEPC社台20261,800,000台1,694,6061,648,2421,428,000
事務用品等プラスチック使用製品削減TC単体%2025
プラスチック製クリアファイルの
購入量50%削減(2022年度対比)
105.4110.873.5
リース満了物件の有効利用率
※
TC単体%204095%以上—94.293.8
インパクトKPI
再リース率(継続契約率)TC単体%——78.7 78.8 74.9
プラスチック使用製品 産業廃棄物等の再資源化率TC単体%2026
2022年度を開始年度として5年間の
再資源化率を平均90.0%以上に維持
95.896.695.3
マルチステークホルダー方針
詳細はWebサイトをご覧ください。
https://www.tokyocentury.co.jp/jp/sustainability/esg/social/multi-stakeholder-policy.html
多様なパートナーシップの活用による新たな価値創造
詳細はWebサイトをご覧ください。
https://www.tokyocentury.co.jp/jp/sustainability/materiality/partnerships.html
※有効利用率:リース期間が終了した物件(機器や設備等)を再リース・売却・廃棄により、リユース・リサイクルした割合。算定式は(再リース契約へ移行したリース契約+リース終了物件の売却・廃棄)/リース期間が満了したリース契約
10
Sustainability
Environment
環境
InUroEuDUion
SoDial
GoWernanDe
環境政策
環境に関する
方針
環境基本方針東京センチュリーグループは、環境問題への取り組みが社会的責務のひ
とつであると認識し、事業活動のあらゆる分野において、環境汚染の予
防 、温 室 効 果 ガ ス の 排 出 削 減 、気 候 変 動 の 緩 和・適 応 、生 物 多 様 性 お よ び
生態系の保全など環境問題に配慮し行動することで、持続可能な循環型
社会の実現に貢献します。
詳細はWebサイトをご覧ください。
https://www.tokyocentury.co.jp/jp/sustainability/esg/environment/policy.html
マネジメント
体制
代表取締役社長を最高責任者、CRO:Chief Risk Officer(最高リスク管理責任者)を環境総
括責任者とする体制で、グループ会社も含めて環境マネジメントシステムを構築しています。
PDCAサイクルに沿って環境のための取り組みを計画、実施、運用および点検し、取り組み状
況について定期的なマネジメント·レビューを行うことで継続的に改善を進めています。
詳細はWebサイトをご覧ください。
https://www.tokyocentury.co.jp/jp/sustainability/esg/environment/management.html
最高責任者代表取締役社長
責任機関環境マネジメント委員会
取締役会による
気候変動の監督
詳細はWebサイトをご覧ください。
https://www.tokyocentury.co.jp/jp/sustainability/esg/environment/tcfd.html#anc_
governance
環境マネジメントシステムの適用範囲
東京センチュリー株式会社、EPC Japan株式会社、TCエージェンシー株式会社、FLCS株式会
社、株式会社アイテックリース、株式会社IHIファイナンスサポート
環境マネジメント体制
【サステナビリティ委員会】
サステナビリティ推進部
取締役会
社長(CEO)
〔経営会議〕
【環境総括責任者】
CRO
【環境事務局】
総合リスク管理部
【環境責任者】
各部室店長
【ECOリーダー】
各部職員
連携
【EMS内部監査】
監査部
【環境マネジメント委員会】
ISO14001の認証取得
東京センチュリーグループは、環境問題への取り組みが社会的責務のひとつであると認識し、
以下の範囲において環境マネジメントシステムの国際規格であるISO14001の認証を取得し
ています。
(認証機関:BSIグループジャパン株式会社)
詳細はWebサイトをご覧ください。
https://www.tokyocentury.co.jp/jp/sustainability/esg/environment/management#anc_ISO14001
環境教育・ 環境意識の向上を目的に、「eラーニング」による環境教育を東京センチュリーおよびグルー
プ会社で実施しています。
・ 2011年以降、「サステナビリティ通信(2020年改称)」を年3~4回発行、環境関連の話題
にとどまらず、経営戦略としてのサステナビリティに係るさまざまなトピックスについて
東京センチュリーおよびグループ会社向けに紹介しています(日本語版・英語版)。さらに、
国外も含めた重要な動向等を捉える「国内外の主要なサステナビリティ動向」、親しみやす
く短時間で読み切れる「サステナビリティ漫画」も発行しています。
・ リース満了物件の処理や、再生可能エネルギー事業の取り組みなど、環境と関係の深い部
署において、「環境法規制管理表」を用いて定期的に業務に関連する法令や条例を確認。社
内外の講習会や研修への参加を通して、知識習得に努めています。
・ 太陽光発電事業の地元環境保全財団への寄付金を用いた、小中学生向け環境教育を継続的
に実施しています。これに対して、滋賀県の環境保全財団から「感謝状」を受領しています。
ISO9001の
認証取得
連結子会社であるEPC Japan株式会社は、品質マネジメントシステムに関する国際規格であ
るISO9001の認証を取得しています。
「品質基本方針」はWebサイトをご覧ください。
https://www.tokyocentury.co.jp/assets/pdf/company/epcjapan_quality.pdf
EPC Japan株式会社における品質マネジメント体制
本社センター
社長
品質改善委員会
【品質改善事務局(品質管理室)】
事業統括部
取締役会
事業本部長
【品質改善総括責任者】
品質管理室内部監査チーム
EPC Japan が使用済み電子機器リサイクルの国際規格「R2ver3」認証を取得
https://ssl4.eir-parts.net/doc/8439/ir_material12/283261/00.pdf
11
Sustainability
Environment
環境
InUroEuDUion
Social
GoWernanDe
生物多様性に
関わる
ガイドライン
東京センチュリーグループは、環境問題への取り組みが重要な経営課題のひとつである
と認識し、国連の持続可能な開発目標(SDGs)を踏まえて、事業活動のあらゆる分野に
おいて、環境汚染の予防、温室効果ガスの排出削減、気候変動の緩和・適応、生物多様性
および生態系の保全など環境問題に配慮し行動することで、持続可能な循環型社会およ
び脱炭素社会の実現に貢献する「環境基本方針」を定めております。
詳細はWebサイトをご覧ください。
https://www.tokyocentury.co.jp/jp/sustainability/esg/environment/policy.html
経団連生物多様性
宣言イニシアチブ
への参画
2024年6月、当社は「経団連生物多様性宣言・行動指針」に賛同表明し、同イニシアチブ
に参画しています。
詳細はWebサイトをご覧ください。
https://www.tokyocentury.co.jp/jp/newsroom/news/004722.html
(参照)「経団連生物多様性宣言・行動指針」
https://www.keidanren-biodiversity.jp/
公益財団法人
オイスカへの
活動支援
(事案規模はいずれも
2026年3月現在)
支援対象海岸林再生プロジェクトマングローブ植林プロジェクト
事案規模
植栽面積 累計103.05ha、
植栽本数 累計370,198本
5カ国·累計9,612ha
累計36,010,000本
事案概要
東日本大震災の津波により被災した
海岸林を再生すべく、育苗·植栽·育林
を行うプロジェクト。植栽は2020年
に完了し、現在は育林活動に移行して
います。
アジア太平洋地域において、沿岸のマ
ングローブ消失や高波等による海岸
浸食を防ぎ、植林を通じて沿岸の自然
と人々の暮らしを守り、生計向上にも
寄与するプロジェクト。
当社社員
の参加
参加(2023年度)—
支援対象子供の森計画 富士山の森づくりプロジェクト
事案規模39の国と地域の5,756校が参加
植栽面積 約40ha、
植栽・補植本数 累計42,822本
事案概要
「子供の森」計画は、子供たち自身が学
校や地域で苗木を植え、育てていく活
動を通して、「自然を愛する心」や「緑
を大切にする気持ち」を養いながら緑
化を進めていくプログラムです。
2007年より山梨県との協働で森づく
りを開始したプロジェクト。周辺地
域で育てた苗の植栽、シカの食害防止
ネットの設置、モニタリング調査等を
継続的に行いながら、生物多様性に富
んだ、自立的に維持される森林づくり
を推進中。
当社社員
の参加
—参加(2024年度、2025年度)
「公益財団法人オイスカより、10年間にわたる活動支援に対し感謝状を受領」
https://www.tokyocentury.co.jp/jp/newsroom/news/005578.html
持続可能な
資源の活用
当社の祖業であるリースビジネスは、リデュース・リユース・リサイクルの3Rを実践し、
創業来、循環型社会の実現に貢献してきました。「モノ」が必ず介在するリースビジネス
は、「モノ」の価値に着目し、有効活用することがビジネスの根幹であるともいえます。
当社は長年培ってきた「モノ」の価値を見極める能力を高めることで、従来型のファイ
ナンス・リースから事業領域を自動車や飛行機などのライフサイクルマネジメント事業
へと取り扱う「モノ」の範囲を拡大。さらに、パートナー企業とともに、各社の得意分野
と専門性を活かしながら社会課題を解決し、資源を効率的に活用しながら経済発展を可
能にする循環型社会の実現に貢献できる領域において事業を発展させていくビジネス
モデルを進めています。
東京センチュリーNEWS 連載:東京センチュリーの「目利き力」
https://www.tokyocentury.co.jp/tc-news-jp/feature/cat132/
リファービッシュ
事業
リース終了物件であるパソコンやサーバ等のIT機器にデータ消去サービスを実施し、中
古品として販売するリファービッシュ事業を行うことで、循環型社会に寄与しています。
FMVリース・
ITADサービス
FMVリースは、リース期間終了後にお客さまが物件返却、買取、リース延長等オプショ
ンを選択し、その際の取引価格をFMV(Fair Market Value=公正市場価格)にて決定
する柔軟性に富んだリース契約です。ITAD(IT Asset Disposition)サービスをご利
用いただくことで、情報管理・環境保護等コンプライアンスに準拠した安全かつ適切な
方法によりIT機器を処分できます。
詳細はWebサイトをご覧ください。
https://www.tokyocentury.co.jp/jp/business/service/overseas/overseas.html#anc_service
生物多様性への取り組み持続可能な資源の活用
サーキュラーエコノミーの実現に向けた取り組み
https://www.tokyocentury.co.jp/jp/sustainability/esg/environment/circular-economy.html
12
Sustainability
Environment
環境
InUroEuDUion
SoDial
GoWernanDe
環境パフォーマンス
スコープ区分単位2023年度2024年度2025年度
スコープ1(直接排出)
Gr
t-CO
2
920,3651,332,3791,207,695
※1
スコープ2(エネルギー起源の間接排出)
ロケーション基準(L基準)
Gr
t-CO
2
16,85715,48116,163
※1
スコープ2(エネルギー起源の間接排出)
マーケット基準(M基準)
Gr
t-CO
2
17,41915,23816,184
※1※2
スコープ3
(サプライチェーンなどスコープ1・2以外の排出)
t-CO
2
12,557,51313,009,87114,106,725
スコープ1、スコープ2(L基準)、スコープ3の合計t-CO
2
13,494,73514,357,73115,330,583
スコープ1、スコープ2(M基準)、スコープ3の合計t-CO
2
13,495,29714,357,48815,330,604
ス コ ー プ 3( カ テ ゴ リ ー 別 内 訳 )
カテゴリー 1 購入した製品およびサービス
TC
t-CO
2
792,461757,863732,360
カテゴリー 2 資本財
TC
t-CO
2
1,2641,5482,082
カテゴリー 3
燃料およびエネルギー関連活動
(スコープ1、2に含まれない)
t-CO
2
85,766120,684110,442
カテゴリー 4 上流の輸送および物流t-CO
2
1,109535504
カテゴリー 5 事業から出る廃棄物t-CO
2
241409251
カテゴリー 6 出張
TC
t-CO
2
135140145
カテゴリー 7 雇用者の通勤
TC
t-CO
2
249256265
カテゴリー 8 上流のリース資産
TC
t-CO
2
000
カテゴリー 9 下 流 の 輸 送 、配 送
TC
t-CO
2
000
カテゴリー 10販売した製品の加工
TC
t-CO
2
000
カテゴリー 11 販売した製品の使用
TC
t-CO
2
115,619114,99877,507
カテゴリー 12 販売した製品の廃棄
TC
t-CO
2
2,3772,1213,853
カテゴリー 13 下流のリース資産t-CO
2
11,545,82012,001,23613,165,862
カテゴリー 14 フランチャイズ
TC
t-CO
2
000
カテゴリー 15 投資
TC
t-CO
2
12,47210,08113,454
GHG排出量
単位2023年度2024年度2025年度
エネルギー使用量
Gr
MWh—4,209,4543,831,682
オフィス活動を通じた環境貢献
電 気 使 用 量( C O
2
排 出 量 )
EMS
環境目標kWh1,800,0001,769,0001,745,200
使用実績kWh1,612,0321,658,6561,490,011
排出実績t-CO
2
216285244
紙の使用量
EMS
環境目標千枚11,0009,8009,500
使用実績千枚8,7038,0577,325
営業車およびレンタカーの
ガソリン使用量
EMS
(CO
2
排出量)(燃費)
環境目標L60,00055,00052,000
使用実績L48,78946,76844,279
排出実績t-CO
2
112107102
燃費実績km/L17.318.018.3
事業活動を通じた環境貢献
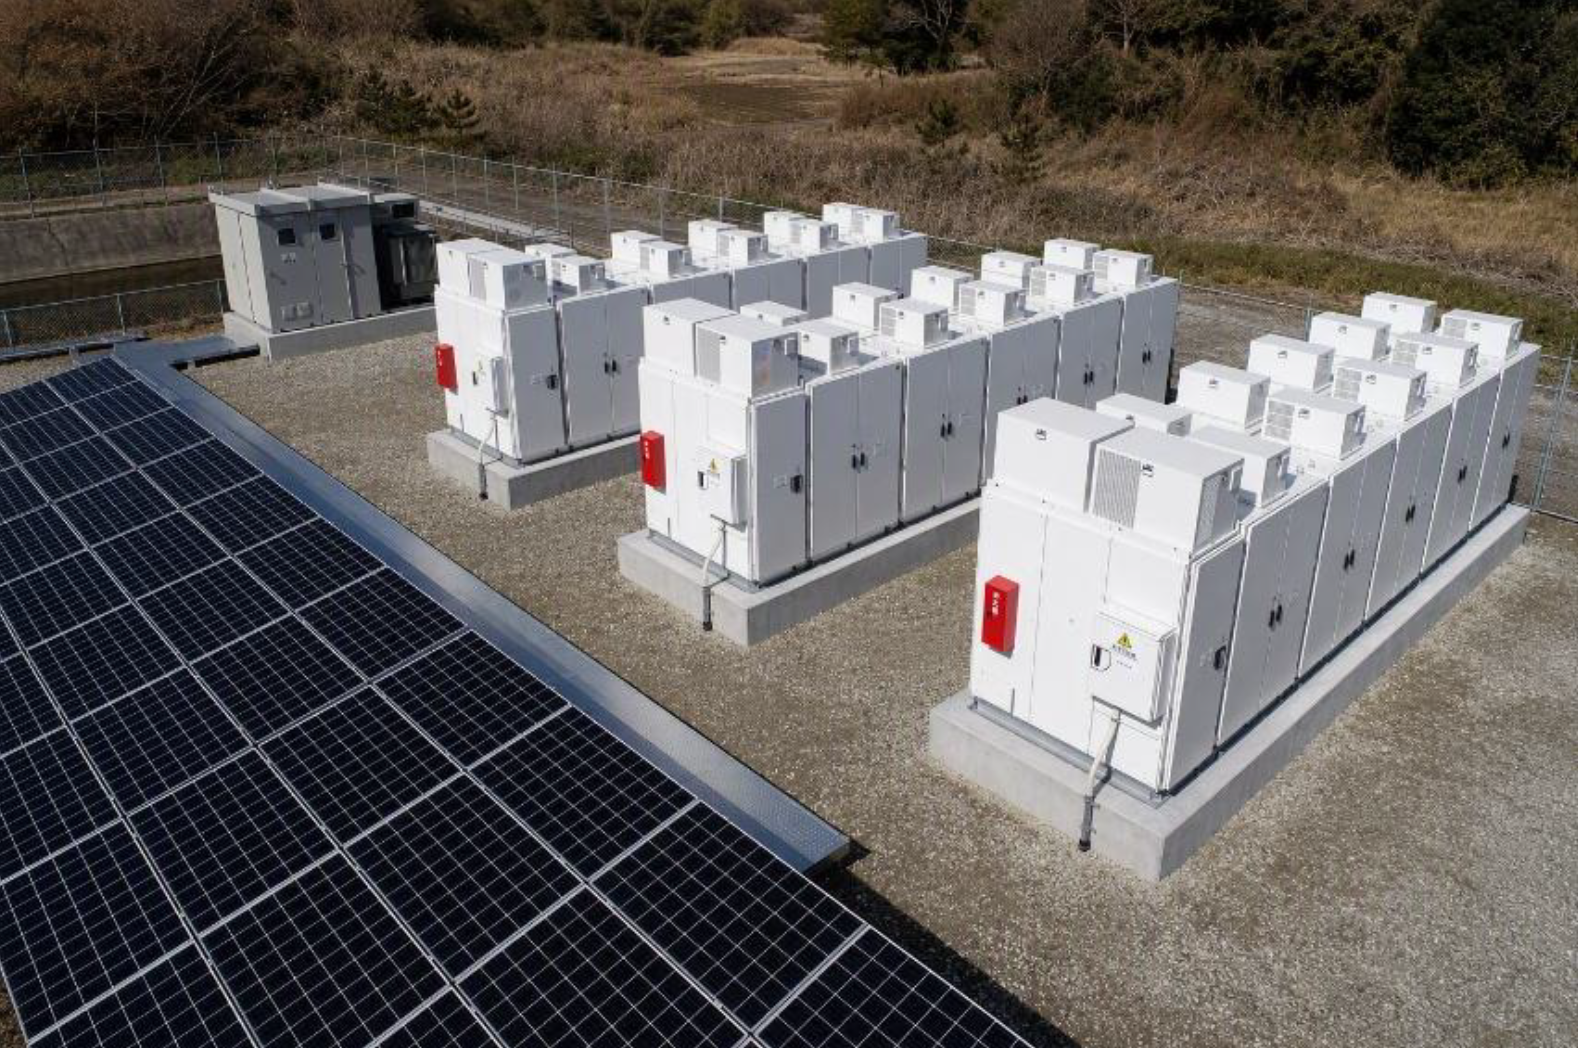
再生可能エネルギー事業の推進
(京セラTCLソーラー合同会社の太陽光
発電事業によるCO
2
削減への貢献)
環境目標MWh401,000424,000379,700
年間発電量(実績)MWh435,317451,882458,677
CO
2
削減貢献量
(実績)
t-CO
2
169,556177,364173,151
リファービッシュ事業の推進
(中古PCの年間販売台数)
EMS
環境目標台240,300323,000508,777
販売台数実績台350,813425,066571,053
その他の環境パフォーマンスデータ
GHG排出量の算定範囲の変更
2025年度の集計は、以下のとおり算定範囲を変更しています。
算定範囲の詳細は、P15~17をご参照ください。
※1 スコープ1およびスコープ2の算定範囲に、合同会社J&TCエナジーリンク、CSI Leasing Inc.グループ2社、Brilliant Car Rental
Corporationを新たに加えています。また、国内子会社の合併による2社減、海外子会社の清算等による2社減を反映しています。
※2 スコープ2マーケット基準のGHG排出量は、非化石証書購入およびカーボンクレジット付リースに基づくJクレジットによるGHG排出量
568t-CO₂控除後の数値です。
13
Sustainability
Environment
環境
InUroEuDUion
Social
GoWernanDe
その他の環境パフォーマンスデータ その他の環境パフォーマンスデータ
内訳単位2023年度2024年度2025年度
法令順守
環境関連法令違反件数
EMS
件000
グリーン事業収入(Green Revenues)
太陽光発電事業の売上高
太陽光発電事業11社
(京セラTCLソーラー合同会社を含む
計11社の合計)
億円187.1193.8195.9
グリーン購入比率
事務用品のグリーン購入比率
「TC推奨品
※
」の購入割合
※ グリーン購入法適合商品
%69.574.383.2
プラスチック使用製品削減
プラスチック製クリアファイル
のリサイクル率
%100.0100.0100.0
航空機事業における省燃費対応
省燃費機材比率
(従来機比で燃費効率の高い7機種が対象)
省燃費機材の資産残高比率
(保有機材アセットに占める省燃費機
材の資産残高割合)
注)右記カッコ内はACGにおける比率
%
57.6
(61.9)
62.1
(66.3)
75.2
(79.0)
単位2023年度2024年度2025年度
有価物・廃棄物
有価物(マテリアルリサイクル量)t1,4541,5092,545
産業廃棄物排出量
(うち、プラスチック使用製品産業廃棄物等の排出量)
t
494
(451)
653
(571)
626
(517)
廃棄物等総排出量(合計)t1,9482,1613,171
プラスチック使用製品産業廃棄物等の再資源化率 %95.896.695.3
水資源
水資源投入量
(拠点改編により2024年度以降本社のみ)
千㎥20.825.322.2
水資源投入量(原単位)㎥14.820.817.6
14
Sustainability
Environment
環境
Introduction
SoDial
GoWernanDe
算定基準
2025年度 対象範囲および保証対象項目ならびに算定方法
スコープ1・2 および エネルギー使用量:主要グループ会社(計97社)
GHG排出量
国内48社
東京センチュリー(株)、EPC Japan(株)、TCエージェンシー(株)、エス・ディー・エル(株)、FLCS(株)、(株)アイテック
リース、ニッポンレンタカーサービス(株)グループ18社、TC神鋼不動産(株)グループ3社、日本カーソリューショ
ンズ(株)、(株)IHIファイナンスサポート、(株)アマダリース、京セラTCLソーラー合同会社、KCT洸陽合同会社、
EnergyGate2合同会社、EnergyGate4合同会社、水田湖二合同会社、水田湖三合同会社、T&Jパワープラン
ト(株)、T&Jエコエナジー(株)、A&Tm(株)、周南パワー(株)、TCホテルズ&リゾーツ(株)、CSI Leasing Japan(株)、第
五日本ソーラー電力合同会社、第三日本ソーラー電力合同会社、J&S蓄電合同会社、ADDエナジー1号合同会
社、合同会社J&TCエナジーリンク 他1社
海外49社
東瑞盛世利(上海)商業保理有限公司、Tokyo Century Leasing (Singapore) Pte. Ltd.、Tokyo Century
Asia Pte. Ltd.、Tokyo Century Capital (Malaysia) Sdn. Bhd.、AIBISHI ENERGY CO., LTD.(愛弼士
能源有限公司)、CHAOHUI ENERGY CO., LTD. (昭暉能源股份有限公司)、TISCO Tokyo Leasing Co.,
Ltd.、TC Car Solutions (Thailand) Co., Ltd.、HTC Leasing Co., Ltd.、CSI Leasing, Inc.グループ20
社、EPC Inc.グループ11社、Tokyo Century (USA) Inc.、AP Equipment Financing、Fiber Marketing
International,Inc.、TC Aviation Capital Ireland Ltd.、Aviation Capital Group LLC、Aviation
Capital Group Singapore Pte.Ltd.、ACG Aircraft Leasing Ireland Limited、BPI Century Tokyo
Lease &Finance Corporation、Brilliant Car Rental Corporation
保証対象項目対象範囲算定方法
スコープ1
東京センチュリー株式会社
および主要グループ会社(計97社)
各燃料使用量×CO
2
排出係数
※
エネルギー使用に伴うGHG排出量を対象
※ 地球温暖化対策の推進に関する法律に基づく「算定・報告・公表制度における算定方法・排出係数一覧」
スコープ2
ロケーション基準 : 電気使用量×CO
2
排出係数
※1
マーケット基準 : 電気使用量×CO
2
排出係数
※2
蒸気使用量×CO
2
排出係数
※3
※1 日本 : 地球温暖化対策の推進に関する法律に基づく「全国平均係数」
海外 : IEA(国際エネルギー機関)Emissions Factors 2025の排出係数(2023年次データを適用)
※2 日本 : 地球温暖化対策の推進に関する法律に基づく「電気事業者別排出係数一覧」の基礎排出係数、係数が不明な場合は「代替値」
海外 : 海外事業所の電力使用に係る排出係数は、入手可能な場合には電力会社固有の排出係数を、
そうでない場合にはIEA(国際エネルギー機関)Emissions Factors 2025の排出係数(2023年次データを適用)
※3 地球温暖化対策の推進に関する法律に基づく「算定・報告・公表制度における算定方法・排出係数一覧」
15
Sustainability
Environment
環境
InUroEuDUion
SoDial
GoWernanDe
GHG排出量
保証対象項目対象範囲算定方法
スコープ3
:カテゴリー1
(購入した製品およびサービス)
東京センチュリー株式会社
リース物件の各品目群の取得金額×産業連関表ベースの排出原単位
※
※「サプライチェーンを通じた組織の温室効果ガス排出等の算定のための排出原単位データベース(Ver.3.6)」(環境省)
スコープ3
:カテゴリー4
(上流の輸送・流通)
Aviation Capital Group LLC、TC Skyward
Aviation Ireland Ltd.、TC Skyward Aviation
U.S.,Inc.およびTC Aviation Capital Ireland Ltd.
Aviation Capital Group LLCのオフリース機・リポゼス機のフェリーフライト(回送運航)で使用するジェット燃料使用量×CO
2
排出係数
※
※ 「サプライチェーンを通じた組織の温室効果ガス排出等の算定のための排出原単位データベース(Ver.3.6)」(環境省)
TC Skyward Aviation Ireland Ltd.、TC Skyward AviationU.S., Inc.およびTC Aviation Capital Ireland Ltd.は、当該会社の保有
する機体の飛行データをもとにCO
2
排出量を計算する、IBAのCEC(Carbon Emissions Calculator)からオフリース機・リポゼス機のフェ
リーフライト(回送運航)分を抽出したデータ
スコープ3
:カテゴリー5
(事業から出る廃棄物)
東京センチュリー株式会社および
EPC Japan株式会社
産業廃棄物等の種類ごとの重量×CO
2
排出係数
※
※ 「サプライチェーンを通じた組織の温室効果ガス排出等の算定のための排出原単位データベース(Ver.3.6)」(環境省)
スコープ3
:カテゴリー13
(下流のリース資産)
①東京センチュリー株式会社
①電子計算機、事務用機器、通信機器、電気機器、サービス業用機器、冷凍機および応用機器、 医療用機器
物件数の多い代表的機器の消費電力×年間想定利用時間×CO
2
排出係数
※
×各機器の総数
※ 地球温暖化対策の推進に関する法律に基づく「電気事業者別排出係数一覧」の代替値
② 東京センチュリー株式会社、Aviation Capital
Group LLC、TC Skyward Aviation Ireland
Ltd.、TC Skyward Aviation U.S., Inc.および
TC Aviation Capital Ireland Ltd.
②航空機
左記会社が管理する機体の飛行データをもとにCO
2
排出量を計算する、IBAのCEC(Carbon Emissions Calculator)から抽出したデータ
③東京センチュリー株式会社
③船舶
A重油・C重油の年間使用量×CO
2
排出係数
※
※ 地球温暖化対策の推進に関する法律に基づく「算定・報告・公表制度における算定方法・排出係数一覧」
④ ニッポンレンタカーサービス(株)グループ18社
および日本カーソリューションズ株式会社
④オートリース車両およびレンタル車両
年間走行距離×単位走行距離当たりの燃料消費量
※1
×CO
2
排出係数
※2
※1 国土交通省 自動車燃料消費量調査 第1表 燃料別・車種別 総括表(2024年度)
※2 「サプライチェーンを通じた組織の温室効果ガス排出等の算定のための排出原単位データベース(Ver.3.6)」(環境省)
スコープ3
:カテゴリー15
(投資)
東京センチュリー株式会社
対象投資 : 政策保有株式
自主的にスコープ1およびスコープ2のCO
2
排出量を開示している政策保有株式企業のCO
2
排出量×当社の出資比率
16
Sustainability
Environment
環境
InUroEuDUion
SoDial
GoWernanDe
その他指標
保証対象項目対象範囲算定方法
エネルギー使用量
東京センチュリー株式会社
および主要グループ会社(計97社)
エネルギー使用量(MWh)=燃料のエネルギー使用量合計(MWh)+電力および蒸気のエネルギー使用量合計(MWh)
燃料のエネルギー使用量(MWh)=Σ(各燃料使用量
※1
×各燃料の単位発熱量(各燃料単位あたりGJ)
※2
)÷3.6
電力および蒸気のエネルギー使用量(MWh)=(電力使用量(kWh)/1000)+(購入した蒸気の熱量(GJ)÷3.6)
※1 ガソリン、軽油、灯油、A重油、ガス(都市ガス、LPG、天然ガス)、石炭の使用量
自社で燃料を燃焼させて発生させた蒸気は、その製造に使用した燃料量を算定対象としている。
※2 エネルギーの使用の合理化および非化石エネルギーへの転換等に関する法律施行規則別表第一
産業廃棄物排出量
東京センチュリー株式会社および
EPC Japan株式会社
産業廃棄物排出量の重量換算合計
※1 ※2
※1 廃棄物の処理および清掃に関する法律に定義する産業廃棄物
※2 容積や個数で管理している廃棄物については、以下の係数を用いて重量に換算している。
「【排出(行政報告用)】産業廃棄物の種類ごとの集計単位と重量換算係数 (Ver.1.7)」(公益財団法人日本産業廃棄物処理振興センター)
京セラTCLソーラー合同会社の
太陽光発電事業による年間発電
量およびCO
2
削減貢献量
京セラTCLソーラー合同会社の
太陽光発電施設
年間発電量 : 各太陽光発電施設の年間発電量(送電ベース)の合計
CO
2
削減貢献量 : 太陽光発電による年間発電量(送電ベース) × CO
2
排出係数
※
※ 太陽光発電協会表示ガイドライン(2025年度)のCO
2
削減に関する基準に記載の、環境省より公表された2023年度の温室効果ガス排出量における
CO
2
排出原単位423g-CO
2
/kWh―結晶系シリコン太陽電池(太陽光発電システムの消費電力)45.5g-CO
2
/kWh=377.5g-CO
2
/kWh
17
Sustainability
Environment
環境
InUroEuDUion
SoDial
GoWernanDe
第三者保証
環境パフォーマンスデータの情報の信頼性を確保するため、GHG排出量スコープ1・2および3(カテゴリー1、4、5、
13、15)、エネルギー使用量、産業廃棄物排出量、ならびに京セラTCLソーラー合同会社の太陽光発電事業による年
間発電量およびCO
2
削減貢献量について、デロイト トーマツ サステナビリティ株式会社による第三者保証を受け
ています。
独立した第三者保証報告書
18
Sustainability
Environment
環境
InUroEuDUion
SoDial
GoWernanDe
気候変動戦略
気候変動リスク
と機会
当社は、リスク管理態勢の中で「気候変動リスク」をオペレーショナルリスクのひとつ
として認識し、非財務のリスクカテゴリーとして管理しています。当社事業と照らし合
わせ、気候変動が与える影響はリスクのみならず、事業機会としての側面も大きいと考
えており、さまざまな取り組みを進めています。
2021年4月に、「気候関連財務情報開示タスクフォース(TCFD
※
)」提言への賛同を表
明するとともに、気候変動に係るリスク重要度評価分析の結果から、「環境·エネルギー
事業(太陽光発電事業)」(2021年5月)、「航空機事業(航空機リース事業)」(2022年4
月)および「オートモビリティ事業(法人・個人向けオートリース事業)」(2023年4月)
を対象に、TCFD提言に沿って、複数のシナリオを用いた気候変動リスクおよび機会の
特定と、定性的·定量的な事業インパクト評価を実施しました。
※ TCFD(Task Force on Climate-related Financial Disclosures)
詳細はWebサイトをご覧ください。
https://www.tokyocentury.co.jp/jp/sustainability/esg/environment/tcfd.html
シナリオ分析対象事業の主な気候変動リスク
シナリオ分析についてはTCFD提言に準拠し、4つのプロセスに沿って実施しています。
① リスク重要度の評価
② シナリオ群の定義
③ 事業インパクト評価
④ 対応策の定義
詳細はWebサイトをご覧ください。
https://www.tokyocentury.co.jp/jp/sustainability/esg/environment/tcfd.html#anc_strategy
シナリオ分析対象事業主な気候変動リスク
環境·エネルギー事業
(太陽光発電事業)
台風・豪雨等の異常気象による緊急性の物理的リスクおよび炭素
税の導入・法規制の強化といった移行リスクを認識。
詳細はWebサイトをご覧ください。
https://www.tokyocentury.co.jp/assets/pdf/sustainability/sa_
solarpower_j.pdf
航空機事業
(航空機リース事業)
異常気象の激甚化の影響により被る物理的リスク、および各国の炭
素排出目標や航空業界独自の規制といった移行リスクを認識。
詳細はWebサイトをご覧ください。
https://www.tokyocentury.co.jp/assets/pdf/sustainability/sa_aircraft_
j.pdf
オートモビリティ事業
(法人・個人向けオート
リース事業)
異常気象の激甚化の影響による物理的リスク(洪水・大雨の影響に
よる車両生産の遅延等)、およびガソリン車・ディーゼル車からEV
へシフトすることに伴う移行リスク(給油から充電への変化等)を
認識。
詳細はWebサイトをご覧ください。
https://www.tokyocentury.co.jp/assets/pdf/sustainability/sa_
autoleasing_j.pdf
環境影響評価当社の経営理念や環境基本方針に掲げる「循環型社会の実現」に向けて、事業活動を通
じた環境貢献の取り組みが欠かせないものとなっていることから、「個別案件」が環境に
どのような影響を与えるかを確認·認識するための取り組みとして、「環境影響評価ワー
クシート」を用いた環境影響評価を2019年度から開始しています。
当社が実行する「投資案件」についても、環境に配慮した取り組みが求められており、環
境影響評価の対象を拡大し、「環境影響評価ワークシート」を用いて投資先の環境に対す
る姿勢および投資対象事業が環境に及ぼす影響をチェックする取り組みを2020年度か
ら開始しています。
※2022年度からは海外案件を加えて運用しています。
項目単位2023年度2024年度2025年度
環境影響評価チェック件数件568065
インターナル
カーボン
プライシング
2023年6月から、GHG(温室効果ガス)排出量リスクの見える化および新規案件取り組
み時のGHG排出量増加の適切なコントロール等を目的として、経営会議に上程するよ
うな重要性の高い投資案件において、インターナルカーボンプライシング(ICP)を試行
的に導入しました。
具体的には、「環境影響評価ワークシート」にICP欄を設定し、ICP価格には、J-クレジッ
ト(再エネ発電エネルギー)価格を使用し、連結子会社における投資案件を対象にスコー
プ1および2の算定に必要な「環境データ(使用量情報)」の提供を受けて算定。意思決定
の参考としています。
全社的な省エネへ
の取り組み
全社的な省資源・省エネルギー活動として、さまざまな取り組みを推進しています。
詳細はWebサイトをご覧ください。
https://www.tokyocentury.co.jp/jp/sustainability/esg/environment/behavior.html
GHG排出量
を削減する長期の
定量的な目標
(原単位目標)
当社は公益社団法人リース事業協会が策定するカーボンニュートラル行動計画に会員企
業として参加しており、同協会の目標に合わせて目標値を改定しています。
長期目標
本社床面積あたりの電力消費量2030年度: 56.9kWh/㎡以下
(基準年度である2009年度比 38%削減)
項目単位2023年度2024年度2025年度
本社床面積あたりの電力消費量kWh/㎡66.9461.9164.65
気候変動リスクと機会 環境負荷低減
19
Sustainability
Environment
環境
InUroEuDUion
SoDial
GoWernanDe
サステナブル・
ファイナンス
当社は、サステナビリティ・リンク・ファイナンス・フレームワークの策定やサステ
ナビリティ・リンク・ローン、ポジティブ・インパクト・ファイナンスおよびDBJ健
康経営(ヘルスマネジメント)格付融資などに積極的に取り組んでいます。
詳細はWebサイトをご覧ください。
https://www.tokyocentury.co.jp/jp/sustainability/finance.html
2024年7月、MOL Chemical Tankers Pte. Ltd.(商船三井グループ)が傭船・運
航するケミカルタンカーを、2025年3月にはLOBELIA SHIPPING INC.(商船三
井グループ)が傭船し、商船三井が運航する自動車運搬船を、それぞれ対象とした
サステナビリティ・リンク・リース契約を締結しました。
二国間クレジット制度
(JCM
※
)
※ Joint Crediting
Mechanism
「JCM」は、日本の優れた脱炭素技術をパートナー国に提供、導入資金の一部を補助
金として支援し、パートナー国の温室効果ガスの削減と持続可能な社会インフラの
整備に貢献するとともに、削減された温室効果ガスの一部を日本の排出削減量とし
て計上する仕組みです。
当社のJCM事業は、2017年度から2024年度までにインドネシア、フィリピン、タ
イ、ミャンマー、ベトナムの5カ国で、合計17プロジェクトが採択される実績を上
げてきました。2024年度の採択は2件(インドネシア/鋼線製品工場への2.7MW
太陽光発電システムの導入、タイ/包装工場への太陽光発電・ヒートバッテリーの
導入)です。2023年度に採択された案件のうち、フィリピンの電子機器組立工場へ
の屋根置き太陽光発電システムの導入は、当社が制度設計に協力し、新たに制度化
された「JCMエコリース事業」での採択となります。
詳細はWebサイトをご覧ください。
https://www.tokyocentury.co.jp/jp/business/service/overseas/jcm.html
環境市場機会
持続可能性に関連した金融商品
省エネ補助金サービス環境負荷軽減に繋がるようなお客さまの先進的な設備導入を各種補助金を用いて
支援しています。
詳細はWebサイトをご覧ください。
https://www.tokyocentury.co.jp/jp/business/service/knowledge/system.html#anc_main-subsidy
寄付型コーポレート
PPAの提供
(自家発電サポート
サービス)
東京センチュリー株式会社と京セラ株式会社、京セラコミュニケーションシステム
株式会社(以下「KCCS」)は、SDGs(持続可能な開発目標)の達成に資する取り組
みとして、寄付型のコーポレートPPA(自家発電サポートサービス)の提供をして
います。東京センチュリーとKCCSが太陽光発電設備の導入に必要な初期投資およ
び維持管理のためのコストや手間を負担。「初期投資ゼロ」で太陽光発電システム
を導入できるコーポレートPPAを提供しています。
本サービスは、従来のコーポレートPPA契約に、SDGsの達成に向けた活動を推進
する公益社団法人やNPO法人への寄付の実施を組み込んだ取り組みです。本サー
ビスを利用して太陽光発電システムを導入したお客さまのご意向を踏まえて寄付
先の団体を決定し、東京センチュリーの収益の一部を団体へ寄付します。
詳細はWebサイトをご覧ください。
https://www.tokyocentury.co.jp/jp/newsroom/news/pdf/ff3cd9d8344d1fdd0a0fb92b3b767823bce
8b5a9.pdf
カーボンクレジット付
リース
当社は、お客さまの脱炭素経営の取り組みや、企業価値向上を支援することを目的
に、カーボンクレジット付リースを取り扱っています。カーボンクレジット付リー
スは、当社およびグループ会社が提供するリース・オートリース等に、J-クレジッ
トをはじめとしたカーボンクレジットのオフセットサービスを付加したものであり、
当該サービスを活用することで、生産設備・IT機器·車両等のリース物件の使用に伴
い排出するCO
2
のオフセットが可能です。
詳細はWebサイトをご覧ください。
https://ssl4.eir-parts.net/doc/8439/tdnet/2240405/00.pdf
森林ファンド当社は、住友林業株式会社傘下の米国·森林アセットマネジメント事業会社Eastwood
Forests, LLCが組成し、運用を開始した森林ファンド Eastwood Climate Smart
Forestry Fund Iに出資・参画しました。
当社は、大口出資者として、森林資産の購入、売却をはじめとする重要事項を決定
するコミッティのメンバーとなり、本ファンド運営に携わることで森林経営に係る
知見を会得し、新たな森林関連ビジネスの展開に繋げていきます。
詳細はWebサイトをご覧ください。
https://ssl4.eir-parts.net/doc/8439/tdnet/2310035/00.pdf
https://ssl4.eir-parts.net/doc/8439/ir_material12/257573/00.pdf
20
Sustainability
Environment
Introduction
Social
社会
Governance
人権
人権に係る
当社グループの
基本スタンス
東京センチュリーグループにおける人権に係る基本スタンスは、「人権基本方
針」のほか「サステナブル調達方針」、「企業行動規範-4. 人権の尊重」に記され、
事業活動において人権尊重を推進していくものと表明し、お客さまやサプライ
ヤーなどのステークホルダーの皆さまに対しても、人権の尊重を期待すること
としています。投融資に関する方針としては、「環境基本方針」および「人権基
本方針」に基づき、環境・社会へ負の影響の大きい事業に対する投融資等を制
限することを明記した「東京センチュリーグループ 環境・社会に配慮した投融
資方針」を制定し、強制労働・児童労働・人身取引など深刻な人権侵害を引き起
こしている事業や、化学兵器・生物兵器・核兵器・クラスター弾など非人道兵
器製造に関与する事業への投融資等を禁止しています。
また、役職員共通の与信業務に係る基本姿勢や考え方などを示す「与信業務規
範」を遵守し、「人権尊重」の観点を与信取引の判断基準のひとつに掲げ、個々
の案件で確認を得ることとしています。
人権基本方針東京センチュリーグループは、経営理念体系に基づき、人権基本方針を定め、
事業活動において人権尊重を推進していきます。
東京センチュリーグループは、人権尊重を重要な課題と認識し、多様な人財の
能力と個性の積極的な発揮を促す風土を醸成し、すべての役職員が専門性を高
め、成長と誇りを実感できる企業を目指します。
詳細はWebサイトをご覧ください。
https://www.tokyocentury.co.jp/jp/sustainability/esg/social/humanrights.html
企業行動規範当社は「企業行動規範」においても、人権の尊重について、以下のとおり定めて
います。
企業行動規範-4.
人権の尊重と働きやすい職場環境・企業風土の醸成
私たちは、あらゆる人々の人権を尊重するとともに、ダイバーシティを推進し
ます。
国連グローバル・
コンパクトに署名
詳細はWebサイトをご覧ください。
https://www.tokyocentury.co.jp/jp/newsroom/news/005576.html
人権リスクの管理
詳細はWebサイトをご覧ください。
https://www.tokyocentury.co.jp/jp/sustainability/esg/social/humanrights.html
人権に関する研修・啓発
人権侵害への対応体制
(救済メカニズム)
人権デューデリジェンス東京センチュリーグループでは、事業活動によって生じる人権への負の影響を
分析、特定、評価のうえ、その防止または軽減するための是正策を講じていく
PDCAを、外部の専門機関の協力のもと実施しています。
詳細はWebサイトをご覧ください。
https://www.tokyocentury.co.jp/jp/sustainability/esg/social/humanrights.html#anc_
humanrights-efforts
ダイバーシティ
ダイバーシティ基本方針東京センチュリーの経営理念体系は、Purpose「青い地球の未来をつく
る」、Vision「地球規模の社会課題を解決に導く“永遠のベンチャー企業”」、
Values(大切にする価値)「挑戦」「共創」「信頼」です。この経営理念体系のもと、
新しい価値を創造するためには、多様な能力と個性をもつ役職員が柔軟な発想
と行動力を発揮し、付加価値の高いサービスを提供し続けることができるよう、
ダイバーシティを推進してまいります。
詳細はWebサイトをご覧ください。
https://www.tokyocentury.co.jp/jp/sustainability/esg/diversity/policy.html
推進体制多様な人財の能力と個性の積極的な発揮を促し、その活躍を支援するととも
に、多様な役職員が活躍できる企業風土の醸成を図るべく、2015年4月1日に
人事部内にダイバーシティ推進室を設置(2026年4月「ダイバーシティ推進グ
ループ」に改編)、「ダイバーシティ基本方針」に基づき、さまざまな施策に取り
組んでいます。
ダイバーシティ研修役職員のダイバーシティへの理解を深めるため、ダイバーシティ研修を実施し
ています。入社時基礎研修での研修実施や全役職員を対象にしたeラーニング
研修実施に加え、外部講師を招いたダイバーシティセミナーなどを開催してい
ます。
詳細はWebサイトをご覧ください。
https://www.tokyocentury.co.jp/jp/sustainability/esg/diversity/corporate-culture.html
LGBTQ+への取り組みコンプライアンスハンドブックでは、セクシャルハラスメント・パワーハラ
スメント・マタニティハラスメントなどさまざまなハラスメント行為の禁止、
LGBTQ+への差別的言動の禁止について事例を明記して周知徹底しているほ
か、LGBTQ+について正しい理解を深めるため、全役職員を対象に研修を実施
しています。
グローバル人財の活躍推進
詳細はWebサイトをご覧ください。
https://www.tokyocentury.co.jp/jp/sustainability/esg/diversity/enpowerment.html#anc_
globalHuman
障がい者の雇用促進
女性の活躍推進
詳細はWebサイトをご覧ください。
https://www.tokyocentury.co.jp/jp/sustainability/esg/diversity/enpowerment.html
https://www.tokyocentury.co.jp/tc-news-jp/life/_tc-mee_womens_careers/
21
Sustainability
Environment
Introduction
Social
社会
GoWernanDe
人財育成
人財育成の方向性東京センチュリーグループは、Purpose「青い地球の未来をつくる」、Vision「地球
規模の社会課題を解決に導く“永遠のベンチャー企業”」の実現に向け、人財を最も
重要な経営資本のひとつと位置付けています。中期経営計画2030では、「挑戦する
人財とカルチャーの醸成」を経営基盤強化の重要テーマとして掲げ、従業員一人ひ
とりが自律的に挑戦し、変化を創造できる組織づくりを推進しています。
当社は、人財価値の向上を企業価値向上の原動力と捉え、「挑戦」「信頼」「共創」の価
値観を共有しながら、専門性の向上、多様な経験の獲得、主体的なキャリア形成を
支援しています。
社内環境整備の
方向性
当社は、事業戦略の変革を支える経営基盤として人事制度を刷新し、多様な人財が
幅広く挑戦できる処遇・育成・環境を高度化し、人的資本の最大化と持続的な企業
成長を目指しています。
市場水準に準拠した報酬体系や中長期の挑戦を評価する目標制度の導入、多様な働
き方を実現する諸制度の充実に取り組むとともに、エンゲージメントサーベイを通
じて組織力の強化を図ります。
推進体制当社は、人事部を中心に人的資本経営を推進するとともに、経営戦略と連動した人
財戦略の高度化を進めています。2026年度からはCxO体制のもと、人的資本の最
大化に向けた施策を推進し、従業員エンゲージメント向上、多様な人財の活躍促進、
人財育成投資の拡充に取り組んでいます。
従業員一人ひとりの職業人生を通じたキャリアについて、自らが主体となって構想・
設計し、実現していくことをサポートしていくため、人事部内にキャリアデザイン
グループを設置しています。世代ごとに研修と面談、任意で相談ができる窓口を開
設して、従業員のキャリア形成に注力しています。
キャリア形成
詳細はWebサイトをご覧ください。
https://www.tokyocentury.co.jp/jp/sustainability/esg/diversity/development.html
能力開発支援
360度評価経営基盤の強化の主要施策である「従業員エンゲージメントの向上」の取り組みの
一環、また、職場の円滑な人間関係に基づく組織運営を意識したライン管理職の人
財育成を目的に、360度評価を実施しています。評価結果は被評価者本人と上司に
フィードバックされます。
キャリア
チャレンジ制度
従業員が自らの意思でキャリア形成にチャレンジできる機会を提供するキャリア
チャレンジ制度(社内公募制度)を導入しています。
統合レポート2025 「従業員座談会」も合わせてご確認ください。
https://www.tokyocentury.co.jp/jp/ir/library/integrated-report/2025/strategy/dialogue-
employee-roundtable.html
従業員
エンゲージメント
の向上
当社は、人的資本の最大化に向けて、従業員エンゲージメントの向上に取り組んで
います。エンゲージメントサーベイを通じて組織課題を把握するとともに、「理念
浸透×風土改革×制度充実」を推進し、組織力の強化・拡大を図っています。また、
360度評価やキャリアチャレンジ制度などの取り組みを通じて、従業員一人ひとり
の主体的な参画を促し、働きがいのある組織づくりを進めています。2025年度の
エンゲージメントスコアは57.1となり、2年連続で前年を上回る結果となりました。
両立支援当社は、従業員一人ひとりの事情にあわせ、多様で柔軟な働き方ができるよう、両
立支援を充実しています。
主な両立支援制度
対象者制度対象期間
出産・育児
産前休業産前6週間
産後休業産後8週間
出生時育児休業
(産後パパ育休)
産後8週間(うち4週間)
育児休業満2歳6ヶ月未満
健康診査等通院特別休暇妊娠~産後1年間(うち必要な日数)
特別休暇
(パートナー出産時)
産前1ヶ月~産後2週間(うち5日)
子の看護等休暇
小学校6年生修了まで(子供1人につき年間5日ま
で、1日・半日・時間単位での取得可)
時間外勤務免除小学校就学前
始業・終業時刻繰り上げ小学校6年生まで(2時間)
始業・終業時刻繰り下げ小学校6年生まで(2時間)
短時間勤務小学校6年生まで(75分短縮)
介護
介護休業通算1年まで分割取得可[取得回数の制限なし]
介護休暇
該当する家族の人数によらず、一律年間10日まで
(1日・半日・時間単位での取得可、有給扱い)
時間外勤務免除家族の介護終了まで
始業・終業時刻繰り上げ
利用開始から3年間(2時間)
[取得回数の制限なし]
始業・終業時刻繰り下げ
利用開始から3年間(2時間)
[取得回数の制限なし]
短時間勤務
利用開始から3年間(2時間短縮)
[取得回数の制限なし]
長時間労働の抑制と
ワーク・ライフ・
バランス
当社は、業務の効率化や残業時間の削減を進めることで、ワーク・ライフ・バランス
の向上に取り組んでいます。従業員が健康で快適に働けるように、夏期の定時退社
推進やドレスコードの見直し、期間の定めのないクールビズ導入等をすることで、
従業員一人ひとりが自身のライフスタイルに合わせて働ける職場環境づくりにも
注力しております。
また、労働基準法に基づき、労働組合と「時間外勤務および休日勤務に関する協定
(36協定)」を締結しています。その他の労働条件等に関しても、当社は労働基準法
を遵守しており、2025年度において違反はなく罰則等を受けておりません。
なお、当社グループは、各国が定めた法令に従い、従業員に法定最低賃金を上回る
生活賃金を支払い、かつ、不当な賃金減額を行っていません。
22
Sustainability
Environment
Introduction
Social
社会
GoWernanDe
健康経営労働安全衛生
方針健康経営基本方針
東京センチュリーの経営理念体系は、Purpose「青い地球の未来をつくる」、Vision
「地球規模の社会課題を解決に導く“永遠のベンチャー企業”」、Values(大切にする
価値)「挑戦」「共創」「信頼」です。この経営理念体系のもと、新しい価値を創造する
ためには、当社の最大の財産である人財一人ひとりが心身ともに健康で、個性と持
てる能力を存分に発揮し、安心・安全・いきいきと働ける環境を整備することが重要
です。そのために健康管理を経営課題として捉え、役職員とその家族の健康保持・
増進に取り組み、お客さまや取引先の皆さまを含めたサプライチェーン全体の健や
かな発展も支援します。
詳細はWebサイトをご覧ください。
https://www.tokyocentury.co.jp/jp/sustainability/esg/social/health-and-productivity-management.html
健康経営の推進体制当社は、経営戦略と連動した健康経営を継続的かつ実効性をもって実践するた
め、CEOをトップとする推進体制を構築しています。CHRO(Chief Human
Resource Officer:最高人事責任者)が管轄し、社員組合、衛生委員会、健康保険組
合、産業医、産業保健師と連携し、各種施策の立案・実行から効果検証までを組織的
に行う体制を整えています。
詳細はWebサイトをご覧ください。
https://www.tokyocentury.co.jp/jp/sustainability/esg/social/health-and-productivity-management#anc_
promotionStructure
健康経営戦略マップ当社のPurpose「青い地球の未来をつくる」の実現を支える原動力は、最大の財産
である人財一人ひとりの心身の健康です。
健康経営戦略マップは当社が実践する健康投資(各種施策)と、その成果との繋が
りを示したものです。各種施策を通じて役職員の意識や行動の変容を促し、働きが
いやエンゲージメントの向上、人的資本の充実を通じた経営課題の解決を目指す道
筋を整理しています。
当社はこれからも役職員が安心・安全に、いきいきと挑戦できる環境づくりに注力
してまいります。
詳細はWebサイトをご覧ください。
https://www.tokyocentury.co.jp/jp/sustainability/esg/social/health-and-productivity-management.
html#anc_strategyMap
労働安全衛生当社では、労働安全衛生法に基づき衛生委員会を設置し、産業医・産業保健師監修
のもと、健康やメンタルヘルスに関する事項など、毎月テーマを決めて議論を行い、
議事録および資料を社内イントラに掲載し、当社役職員が閲覧できるようにして、
労働安全・衛生面の意識の向上を図っています。
また、当社グループの子会社である、EPC Japan株式会社では、2024年3月に
ITADサービス、PCに関わるキッティングサービスおよび中古機器販売の認証登録
範囲において、労働安全衛生マネジメントシステム(ISO45001)の認証を取得し
ています。
(参照)EPC Japan株式会社の労働安全衛生基本方針
https://www.tokyocentury.co.jp/assets/pdf/company/epcjapan_occupational_health_and_safety.pdf
ファイナンシャルインクルージョン
ファイナンシャル
インクルージョン
東京センチュリーグループは、国内外で事業を展開する企業として、地域や所得水
準にかかわらず誰もが金融サービスを利用できる社会の実現に貢献します。新興国
を含む各地域での金融リテラシー向上や社会貢献活動を通じて、人々の自立と経済
発展を支援し、持続可能な社会の形成に取り組んでいます。
国内事例
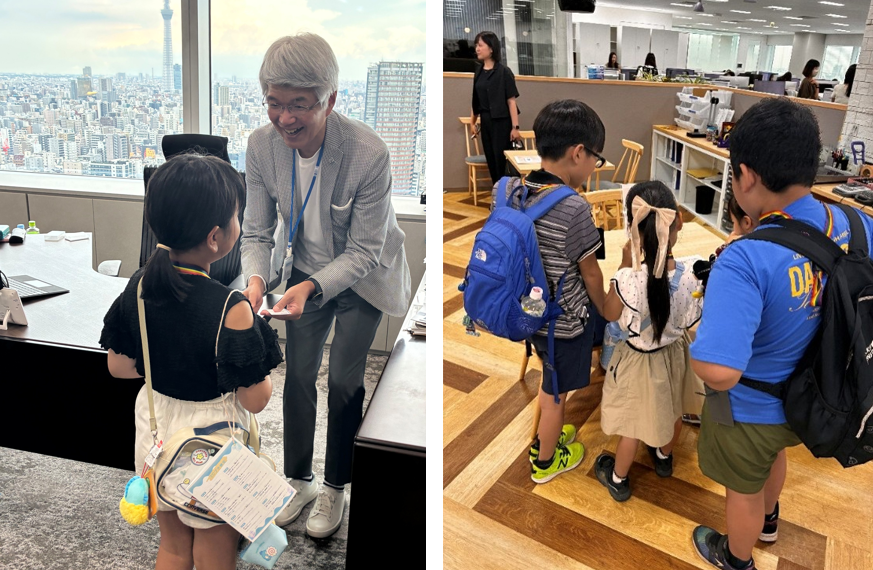
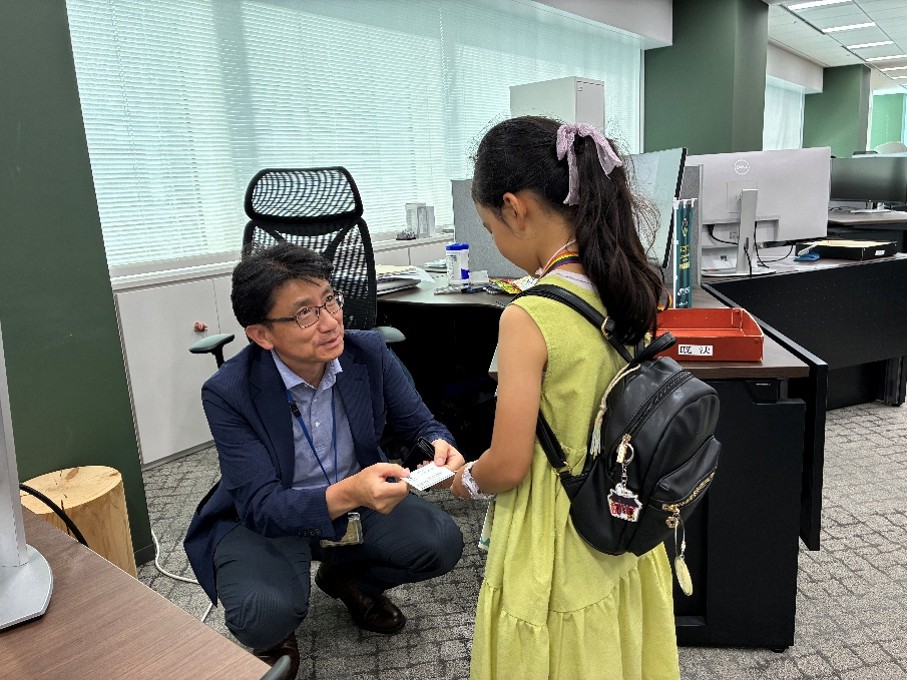
・ 大学の業界研究セミナー(金融・リース・サステナビリティ)やキャリアデザイン・
セミナーへ社員を講師として派遣
・ 中高生の職場体験プログラムの実施
海外事例
・ International Society of Transport Aircraft Trading Foundationが運営
する「Diversity and Inclusion Fund」へ寄付を通じて、アフリカの航空関連分
野の学生や南米の女性学生に奨学金やキャリア支援を提供
次世代育成支援の一環として、公益財団法人伊藤忠記念財団への寄付を通じて、子
ども文庫の助成や電子図書普及事業を行っています。
詳細はWebサイトをご覧ください。
https://www.tokyocentury.co.jp/jp/sustainability/esg/social/financial-inclusion.html
23
Sustainability
Environment
Introduction
Social
社会
GoWernanDe
スポーツ支援スポーツ振興の一環として、Jリーグ「川崎フロンターレ」のオフィシャルスポン
サー、「SC相模原」のシルバーパートナーを務めています。また、当社は、ジャパン
ラグビー リーグワン所属チーム「浦安D-Rocks」とプラチナパートナーシップ契
約を締結。当社連結子会社・TC神鋼不動産株式会社は、同リーグ所属の「コベルコ
神戸スティーラーズ」とゴールドパートナー契約をしています。さらに当社は「福
岡ソフトバンクホークス」とスポンサーシップ契約を締結しています。
文化支援芸術振興の一環として、三菱一号館美術館の企業会員を継続的に務めています。
文化振興の一環として、公益財団法人渋沢栄一記念財団への寄付を継続的に行って
います。また、TCホテルズ&リゾーツ株式会社が経営する「ホテルインディゴ軽井
沢」にて、軽井沢町社会福祉協議会が運営するデザインチーム「アート・あぷりえ」
と連携し、地域に暮らす障がいのあるクリエイターによるアートやクラフト作品を、
ホテル内アイテムとして活用する取り組みを開始しました。
清掃活動 等当社グループは、地域との共生の一環として、役職員が参加する清掃活動を実施し
ています。
国内
本社(千代田区)周辺にて、早朝の清掃ボランティア活動を実施しています。
海外
グループ会社が、CSR活動の一環としてスロバキアの動物園施設の清掃や修繕作業
に参加しました。
詳細はWebサイトをご覧ください。
https://www.tokyocentury.co.jp/jp/sustainability/esg/social/community.html#anc_
environmentalConservation
ボランティア
休暇制度
2009年にボランティア休暇制度を制定し、 ①環境保全活動、 ②地域社会活動、 ③
社会福祉活動、 ④その他会社が認めた活動、について、社員がボランティア活動を
行うための休暇を特別休暇として認めています。
寄付等を通じた
社会貢献活動
東京センチュリーは、経営理念体系に則り、社会的使命・責任を果たし、広く社会の
発展・向上に貢献することを目的として、①環境、②社会福祉、③教育、④災害支援
の項目を重点分野として寄付を行う取り組み方針があります。
2025年度はそれぞれ以下のとおり団体に寄付を行っております。
① 環境: 公益財団法人 日本自然保護協会(森林保全、生物多様性保全、海洋保全等、
全国規模の自然保護)、公益財団法人 オイスカ(支援対象詳細はP.12をご覧くだ
さい)
② 社会福祉 : 公益財団法人 がん研究会(がん研究)、社会福祉法人 日本介助犬協
会(介助犬の育成・訓練)
③ 教育: 認定NPO法人 カタリバ(子供を取り巻く環境づくり、居場所提供、出張
授業、不登校支援プログラム)
④ 災害支援: 社会福祉法人 中央共同募金会(赤い羽根)(災害ボランティア・NPO
活動サポート募金)、 認定NPO法人 日本レスキュー協会(災害救助犬の育成・
派遣)
※カッコ内は各団体の主な活動内容
なお、2025年度の寄付金実績の合計は21,511,000円です。
詳細はWebサイトをご覧ください。
https://www.tokyocentury.co.jp/jp/sustainability/esg/social/community.html
災害復興支援モビリティ部門では、日本カーソリューションズ株式会社が自然災害へのレジリエ
ンス向上に貢献する取り組みとして、NTTドコモビジネス株式会社と共同で、電源
となるEVリース車と衛星通信「Starlink」を組み合わせた災害時用BCP車両をパッ
ケージで取り扱っています(Japan Mobility Show 2025に出展)。また、南千住
の自社整備センターに使用済みEVバッテリーを再製品化した自律型スマート街路
灯を設置しており、災害停電時には非常用電源としてスマートフォン約300台分の
充電に対応可能です。
ニッポンレンタカーサービス株式会社では、2023年7月に鹿児島県熊毛郡屋久島
町と災害時応援連携協定を締結しました。これは、大規模な地震や風水害等が発生
した際に、屋久島空港営業所に配備しているEVを活用し、災害対策本部や避難所等
への電力供給を中心に連携を図るものです。
「仙台市へ「企業版ふるさと納税」を通じた寄付を実施
~文化芸術と災害文化を融合する新たな拠点づくりに貢献~」
https://www.tokyocentury.co.jp/jp/newsroom/news/005501.html
社会貢献活動
24
Sustainability
Environment
Introduction
Social
社会
Governance
人材関連データ
KPI項目
TC
目標(目標年度)小分類2023年度2024年度2025年度
新規採用者数に占める女性比率
(各年度の3月31日時点であり、嘱託社員・派遣社員は含めて
いない)
ー
女性30人32人39人
男女合計85人99人96人
割合35.3%32.3%40.6%
うち、新卒採用に占める女性比率
40%を維持
(2027年度)
女性25人21人35人
男女合計47人52人61人
割合53.2%40.4%57.4%
うち、中途採用に占める女性比率ー
女性5人11人4人
男女合計38人47人35人
割合
13.2%23.4%11.4%
採用した労働者に占める女性の割合
(中途採用者を含む)
ー
総合職25.7%38.6%37.2%
業務職100.0%100.0%100.0%
嘱託社員41.7%0.0%38.5%
合計35.3%42.6%41.5%
男女の平均勤続勤務年数の差異
(各年度の3月31日時点)
ー女性
総合職9.3年9.1年8.6年
業務職21.2年21.5年21.7年
合計
16.9年16.8年16.2年
ー男性
総合職17.3年16.5年15.9年
業務職ーー―
合計17.3年16.5年15.9年
管理職に占める女性の割合
(各年度の3月31日時点)
20%以上
(2031年)
女性63人73人78人
男女合計525人534人531人
割合12.0%13.7%14.7%
役員に占める女性の割合
(各年度の3月31日時点)
(役員(非常勤含む)=取締役、監査役、執行役員)
ー
女性
2人3人3人
男女合計36人36人37人
割合5.6%8.3%8.1%
係長級にある者に占める女性の割合
(各年度の3月31日時点)
ー
女性133人143人141人
男女合計257人268人282人
割合51.8%53.4%50.0%
一カ月当たりの平均残業時間
(法定時間外労働)
ー
総合職16.8時間16.0時間16.3時間
業務職
2.6時間2.5時間3.1時間
合計11.6時間11.3時間12.0時間
KPI項目
TC
目標(目標年度)小分類2023年度2024年度2025年度
採用における男女別競争倍率
(中途採用者を含む)
ー
女性
総合職
26.9倍14.1倍16.3倍
業務職17.6倍13.0倍13.9倍
嘱託社員1.2倍ー2.6倍
合計20.7倍14.0倍14.4倍
男性
総合職20.1倍20.6倍21.4倍
業務職ーー―
嘱託社員1.0倍1.0倍1.9倍
合計17.3倍20.1倍19.1倍
採用における競争倍率の男女比
(中途採用者を含む)
ー
総合職1.3倍0.7倍0.8倍
業務職ーーー
嘱託社員1.2倍ー1.4倍
合計1.2倍0.7倍0.8倍
労働者に占める女性の割合
(各年度の3月31日時点)
(連結ベースでの女性の割合[嘱託社員・派遣社員を除く]は
2026年3月31日時点で36.4%)
ー
総合職14.7%16.4%18.7%
業務職100.0%100.0%100.0%
嘱託社員34.2%23.1%25.4%
派遣社員
92.7%93.1%94.8%
合計
32.7%33.5%34.7%
離職率
(各年度の3月31日時点)
(嘱託社員・派遣社員は含めていない)
ー
女性1.0%1.0%1.5%
男性4.0%4.6%4.3%
合計5.0%5.6%5.8%
介護離職者数
介護離職者
ゼロを維持
(2027年度)
ー0人0人1人
障がい者の雇用比率
(各年度の6月1日時点)
法定雇用率
(2.7%)以上
の雇用を維持
(2027年度)
ー3.40%3.26%2.83%
定期健康診断受診率
100%
(2027年度)
ー100.0%100.0%100.0%
ストレスチェック受検率
100%
(2027年度)
ー100.0%100.0%100.0%
25
Sustainability
Environment
Introduction
Social
社会
GoWernanDe
KPI項目
TC
目標(目標年度)小分類2023年度2024年度2025年度
特定保健指導実施率
80%以上
(2027年度)
40歳以上の役職員で
特定保健指導の対象者
75.9%81.4%集計中
男女別の採用10年後の
継続雇用割合
(2023年度 : 2012~2014年度新卒採用者)
(2024年度 : 2013~2015年度新卒採用者)
(2025年度 : 2014~2016年度新卒採用者)
ー
女性
総合職66.7%75.0%69.2%
業務職ー—100.0%
合計66.7%75.0%77.8%
男性
総合職56.0%44.4%43.1%
業務職ー——
合計56.0%44.4%43.1%
男女別の育児休業取得率
※ 育児休業等と育児目的休暇の取得者の
割合
男性の育児
休業取得率
100%を維持
(2027年度)
女性合計85.7%83.3%111.1%
男性合計100.0%100.0%100.0%
年次有給休暇の取得率(消化率)
(括弧内は平均取得日数)
70%以上を
維持
(2027年度)
総合職79.6%80.5%81.0%
業務職85.4%86.1%87.6%
嘱託社員85.6%87.3%94.2%
合計
81.1%
(15.2日)
81.2%
(15.1日)
81.8%
(15.1日)
男女別の職種
または雇用形態の転換実績
ー
職種
転換
総合職
(全国勤務)
↓
総合職
(首都圏限定)
ー——
総合職
(首都圏限定)
↓
総合職
(全国勤務)
ー
2人
(女性)
—
総合職
(全国勤務)
↓
業務職
ー——
総合職
(首都圏限定)
↓
業務職
ー——
雇用形態
転換
派遣社員
⇒
業務職
ー—
1人
(女性)
合計ー2人1人
KPI項目
TC
目標(目標年度)小分類2023年度2024年度2025年度
労働者の男女の賃金差異
※1
ー全労働者58.1%61.0%62.7%
男女別の再雇用
または中途採用の実績
ー
女性10人11人9人
男性40人38人39人
合計50人49人48人
人財確保・育成に向けた投資
(「研修費用」+「研修時間×人件費」+「人
財採用費用」)
8億円以上
(2027年度)
ー4.8億円5.7億円6.4億円
研修費
※2
ー
全労働者
113.2百万円142.5百万円165.5百万円
社員一人当たり研修費
※2
ー109千円135千円153千円
社員一人当たり研修時間ー49.1時間55.2時間61.2時間
ダイバーシティ研修の実績ー
eラーニング
実施回数
1回1回1回
キャリアチャレンジ制度
(社内公募制度)
ー異動人数19人24人16人
エンゲージメント指数
※3
(理念浸透×風土改革×制度充実)
(満足度)
4.0/5.0
(2030年度)
全労働者
(派遣、他社
からの
出向者除く)
ー3.23.3
エンゲージメント指数
※3※4
全体エンゲージメントスコア
ー53.256.257.1
エンゲージメント指数
※3
レーティング
ーBBBBBBBB
プレゼンティーズム(活性度)
※5
85%以上を維持
(2030年度)
ー86%85%85%
アブセンティーズム
※6
3.0日以下を維持
(2030年度)
ー2.2日2.2日2.0日
※1 男女の賃金の差異に関する補足説明
・ 当社は男女による賃金体系および制度上の違いはありません。
・ 当社はコースおよび資格により異なる賃金水準を設定しておりますが、男女ではコースおよび資格の人員分布に差があり、それに伴う男
女の賃金差異が生じております。
※2 研修費および社員一人当たり研修費には会場費·交通費も含まれます。
※3 エンゲージメント指数は、株式会社リンクアンドモチベーションが提供する「モチベーションクラウド」で測定しています。
(2025年度の測定人数1,328名、回答率99%)
※4 「モチベーションクラウド」におけるエンゲージメント指数は全国平均を50とした偏差値となります。
※5 健康問題による生産性への影響を踏まえ、本来発揮できるパフォーマンスがどの程度維持されているかを示す指標。数値が高いほど良好。
株式会社ヒューマネージのデータベースに基づく「仕事の実績、質、量」に関する活性度(生産性)指数より把握しています。
(2025年度の測定人数:1,306名、回答率:100%)
※6 健康問題により、仕事を休んでいる状態。「過去1年間に、自身の病気により仕事を何日休んだか」を尋ねるアンケートの回答日数の平均値。
(2025年度の測定人数:1,306名、回答率:100%)
人材関連データ
26
Sustainability
Environment
Introduction
Social
社会
GoWernanDe
環境・社会に配慮した投融資
サステナブル調達
環境・社会に配慮した
投融資方針
東京センチュリーグループ(以下、当社グループ)は、「青い地球の未来をつくる」と
いうパーパスのもと、社会課題の解決を通じたグループの持続的な企業価値向上を
目指すため、当社グループの「環境基本方針」および「人権基本方針」に基づき、環境・
社会へ負の影響の大きい事業に対する投融資等を制限することを明記した「環境・
社会に配慮した投融資方針(以下、当方針)」を制定しました。
当方針は、当社グループの事業活動により生じる環境・社会への負の影響をリス
クと捉え、真摯に対応すべき経営上の重要課題と認識し、さまざまなステークホル
ダーの考え方を踏まえたうえで、取締役会で決議し、制定されました。
詳細はWebサイトをご覧ください。
https://www.tokyocentury.co.jp/jp/sustainability/esg/environment/environmental-and-social-
management-policy.html
株主·投資家·顧客向け活動
IR基本方針当社は、「経営理念体系」「企業行動規範」および東京証券取引所「コーポレートガバ
ナンス・コード」の趣旨・精神を尊重し、法令や規則に基づく適正な情報開示を行う
とともに、さまざまなステークホルダーとの間で公正かつ良好な関係を構築しつつ、
株主および投資家等との対話を促進し、長期的な視点での企業価値の向上に資する
ことを目的としてIR基本方針を定めています。
IR基本方針には、上記の目的のほかに、対象となる情報開示、情報開示体制、情報開
示および株主・投資家等との対話に際しての基本原則、情報開示の方法、株主およ
び投資家等との対話、インサイダー情報の取り扱いなどを記載しています。
詳細はWebサイトをご覧ください。
https://www.tokyocentury.co.jp/jp/ir/ir-policy/
株主還元原則として、年2回(中間・期末)の配当を実施しています。
当社の配当方針として、長期的かつ安定的に利益還元を行うことを基本とし、持続的
な利益成長を果たしたうえで、配当性向の向上を図っていきます。
詳細はWebサイトをご覧ください。
https://www.tokyocentury.co.jp/jp/ir/stock/return.html
コミュニケーション当社は、株主·投資家の皆さまとの対話を積極的に実施し、さまざまなご意見·ご要望
を経営陣および従業員へフィードバックするサイクルを軸としたIR活動を推進して
います。こうしたIR活動において得られたご意見をもとに、情報開示の拡充や経営課
題の改善を実現し、株主・投資家の皆さまとの信頼関係の構築、資本市場からの適切
な評価の浸透を図り、中長期的な企業価値向上に繋げています。
詳細はWebサイトをご覧ください。
https://www.tokyocentury.co.jp/jp/sustainability/esg/social/investors.html
金融商品の勧誘方針
詳細はWebサイトをご覧ください。
https://www.tokyocentury.co.jp/jp/finance-policy/
顧客責任方針・基本的な考え方
世界のさまざまな地域において、金融・サービス事業を中心とした企業活動を行っ
ている東京センチュリーグループでは、「事業活動を通じて社会的・倫理的課題の
解決に取り組んでいくことが、持続可能性(サステナビリティ)を保ち、さらなる成
長に繋がる」と考えております。
当社グループの「経営理念体系」に加え、「企業行動規範」、「勧誘方針」に基づき、お
客さまにとって最適かつ、満足していただける商品・サービスを提供するため、管
理体制のさらなる整備や教育訓練プログラムの実施により、顧客である「お客さま」
に対する責任を果たしていきます。
当社グループは、リース事業という特性上、法人向け取引が中心です。なお、個人向
けオートリース、個人向けレンタカーなどの消費者に直接アクセスする商品・サー
ビスにおいては、安全に関する法律や規制、品質基準を順守し、安全性や品質向上
の取り組みを推進しています。万が一、当社グループの提供した商品・サービスに
品質上の問題が生じた場合には、迅速に対応し、原因究明・再発防止に努めます。
東京センチュリーグループは、サステナビリティ経営を標榜しており、グループの
「経営理念体系」に基づき顧客責任を果たしてまいります。
詳細はWebサイトをご覧ください。
https://www.tokyocentury.co.jp/jp/sustainability/esg/social/responsibilities.html
サステナブル調達
方針
サプライチェーン全体における持続可能な責任を求める国際原則に対応すること
で、企業としての社会的責任を果たすため「サステナブル調達方針」を制定しました。
ESG(環境・社会・ガバナンス)に基づく包括的な取り組み方針を開示するとともに、
すべてのサプライヤーに対して、本方針の理解と協力を求めていきます。
詳細はWebサイトをご覧ください。
https://www.tokyocentury.co.jp/jp/sustainability/esg/social/procurement-policy.html
27
Sustainability
Environment
Introduction
Social
Governance
ガバナンス
コーポレート・ガバナンス
基本的な考え方当社は、企業価値の最大化にはコーポレート・ガバナンスが有効に機能することが重
要な経営課題であると認識しています。このため、経営環境の変化に対する迅速かつ
的確な判断が可能な健全で透明性の高いマネジメント体制の実現に取り組んでいま
す。また、内部統制とリスクマネジメントシステムを適切に運用し、有効に機能させ
ることにより、企業経営の健全性・透明性の向上を図っています。
内部統制システムを
含むコーポレート・
ガバナンス体制
当社の経営体制は、取締役会、監査役会を中心に構成されています。また、経営戦略
決定の迅速化と監督体制・業務執行体制のさらなる強化を目的として執行役員制度
を導入しています。
加えて、ビジネスサポート力の強化とグループガバナンスの向上を目的に、CxO体制
を構築し、専門性を活かした迅速かつ機動的な意思決定を推進しています。
詳細はWebサイトをご覧ください。
https://www.tokyocentury.co.jp/jp/company/leadership-and-governance/leadership/
https://ssl4.eir-parts.net/doc/8439/ir_material12/272095/00.pdf
なお、取締役11名のうち、女性取締役の選任は2名、執行役員23名のうち、女性執行
役員の登用は1名です。
(2026年6月25日現在)
株主総会
監査役会
指名委員会
会計監査人
顧問弁護士
監査役
CAE
CRO
選任・解任
連携
連携
連携
連携
監査
報告
任命
監査
報告
答申
答申
選任・解任
審議・
報告
指揮・監督審議・報告
選任・解任
選定・解職・監督
内部監査・内部統制評価
報酬委員会
取締役会
取締役
内部統制委員会
リスク管理委員会
ALM委員会
IT・事務戦略委員会
サステナビリティ委員会
投資マネジメント委員会
経営会議
投資
会議
案件審査
会議
社長
(CEO)
コーポレートライン・
ビジネスライン
グループ会社
監査
CEO:Chief Executive Officer(最高経営責任者)
CRO:Chief Risk Officer(最高リスク管理責任者)
CAE:Chief Audit Executive(最高監査責任者)
コーポレート・
ガバナンスに関する報告書
詳細はWebサイトをご覧ください。
https://www.tokyocentury.co.jp/jp/sustainability/esg/governance/system.html#anc_report
取 締 役 会 の 体 制 、議 題 、実 効 性
評価および役員のトレーニング
詳細は統合レポート2026をご覧ください。
https://www.tokyocentury.co.jp/jp/ir/library/integrated-report/
役員報酬
当社は、取締役の個人別の報酬等の内容に係る決定方針を、独立社外取締
役を主要な構成員とする報酬委員会に諮問し、外部専門家の助言も受けた
うえで、取締役会で決議する形で決定しております。報酬の方針・制度・
水準等については、報酬委員会に原案を諮問し、その答申を尊重して、取
締役会が決定いたします。
当社は、2024年6月24日開催の第55回定時株主総会において、役員報
酬制度を改定し、新たな業績連動型株式報酬制度を導入することを決議い
たしました。新制度は取締役等の報酬と当社の業績および株式価値との
連動性をより明確にし、取締役等が株価上昇によるメリットのみならず、
株価下落リスクまでも株主の皆さまと共有することで、中長期的な業績の
向上と企業価値の増大に貢献する意識を高めることを目的とするもので、
2024年度の業績に基づく業績連動報酬から新制度へ移行しました。ま
た、当社の報酬委員会から、本制度の目的、中長期的な業績向上に向けた
インセンティブ付与の効果等を踏まえ、本制度の導入は相当であるとの答
申を得ております。役員報酬制度の改定および新たな業績連動型株式報酬
制度導入に伴い、取締役の個人別の報酬等の内容に係る決定方針を変更い
たしました。
詳細は第57期 有価証券報告書81-84ページをご覧ください。
https://ssl4.eir-parts.net/doc/8439/yuho_pdf/S100YDRI/00.pdf#page=81
独立性・客観性を担保した内部
監査・内部統制
詳細はWebサイトをご覧ください。
https://www.tokyocentury.co.jp/jp/sustainability/esg/governance/audit.html
28
Sustainability
Environment
Introduction
Social
Governance
ガバナンス
リスクマネジメント
マネジメント連結べースでの総合リスクマネジメント(ERM)
詳細は統合レポート2026をご覧ください。
https://www.tokyocentury.co.jp/jp/ir/library/integrated-report/
非財務リスク(非定量)
事業領域の拡大、特に金融から事業・サービスへの展開とともに、リスクの定量評
価にはなじまない非財務のオペレーショナルリスクが重要となっており、非財務情
報のリスク指標(KRI)を定めてモニタリングし、取締役会等に報告しています。具
体的な指標の種類としては、人事、情報セキュリティ、事件・事故、コンプライアン
ス、気候変動、法務・腐敗防止等がありますが、近年は「人権」、「気候変動リスク」の
把握・管理が重要となっており、人事・労務のスコープ拡大(単体から連結へ)、再
生可能エネルギー、CO
2
排出量、省燃費機材(航空機)・電動車の保有比率等の環境
関連指標の拡大に努めています。ステークホルダーの非財務リスクに対する関心は
高まっており、今後も「人権」「気候変動リスク」のほか、サステナビリティの観点か
らESG/SDGsに関する有効な指標の拡充を図っていきます。
環境・気候変動リスク
当社グループは、気候変動への対応を重要な課題として認識しており、「気候関連財
務情報開示タスクフォース(TCFD)」の提言に賛同し、TCFD提言に準拠したシナ
リオ分析の実施と情報開示を開始するなど、気候変動への対応を進めています。
リスク重要度評価によるシナリオ分析の実施
当社グループは、6つの部門を有していることから、シナリオ分析の対象事業を選
定するに当たっては、インダストリー別の気候変動リスクによる環境影響評価と
GHG排出量・資産残高などの事業分野間での相対比較により、リスク重要度評価
を実施しています。これまで、環境・エネルギー事業(太陽光発電事業)、航空機事
業(航空機リース事業)、およびオートモビリティ事業(法人・個人向けオートリー
ス事業)を対象にシナリオ分析を行いました。今後もリスク重要度評価に応じて、
シナリオ分析対象事業の拡大と分析精度の向上を通じて、リスクの対応策と機会の
獲得について検討を深めていきます。
マネジメントリスク重要度評価について
ステークホルダーにとっての重要度
当社にとっての重要度
シナリオ分析の対象事業
●
ESG評価機関などによる
気候変動リスクの高いインダストリーの評価
リスク重要度を評価して抽出
●
部門別のGHG排出量の評価
●
部門別の収益および費用、資産残高などの当社ポートフォリ
オの評価
●
部門別のリスク(移行リスクおよび物理的リスク)と機会の
評価
環境・エネルギー事業(太陽光発電事業)
航空機事業(航空機リース事業)
オートモビリティ事業(法人・個人向けオートリース事業)
詳細はWebサイトをご覧ください。
https://www.tokyocentury.co.jp/jp/sustainability/esg/environment/tcfd.html#anc_strategy
投資マネジメント
フレームワーク
詳細は統合レポート2026をご覧ください。
https://www.tokyocentury.co.jp/jp/ir/library/integrated-report/
主なリスクと
管理態勢
詳細はWebサイトをご覧ください。
https://www.tokyocentury.co.jp/jp/sustainability/esg/governance/risk.html
リスクヒートマップ
詳細はWebサイトをご覧ください。
https://www.tokyocentury.co.jp/jp/sustainability/esg/governance/risk.html
29
Sustainability
Environment
Introduction
Social
Governance
ガバナンス
コンプライアンス
マネジメント当社グループは、企業が存続していくためにはコンプライアンスの徹底が必要不可
欠であるとの認識のもと、すべての役職員が公正で高い倫理観に基づいて行動し、
広く社会から信頼される経営体制の確立に努めています。
具体的には、当社社長を当社グループのコンプライアンス最高責任者とし、社長の
任命したCRO:Chief Risk Officer(最高リスク管理責任者)の監督下において、総
合リスク管理部 コンプライアンスグループがコンプライアンス・プログラムに則
して、人権問題や贈賄等の腐敗防止を含むグループ全体のコンプライアンスの施策
推進、教育、総括に関する役割を担う体制を敷いています。当社組織の各部室店長
はコンプライアンス責任者を務め、自部室店におけるコンプライアンス推進の責任
を負い、コンプライアンスグループと連携し、コンプライアンス事案に関する対応、
研修等を実施します。
当社連結グループ会社については、各社の社長またはこれに準じる役員をコンプラ
イアンス責任者とし、CROの指示、指導・助言により自社のコンプライアンス体制
の構築・維持・管理を統括します。
連結対象外のグループ会社に対しても、コンプライアンスグループより適宜コンプ
ライアンス体制の管理や推進に関する指導・助言等を行っています。
当社グループのコンプライアンス体制・運用状況および違反の特定状況は、定期的
に経営会議および取締役会に報告し、有効性を含めてレビューを受け、その結果を
もとにコンプライアンス推進策を策定し、実行するものとしています。
また、役職員にコンプライアンスの順守を徹底させるため、年に一度、コンプライ
アンス誓約書の提出を義務付けています。
2025年度において、人権の侵害事案を含め公表すべき重大なコンプライアンス違
反は発生しておりません。
コンプライアンス
体制
詳細は、Webサイトおよび統合レポート2026をご覧ください。
https://www.tokyocentury.co.jp/jp/sustainability/esg/governance/compliance.html
https://www.tokyocentury.co.jp/jp/ir/library/integrated-report/
コンプライアンス
教育
コンプライアンス
研修
内部通報制度
マネー・ローンダリング
防止に向けた取り組み
詳細はWebサイトをご覧ください。
https://www.tokyocentury.co.jp/jp/sustainability/esg/governance/compliance.html
腐敗防止に向けた取り組み・
政治資金の対応
詳細はWebサイトをご覧ください。
https://www.tokyocentury.co.jp/jp/sustainability/esg/governance/compliance.html
30
Sustainability
Environment
Introduction
Social
Governance
ガバナンス
情報セキュリティ
ISO27001の
認証取得について
当社グループでは、お取引先に関わる情報資産および当社グループの情報資産を不
正アクセス・紛失・漏えい・改ざん、破壊等の脅威から保護することを目的に、情報
セキュリティマネジメントシステムの国際規格であるISO/IEC27001の認証を取
得し、情報資産の適切な保護と管理に全社的に取り組んでいます。今後も、社会か
ら信頼される企業を目指し、ISO/IEC27001のより一層の定着化と継続的な改善
を図り、情報セキュリティの確保に努めます。
(認証機関:BSIグループジャパン株式会社)
ISO27001認証取得範囲
東京センチュリーおよびグループ会社における以下事業所
で認証を取得しています。
・ 東京センチュリー株式会社(本社、常盤橋タワー)
・EPC Japan株式会社
また、連結子会社である以下の1社については、個別に認証を取得しています。
・FLCS株式会社(全事業所)
情報セキュリティ
基本方針
東京センチュリーグループは、お取引先に関わる情報資産および当社グループの情
報資産をさまざまなセキュリティ上の脅威から保護するため、この方針および関連
規程・規則を定め、以下の取り組みを行ってまいります。
詳細はWebサイトをご覧ください。
https://www.tokyocentury.co.jp/jp/sustainability/esg/governance/information-security.html#anc_
information-security
情報セキュリティ
への取り組み
当社グループでは、情報セキュリティを経営にかかわる重大な課題と認識して
います。そのため情報セキュリティマネジメントシステムの国際規格である
ISO27001を取得し、情報セキュリティ委員会を中心に情報管理に関する規程類
の整備、定期的なリスクアセスメントの実施によるリスクへの対策、役職員向けの
情報セキュリティ研修などを実施しています。
サイバーセキュリティについては、専門組織である「TC-CSIRT」を情報システム部
内に設置し、セキュリティ監視、クラウドサービスのセキュリティ評価、役職員へ
の啓発活動等を通じて、インシデントの予防や再発防止に取り組んでいます。サイ
バー攻撃は日々高度化・巧妙化していることから、日本シーサート協議会への加盟
による外部組織との情報共有や、実践を想定した演習への参加等を通じて、インシ
デント対応力の強化を推進しています。また主要株主が運用するサイバーセキュリ
ティフレームワークに参加し、アセスメントや実践的演習を連携して実施すること
で、サイバーセキュリティ対策の継続的な強化を図っています。
事業のグローバル展開およびグループ経営の進展に伴い、国内外グループ会社を含
めた情報セキュリティガバナンスの向上が重要であると認識しています。海外現地
法人へのアセスメントを通じた課題抽出や対応に加え、国内グループ会社に対して
も各社の実態把握に向けたヒアリングを実施し、その結果をもとにグループ全体の
セキュリティ強化策を検討・推進しています。
そのほか、当社および国内外グループ会社を対象に、日本語および外国語による
メール攻撃を想定した訓練を毎年複数回実施しており、役職員の情報セキュリティ
意識の向上を図る施策として有効に機能しています。
生成AI技術の利活用においては、安全に利用できる環境を整備した生成AIを全社
導入し、業務効率化と生産性向上を推進しています。具体的にはAI固有のリスクに
対応するため、利用ガイドラインの策定、適切なインフラ環境の整備、および役職
員への継続的なDXリテラシー教育等の対策を講じ、AIガバナンスを強化したうえ
で、利活用に努めております。
個人情報保護
個人情報保護の
取り組み
当社は、個人番号および特定個人情報(以下、総称して「特定個人情報等」という)を
含む個人情報の保護を重要な社会的責務であると認識し、個人情報保護方針に基づ
いて、個人情報を適切に取り扱っています。
また、お客さまおよび株主さまの個人情報は、その利用目的を定め適切に取り扱っ
ています。
詳細はWebサイトをご覧ください。
「個人情報保護方針」
https://www.tokyocentury.co.jp/jp/sustainability/esg/governance/personal-information.html#anc_
privacy
「お客さまの個人情報の取り扱いについて」
https://www.tokyocentury.co.jp/jp/sustainability/esg/governance/personal-information.html#anc_
privacy-customer
「株主さまの個人情報の取り扱いについて」
https://www.tokyocentury.co.jp/jp/sustainability/esg/governance/personal-information.html#anc_
privacy-shareholder
外部イニシアティブ
への参画
外部団体への参画においては、東京センチュリーグループの考え方や方向性に一致
する業界団体・イニシアティブに積極的に参画し、気候変動(脱炭素化)等のサステ
ナビリティに関する取り組みを推進しています。外部団体参画の見直しにおいて
は、当社の考え方や方向性との整合性を精査し、差異がある場合、まずはエンゲー
ジメントを通じて当社の立場や考え方を理解してもらえるよう働きかけます。その
うえで、外部団体と当社の考えの差異が埋まらず、今後さらに乖離していく場合に
は、当該団体の考え方を精査し、脱退も視野に入れて検討します。
詳細はWebサイトをご覧ください。
https://www.tokyocentury.co.jp/jp/sustainability/our-sustainability/commitment.html
外部評価・ESG
インデックス組入れ
東京センチュリーのサステナビリティ経営は社外の組織・団体から認定などを受け
ており、各種インデックスの構成銘柄にも採用されています。
詳細はWebサイトをご覧ください。
https://www.tokyocentury.co.jp/jp/sustainability/our-sustainability/commitment.html#anc_esg
コミットメントと外 部 評 価
31