通期連結業績予想の上方修正並びに剰余金の配当(中間配当)および配当予想の修正(増配)に関するお知らせ
Bull 4
Bear 0
Guidance
Fiscal year ends March
Quarters are offset from the calendar — Q1 is Apr–Jun
|
Mizuho Leasing Company, Limited is a financial services provider operating in the leasing, installment sales, and finance sectors. The company's business segments include leasing and installment sales for real estate, industrial and construction machinery, information-related equipment, transportation equipment, and environmental and energy-related facilities. Its finance segment involves lending, equity investment, and factoring services targeting real estate, ships, aircraft, and the environmental and energy sectors. The group also engages in the trading of used assets and power generation. Key subsidiaries include Daisan Leasing, Mizuho Toshiba Leasing, Mizuho Auto Leasing, Universal Leasing, and Mizuho Leasing Indonesia. The company serves domestic and international markets, with a presence in regions such as China, India, Indonesia, Singapore, the United Kingdom, and the United States. Summarised from the annual report, fiscal year ended Mar 2026 |
Industry Rental & Leasing Services | Homepage mizuho-ls.co.jp/ja/index.html |
| Sector Industrials | IR page mizuho-ls.co.jp/ja/index.html | |
|
Tags
equipment leasing, real estate leasing, aircraft leasing, ship leasing, installment sales, factoring, power generation, industrial machinery, information technology equipment, transportation equipment, Daisan Leasing, Mizuho Toshiba Leasing, Mizuho Auto Leasing, Universal Leasing, Mirai Capital, ML Trading, P.C.S., ML Power, ML Office Service, ML ITAD Solution, Uguisu, Shirakawa Waterpower Leasing, Mirai No. 1 Investment Limited Partnership, MIRAI POWER No. 1 LLC, Japan Infrastructure Fund Investment Corporation, Miraizosoden Koma Kinmachi LLC, Miraizosoden Tsu Hakusan LLC, Miraizosoden Kamikita Rokkasho LLC, Miraizosoden Takahagi LLC, Miraizosoden Matsusaka Kinno LLC, Miraizosoden Toba LLC, Miraizosoden Samihama LLC, Succeed Matsusaka Socho LLC, MM Power LLC, Mizuho Leasing China Co. Ltd., Mizuho RA Leasing Pvt. Ltd., Mizuho Capsave Finance Pvt. Ltd., PT MIZUHO LEASING INDONESIA Tbk, TDP 1 Limited, Ho-oh SPV LLC, MM WHEEL LLC, IBJ Air Leasing (US) Corp., IBJ Air Leasing Limited, Mizuho Leasing (UK) Ltd., Mizuho Leasing (Singapore) Pte. Ltd., Cygnus Line Shipping S.A., MLC AIRCRAFT LEASING LLC., IBJL Aircraft Lotus Co. Limited, IBJL Aircraft Rafflesia Co. Limited, IBJ Air Leasing (Ireland) 1 Limited, IBJ Air Leasing (Ireland) 2 Limited, Aircraft MSN 4126 LLC, Aircraft MSN 7160 LLC, Aircraft MSN 7316 LLC, Aircraft MSN 7791 LLC, Aircraft MSN 33212 LLC, Gemini Line Shipping S.A., Orion Line Shipping S.A., Pyxis Line Shipping S.A., Draco Line Shipping S.A., Pavos Leasing Co. Ltd., Mizuho Marubeni Leasing Co. Ltd., Ricoh Leasing Co. Ltd., Mizuho Capital Co. Ltd., Japan Infrastructure Fund Advisors Co. Ltd., Rental System Co. Ltd., Metric Co. Ltd., Nippon Steel Sumitomo Real Estate Co. Ltd., Jecos Co. Ltd., Krungthai Mizuho Leasing Co. Ltd.
|
Press page mizuho-ls.co.jp/ja/news |
Metrics
| Valuation | |
|---|---|
| Market cap | ¥ 386.097B |
| Market cap (USD) | $ 2.413B |
| P/E | 6.22 |
| PEG | 0.33 |
| P/BV | 0.80 |
| P/S | 0.42 |
| P/OCF | 5.20 |
| P/FCF | — |
| Dividend yield | 3.9% |
| Turnover / mcap | — |
| Returns | |
|---|---|
| ROE | 11.1% |
| ROI | 2.0% |
| ROIC | 1.4% |
| Profit margin | 5.2% |
| Growth | |
|---|---|
| Revenue growing | Yes |
| Profits growing | Yes |
| Revenue up 3y | Yes |
| Revenue up 5y | No |
| Earnings growth 3y (net profit CAGR) | 18.8% |
| Quality | |
|---|---|
| Profitable | Yes |
| Margin expanding | No |
| Buying back stock | No |
| Diluting (TTM) | Yes |
| Debt/Equity | — |
| Podcast bulls (TTM) | Sign up |
| Podcast bears (TTM) | Sign up |
| Podcast sentiment (TTM) | Sign up |
| Podcast sentiment % (TTM) | Sign up |
| News sentiment (TTM) | 6 |
| Quality score | 23.5% |
| Insiders | |
|---|---|
| Buys, 1w | Sign up |
| Buys, 1m | Sign up |
| Buys, 1y | Sign up |
| Sells, 1w | Sign up |
| Sells, 1m | Sign up |
| Sells, 1y | Sign up |
Sign up to see this company's insider trades
| Figure | FY 2026 | FY 2025 | FY 2024 | FY 2023 | FY 2022 | FY 2021 | FY 2020 | FY 2019 | FY 2018 | FY 2017 | FY 2016 | FY 2015 | FY 2014 | FY 2013 |
|---|---|---|---|---|---|---|---|---|---|---|---|---|---|---|
| Revenue | 921.592B | 695.423B | 656.127B | 529.7B | 554.809B | 497.852B | 539.241B | 384.893B | 399.738B | 429.405B | 364.174B | 353.733B | 354.779B | 352.492B |
| Net profit | 47.609B | 42.038B | 35.22B | 28.398B | 14.902B | 21.772B | 17.512B | 16.594B | 13.643B | 12.414B | 11.609B | 11.144B | 10.531B | 8.92B |
| Figure | FY 2026 | FY 2025 | FY 2024 | FY 2023 | FY 2022 | FY 2021 | FY 2020 | FY 2019 | FY 2018 | FY 2017 | FY 2016 | FY 2015 | FY 2014 | FY 2013 |
|---|---|---|---|---|---|---|---|---|---|---|---|---|---|---|
| Share price | 1.391K | 1.04K | 1.162K | 3.52K | 2.988K | 3.328K | 2.103K | 2.616K | 3.004K | 2.381K | 1.992K | 2.484K | 2.598K | 2.886K |
| Price performance 12m | 0.34 | -0.1 | -0.67 | 0.18 | -0.1 | 0.58 | -0.2 | -0.13 | 0.26 | 0.2 | -0.2 | -0.04 | -0.1 | — |
Filed figures
Lines the statements and their notes report beside the headline figures, read from the filings' XBRL as filed (no restatement applied), with figures computed from one filing's own lines. Cash-flow lines carry their cash direction: an outflow is negative. Each period links to its filing; a figure's period, report date and tag are in its tooltip.
| Figure | Mar 2017 | Mar 2018 | Mar 2019 | Mar 2020 | Mar 2021 | Mar 2022 | Mar 2023 | Mar 2024 | Mar 2025 | Mar 2026 |
|---|---|---|---|---|---|---|---|---|---|---|
| Balance sheet detail | ||||||||||
| Trade receivables (JPY) | 486M | 363M | 1.02B | 886M | 767M | 549M | 751M | 1.24B | 2.72B | 9.53B |
| ↳ YoY growth | +6.3% | -25.3% | +179.6% | -12.7% | -13.4% | -28.4% | +36.8% | +64.4% | +120.2% | +250.4% |
| ↳ 5y CAGR | +10.9% | +2.5% | +15.7% | +4.0% | +25.1% | +65.5% | ||||
| Borrowings, current (JPY) | 902B | 927B | 1.11T | 1.11T | 1.3T | 1.36T | 1.38T | 1.54T | 1.8T | 1.78T |
| Borrowings, non-current (JPY) | 513B | 505B | 609B | 758B | 820B | 903B | 1.03T | 1.2T | 1.38T | 1.6T |
| Bonds payable (JPY) | 58B | 58B | 106B | 135B | 210B | 251B | 304B | 403B | 486B | 496B |
| Lease liabilities (JPY) | 7.33B | 7.25B | 8.01B | 8.77B | 8.96B | 10.4B | 18.2B | 15.8B | 18.6B | 20.7B |
| Cash and deposits (JPY) | 42.3B | 30.3B | 25.9B | 22.8B | 21.1B | 25.3B | 34B | 56.7B | 68.1B | 88.9B |
| Intangible assets (JPY) | 4.19B | 4.32B | 6.07B | 6.36B | 7.09B | 16.7B | 15.1B | 19.9B | 22.9B | 32B |
| Net debt (borrowings + leases - cash) (JPY) | 1.38T | 1.41T | 1.7T | 1.86T | 2.11T | 2.25T | 2.4T | 2.7T | 3.13T | 3.31T |
| Cash flow detail | ||||||||||
| Operating cash flow (JPY) | -73.1B | -54.2B | -296B | -69.1B | -197B | -68.5B | -118B | -192B | -393B | -18.4B |
| Change in receivables (cash effect) (JPY) | -31M | 122M | -653M | 127M | 118M | 217M | -201M | 420M | -1.4B | -4.61B |
| Change in payables (cash effect) (JPY) | 2.18B | 955M | 1.74B | -6.69B | -14.2B | -489M | -10.2B | 75M | 3.59B | 4.86B |
| Dividends paid (cash effect) (JPY) | -2.56B | -2.81B | -3.24B | -3.92B | -4.02B | -5.24B | -5.88B | -8.09B | -11B | -14.7B |
| Interest paid (cash effect) (JPY) | -5.94B | -7.22B | -8.8B | -10.5B | -9.09B | -8.53B | -12.3B | -19.9B | -30.6B | -40.6B |
| Income taxes paid (cash effect) (JPY) | -8.95B | -4.57B | -4.94B | -9.06B | -7.98B | -10.7B | -9.62B | -8.93B | -15.5B | -20.8B |
| Operating cash flow before change in receivables (JPY) | -73.1B | -54.3B | -295B | -69.3B | -197B | -68.7B | -118B | -193B | -392B | -13.8B |
| Income detail | ||||||||||
| Total comprehensive income (JPY) | 12.4B | 15.7B | 13.1B | 17.6B | 20.1B | 25.1B | 50.9B | 56.7B | 50B | 57.1B |
| Comprehensive income to owners (JPY) | 12.1B | 15.2B | 12.5B | 17.1B | 19.6B | 23.9B | 49.1B | 54.1B | 46.2B | 56.4B |
| Provision for credit losses (JPY) | 1.53B | -746M | -586M | -435M | 78M | 7.73B | 653M | 2.26B | 1.08B | 4.24B |
| Credit cost ratio (credit losses / average receivables) (%) | 324.3% | 175.7% | 85.1% | 45.8% | 9.4% | 1,174.6% | 100.5% | 228.0% | 54.7% | 69.2% |
| Reported | Jun 23, 2017 | Jun 26, 2018 | Jun 25, 2019 | Jun 24, 2020 | Jun 28, 2021 | Jun 24, 2022 | Jun 27, 2023 | Jun 25, 2024 | Jun 20, 2025 | Jun 19, 2026 |
Sign up to see institutional holdings
Sign UpPodcast Mentions
Sign up to see podcast mentions and sentiment
Sign UpTimely disclosures published on TDnet, newest first, titles as filed in Japanese. The link opens the disclosure on TDnet. Filings with EDINET (periodic reports, extraordinary reports, offerings, holding and buy-back reports), newest first, titles as filed in Japanese. The link opens the filing on EDINET. Press releases from the company's own website, newest first.


 (705KB)
 ](
 ](
 ](
 ](
 ](
 ](
 ](
 ](
 ](
 ](
 ](
 ](
 ](


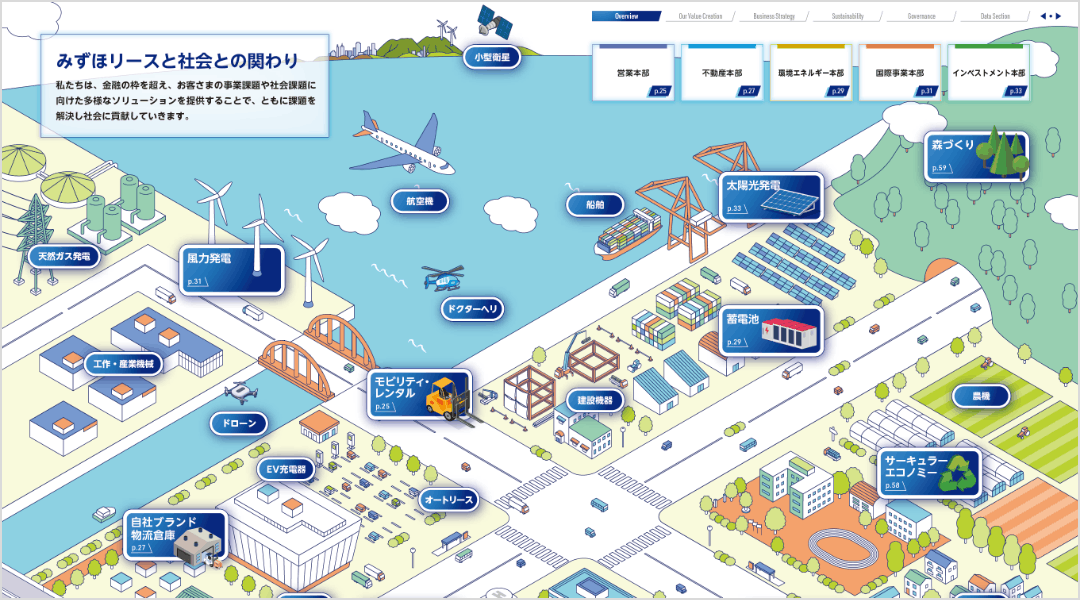
 サーキュラーエコノミー
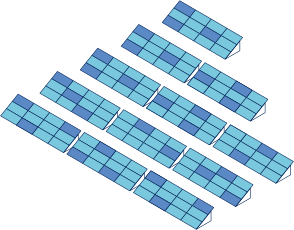
 太陽光発電
 医療機器
 モビリティ・レンタル
 オフィスビル開発
 風力発電
 森づくり
 蓄電池
 ITADサービス
 自社ブランド物流倉庫



























 PDF版
統合報告書
Prompts
Click prompts to add them under the company line, click again to take one out, then copy the result into your AI chat. Shared by Asian Century Stocks and Uncovered Thai Stocks. Thank you.
Mizuho Leasing Company, Limited (ticker 8425), listed in Japan.
Copied
ETFs Holding Mizuho Leasing Company, Limited
Exchange-traded funds whose newest published daily portfolio holds one of the company's listings, largest weight first.