|
The Awa Bank, Ltd. is a regional financial institution operating primarily in the banking and leasing sectors. The company provides a range of financial services, including deposits, lending, securities investment, domestic and foreign exchange, and the sale of public bonds, investment trusts, and insurance. It also offers trust services and financial product brokerage. Its business activities are supported by several subsidiaries that provide complementary services, such as credit guarantee, credit card issuance, management consulting, e-commerce mall operations, and investment fund management. The group also engages in leasing activities and investments in growth enterprises through specific investment funds and limited partnerships. Summarised from the annual report, fiscal year ended Mar 2026 |
Industry Banks - Regional | Homepage awabank.co.jp |
| Sector Financial Services | IR page awabank.co.jp/kojin | |
|
Tags
regional banking, credit guarantee, credit cards, leasing, investment funds, e-commerce operations, trust services, foreign exchange, Awa Bank Guarantee Co. Ltd., Awa Bank Card Co. Ltd., Awa Bank Consulting Co. Ltd., Awa Bank Connect Co. Ltd., Awa Bank Capital Co. Ltd., Awagin Growth Enterprise Investment Limited Partnership, Awa Bank Lease Co. Ltd., Awagin Business Succession Investment Limited Partnership, Awagin Future Creation Investment Limited Partnership, Awagin Innovation Investment Limited Partnership, Shikoku Alliance Capital Co. Ltd., Shikoku Brand Co. Ltd.
|
Press page — |
Metrics
| Valuation | |
|---|---|
| Market cap | ¥ 437B |
| Market cap (USD) | $ 2.731B |
| P/E | 9.06 |
| PEG | 0.60 |
| P/BV | 1.05 |
| P/S | 3.79 |
| P/OCF | -3.46 |
| P/FCF | -3.35 |
| Dividend yield | 8.4% |
| Turnover / mcap | — |
| Returns | |
|---|---|
| ROE | 4.2% |
| ROI | 3.9% |
| ROIC | 3.9% |
| Profit margin | 16.3% |
| Growth | |
|---|---|
| Revenue growing | Yes |
| Profits growing | Yes |
| Revenue up 3y | No |
| Revenue up 5y | No |
| Earnings growth 3y (net profit CAGR) | 15.0% |
| Quality | |
|---|---|
| Profitable | Yes |
| Margin expanding | No |
| Buying back stock | Yes |
| Diluting (TTM) | — |
| Debt/Equity | — |
| Podcast bulls (TTM) | Sign up |
| Podcast bears (TTM) | Sign up |
| Podcast sentiment (TTM) | Sign up |
| Podcast sentiment % (TTM) | Sign up |
| News sentiment (TTM) | 8 |
| Quality score | -5.9% |
| Insiders | |
|---|---|
| Buys, 1w | Sign up |
| Buys, 1m | Sign up |
| Buys, 1y | Sign up |
| Sells, 1w | Sign up |
| Sells, 1m | Sign up |
| Sells, 1y | Sign up |
Sign up to see this company's insider trades
| Figure | FY 2026 | FY 2025 | FY 2024 | FY 2023 | FY 2022 | FY 2021 | FY 2020 | FY 2019 | FY 2018 | FY 2017 | FY 2016 | FY 2015 | FY 2014 | FY 2013 |
|---|---|---|---|---|---|---|---|---|---|---|---|---|---|---|
| Revenue | 95.363B | 78.964B | 76.107B | 88.081B | 67.938B | 65.587B | 67.374B | 70.323B | 68.051B | 69.128B | 70.243B | — | — | — |
| Net profit | 15.527B | 13.202B | 11.263B | 10.207B | 11.112B | 8.498B | 11.16B | 10.958B | 11.863B | 12.474B | 12.995B | 12.215B | 10.527B | 9.157B |
| Free cash flow | 10.488B | 25.116B | -34.566B | -325.748B | 92.46B | 299.298B | 19.238B | -6.717B | 69.37B | -17.772B | 15.823B | — | — | — |
| Figure | FY 2026 | FY 2025 | FY 2024 | FY 2023 | FY 2022 | FY 2021 | FY 2020 | FY 2019 | FY 2018 | FY 2017 | FY 2016 | FY 2015 | FY 2014 | FY 2013 |
|---|---|---|---|---|---|---|---|---|---|---|---|---|---|---|
| Share price | 5.686K | 2.859K | 2.751K | 1.949K | 2.171K | 2.491K | 2.28K | 2.813K | 681.82 | 705.61 | 544.45 | 680.61 | 548.55 | 583.77 |
| Price performance 12m | 0.99 | 0.04 | 0.41 | -0.1 | -0.13 | 0.09 | -0.19 | 3.13 | -0.03 | 0.3 | -0.2 | 0.24 | -0.06 | — |
Filed figures
Lines the statements and their notes report beside the headline figures, read from the filings' XBRL as filed (no restatement applied), with figures computed from one filing's own lines. Cash-flow lines carry their cash direction: an outflow is negative. Each period links to its filing; a figure's period, report date and tag are in its tooltip.
| Figure | Mar 2017 | Mar 2018 | Mar 2019 | Mar 2020 | Mar 2021 | Mar 2022 | Mar 2023 | Mar 2024 | Mar 2025 | Mar 2026 |
|---|---|---|---|---|---|---|---|---|---|---|
| Balance sheet detail | ||||||||||
| Borrowings, non-current (JPY) | 10B | — | — | — | — | — | — | 487M | 437M | 387M |
| Bonds payable (JPY) | 10B | — | — | — | — | — | — | 487M | 437M | 387M |
| Cash and deposits (JPY) | 164B | 255B | 253B | 285B | 631B | 689B | 456B | 376B | 401B | 345B |
| Intangible assets (JPY) | 3.18B | 3.45B | 4.14B | 5.16B | 4.95B | 4.53B | 4.52B | 3.99B | 3.92B | 3.28B |
| Net debt (borrowings + leases - cash) (JPY) | -154B | — | — | — | — | — | — | -376B | -401B | -345B |
| Cash flow detail | ||||||||||
| Operating cash flow (JPY) | -14.2B | 73B | -1.85B | 25.1B | 302B | 96.7B | -322B | -31.5B | 28.2B | 13.6B |
| Purchases of property, plant and equipment (JPY) | -2.17B | -2.32B | -3.12B | -3.43B | -1.03B | -3.04B | -2.44B | -1.91B | -1.78B | -2.37B |
| Purchases of intangible assets (JPY) | -1.43B | -1.35B | -1.76B | -2.38B | -1.23B | -1.17B | -1.56B | -1.2B | -1.32B | -724M |
| Dividends paid (cash effect) (JPY) | -2.37B | -1.99B | -1.96B | -1.93B | -1.8B | -1.7B | -1.88B | -2.56B | -3.43B | -4.39B |
| Share buybacks (cash effect) (JPY) | -2.74B | -2.5B | -2.75B | -1.85B | -927M | -960M | -2.07B | -1.75B | -1.5B | -2.5B |
| Income taxes paid (cash effect) (JPY) | -6.61B | -5.27B | -5.28B | -5.13B | -3.69B | -3.77B | -5.95B | -2.93B | -5.59B | -3.89B |
| Free cash flow (OCF - PPE - intangibles) (JPY) | -17.8B | 69.4B | -6.72B | 19.2B | 299B | 92.5B | -326B | -34.6B | 25.1B | 10.5B |
| Income detail | ||||||||||
| Total comprehensive income (JPY) | 19.9B | 13.8B | 5.46B | -15.2B | 43B | -2.22B | -6.04B | 58.1B | 6.51B | 72.3B |
| Comprehensive income to owners (JPY) | 18.7B | 12.7B | 4.16B | -15.2B | 43B | -2.22B | -6.04B | 58.1B | 6.51B | 72.3B |
| Reported | Jun 29, 2017 | Jun 26, 2018 | Jun 27, 2019 | Jun 26, 2020 | Jun 29, 2021 | Jun 29, 2022 | Jun 29, 2023 | Jun 27, 2024 | Jun 20, 2025 | Jun 12, 2026 |
Sign up to see institutional holdings
Sign UpPodcast Mentions
Sign up to see podcast mentions and sentiment
Sign UpFilings with EDINET (periodic reports, extraordinary reports, offerings, holding and buy-back reports), newest first, titles as filed in Japanese. The link opens the filing on EDINET. Press releases from the company's own website, newest first.
「あわぎん2026冬の定期預金キャンペーン」の実施について
2026年10月30日
阿波銀行(頭取 福永丈久、本店:徳島県徳島市)は、2026年11月2日から、定期預金のお預入れに特別利率を適用する「あわぎん2026冬の定期預金キャンペーン」を実施しますので、お知らせいたします。
1.名称 「あわぎん2026冬の定期預金キャンペーン」
2.取扱期間 2026年11月2日(月)~2027年1月29日(金)
3.キャンペーン概要
| 取扱店舗 | 当行本支店窓口 ※ATM、ai-mo(個人向あわぎんインターネット・モバイルバンキング)によるお預入れは対象外です |
| 対象者 | 個人のお客さま ※徳島県外店舗でのお取扱いは2026年10月末日までに当行とお取引があるお客さまに限らせていただきます |
| 取扱総額 | 500億円 ※総額に達した場合は取扱いを終了いたします |
| 対象商品 | あわぎんスーパー定期・あわぎんスーパー定期300 ※期日指定定期預金・変動金利定期預金・積立式定期預金は対象外です |
| 預入金額 | 1口:10万円以上1,000万円未満(1円単位) |
| 対象資金 | ・新しくお預入れいただく資金に限ります。ただし、預入期間が1年、3年および5年の場合は当行預金からの振替も可能です。 ・当行定期預金からの振替は「あわぎん創業130周年記念定期預金」に限らせていただきます。 |
| 預入期間 | 6ヵ月 | 1年 | 3年 | 5年 |
| 適用利率 | 0.775% (店頭表示利率 +0.300%) | 0.850% (店頭表示利率 +0.350%) | 1.300% (店頭表示利率 +0.770%) | 1.500% (店頭表示利率 +0.800%) |
| 注意点 | ・適用利率は現在の店頭表示利率に基づくものです。 ・金利情勢の変化等により適用利率を変更する場合がございます。 ・初回満期日以降は自動継続時点の店頭表示利率が適用されます。 ・満期日前に中途解約された場合、お預入れ期間に応じた当行所定の中途解約利率が適用されます。 |
外部サイトへ移動します
これより先は外部サイトへ移動します。 よろしければ「はい」をクリックしてください。
はいいいえ
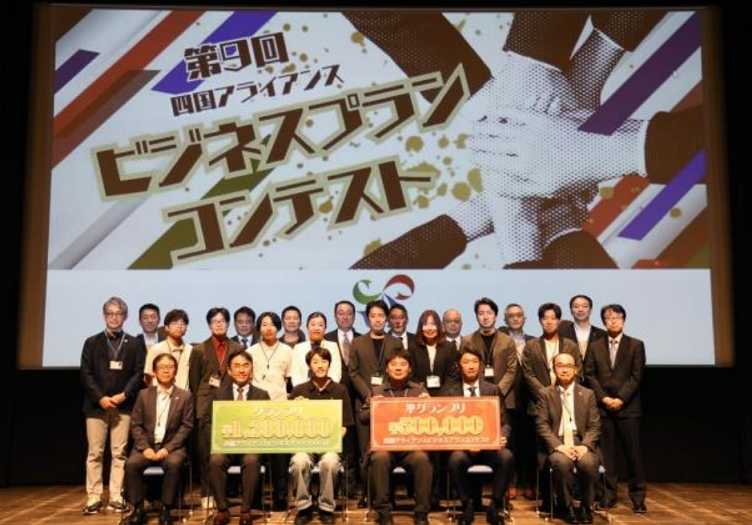 当日のプレゼンテーションの様子は、当行公式YouTubeにて後日公開予定です。



Prompts
Click prompts to add them under the company line, click again to take one out, then copy the result into your AI chat. Shared by Asian Century Stocks and Uncovered Thai Stocks. Thank you.
ETFs Holding The Awa Bank, Ltd.
Exchange-traded funds whose newest published daily portfolio holds one of the company's listings, largest weight first.
| ETF | Weight in ETF | Shares | Market value | As of |
|---|---|---|---|---|
| DISV | 0.11% | 452,660 | $ 5.418M | Nov 12, 2026 |
| AVDS | 0.09% | 27,800 | $ 315.171K | Nov 16, 2026 |
| AVDV | 0.06% | 1,074,600 | $ 12.183M | Nov 16, 2026 |
| DFIS | 0.04% | 208,900 | $ 2.501M | Nov 12, 2026 |
| DFAX | 0.02% | 184,000 | $ 2.202M | Nov 12, 2026 |
| DFIC | 0.02% | 229,000 | $ 2.741M | Nov 12, 2026 |
| DXIV | 0.02% | 3,500 | $ 41.895K | Nov 12, 2026 |
| AVDE | 0.01% | 166,700 | $ 1.89M | Nov 16, 2026 |
| DFAI | 0.01% | 113,500 | $ 1.359M | Nov 12, 2026 |