CORPORATE GOVERNANCE Last updated: August 27, 2026 Sumitomo Mitsui Trust Group, Inc. Director, President (CEO): Kazuya Oyama Inquiries: 03-6256-6000 Securities Code No.: 8309 https://www.smtg.jp/english/ The status of the corporate governance of…
CORPORATE GOVERNANCE
Last updated: August 27, 2026
Sumitomo Mitsui Trust Group, Inc.
Director, President (CEO): Kazuya Oyama
Inquiries: 03-6256-6000
Securities Code No.: 8309
https://www.smtg.jp/english/
The status of the corporate governance of Sumitomo Mitsui Trust Group*, Inc. (“SuMi
TRUST Group”) is described below.
I. Fundamental Perspectives on Corporate Governance, Capital Structure, Corporate
Profile, and Other Basic Information
- Fundamental Perspectives (Updated)
(1) Fundamental Perspectives on Corporate Governance
SuMi TRUST Group has established and posted on its website a “Basic Policy on
Corporate Governance,” a set of corporate governance guidelines aiming to contribute to
sustainable growth and medium- to long-term enhancement of the corporate value of the
Group.
https://www.smtg.jp/english/-
/media/tg/english/about_us/management/governance/policy.pdf
(i) In order to adhere to the principles of sound management based on a high degree of
self-discipline with the background of fiduciary spirit and establish strong credibility from
society, SuMi TRUST Group commits itself to enhancing its corporate governance system
in line with the following fundamental perspectives:
・ SuMi TRUST Group shall respect shareholder rights, and endeavor to develop an
environment in which shareholders can exercise their rights appropriately and
effectively, and to secure effective equal treatment of shareholders.
・ By recognizing the importance of its social responsibilities and public mission, SuMi
TRUST Group shall endeavor to appropriately cooperate with its stakeholders such as
shareholders, customers, employees, business partners, and local communities, and
to establish corporate culture and climate where it conducts sound business
operations based on a high degree of self-discipline.
・ In order to establish the basis for constructive dialogue with its stakeholders, SuMi
TRUST Group shall separately set out its Disclosure Policy, and endeavor to
appropriately disclose corporate information, including non-financial information, and
ensure the transparency of its corporate management.
・ As a financial holding company with the function of managing the business
administration of the Group, SuMi TRUST Group shall adopt the institutional design of
the Company with Three Committees and, by separating execution and supervision of
business, shall endeavor to ensure the Board of Directors’ role of effective oversight.
・ SuMi TRUST Group shall engage in constructive dialogue with its stakeholders in order
to contribute to sustainable growth and medium- to long-term enhancement of the
corporate value of SuMi TRUST Group.
(ii) SuMi TRUST Group places the “balanced creation of both social value and economic
value” at the core of its management philosophy. By defining the Group’s reason for
existence (“Purpose”) and identifying priority issues (materiality) such as a sustainable
society, financial well-being, fiduciary spirit, and human capital (expertise and diversity),
SuMi TRUST Group dedicates itself to solving social issues and also considers it an
opportunity for growth.
(iii) The Board of Directors sets out the Management Principles (“Mission”), Ideal Model
(“Vision”), and Codes of Conduct (“Value”) as the anchor for all of its activities, which is
shared by all of the officers and employees of the Group.
(2) Role and Function of SuMi TRUST Group in the Group
In the Group, SuMi TRUST Group determines the management policies and business
models of the entire Group and disseminates them to each Group company, while at the
same time, takes responsibility for the following functions, in an effort to fulfill its role of
group management that allows each company to realize the respective management plans
that have been formulated in accordance with such policies.
<<Formulating group management strategy>>
SuMi TRUST Group adjusts the business strategies of Sumitomo Mitsui Trust Bank,
Limited (“SuMi TRUST Bank”) and other subsidiaries and affiliated companies, which it
directly owns (collectively referred to in this report as the “Directly Owned Companies”),
and creates management strategies to maximize the profits of the entire Our Group, as
well as shareholder value.
<<Monitoring administration of business activities>>
While the Directly Owned Companies take responsibility for the operation of their own
business activities, SuMi TRUST Group engages in activities that include (i) monitoring
the Directly Owned Companies’ operation of business activities in order to, among other
things, ensure its consistency with the group strategies and (ii) understanding the
performance of each business activity.
<<Allocating management resources>>
SuMi TRUST Group allocates the Group’s management resources (personnel, expenses,
investment in systems, capital, etc.), and monitors the usage of management resources at
the Directly Owned Companies.
<<Supervising risk management>>
SuMi TRUST Group creates the basic risk management policy for the entire Our Group
and, among other things, monitors the risk management activities of the Directly Owned
Companies.
<<Supervising compliance management>>
SuMi TRUST Group creates the basic policy for Our Group’s corporate ethics and
compliance standards as action guidelines for officers and employees and, among other
things, monitors compliance of the Directly Owned Companies.
<<Managing internal auditing>>
SuMi TRUST Group creates the basic policy on the internal auditing of the entire Our
Group, and engages in activities such as understanding, among other things, the Directly
Owned Companies’ preparedness for internal audits and giving instructions necessary for
the Directly Owned Companies.
【Reasons for not implementing each principle of the Corporate Governance Code】
(Updated)
SuMi TRUST Group implements every principle of the Corporate Governance Code revised
on July 21, 2026.
【Disclosure based on each principle of the Corporate Governance Code】(Updated)
[Principle 1-1]
<Policy Regarding Structural Development and Efforts to Promote Constructive Dialogue
with Shareholders>
SuMi TRUST Group has established the Policy for Constructive Dialogue with
Shareholders, etc. as provided in Article 24 (Policy for Constructive Dialogue with
Shareholders, etc.) of the “Basic Policy on Corporate Governance”:
・ SuMi TRUST Group shall emphasize constructive dialogue with its shareholders, etc.,
and shall endeavor to engage in dialogue with its shareholders, etc. through various
opportunities under the initiative of its senior management.
We report opinions and concerns from shareholders, investors, analysts, and others at
least once every six months to the Board of Directors and the Executive Committee, and
use them to enhance our corporate value.
When engaging in dialogue with shareholders, the President and Executive Officer (CEO),
Managing Executive Officer (CFO), and the general managers of the IR and SR department
mainly conduct these engagements, explaining and exchanging views on our governance,
sustainability, and strategies including shareholder voting rights. In addition, we hold
events such as IR Day about once a year as opportunities for dialogue between outside
directors and institutional investors.
The Group regularly ensures that we have a thoroughgoing awareness of the laws and
regulations to be complied with, as well as the handling of insider information. Based on
fair disclosure rules, we conduct strict management and operation in dialogue with
shareholders and investors.
In addition, to discuss important matters related to the appropriateness of disclosure
content, we established the Corporate Communication Council and formulated a
disclosure policy to conduct appropriate disclosures in accordance with that policy.
https://www.smtg.jp/english/disclosurepolicy
<Engaging in dialogue with shareholders>
For information about how we engage in dialogue with shareholders, please refer to our
Integrated Report and Presentation Material for Investor Meeting on Financial Results,
which will be posted on our website.
Integrated Report:
https://www.smtg.jp/english/investors/report/disclosure
Presentation Material for Investor Meeting on Financial Results:
https://www.smtg.jp/english/investors/report/fs
[Principle 1-4]
<Policies Regarding Strategic Shareholdings>
・ Our Group sets out “creating a virtuous circle from increased enterprise value leading
to increase in household savings, assets and capital” as one of its Visions.
・ To achieve this, the Group is further refining its characteristics as a trust group that
stands both as an investor and as a provider of solutions to enhance corporate value, and is
shifting to a policy of, in principle, not holding any traditional strategic shareholdings (shares of
business partners held as stable shareholders without the purpose of capital or business alliances).
・ Under this policy, we engage in dialogue with business partners considering their
surrounding environment and stakeholder trends to promote sustained growth in
corporate value and the resolution of issues, and through such dialogue, we seek to
accelerate the reduction of our strategic shareholdings. We had previously targeted a
reduction of ¥260 billion in acquisition cost over four years from FY2025 to FY2028, but
we have now revised this and set the reduction target at ¥300 billion for the same period.
・ Also, during the interim period until the Strategic Shareholdings are reduced, the Board
of Directors shall examine and verify the correlation between the benefits/risks and capital
cost of holding the Strategic Shareholdings.
<Results of Reduction of Strategic Shareholdings>
・ In fiscal year 2025, the Group reduced its Strategic Shareholdings, at cost, by 74.9 billion yen. As
a result, the amounts of Strategic Shareholdings in 91 companies were reduced to zero.
<Examination of Status of Strategic Shareholdings>
・ SuMi TRUST Group carefully observes and examines the relationship between the
benefits/risks and the capital costs of Strategic Shareholdings based on the following
profitability indicators.
• Profitability indicators
(Profit after deduction for credit costs/expenses) ÷ (Equity risk-weighted assets +
credit risk-weighted assets)
・ We continue to examine and verify the correlation between the benefits/risks and capital
cost of holding the Strategic Shareholdings, both overall and on a per-company basis,
based on profitability indicators, while at the same time engaging in dialogue with our
business partners with the aim of increasing their corporate value and solving their
issues, regardless of profitability. In this way, we continue to discuss measures for
reducing our holdings. Based on the status of these discussions, and after carefully
examining the impact of reducing the Strategic Shareholdings on our financial targets,
client base, etc., we are verifying the appropriateness of our targets and actions for
reducing the Strategic Shareholdings, and the Board of Directors confirms these
determinations on a regular basis.
<Standards for Voting on Strategic Shareholdings>
・ SuMi TRUST Group and SuMi TRUST Bank, which is a core subsidiary of SuMi TRUST
Group, shall exercise voting rights in respect of the shares they hold, taking into
consideration the medium- to long-term enhancement of the value of the Group’s
shareholders, depositors, and various other stakeholders, while also aiming to increase
the corporate value of the issuing company of cross-shareholding shares (the “Issuing
Company”) over the medium to long term.
・ These voting rights shall be exercised through adequate dialogue with the Issuing
Company while respecting the unique nature and direction of the Issuing Company’s
management after consideration of the business environment, etc. in which the
Issuing Company operates.
・ When exercising voting rights, the decision to vote for or against each agenda item
shall be made based on the guidelines for the exercise of voting rights prescribed
separately, and also bearing in mind the following perspectives:
(i) The decision shall be based not only on external and formal criteria, but also on the
unique characteristics of the Issuing Company and the industry and business
environment in which the Issuing Company operates.
(ii) The decision shall be made not only for the fiscal year under review, but also on a
longer time span and with a future orientation.
(iii) In addition to the financial figures, non-financial factors (such as corporate
governance and the creation of social value) shall be taken into account in the
decision.
・ In the case that there is a risk of conflicts of interest upon the exercise of the voting
rights, SuMi TRUST Group and SuMi TRUST Bank shall properly deal with the risk
pursuant to the Management Policy Concerning Conflicts of Interest prescribed
separately.
・ The policy on exercising voting rights is published on SuMi TRUST Group’s website:
(Standards for Voting on Cross-Shareholding Shares)
https://www.smtg.jp/english/-/media/th/english/news/2021/E211111-1.pdf
<Policy When Strategic Shareholders Indicate Their Intention to Sell, Etc. Their Shares>
When strategic shareholders indicate their intention to sell, etc. their shares, SuMi TRUST
Group shall not hinder their selling, etc. by, for instance, implying a possible reduction of
business transactions.
[Principle 2-2]
<Approach to Ensuring Diversity, Human Resources Development Policy, and Internal
Environment Improvement Policy>
We add value to the organization by making full use of the diversity and creativity of each
person and provide a workplace where employees can find dreams and purpose in their
work. We also form pools of employees and encourage their active participation so they
can leverage their advanced expertise and comprehensive capabilities to deliver total
solutions to clients. To support the success of our diverse workforce, we have established
the SuMi TRUST Group Human Resources Development Policy and are committed to
improving workplace environments and strengthening human resources.
In addition, the Diversity, Equity & Inclusion Office (hereinafter, DE&I Office) has been
established at SuMi TRUST Group and SuMi TRUST Bank. The Group promotes DE&I
throughout by continuously exchanging information and holding discussions among
companies within the Group.
For specific details on the Policy and our efforts to implement it, please refer to SuMi
TRUST Group’s website and Integrated Report and to “Others” in “3. Measures for
Respecting the Position of Stakeholders” in Part III of this report.
Human Capital:
https://www.smtg.jp/english/about_us/management/human_resources
Human Resources Development Policy:
https://www.smtg.jp/english/about_us/management/human_resources#anc-02
Integrated Report:
https://www.smtg.jp/english/investors/report/disclosure
<Status of Ensuring Diversity>
Our core subsidiary, SuMi TRUST Bank, is implementing the following initiatives.
• Formulation of a general business owner action plan commitment based on the Act on
Promotion of Women’s Participation and Advancement in the Workplace. It calls for more than
26% women at the rank of section manager or higher (currently 23.8% as of March 31, 2026)
and more than 34% in charge of management operations (currently 36.1% as of March 31,
2026) by March 31, 2028. As of April 1, 2026, three female outside directors, one female director,
and six female executive officers were appointed. At SuMi TRUST Group too, as of April 1,
2026, two female outside directors, one female director, three female executives, and one
female executive officer were appointed.
• Formulation of pipeline models to facilitate the planned nurturing of employees in each
business and measures with a view to the future appointment of female employees to
management positions, including training aimed at facilitating self-determined career
planning. Also, since 2021, an executive support system has been implemented whereby
executives themselves proactively engage with female management and support the
acquisition of broad-ranging knowledge, perspectives, and networks over the course of one year
or so.
• Acquisition of Platinum Kurumin Certification in 2019 under the Act on Advancement of
Measures to Support Raising Next-Generation Children. Promotion of initiatives aimed at
realizing diverse and flexible workstyles.
• In line with the Company’s human rights policy, prohibition of discrimination and human
rights violations based on race, nationality, gender, sexual orientation and gender identity,
origin, social status, beliefs, religion, disability, physical characteristics, and other grounds.
• To ensure diversity, active recruitment of mid-career hires, including personnel from different
industries. As of the end of March 2026, the ratio of career hires is approximately 20%, and
the ratio of career hires in positions at the section manager level and above is approximately
23%.
• With respect to non-Japanese nationals, our core subsidiary SuMi TRUST Bank has
a total of approximately 98 local staff working in Japan and approximately 847 local
staff members working at its overseas offices (as of March 31, 2026).
Going forward, SuMi TRUST Bank will continue to improve workplace environments,
appoint personnel, and implement training based on its Basic Policy for Personnel Affairs
Management to promote the success of its diverse workforce.
[Principle 2-4]
<Demonstration of Functions as Asset Owners of Corporate Pension Funds>
In February 2016, the SuMi TRUST Bank Pension Fund announced its policy to accept
Japan’s Stewardship Code. Accordingly, the SuMi TRUST Bank Pension Fund dispatches
experienced corporate pension managers from the Group as Pension Management
Directors to fulfill its role as an asset owner of corporate pension funds to support
stewardship activities. In October 2018, the SuMi TRUST Bank Pension Fund set up its
website to provide information to beneficiaries (participants and qualified recipients). The
information includes reports on relevant activities such as monitoring investment
performance at each management institution.
Regarding the management of conflicts of interest which have possibly occurred between
beneficiaries of corporate pension and companies, the SuMi TRUST Bank Pension Fund
works to ensure that the interests of the beneficiaries are maximized in accordance with
the Basic Management Policy, which has been set forth based on the guidelines of the
Ministry of Health, Labour and Welfare. In specific terms, the SuMi TRUST Bank Pension
Fund enhances the value of pension assets through the selection and monitoring of
management institutions (including stewardship activities such as the exercise of voting
rights). Furthermore, a system is in place in which the Asset Management Committee,
which comprises investment professionals, and the Board of Representatives, the majority
of which comprises representatives of the beneficiaries, examine, as necessary, whether
the management is being made in accordance with the Basic Management Policy and
whether there are any Conflict of Interest of interest.
[Principle 3-1]
<Management Principles and Medium-Term Management Plan>
・The Group has established the Group’s management principles and posted them on its
website.
https://www.smtg.jp/english/about_us/philosophy/index.html
・In our Medium-Term Management Plan, we have formulated strategies for the three-year
period from FY2026 to FY2028 based on the concept of "Shaping the Future through Bold
Challenges".
https://www.smtg.jp/english/-/media/tg/english/news2/2026/E260514-1.pdf
・SuMi TRUST Group publishes and posts on its website the Integrated Report every year,
which covers in detail initiatives towards reforms of corporate governance, initiatives
towards the enhancement of fiduciary duties and sustainability initiatives, in addition to
the medium- to long-term management strategies of SuMi TRUST Group.
https://www.smtg.jp/english/investors/report/disclosure
<Fundamental Perspectives and Basic Policy on Corporate Governance>
・ The fundamental perspectives and basic policy, etc. on corporate governance are given
in I. 1. (1) Fundamental Perspectives on Corporate Governance of this report for your
reference.
<Policy and Procedure for Deciding Compensation of Directors, and Other>
The compensation of officers shall be determined by the Compensation Committee upon
examination of its appropriateness, etc. Details of the policies and procedures relating to
the determination of the compensation of officers, including directors and executive
officers (*1), by the Compensation Committee are given in II. 1. <Directors’ and Executive
Officers’ (*1) Compensation> (Appendix 2), and an outline of the Compensation Committee
is given in “II. 2. Items Related to Business Execution, Audit and Oversight, Nominations
and Setting of Compensation, etc. (Overview of Corporate Governance Framework)” of this
report, respectively, for your reference.
(*1) Executive Officer as defined in the Companies Act (the same shall apply hereafter).
<Policies and Procedures Regarding Nomination and Dismissal of Candidates for Directors
and Executive Officers (*1), and Reasons for Appointment of Senior Management>
・ SuMi TRUST Group shall decide candidates for directors and executive officers (*1)
from among a wide range of diversified individuals at the Nominating Committee
pursuant to the nomination policies and procedures set forth in Article 10 (Policies
Regarding Nomination and Dismissal of Directors and Executive Officers (*1)) of the
“Basic Policy on Corporate Governance.”
Also, SuMi TRUST Group shall deliberate dismissal of directors and executive officers
(*1) pursuant to the dismissal policies set forth in Article 10.
For the reasons for appointment of directors and executive officers (*1), please refer to
Appendix 1 attached to this report.
(The details concerning outside directors are given in II. 1. < Matters relating to
outside directors > of this report for your reference.)
[Principle 4-1]
<Major direction of corporate strategy>
• In formulating the new Medium-Term Management Plan (FY2026 to FY2028), the Board of
Directors kicked off discussions from the viewpoint of what kind of presence the Group wants
to be in society and with respect to the capital markets as SuMi TRUST Vision for 2035.
Through in-depth debates, including off-site meetings, it was confirmed that the Group seeks
to be “A leading company addressing social challenges through business” but also generates
sustained economic growth. The Board also confirmed the aspiration to achieve scale with
market presence. To realize this, the goals of achieving net business profit before credit costs
of ¥1 trillion and ROE of 12% were shared as part of the announcement of the new Medium-
Term Management Plan.
• In the Medium-Term Management Plan, we set three key themes—“A Trust-based Business
Model Centered on Asset Management”, “Capital Strategy”, and “Enhancement of the
Management Foundation”—to holistically pursue growth unique to a trust group, along with
capital allocation and the advancement of the management foundation.
[Principle 4-2]
<Verification of Appropriateness of the Allocation of Management Resources>
The Board of Directors monitors the progress of the Medium-Term Management Plan and
deliberates on themes such as the medium- to long-term business portfolio, asset
management business strategy, and allocation of management resources.
To contribute to our sustained growth and the enhancement of corporate value over the
medium to long term, we will continue to engage in discussions and supervise the
appropriateness of strategic directions, capital allocation, and risk-taking.
[Principle 4-3]
<Succession Planning for the CEO and Other Top Executives>
SuMi TRUST Group has clarified the quality and capabilities as well as personalities
required as executive of SuMi TRUST Group, SuMi TRUST Bank and Sumitomo Mitsui
Trust Asset Management Co., Ltd. (“SuMi TRUST AM”) as part of its succession planning.
After deliberation at the Nominating Committee, SuMi TRUST Group has also formulated
and is operating a “Plan to Foster Human Resource as Potential Executives,” which
prescribes various training programs and forums for fostering human resources as
potential executives and processes for managerial promotion.
The Board of Directors will continue to regularly review the progress of the succession
plan and the management team succession plan and appropriately oversee such matters.
<Management System of Related Party Transactions>
SuMi TRUST Group sets out in Article 20 (Management System of Related Party
Transactions) of the “Basic Policy on Corporate Governance” that when the Group engages
in transactions with its officers or major shareholders, etc., the transactions shall be
referred to the Board of Directors for prior approval, in order to ensure that such
transactions do not harm, among other interests, the interests of the Group or the
common interests of its shareholders, except where the trading terms are obviously
equivalent to those of general transactions. In addition, SuMi TRUST Group separately
prescribes, and discloses an outline of, the Management Policy Concerning Conflicts of
Interest pursuant to laws, etc. in order to ensure that the interests of its customers are
not unfairly harmed, and appropriately manages transactions that may give rise to a
conflict of interest pursuant to this policy.
[Supplementary Principle 4-5]
<Formulation of Sustainability Policy, etc.>
We position our approach to sustainability as one important management issue for
medium- to long-term growth in corporate value and the realization of sustained business
growth. The Board of Directors has established a Basic Policy on Social Responsibility
(Sustainability Policy) for SuMi TRUST Group, and will continue to deepen discussions on
priority issues (materiality) that have an important impact on balancing social value
creation and economic value creation, as well as the framework of management.
<Addressing Sustainability Issues>
In light of the Group’s approach to balancing the creation of both social and economic
value, and taking into account changes in economic and social circumstances, the
requests of stakeholders, and the opinions of outside directors and external experts, the
Group has identified priority issues (materiality) likely to impact the value creation
process over the medium-to-long term. Since first identifying items of materiality in
FY2015, we have continuously reviewed them based on changes in the management
environment. In the FY2025 revision, we identified the following four key issues that we
should prioritize based on our purpose and taking into account changes in social
structures and expectations from stakeholders: (1) sustainable society; (2) financial well-
being; (3) fiduciary spirit; and (4) human capital (expertise and diversity).
In terms of our framework for addressing sustainability, as part of the restructuring of our
executive meeting bodies in April 2023, we established a Sustainability Committee. In
FY2026, we renamed the Sustainability Committee the Sustainability Council. This
council discusses initiatives related to sustainability and reports important matters to the
Executive Committee and other committees.
On individual issues related to sustainability, for climate change, the Sustainability
Management Department serves as the department overseeing the Group’s response to
climate change, collaborating with each business and affiliated company to implement
various initiatives. Since our carbon neutrality declaration* in 2021, we have been
promoting various measures and working to strengthen risk management and information
disclosure related to climate change. The Sustainability Council, the Executive
Committee, and the Board of Directors and its advisory body, the Risk Committee,
periodically deliberate on these issues.
Also, in response to the growing importance of addressing social (human rights) issues as
a financial institution, we revised our human rights policy in February 2023. Since
FY2023 we have employed an environmental and social risk framework to function as the
Group’s human rights due diligence system and we have conducted assessments of SuMi
TRUST Bank’s business partners in Japan, its suppliers, and contractors.
Through these measures, we aim to strengthen our response to social and environmental
issues at the operational level and position them as management challenges for creating
shared value with society. We will engage in multi-faceted discussions at the board level
regarding the most important topics, and work towards the long-term enhancement of the
Group’s corporate value.
*We released the SuMi TRUST Group Carbon Neutral Declaration as part of our efforts to
help bring about a decarbonized society.
https://www.smtg.jp/english/-/media/tg/english/news/2021/E211020.pdf
[Principle 4-10]
<Policy on Efforts to Appoint Independent Outside directors>
SuMi TRUST Group sets out in Article 9 (Composition of the Board of Directors) of the
“Basic Policy on Corporate Governance” that in light of the importance of outside
directors’ functions in the corporate governance, SuMi TRUST Group shall operate the
Board of Directors with a majority of directors being independent outside directors, in
principle.
As of the date of submission, we have reduced the size of the Board. Eight of the 13
directors are independent outside directors, which, at 61%, constitutes a majority.
Also, in order to ensure the effectiveness of its corporate governance system and further
enhance the soundness and reliability of the business model and the transparency of
management of the Group, SuMi TRUST Group, pursuant to Article 14 (Establishment of
Committees) of the “Basic Policy on Corporate Governance,” shall establish a Risk
Committee and a Conflict of Interest Committee, in which independent outside directors
or external experts shall participate, as advisory bodies to the Board of Directors, in
addition to the Nominating Committee, the Compensation Committee and the Audit
Committee, which are required to be established under the Companies Act. Since June
2025, the Nominating Committee and the Compensation Committee have been composed
solely of independent outside directors, while the majority of the members of the other
committees are external members and chaired by outside directors or external experts.
For details, please refer to “II. 2. Items Related to Business Execution, Audit and
Oversight, Nominations and Setting of Compensation, etc. (Overview of Corporate
Governance Framework)” of this report.
[Principle 4-12]
<Exchange of Information and Shared Awareness Among Independent Outside directors
from an Independent and Objective Standpoint>
Under Article 12 (Outside directors Meeting) of our Basic Policy on Corporate Governance,
we have established an informal meeting body comprised solely of independent outside
directors. The purpose of this is to facilitate information exchange and a shared
understanding among independent outside directors, foster a relationship of trust among
them, and strengthen the supervisory function of the Board of Directors. In principle, this
meeting is held at least once a year, during which discussions take place regarding
management issues, the administration of the Board of Directors, and our governance
structure. If needed, appropriate recommendations are made to the chairperson of the
Board and the president. Through open and active discussions among independent
outside directors, we aim to enhance the objectivity and independence of the Board of
Directors.
[Principle 4-13]
<Perspectives on the Balance of Knowledge, Experience, and Capability, Diversity and
Scale of the Board of Directors as a Whole>
The Group’s purpose is to build “Trust for a flourishing future” and, based on the
philosophy of contributing to the national economy by solving social issues, we will create
new value through the power of trusts and help improve the well-being of all stakeholders.
In the new Medium-Term Management Plan announced in May 2026, the Group identified
the following four key management issues (materiality) with the aim of achieving its
purpose under the concept of “Shaping the Future through Bold Challenges” : (1) financial
well-being; (2) sustainable society; (3) fiduciary spirit; and (4) human capital (expertise
and diversity). The Group will work on creating value while realizing a virtuous cycle of
funds, assets, and capital.
Therefore, from the perspective of enabling effective supervision by the Board of Directors,
the Board identifies the skills corresponding to these key issues (materiality), based on
discussions undertaken by the Nominating Committee, and requires these skills of
director candidates.
Furthermore, by appointing experts with high levels of expertise to the statutory
committees and voluntary committees established within the supervisory body, the Group
aims to strengthen supervisory functions while building a diverse and balanced overall
formation, and will work toward the Group’s sustained growth in corporate value.
<Skills Matrix Mapping the Knowledge and Experience of Each Internal and Outside
Director>
The skills matrix which maps the knowledge, experience, etc. of each internal and outside
director is shown in the Reference Documents Concerning the Ordinary General Meeting
of Shareholders of the Convocation Notice of Ordinary General Meeting of Shareholders for
the 15
th
Fiscal Period. We have already appointed multiple outside directors who have
management experience at other companies.
https://www.smtg.jp/english/-/media/tg/english/stock/meeting/E260521-1.pdf
Details on the ideas expressed above are provided in Article 9 (Composition of the Board
of Directors) and Article 10 (Policies Regarding Nomination and Dismissal of Directors and
Executive Officers (*1)) of the “Basic Policy on Corporate Governance.” Accordingly, as of
the day this report was submitted, we have made steady progress on realizing diversity
mainly by appointing one female internal director and three females outside directors
(30.7% female director ratio), an outside director who is also a legal expert, and an outside
director who is an accounting professional.
The board of our core subsidiary SuMi TRUST Bank, and those of Sumitomo Mitsui Trust
Asset Management and Amova Asset Management Co., Ltd., also have a good balance of
directors possessing a wide range of experiences, expertise, and knowledge in various
fields, including corporate management, finance, investment operations, and international
affairs. We therefore strive to ensure the proper functioning of these boards by
incorporating a variety of viewpoints with the participation of women and foreigners.
<Outline of Results of Analysis and Evaluation Concerning the Effectiveness of the Board
of Directors as a Whole>
Every year we conduct an evaluation of the effectiveness of the Board of Directors
(hereinafter, the “Evaluation of the Board of Directors”) in an effort to enhance its
effectiveness by adopting measures aimed at improving issues identified in the evaluation
and by implementing the PDCA cycle.
In FY2025, the evaluation confirmed that the Board of Directors and each committee are
aware of their respective objectives and are endeavoring to invigorate discussions and
enhance supervisory functions. As a result, a certain degree of effectiveness is being
sustained. However, the Board and each committee recognize there to be issues that
ought to be improved and enhanced in order to achieve the Board’s ideal future vision.
[Principle 4-14]
<Invigorate Deliberations at the Board of Directors>
The Board of Directors has established a basic management policy and makes decisions
on the selection of business models and risk-taking through the formulation of
management plans, and supervises the execution of duties by executive officers and
others. To fulfill such a role, the Board of Directors selects management priority issues
and themes from a medium- to long-term perspective, in addition to matters required by
laws and regulations, as the “management theme,” and discusses them. Also, we make
use of off-site meetings, which provide an opportunity for executives and directors to
exchange opinions outside the meetings of the Board of Directors and engage in back-
and-forth discussions, thereby enhancing the substance of deliberations.
Through these initiatives, the Board of Directors utilizes the insights and perspectives of
the outside directors on important themes at the heart of management.
[Principle 4-15]
<Policies on Training and Development of Directors>
SuMi TRUST Group sets out its policies regarding the training of directors as follows in
Article 11 (Provision of Information to Directors) of the “Basic Policy on Corporate
Governance”:
・ The management team shall collect and provide information regarding economic
conditions, industry movement, compliance with laws, corporate governance, finance
& accounting, and any other matters, which is required by directors in order to
perform their roles and functions, and it shall thereby support directors’ execution of
duties.
・ When the outside directors of SuMi TRUST Group assume office, or at other times
deemed appropriate, the management team shall provide them with information about
the Group’s management strategy, management plan, status of various businesses,
operating environment, and management issues, so they can gain a proper
understanding of such matters.
In addition, the “Policy on Training of Directors and Other Officers” was established in
February 2016. SuMi TRUST Group will clarify systematically the training and
orientation sessions as well as other training programs SuMi TRUST Group had
hitherto offered, and report to the Board of Directors on the status of implementation
for training programs. Implementation status for the fiscal year 2025 is as follows.
- Providing opportunities to outside directors to acquire knowledge on business, etc.
・ Each year, business briefings by the managerial departments and the business
supervising departments of main businesses are provided to newly appointed outside
directors, depending on their situation.
・ In addition, for the currently serving outside directors, external lecturers, etc. were
invited to provide business briefings on highly specialized topics and themes that are
of interest to outside directors. Specific topics covered are as follows.
Major topics:
〇 Duty of loyalty of directors
〇 Latest trends regarding cybersecurity
〇 The potential of AI and corporate management
〇 Trends in international affairs and security-related matters
・ Advance briefing on matters to be deliberated by the Board of Directors
・ Attendance at the Group Management Strategy Meeting held at the beginning of the
fiscal year
・ Compliance training (jointly held with internal officers): Participation in training
about US laws, as well as officer compliance training
・ Joining in at the “Officers Hearings,” “General Managers of Overseas Offices
Hearings,” and “Group Affiliated Company President Hearings,” which are held as
interviews with the Audit Committee members and Audit and Supervisory Committee
members
・ Attendance at online seminars for officers (1. Seminar for the Nominating and Compensation
Committees, 2. Seminar for new officers).
・ Private discussions with general managers of overseas offices and CxOs.
- Various training and seminars mainly for internal officers
・ Workshops on highly specialized topics held jointly with outside directors (See 1. Above
for major topics, etc.)
・ Introduction of a training program for newly appointed executive officers that provides
opportunities to acquire and appropriately update necessary knowledge covering eight themes
and 45 items, including corporate governance, crisis management, and human rights.
・ Compliance training programs: Conducting training about US laws and compliance
training programs for officers
・ Workshops for newly appointed managing executive officers: Provided necessary
knowledge and skills for newly appointed managing executive officers based on lectures
by leading external lecturers in the fields of governance and corporate management. In
the last session, each participant gave a presentation assuming he/she became the
president with a focus on what legacy they would leave after stepping down.
・ Training for newly appointed executive officers: Implemented for the purpose of having
officers fully understand what is expected of them so they can change their way of
thinking and transform from branch/ general managers into a management team
(executive officers) capable of achieving overall optimization, future creation, and
innovation
・ Participation in overseas business school programs with the aim of building networks
with global executives, understanding the capabilities of top-level global companies,
enhancing communication skills both domestically and internationally, expressing
personal charisma, and acquiring culture.
・ Human rights and diversity training: The themes are as follows.
・ 〇 Protecting employees from harassment by clients and other third parties
・ 〇 Barrier value: Turning disability into value
・ 〇 Promoting workplace diversity from an LGBTQ perspective
<Measures for realizing management that is conscious of capital costs and the share
price>
Description (Updated) Disclosure of Initiatives (Update)
English Disclosure (Updated) Available
Update Date (Updated) August 27, 2026
・ As of the end of March 2026, the PBR was 0.96x, an improvement from March 2025
due to supportive financial policies and stock market tailwinds.
・ Regarding capital costs, figures based on CAPM (Capital Asset Pricing Model) and PER
are around 6% to 10%. In contrast, in FY2025, ROE rose to 9.5% compared to the
previous fiscal year; however, together with the above-mentioned PBR, it remains
relatively low compared to competitors, and we recognize the continued need to
improve ROE and reduce capital costs.
・ Going forward, we aim to demonstrate steady growth towards achieving an ROTCE of
around 13% and an ROE of 11%, as called for in the Medium-Term Management Plan,
as soon as possible, gain the approval of the market regarding our business model, reduce
capital costs, and subsequently improve PBR.
・ For details on our measures geared towards realizing a style of management that is
mindful of the cost of capital and the share price, please refer to the following
materials.
(FY2025 Full-Year Earnings Presentation Materials)
https://www.smtg.jp/english/-/media/tg/english/investors/presentation/E260520-
1.pdf
- Capital Structure
Percentage of shares held by overseas
investors
30% or more
<Principal shareholders> (Updated)
Name Number of Shares Held Percentage (%)
The Master Trust Bank of Japan, Ltd.
(trust account)
103,221,100 14.78
Custody Bank of Japan, Ltd.
(trust account)
44,546,297 6.37
STATE STREET BANK AND TRUST
COMPANY 505001
30,237,233 4.33
STATE STREET BANK AND TRUST
COMPANY 505103
11,289,080 1.61
JP MORGAN CHASE BANK 385642 10,173,459 1.45
JP MORGAN CHASE BANK 385781 10,128,543 1.45
THE CHASE MANHATTAN BANK, N.A.
LONDONSECS LENDING OMNIBUS
ACCOUNT
9,852,350 1.41
JPMorgan Securities Japan Co., Ltd. 9,845,952 1.41
The Nomura Trust and Banking Co., Ltd.
(Trust Account)
8,879,600 1.27
THE BANK OF NEW YORK MELLON AS
DEPOSITARY BANK FOR DEPOSITARY
RECEIPT HOLDERS
8,818,835 1.26
Controlling shareholders (except parent company)
―
Parent company None
Supplementary Remarks (Updated)
・ Principal shareholders indicated are as of March 31, 2026. The company conducted a
4-for-1 stock split of its common stock, with July 31, 2026, as the record date and
August 1, 2026, as the effective date.
・ Percentages (%) are calculated by deducting own shares, rounded down to two decimal
places.
・ BlackRock Japan Co., Ltd. (BlackRock Japan) filed a change report of the Report of
Large Volume Holding that was made available for public inspection as of March 22,
2024 and reported that BlackRock Japan and 10 others held common shares of SuMi
TRUST Group as of March 15, 2024 as provided below. SuMi TRUST Group, however,
has not been able to confirm the actual holding of shares as of March 31, 2026, and
they are not included in the status of principal shareholders above.
Name of holder of large-volume shares: BlackRock Japan, Co., Ltd. and 10 joint
holders
Number of shares held: 52,075,976 (including the number of shares held by joint
holders)
Percentage of shares held to total shares issued (%) 7.15%
・ A Change Report of Large Volume Holding filed by Nomura Securities Co., Ltd.
available for public inspection as of March 24, 2025, reported that Nomura Asset
Management Co., Ltd. and two others held common shares of SuMi TRUST Group as
of March 14, 2025, as provided below. SuMi TRUST Group, however, has not been able
to confirm the actual holding of shares as of March 31, 2026 and they are not included
in the status of principal shareholders above.
Name of holder of large-volume shares: Nomura Asset Management Co., Ltd.(two
other joint holders, including information on the number of shares held)
Number of shares held: 44,237,164
Percentage of shares held to total shares issued (%): 6.13%
・ Of the shares held by Custody Bank of Japan, Ltd. (trust account), 1,073,823 are
included in the trust assets of the share delivery trust and RS trust for directors and
178,097 are included in the trust assets of the RS trust for employees and are
accounted for as treasury stocks in the consolidated financial statements and the
financial statements of SuMi TRUST Group, but these figures have not been deducted
from the total issued shares.
-
Corporate Profile
Stock exchange listings Tokyo Stock Exchange (Prime Market),
Nagoya Stock Exchange (Premier Market)
Fiscal year end March 31
Industry Banking
(Consolidated) number of employees at last
fiscal year end
1,000 or more
(Consolidated) net sales in the last fiscal
year
1 trillion yen or more
Number of consolidated subsidiaries at
last fiscal year end
More than or equal to 50 and fewer than
100
-
Policies relating to measures for protecting minority shareholders when conducting
transactions, etc. with controlling shareholders
None.
- Other Special Items that could have a Significant Impact on Corporate
Governance(Updated)
None.
II. Organizational Structure for Managerial Decision-Making, Execution, Supervision and
other Corporate Governance System
- Organizational Structure and Operational Management
Type of Organization Company with Three Committees
【Directors】
Number of directors stipulated in Articles
of Incorporation:
14
Directors’ term of office stipulated in
Articles of Incorporation:
1 year
Chairperson of the Board of Directors: Outside Director
Number of directors: 13
【Matters relating to outside directors】
Number of outside directors: 8
Number of outside directors designated as
independent officer:
8
Relationship with SuMi TRUST Group (1) (Updated)
Name Attribute Relationship with SuMi TRUST
Group*
a b c d e f g h i j k
Kaoru Kashima Certified public
accountant
Tomonori Ito From another
company
Hajime Watanabe From another
company
Hirokazu Fujita From another
company
Kazuo Sakakibara Lawyer
Hideki Kobori From another
company
Etsuko Kobayashi From another
company
Satoko Shisai From another
company
- Categories for relationship with SuMi TRUST Group
- “○” when the said individual presently falls or has recently fallen under each of the
following categories; “△” when the said individual fell under each of the following
categories in the past.
*“●” when a close relative of the said individual presently falls or has recently fallen
under each of the following categories; “▲” when a close relative of the said individual
fell under each of the following categories in the past.
a. Person performing an executive role of a listed company or its subsidiary
b. Person performing an executive role or acting as a non-executive director of the parent
company of a listed company
c. Person performing an executive role of a fellow subsidiary company of a listed company
d. Person whose principal client or supplier is a listed company or person performing an
executive role thereof
e. Principal client or supplier of a listed company or person performing an executive role
thereof
f. Consultant, accountant or legal professional who receives a large amount of monetary
consideration or other property from a listed company besides compensation as an
officer
g. Major shareholder of a listed company (person performing an executive role of the said
corporate shareholder if the major shareholder is a legal entity)
h. Person performing an executive role of a client or supplier company of a listed company
(which does not correspond to any of d, e, or f above) (the said individual only)
i. Person performing an executive role of a company, between which and SuMi TRUST
Group outside officers are mutually appointed (the said individual only)
j. Person performing an executive role of a company or organization that receives a
donation from a listed company (the said individual only)
k. Other
Relationship with SuMi TRUST Group (2) (Updated)
Name Committees
-based
Indep-
endent
officer
Supplemental
information on
corresponding
items
Reason for selecting as outside director (and
reason for appointing as independent officer)
Nominating Committee
Compensation Committee
Audit Committee
Kaoru
Kashim
a
○ ○ ○ ○
<Major
concurrent posts>
Certified public
accountant
Outside Director
of NTT, Inc.
External Auditor
of Kirin Holdings
Co., Ltd.
Ms. Kaoru Kashima had been a member of a major
audit firm for many years, and has extensive
knowledge and experience in financial accounting
as a certified public accountant in charge of
auditing operating companies. She also has
extensive knowledge and experience from having
been responsible for management, human
resources, corporate culture, public relations, and
promotion of women's activities as a managing
director and business manager of an audit firm.
She served as an outside director at SuMi TRUST
Bank for two years starting in June 2019 and as
an outside director of SuMi TRUST Group since
June 2021, and during her tenure she has made
comments and provided advice based on her
experience and the like, and as the chair of the
Audit Committee, she has worked diligently to
enhance the effectiveness of audits of overall
business execution, as well as to further improve
the soundness and transparency of management.
In order to make full use of her knowledge and
insight, SuMi TRUST Group has selected her as an
outside director.
Further, although she served until June 2019 as a
senior partner at Ernst & Young ShinNihon LLC,
with which SuMi TRUST Group and the Group
company have conducted transactions, the
average annual amount of such transactions in
the immediately preceding three fiscal years has
been less than one percent of each of the sales of
Ernst & Young ShinNihon LLC and the
consolidated gross profits of SuMi TRUST Group.
Thus, these facts should not affect her
independence.
Name Committees
-based
Indep-
endent
officer
Supplemental
information on
corresponding
items
Reason for selecting as outside director (and
reason for appointing as independent officer)
Nominating Committee
Compensation Committee
Audit Committee
Tomono
ri Ito
○ ○
<Major
concurrent posts>
Professor of the
Institute for
Business and
Finance of
Waseda
University,
Specially
appointed
professor at
Graduate School
of Business
Administration of
Kyoto University
of Advanced
Science,
Outside director
at Mitsui
Sumitomo
Insurance
Company, Limited
Having worked at domestic and international
financial institutions, and holding positions such
as Professor at the School of International
Corporate Strategy of Hitotsubashi University
Business School and Professor at Waseda
University’s Institute for Business and Finance
Research, Tomonori Ito has a wealth of knowledge
and experience in corporate strategy and global
finance. He has served as outside director of our
Company since June 2023, and during his term of
office, he has provided comments and advice
based on his years of experience and the like. In
order to make full use of his knowledge and
insight, SuMi TRUST Group has selected him as
an outside director.
Hajime
Watana
be
○ ○
○
<Major
concurrent posts>
External Audit &
Supervisory
Board Member of
Tokyu
Corporation
Outside director
of Fukoku Mutual
Life Insurance
Company
Outside director
of Mitsubishi
Estate Co., Ltd.
President of the
Japan Economic
Research Institute
As the former representative director and
president of the Development Bank of Japan,
Hajime Watanabe has a wealth of experience in
bank management and policy finance and
extensive knowledge of financial and economic
affairs in Japan and overseas. He has served as
outside director of our Company since June 2023,
and during his term of office, he has provided
comments and advice based on his years of
experience. In order to make full use of his
knowledge and insight, SuMi TRUST Group has
selected him as an outside director.
Further, although he served until June 2022 as
representative director and president of the
Development Bank of Japan and then as an
advisor until June 2023 at that same bank, with
which SuMi TRUST Group and the Group
company have conducted transactions, the
average annual amount of such transactions in
the immediately preceding three fiscal years has
been less than one percent of each of the sales of
Ernst & Young ShinNihon LLC and the
consolidated gross profits of SuMi TRUST Group.
Thus, these facts should not affect his
independence.
Name Committees
-based
Indep-
endent
officer
Supplemental
information on
corresponding
items
Reason for selecting as outside director (and
reason for appointing as independent officer)
Nominating Committee
Compensation Committee
Audit Committee
Hirokaz
u Fujita
○ ○
<Major
concurrent posts>
―
Hirokazu Fujita has held various positions,
including as Executive Officer and General
Manager of the Corporate Accounting Department,
Managing Director, Senior Managing Director, and
Audit & Supervisory Board Member (Full-Time) of
Tokio Marine Holdings, Inc., as well as similar
positions at Tokio Marine & Nichido Fire
Insurance Co., Ltd. He possesses extensive
experience in accounting, risk management, asset
management, and corporate management. He has
served as an outside director of the Company
since June 2024, and during his tenure, he has
made comments and provided advice based on his
experience and the like. In order to make full use
of his knowledge and insight, SuMi TRUST Group
has selected him as an outside director.
Further, although he served until June 2024 as
Audit & Supervisory Board Member (Full-Time) at
Tokio Marine Holdings, with which SuMi TRUST
Group and the Group company have conducted
transactions, the average annual amount of such
transactions in the immediately preceding three
fiscal years has been less than one percent of each
of the sales of Tokio Marine Holdings and the
consolidated gross profits of SuMi TRUST Group.
Thus, these facts should not affect his
independence.
Kazuo
Sakakib
ara
○ ○
<Major
concurrent posts>
Attorney-at-law
Of Counsel of
Anderson Mōri &
Tomotsune
Auditor of Tokyo
Dental College
Outside Director
of Takasago
Thermal
Engineering Co.,
Ltd.
Acting
Chairperson of
the Board of
Governors of
Japan
Broadcasting
Corporation
Kazuo Sakakibara has served as a superintendent
public prosecutor at the High District Public
Prosecutors Office in both Fukuoka and Osaka. He
is therefore a legal expert with experience in
organization management. Also, since June 2023,
he has served as an outside director (Audit and
Supervisory Committee member) for one year at
SuMi TRUST Bank, providing valuable insights
and advice based on his extensive knowledge and
experience as a legal expert. He has served as an
outside director of the Company since June 2024,
and during his tenure, he has made comments
and provided advice based on his experience and
the like. In order to make full use of his knowledge
and insight, SuMi TRUST Group has selected him
as an outside director. Despite not possessing any
direct experience in company management other
than serving as an outside director, owing to the
aforementioned reasons, we believe he can
appropriately execute his duties as an outside
director.
Name Committees
-based
Indep-
endent
officer
Supplemental
information on
corresponding
items
Reason for selecting as outside director (and
reason for appointing as independent officer)
Nominating Committee
Compensation Committee
Audit Committee
Hideki
Kobori
○ ○
○
<Major
concurrent posts>
Director and
Chairman of
Asahi Kasei
Corporation
Outside director
of Nomura
Research
Institute, Ltd.
Outside director
of Seiko Group
Corporation
Outside director
of Japan
Investment
Corporation
Having been involved in management for many
years as a former representative director,
president, and presidential executive officer of
Asahi Kasei Corporation, Mr. Hideki Kobori has
extensive experience in overall corporate
management. In order to make full use of his
knowledge and insight, SuMi TRUST Group has
selected him as an outside director. Further,
although he has served from April 2022 to now as
director and chairman at Asahi Kasei Corporation,
with which SuMi TRUST Group and Group
companies have conducted transactions, the
average annual amount of such transactions in
the immediately preceding three fiscal years has
been less than one percent of each of the sales of
Asahi Kasei Corporation and the consolidated
gross profits of SuMi TRUST Group. Thus, these
facts should not affect his independence.
Etsuko
Kobayas
hi
○ ○
○
<Major
concurrent posts>
Outside director
of Nissay Asset
Management
Corporation
External Audit &
Supervisory
Board member of
Yamaha Motor
Co., Ltd.
As a former representative director, president, and
chairperson of Goldman Sachs Asset Management
Co., Ltd., Ms. Etsuko Kobayashi has extensive
knowledge and experience in overall corporate
management, global finance, and asset
management. She served as an outside director at
SuMi TRUST Bank for one year starting in June
2025 and during her tenure provided comments
and advice based on her experience. In order to
make full use of her knowledge and insight, SuMi
TRUST Group has selected her as an outside
director.
Further, although she served until March 2024 as
representative director and chairperson at
Goldman Sachs Asset Management Co., Ltd., with
which SuMi TRUST Group and Group companies
have conducted transactions, the average annual
amount of such transactions in the immediately
preceding three fiscal years has been less than one
percent of each of the sales of Goldman Sachs
Asset Management and the consolidated gross
profits of SuMi TRUST Group. Thus, these facts
should not affect her independence.
Name Committees
-based
Indep-
endent
officer
Supplemental
information on
corresponding
items
Reason for selecting as outside director (and
reason for appointing as independent officer)
Nominating Committee
Compensation Committee
Audit Committee
Satoko
Shisai
○ ○
○
<Major
concurrent posts>
Outside director
of Mitsubishi
Research
Institute, Inc.
President of
Aishis
Consulting., Inc.
Outside director
of Nippon Yusen
Kabushiki Kaisha
Outside director
of The Nisshin
OilliO Group, Ltd.
Having served as an executive officer of IBM
Japan, Ltd., and executive vice president and head
of the Digital Transformation Unit of Chugai
Pharmaceutical Co., Ltd., Ms. Satoko Shisai
possesses extensive knowledge and experience in
the IT field, a global perspective, and a track
record of involvement in business management. In
order to make full use of her knowledge and
insight, SuMi TRUST Group has selected her as an
outside director.
Further, although she served until April 2019 as
an executive officer at IBM Japan, Ltd. and until
March 2024 as executive officer at Chugai
Pharmaceutical Co., Ltd., with which SuMi TRUST
Group and Group companies have conducted
transactions, the average annual amount of such
transactions in the immediately preceding three
fiscal years has been less than one percent of each
of the sales of both companies and the
consolidated gross profits of SuMi TRUST Group.
Thus, these facts should not affect her
independence. Moreover, SuMi TRUST Bank, a
major subsidiary of SuMi TRUST Group,
outsourced work to Aishis Consulting., Inc., the
company Ms. Shisai is president of, from May
2025 to June 2026 to receive external advice
based on her specialist IT knowledge. However,
she is not an executive officer of SuMi TRUST
Bank, and the average annual transaction amount
between the bank and both Aishis Consulting and
Ms. Shisai in the past three fiscal years was less
than ¥10 million. Considering this amount is
small compared to the minimis standard set by
SuMI TRUST Group’s standards of independence,
there is no issue regarding her independence as a
director. The outsourcing contract was terminated
before her appointment as a director.
【Committees】
Composition and attributes of the chairperson of committees
Nominating
Committee
Compensation
Committee
Audit Committee
Committee members 5 5 5
Full-time members 0 0 1
Internal directors 0 0 1
Outside directors 5 5 4
Chairperson Outside director Outside director Outside director
【Executive officers (*1) 】
Number of executive officers (*1) (Updated) 13
Status of concurrent post (Updated)
Name Representati
on Right
Double as director Double as
employee
Nominating
Committee
Compensation
Committee
Kazuya Oyama
〇 〇
× × ×
Takumi Fujisawa × × × × ×
Riro Sato × × × × ×
Yuki Takada × × × × ×
Chikako Matsumoto ×
〇
× × ×
Masanori Watanabe
〇 〇
× × ×
Naoki Ishibe × × × × ×
Takahiro Yoshida × × × × ×
Hisato Nakano × × × × ×
Junya Ueda × × × × ×
Takahiro Ishige × × × × ×
Kazue Yamazaki × × × × ×
Manatomo Yoneyama × × × × ×
【Audit】
Directors and employees to assist duties of Audit Committee (Updated) Yes
Matters relating to the independence of directors and employees from executive officers
(*1) (Updated)
We have appointed two Audit Dedicated Executive Officers to assist the Audit Committee
in enhancing the effectiveness of our audit activities. Regarding the appointment and
dismissal of the Audit Dedicated Executive Officer, consent shall be obtained after prior
consultation with the Audit Committee.
Also, the Audit Committee Office has been established to assist the Audit Committee’s
duties, and staff of the Audit Committee Office work to assist Audit Committee members
with their duties under the directions and orders of Audit Committee members.
The executive officers (*1) give consideration so that staff of the Audit Committee Office
are not subject to unjust restrictions in conducting work to assist the Audit Committee’s
duties, as well as discussing in advance the personnel affairs and employment terms of
staff of the Audit Committee Office with the Audit Committee.
Status of relationship between the Audit Committee, accounting auditors and the Internal
Audit Department
The Audit Committee periodically receives reporting from and exchanges opinions and
information with the accounting auditors on auditing information, auditing plans, the
status of accounting auditing performed and auditing results, among others, and also
exchange opinions and share information from time to time as needed. In this way, they
monitor and verify whether the accounting auditors have maintained an independent
standpoint and performed audits appropriately. Further, the Internal Audit Department
exchanges opinions and shares information with the accounting auditors periodically as
part of accounting audits and the audits on internal control over financial reporting. In
this way, the Audit Committee, the accounting auditors, and the Internal Audit
Department aim to reinforce cooperation, thereby ensuring effective auditing.
Also, the Internal Audit Department seeks to consult with the Audit Committee in
advance regarding the formulation of internal audit plans to obtain their approval, and
when the Audit Committee issues instructions, the Internal Audit Department carries out
investigations and other tasks in accordance with those instructions. Instructions from
the Audit Committee to carry out an investigation shall take precedence over instructions
from an executive officer or any other person. The Internal Audit Department regularly
reports to the Audit Committee on the implementation and results of internal audits it has
conducted with respect to the Company and its subsidiaries, or as requested by the Audit
Committee.
【Independent officers】
Number of independent officers 8
Matters relating to independent officers
Having established the Independence Standards of Independent Officers, SuMi TRUST
Group has designated all the outside directors who satisfy these standards and with
whom no conflict of interest is likely to arise with general shareholders.
The specific contents of the Independence Standards of Independent Officers of SuMi
TRUST Group are as follows:
“Independence Standards of Independent Officers”
- If none of the following items applies to a candidate, the candidate shall be determined
to have sufficient independence against SuMi TRUST Group.
(1) A person who is or was a person performing an executive role (an executive director,
an executive officer or an employee including a manager) in SuMi TRUST Group or its
affiliated companies.
(*2) Executive Officer as defined in our internal policy (the same shall apply hereafter).
(2) A person to whom SuMi TRUST Group or SuMi TRUST Bank, which is a core
subsidiary of SuMi TRUST Group, is a principal business counterparty. If such person
is a corporation such as a company, a person who is or, within the past three years,
has been performing an executive role (an executive director, an executive officer, a
managing director, or an employee including a manager) in such corporation, its parent
company or its material subsidiaries.
(3) A person who is a principal business counterparty of SuMi TRUST Group or SuMi
TRUST Bank. If such person is a corporation such as a company, a person who is or,
within the past three years, has been performing an executive role (an executive
director, an executive officer, a managing director, or an employee including a manager) in
such corporation, its parent company or its material subsidiaries.
(4) A person who presently is a major shareholder of SuMi TRUST Group (holding 10% or
more of the voting rights). If such person is a corporation such as a company, a person
who is or, within the past three years, has been performing an executive role (an
executive director, an executive officer, a managing director, or an employee including a
manager) in such corporation, its parent company or its material subsidiaries.
(5) A major creditor, etc. who, in fund-raising, is indispensable to SuMi TRUST Group or
SuMi TRUST Bank and is depended on by SuMi TRUST Group or SuMi TRUST Bank to
such an extent that the creditor cannot be substituted. If such person is a corporation
such as a company, a person who is or, within the past three years, has been
performing an executive role (an executive director, an executive officer, a managing
director, or an employee including a manager) in such corporation, its parent company or its
material subsidiaries.
(6) A debtor, etc. who, in fund-raising, depends on SuMi TRUST Bank to such an extent
that SuMi TRUST Bank cannot be substituted. If such person is a corporation such as
a company, a person who is or, within the past three years, has been performing an
executive role (an executive director, an executive officer, a managing director, or an
employee including a manager) in such corporation, its parent company or its material
subsidiaries.
(7) A person who presently is an accounting auditor of SuMi TRUST Group or SuMi TRUST
Bank, or a partner, etc., of such accounting auditor, or a person who has been in
charge of the accounting audit of SuMi TRUST Group or SuMi TRUST Bank as such
partner, etc., within the past three fiscal years.
(8) A person who is or, within the past three years, has been performing an executive role
(an executive director, an executive officer, a managing director, or an employee including a
manager) in the lead managing underwriter of SuMi TRUST Group.
(9) An individual such as a lawyer, certified public accountant, tax accountant, or other
consultant who has received a large amount of money from SuMi TRUST Group or
SuMi TRUST Bank within the past three years.
(10) A person who is or who has been, within the past three years, performing an
executive role (an executive director, an executive officer, a managing director, or an
employee such as a manager) in a law firm, audit corporation, tax accountancy corporation,
consulting firm, or other corporation to whom SuMi TRUST Group or SuMi TRUST Bank is a
principal business counterparty.
(11) A person who receives a large amount of donation money from SuMi TRUST Group or
SuMi TRUST Bank. If such person is a corporation such as a company, a person who
is or, within the past three years, has been performing an executive role (an executive
director, an executive officer, a managing director, or an employee including a manager) in
such corporation, its parent company or its material subsidiaries.
(12) A person who is a director, corporate auditor or executive officer, a managing director, of
a company to which directors are transferred from SuMi TRUST Group or its affiliated
companies, or a person who is a director, corporate auditor or executive officer of such company’s
parent company or material subsidiaries.
(13) A person who is a close relative (a spouse, a relative within the third degree of
kinship, or a cohabiting relative) of any of the persons listed in items (1), (2), (3), (9),
and (10) above.
-
Even if any of the above items applies to such person, SuMi TRUST Group may appoint
as a candidate for its independent officer a person who it believes to be suitable for the
position of SuMi TRUST Group’s independent officer considering such person’s character
and insight, etc., provided that, it publically provides an explanation as to why it believes
such person satisfies the requirements for, and qualifies as, its independent officer.
-
If SuMi TRUST Group’s business counterparty (including a law firm, audit corporation,
tax accountancy corporation, consulting firm, etc.) or the donation money, etc. (including
payment to individuals such as a lawyer, certified public accountant, tax accountant, or
other consultant) satisfies the following criteria for the relevant facts to be regarded as
minor, SuMi TRUST Group shall deem that it does not fall under a “principal business
counterparty” or “large amount of donation money” and omit information concerning
attributes, etc., by determining that the relevant independent officer can be recognized to
be sufficiently independent (including a candidate thereof).
<Business counterparty>
• The amount of payment to the relevant business counterparty (the business
counterparty, and its parent company and material subsidiaries) by SuMi TRUST
Group and SuMi TRUST Bank is less than 2% of the consolidated average annual total
sales of the business counterparty for the past three fiscal years.
• The gross profits of SuMi TRUST Group and its subsidiaries earned with respect to the
counterparty (the business counterparty, and its parent company and material
subsidiaries) is less than 2% of the consolidated gross profits of SuMi TRUST Group.
<Donation money, etc.>
• If the recipient is an individual: the money received from SuMi TRUST Group and its
subsidiaries is less than ¥10 million per year on average over the past three years.
• If the recipient is a corporation: the money received from SuMi TRUST Group and its
subsidiaries is less than the greater amount of either ¥10 million per year, or 30% of
the annual total expenses of the relevant corporation on average over the past three
years.
【Incentives】
Incentives Policies for Directors and
Executive Officers (*1)
Introduce Performance-Based Stock
Compensation System and other systems
Supplementary Remarks on This Item (Updated)
In FY2019, we introduced the share delivery trust, a performance-linked stock
compensation system that uses a trust to grant points each fiscal year and delivers
Company shares equivalent to the accumulated points upon the retirement of directors
and officers, replacing the previous stock compensation-type stock option system. In
FY2023, we switched to the RS Trust system, which grants Company shares with transfer
restrictions each fiscal year and removes the transfer restrictions upon the retirement of
directors and officers. The details are stated in “Disclosure of Decision-Making Policies
Relating to Compensation Amounts and Calculation Methods” under 【Compensation
System of Directors and Executive Officers】. Further, SuMi TRUST Group encourages
them to contribute part of their compensation to the share ownership plan of officers in
order to, among other things, further increase their enthusiasm to improve SuMi TRUST
Group’s share price and business performance
Person Eligible to Receive Stock Options None
Supplementary Remarks on This Item
None
【Compensation of Directors and Executive Officers 】
Disclosure of Compensation of Individual
Directors
Partially disclosed.
Disclosure of Compensation of Individual
Executive Officers (*1)
Partially disclosed.
(Updated)
The following items for fiscal year 2025 (from April 1, 2025 to March 31, 2026) are
detailed in Appendix 2 (<1> Disclosure of Compensation of Individual Directors) attached
to this report.
- Total amounts of compensation, etc. by executive category and by type of
compensation, etc., and the number of recipients
- Consolidated compensation, etc. for individual directors and executive officers
- Targets and results for indicators (KPIs) concerning performance-linked compensation
and the actual payment rate of the compensation of the submitting company
Decision-Making Policies Relating to
Compensation Amounts and Calculation
Methods (Updated)
Yes
Disclosure of Decision-Making Policies Relating to Compensation Amounts and
Calculation Methods
The following items are detailed in Appendix 2 (<2> Disclosure of Decision-Making Policies
Relating to Compensation Amounts and Calculation Methods) attached to this report.
-
Decision-making policies, etc. relating to the compensation amounts for Directors and Executive
Officers, and its calculation methods
(1) Policy on decisions on the amounts of compensation for individual directors and
executive officers, and its calculation method
(2) Overview of the compensation system
(3) Compensation Weighting by Types
(4) Indicators (KPIs) relating to performance-linked compensation, reasons for selection of
the indicators, and method for determining amounts to be paid
(5) Method for determining the content of individual compensation
(6) Other important items
(7) Compensation, etc. for internal directors serving as Audit Committee members
(8) Compensation, etc. for outside directors
(9) Reasons for the Compensation Committee’s determination that the details of the
individual compensation, etc. of Directors and Executive Officers for the FY2025 are in
line with their policies on compensation decisions
-
Process for the determination of the amounts of compensation, etc. for officers
(1) Authority of the Compensation Committee
(2) Outline of the procedure, etc. at the Compensation Committee
(3) Activities of the Compensation Committee
<Support System for Outside directors> (Updated)
In order to ensure the effective and smooth operation of the Board of Directors and the
Nomination, Compensation and Audit Committees, SuMi TRUST Group has established
the Corporate Secretariat and the Audit Committee Office as dedicated organizations and
strengthened the supporting systems to fulfill the functions of the outside directors.
In order to support the outside directors in fulfilling his duties as chairperson of the
Board of Directors, SuMi TRUST Group provides various information mainly on matters
scheduled to be deliberated by the Board of Directors, and gives support such as in
summarizing issues from management and supervisory perspectives.
<Status of persons retired from Representative Director and President, etc.> (Updated)
Names, etc. of advisors, etc. who have formerly served as Representative Director and
President, etc.
Name Title/Position Activity
Description
Working
Arrangement/Cond
itions (Full-
time/Part-time,
With/Without
Compensation,
etc.)
Date of
Retirement
as
President,
etc.
Term
Kiichiro
Furusawa
Senior
Corporate
Advisor, SuMi
TRUST Bank
Interactions
with various
external
organization
s, etc.
Part-time, without
compensation
June 27,
2010
1 year
Hitoshi
Murakami
Senior
Corporate
Advisor, SuMi
TRUST Bank
Interactions
with various
external
organization
s, etc.
Part-time, without
compensation
June 29,
2005
1 year
Atsushi
Takahashi
Senior
Corporate
Interactions
with various
external
Part-time, without
compensation
March 31,
2011
1 year
Name Title/Position Activity
Description
Working
Arrangement/Cond
itions (Full-
time/Part-time,
With/Without
Compensation,
etc.)
Date of
Retirement
as
President,
etc.
Term
Advisor, SuMi
TRUST Bank
organization
s, etc.
Kunitaro
Kitamura
Senior
Corporate
Advisor, SuMi
TRUST Bank
Interactions
with various
external
organization
s, etc.
Part-time, without
compensation
March 31,
2021
1 year
Hitoshi
Tsunekage
Senior
Corporate
Advisor, SuMi
TRUST Bank
Interactions
with various
external
organization
s, etc.
Full-time, with
compensation
March 31,
2021
2
mont
hs
Tetsuo
Ohkubo
Senior
Corporate
Advisor, SuMi
TRUST Bank
Interactions
with various
external
organization
s, etc.
Full-time, with
compensation
March 31,
2026
1 year
Masaru
Hashimoto
Senior
Corporate
Advisor, SuMi
TRUST Bank
Interactions
with various
external
organization
s, etc.
Full-time, with
compensation
March 31,
2026
1 year
Total number of advisors, etc. who have
formerly served as Representative Director
and President, etc. (Updated)
7
<Other Matters>
- SuMi TRUST Group does not have an advisory/advisor system.
- SuMi TRUST Bank, the core subsidiary of the Group, has an advisor system, and the
names, etc. are as stated in the above table. SuMi TRUST Bank does not have an advisory
system.
・ Names of former Presidents and Chairpersons of SuMi TRUST Group and SuMi TRUST
Bank, the core subsidiary of the Group, who have been appointed as advisors of SuMi
TRUST Bank, etc. are stated and former Presidents and Chairpersons of The Sumitomo
Trust and Banking Co., Ltd. and The Chuo Mitsui Trust and Banking Company,
Limited prior to the merger are included.
・ The date of resignation from the position of President, etc. indicates the latest date of
resignation from the position of President or Chairperson of either of the companies.
・ The final term of office is a maximum six years, as a general rule, provided, however,
that the person has not reached the age of 72. Such persons are given the official title
of senior corporate advisor and elected each year by approval of the President of SuMi
TRUST Bank. After the end of the term of office as advisor, such persons may conclude
a part-time engagement contract and be allowed to use the title of senior corporate
advisor. Also in such cases, such persons are elected each year by approval of the
President of SuMi TRUST Bank.
・ Compensation is determined by taking into consideration work attitude and other
factors. The total compensation of the above advisors is 90 million yen per year. Senior
corporate advisors are not paid compensation, as a general rule.
・ Offices are provided outside of the Head Office building of SuMi TRUST Bank, and
company cars and shared secretaries are also provided, as necessary.
・ Advisors are not involved, in any way, in management’s decision-making and do not
receive regular reports from management.
・ The advisor system of SuMi TRUST Bank was deliberated and the details of the system
underwent reviews by the Nomination Committee of SuMi TRUST Group. SuMi TRUST
Group has continued to operate the advisor system with the involvement of the
Nominating Committee. In addition to yearly report about operating situation, future
changes in advisor system shall be deliberated at the Nominating Committee.
- Items Related to Business Execution, Audit and Oversight, Nominations and Setting of
Compensation, etc. (Overview of Corporate Governance Framework) (Updated)
<Supervisory body>
(1) The Board of Directors
A. Chairperson: Hideki Kobori (Outside director)
B. Composition
a) The Board of Directors at SuMi TRUST Group requires enough directors considered
necessary and appropriate for the Board to demonstrate an effective supervisory
function as required of a financial holding company tasked with the corporate
management of the Group. The number of directors shall be no more than 14, as
stipulated in the Articles of Incorporation, with due consideration also given to
ensuring diversity and expertise among directors.
b) In light of the importance of outside directors’ functions in corporate governance, SuMi
TRUST Group shall operate the Board of Directors with the majority of directors being
independent outside directors, in principle. As of the submission date, the Board of
Directors has been downsized, with eight out of 13 members being independent
outside directors(for a ratio of 61%), constituting a majority.
C. Roles and powers
a) As a leading and exemplary company in corporate governance, the Board of Directors shall aim
to achieve the Company’s Purpose while ensuring fiduciary responsibility and responding to the
trust of all stakeholders, and contribute to improvements in well-being for all stakeholders to
ensure sustainability and growth as a corporation, mainly by making decisions on, and
supervising the execution of, basic management policies, including medium- to long-term
management strategies and policies related to internal controls.
b) For the purpose of realizing dynamic corporate management and stronger supervision
of executive officers, the Board of Directors shall, in principle, delegate decisions on
the execution of business to executive officers, except for matters which are required
by law to be decided on by the Board of Directors, and shall supervise the execution of
business by executive officers.
D. Liability limitation agreements with outside directors
In accordance with Article 427, Paragraph 1 of the Companies Act, the Company has
entered into agreements with the outside directors regarding liability for damages
incurred due to negligence in their duties as stipulated in Article 423, Paragraph 1 of the
Companies Act. These agreements limit the liability to the minimum amount prescribed
under Article 425, Paragraph 1 of the Companies Act, provided that the directors have
acted in good faith and without gross negligence in the performance of their duties.
E. Status of Activities
In fiscal year 2025, 15 meetings of the Board of Directors were held. An agenda for further
deliberation and the annual schedule were formulated based on discussions at the initial
meeting, which were followed up in the course of the year. Specifically, the Board engaged
in discussions aimed at steadily enhancing its effectiveness through initiatives to improve
accountability, including opportunities for dialogue with a wide range of stakeholders
about the future vision of the Board of Directors, in-depth back-and-forth discussions
with executives during the Medium-Term Management Plan formulation process, and
stable operation of the Board of Directors and statutory committees, which are mainly
composed of outside directors.
The status of attendance of each director is as follows:
Isao Matsushita attended 15 times/15 times (100%)*
2
Toru Takakura attended 15 times/15 times (100%)
Tetsuo Ohkubo attended 15 times/15 times (100%)*
2
Masakatsu Sato attended 11/11 times (100%)*
1,2
Chikako Matsumoto attended 11/11 times (100%)*
1
Kouichi Kato attended 15 times/15 times (100%)
Hiroko Kawamoto attended 15 times/15 times (100%)*
2
Nobuaki Kato attended 15 times/15 times (100%)*
2
Kaoru Kashima attended 15 times/15 times (100%)
Tomonori Ito attended 15 times/15 times (100%)
Hajime Watanabe attended 15 times/15 times (100%)
Hirokazu Fujita attended 15 times/15 times (100%)*
1
Kazuo Sakakibara attended 15 times/15 times (100%)*
1
Notes:
- Masakatsu Sato and Chikako Matsumoto were appointed as directors on June 20, 2025.
- Isao Matsushita, Tetsuo Ohkubo, Masakatsu Sato, Hiroko Kawamoto, and Nobuaki Kato
resigned as directors on June 19, 2026. On the same day, Kazuya Oyama, Masanori Watanabe,
Hideki Kobori, Etsuko Kobayashi, and Satoko Shisai were appointed as directors. Also, Isao
Matsushita resigned as chairperson of the Board of Directors, and Hideki Kobori assumed the
position of chairperson on the same date. Hideki Kobori, Etsuko Kobayashi, and Satoko Shisai are
outside directors.
(2) Outline of Committees
<Statutory committees>
A. Nominating Committee
a) Chairperson: Hajime Watanabe (outside director)
b) Composition: 5 external
c) Authority, Roles and Responsibility
・The Nominating Committee shall determine the content of proposals regarding the
election and dismissal of directors to be submitted to a shareholders meeting.
・The Nominating Committee shall receive requests for consultation on the election and
dismissal of executive officers including President from the Board of Directors, and shall
deliberate and make reports on these.
・The Nominating Committee shall receive requests for consultation on the election and
dismissal of directors including the President (Representative Director) of SuMi TRUST
Bank, and consultation on the election and dismissal of directors of SuMi TRUST AM, and
shall deliberate and make reports on these.
・The Nominating Committee shall receive requests for consultation on revisions to the
succession plan of management, and shall deliberate and make reports on these.
d) Status of Activities
In fiscal year 2025, the Nominating Committee held 20 meetings to engage in activities
stated under “Authority, Roles and Responsibility” above, including an examination of the
succession plan, the implementation of a presidential transition, and deliberation on
enhancing the governance structure.
The status of attendance of each committee member is as follows:
Isao Matsushita attended 20 times/20 times (100%)*
1
Hiroko Kawamoto attended 20 times/20 times (100%)*
1
Nobuaki Kato attended 20 times/20 times (100%)*
1
Hajime Watanabe attended 20 times/20 times (100%)
Kaoru Kashima attended 20 times/20 times (100%)
Notes:
- Isao Matsushita, Hiroko Kawamato and Nobuaki Kato resigned as members of the Nominating
Committee on June 19, 2026. On the same day, Hideki Kobori, Etsuko Kobayashi, and Satoko
Shisai were appointed as members of the Nominating Committee. Also, Isao Matsushita
resigned as chairperson of the Nominating Committee, and Hajime Watanabe assumed the
position of chairperson on the same date. Hideki Kobori, Etsuko Kobayashi, and Satoko Shisai
are outside directors.
B. Compensation Committee
a) Chairperson: Etsuko Kobayashi (outside director)
b) Composition: 5 external
c) Authority, Roles and Responsibility
・The Compensation Committee shall prescribe policy on decisions on the content of
remuneration for individual executive officers (1) and directors.
・The Compensation Committee shall decide the content of remuneration for individual
executive officers and directors in accordance with the policy stated in item above.
・The Compensation Committee shall receive requests for consultation on policy on
decisions on the content of remuneration for directors, etc., from the Board of Directors of
SuMi TRUST Bank and SuMi TRUST AM, and shall deliberate and make reports on these.
d) Status of Activities
In FY2025, the Compensation Committee held 14 meetings to engage in activities stated
under “Authority, Roles and Responsibility” above, and in addition, engaged in repeated
discussions on whether the current compensation system for directors and executive
officers is still aligned and linked to the KPIs emphasized in the new Medium-Term
Management Plan, and whether the design philosophy reflects the characteristics of trust
services that prioritize long-term relationships of trust with clients. From the perspective
of further strengthening the connection with shareholder value, some partial revisions
were made, including raising the evaluation weighting of relative TSR (total shareholder
return).
The status of attendance of each committee member is as follows:
Hiroko Kawamoto attended 14 times/14 times (100%)
1
Isao Matsushita attended 14 times/14 times (100%)*
1
Nobuaki Kato attended 14 times/14 times (100%)*
1
Hajime Watanabe attended 14 times/14 times (100%)
Kaoru Kashima attended 14 times/14 times (100%)
Notes:
- Hiroko Kawamato, Isao Matsushita, and Nobuaki Kato resigned as members of the
Compensation Committee on June 19, 2026. On the same day, Hideki Kobori, Etsuko Kobayashi,
and Satoko Shisai were appointed as members of the Compensation Committee. Also, Hiroko
Kawamoto resigned as chairperson of the Compensation Committee, and Etsuko Kobayashi
assumed the position of chairperson on the same date. Hideki Kobori, Etsuko Kobayashi, and
Satoko Shisai are outside directors.
C. Audit Committee
a) Chairperson: Kaoru Kashima (outside director)
b) Composition: 4 external, 1 internal
c) Authority, Roles and Responsibility
・The Audit Committee shall audit the execution of duties by executive officers and
directors and shall prepare audit reports.
・The Audit Committee shall determine the content of proposals regarding the election
and dismissal of an accounting auditor, and the refusal to reelect an accounting auditor,
to be submitted to a shareholders meeting.
d) Status of Activities
In fiscal year 2025, the Audit Committee held 17 meetings to engage in activities apart
from those stated under “Authority, Roles and Responsibility” above, including
discussions from various viewpoints such as whether executive officers are making
decisions on and executing business in a fair, adequate, and efficient manner, whether
the Group’s internal control system is appropriately developed and efficiently operated,
and whether the accounting auditor conducts an adequate audit as a professional
through maintaining a fair and unbiased attitude and an independent standpoint.
The status of attendance of each committee member is as follows:
Kaoru Kashima attended 17 times/17 times (100%)
Tomonori Ito attended 17 times/16 times (94%)
Hirokazu Fujita attended 17 times/17 times (100%)
Kazuo Sakakibara attended 17 times/17 times (100%)
Kouichi Kato attended 17 times/17 times (100%)*
1
<Voluntary committees, etc.>
D. Risk Committee
a) Chairperson: Kenji Fujii (external expert)
b) Composition: 3 external (1 outside director, 2 external experts), 2 internal
c) Purpose, Roles and Responsibility
The Risk Committee shall receive requests for consultation on the following items from the
Board of Directors, and shall review the appropriateness, etc. of them, and shall make
reports.
・ Recommendations on risks for the formulation of the Medium-Term Management Plan
(forward-looking recommendations);
・ Recommendations from the perspective of materiality management and
strengthening risk management; and
・ Other matters to be deemed necessary by the Board of Directors.
d) Status of Activities
In FY2025, the Risk Committee held 7 meetings to engage in activities stated under
“Purpose, Roles and Responsibility” above, and in addition, engaged in wide-ranging
discussions on the appropriateness of the Group’s risk management framework,
strengthening operational resilience on the assumption of advances in new technologies
such as AI, enhancing the risk appetite framework, fostering a risk-conscious culture,
advancing the US governance system, and matters related to FD. In addition, the
committee freely discussed risks and opportunities taking into account the external
environment, such as new technologies and geopolitical risks.
Attendance of each committee member was as follows:
Kenji Fujii attended 7 times/7 times (100%)
Hajime Watanabe attended 7 times/7 times (100%)*
2
Haruyuki Toyama attended 7 times/7 times (100%)
Takahiro Yoshida attended 6 times/6 times (100%)*
1
Yuki Takada 7 times/7 times (100%)
Notes:
-
CRO (Chief Risk Officer) Takahiro Yoshida resigned as a member of the Risk Committee on
June 20, 2025.
-
Hajime Watanabe resigned as a member of the Risk Committee on June 19, 2026. On the same
day, Etsuko Kobayashi was appointed as a member of the Risk Committee. Etsuko Kobayashi
is outside director.
E. Conflict of Interest Committee
a) Chairperson: Hideki Kanda* (external expert) Outside director of SuMi TRUST Bank
b) Composition: 3 external (1 outside director, 2 external experts), 2 internal
c) Purpose, Roles and Responsibility
The Conflict of Interest Committee shall receive requests for consultation on the following
items from the Board of Directors, and shall review the appropriateness, etc. of them, and
shall make reports.
・ Matters concerning the validity of systems for management of conflicts of interest of
the Group;
・ Matters concerning the effectiveness of management of conflicts of interest,
management of customer explanation, and management of customer support of the
Group and the enhancement of systems for management of these;
・ Matters concerning the policy on fiduciary duty of the Group and the action plans,
etc. of each Our Group company;
・ Particularly important matters concerning dissemination of management of
conflicts of interest and fiduciary duty in the Group; and
・ Other matters to be deemed necessary by the Board of Directors.
d) Status of Activities
In fiscal year 2025, the Conflict of Interest Committee held 6 meetings to engage in
activities stated under “Purpose, Roles and Responsibility” above, and in addition,
conducted discussions on topics such as the best interests of clients as a trust group, the
enhancement of the Group’s conflict of interest management framework, and risk controls
in the trust business (including concurrent services).
The status of attendance of each committee member is as follows:
Hideki Kanda attended 5 times/6 times (83%)
Nobuaki Kato attended 6 times/6 times (100%)
2
Akiko Hosokawa attended 6 times/6 times (100%)
Takahiro Yoshida attended 4 times/4 times (100%)*
1
Yuki Takada attended 6 times/6 times (100%)
Notes:
- CRO (Chief Risk Officer) Takahiro Yoshida was appointed as a member of the Conflict of
Interest Committee on June 20, 2025.
- Nobuaki Kato resigned as a member of the Conflict of Interest Committee on June 19, 2026.
On the same day, Hirokazu Fujita was appointed as a member of the Conflict of Interest
Committee. Hirokazu Fujita is outside director.
F. Outside directors’ Meeting
a) The purpose of this unofficial meeting, attended by only independent outside directors,
is for the exchange of information and sharing of known issues so that relationships of
trust can be built between the independent outside directors and strengthen the
supervisory function of the Board of Directors.
b) In principle, the meeting is held at least once a year so that management issues, the
administration of the Board, and the Company’s governance framework can be discussed.
When necessary, recommendations are made to the chairperson of the Board, the
president, and other executives.
<Executive body>
(3) Executive Committee
Under the Board of Directors, the Executive Committee has been established, which the
President chairs and relevant officers attend. Based on basic policies determined at the
Board of Directors meetings, significant matters relating to business execution are
discussed and determined, and matters resolved at the Board of Directors meeting
undergo preliminary discussion by the Executive Committee.
(4) Committees and Councils
As advisory bodies to the Executive Committee, various committees have been
established, including the CFO Committee, which discusses and decides on matters such
as business management of the Group, financial soundness, and the appropriateness of
operations. In addition, as bodies for discussion on important business operations,
various councils have been established, including the Sustainability Council.
- Reasons for Adopting the Current Corporate Governance System
The Group is a trust group with a broad range of business domains centered around
banking functions, asset management and asset administration functions, and real estate
functions, with strengths in its integrated multi-disciplinary capabilities coupled with
high-level specialist expertise that can promptly offer total solutions on a one-stop basis,
as well as in its outstanding familiarity with business practice. SuMi TRUST Group has
adopted a governance structure in the form of a company with Three Committees, with a
view to promoting the sound Group management that can meet all stakeholders’
expectations, and satisfying both of the requirements for management capability leading
to prompt business execution and supervisory and restraining capabilities that ensure
sound management, based on the aforementioned specialty and strengths.
III. Status of Execution of Measures Concerning Shareholders and Other Interested
Parties
- Measures to Vitalize the General Shareholders’ Meeting and Facilitate the Exercise of
Voting Rights (Updated)
Supplemental remarks
Prompt distribution of
convocation notices for the
general shareholders’
meeting
The convocation notice for the Ordinary General Meeting
of Shareholders and Class Meeting of Common
Shareholders held on June 19, 2026, was dispatched on
May 28, after being posted on SuMi TRUST Group’s
website on May 21, for the purpose of prompt notification.
Setting the date of the
General Meeting of
Shareholders to avoid
overlap
In order to ensure shareholders are provided with
sufficient information, the 2026 Ordinary General Meeting
of Shareholders and Class Meeting of Common
Shareholders was held earlier than usual in June 19 to
avoid overlap with other shareholder meetings held in the
same busy period.
Electronic voting SuMi TRUST Group has been enabling shareholder voting
through the Internet (including PCs, smartphones, mobile
phones, etc.).
Participation in the
Electronic Voting Platform
system and other efforts to
create a better
environment in which
institutional investors can
exercise their voting rights.
SuMi TRUST Group participates in the Electronic Voting
Platform system operated by ICJ, Inc.
Provision of convocation
notice summaries in
English
An English version of the convocation notice summaries
was prepared and posted on SuMi TRUST Group’s website
at the same time as the Japanese version, from one week
before the convocation notice was dispatched, and it has
also been provided through the Electronic Voting Platform,
for greater convenience to overseas
Others In addition to continuing with a system that allows
shareholders to ask questions about agenda items via the
Internet in advance of the General Meeting of
Shareholders, we are conducting a "Hybrid Participation
Virtual Shareholders' Meeting" so that shareholders who
are unable to attend the meeting can view the proceedings
of the meeting via the Internet. In addition, after the
meetings, SuMi TRUST Group posts notices of resolutions,
and the results of voting on its website. Subtitled videos of
matters reported on the day of the general meeting
(including presentations) are also posted.
In addition, we employ the use of “Shareholders’ Passport”
and “Shareholders' Meeting Portal” provided by SuMi
TRUST Bank, enabling the consolidated management of
various notifications (such as shareholder meeting
information, disclosure information, and dividend
information). This allows for a seamless connection from
viewing the notice of the meeting to exercising voting
rights and watching live broadcasts during the
shareholders meeting, thereby enhancing convenience for
shareholders.
- Activities Regarding IR (Updated)
Supplemental remarks Personal
explanation by
representative
Preparation
and
publication
of
disclosure
policy
SuMi TRUST Group has established the Disclosure
Policy and disseminates it externally.
https://www.smtg.jp/english/disclosurepolicy
Regular
information
meetings
for
individual
investors
SuMi TRUST Group holds corporate briefings, online
and in-person, via securities companies and so on,
where the CEO, the CFO, and the general managers
of the IR and SR departments explain the Group’s
characteristics, earnings results and financial
condition, and management strategies, etc. A total of
16 such briefings were held in fiscal 2025 for the
benefit of individual investors. Also, in FY2025,
following the sessions held in Tokyo, we held special
seminars for existing individual shareholders in
Nagoya and Osaka in December 2025 and January
2026.
Yes
Regular
information
meetings
for analysts
and
institutiona
l investors
Twice a year (around May and November), we hold
earnings briefings featuring the CEO and CFO,
where we explain the Group’s financial results,
management strategies, and answer questions. We
hold the sessions in a hybrid format, combining in-
person and online participation, with an average
attendance of just under 100 analysts and
institutional investors.
Also, we hold the SuMi TRUST IR Day as an
opportunity for the CEO and CFO to conduct small
meetings with analysts and institutional investors,
and for business officers in charge to explain
business strategies, as well as for outside directors
to provide explanations about our corporate
governance.
In FY2025, we held six small meetings, a cross-
sectoral IR Day in September featuring the executive
officers in charge of the Retail Business, the
Wholesale Business (Corporate Business), and the
Investor Services Business, and an outside directors
panel discussion in March with multiple outside
directors participating.
Also, we conduct individual and group meetings as
needed with the CEO, CFO, the general managers of
the IR and SR departments, and other managers.
Yes
Supplemental remarks Personal
explanation by
representative
Regular
information
meetings
for overseas
investors
Through conferences hosted by securities firms, the
CEO and CFO hold individual or group face-to-face
meetings with overseas investors visiting Japan. In
FY2025, we participated in five conferences.
The CEO, CFO, and general managers of the IR and
SR departments actively hold meetings with overseas
investors in North America, Europe, and Asia
through online sessions and overseas IR tours (six
times in FY2025).
Yes
Posting of
IR materials
on website
Promptly after their announcement, SuMi TRUST
Group discloses various types of IR information and
information for shareholders, etc. on its website.
The types of information disclosed are, among
others, as follows: financial results and related
explanatory materials; timely disclosure materials
and press releases; annual securities reports
(Japanese only); summary of financial results;
investor meetings’ presentation materials; integrated
reports(disclosure reports); annual reports; IR Day
materials; and convocation notices for general
shareholders’ meetings; results of voting.
Japanese URL: https://www.smtg.jp/investors
English URL: https://www.smtg.jp/english/investors
Establishm
ent of
department
and/or
manager in
charge of IR
Officer in charge of IR and SR: Masanori Watanabe,
Director and Managing Executive Officer (CFO)
Section in charge: IR/SR Department (full-time
employees only)
IR enquiries: [email protected]
- Measures for Respecting the Position of Stakeholders (Updated)
Supplemental remarks
Rules for
respecting the
position of
stakeholders
through internal
regulations, etc.
The “Basic Policy on the Social Responsibility of SuMi TRUST
Group (Sustainability Policy)” sets forth that the Group shall
“respect dialogue with all stakeholders, including clients,
shareholders, investors, employees, business partners, local
communities, NPOs, government authorities and international
institutions, and play an active role in building a sustainable
society.” The Group has announced such policies externally.
Implementation
of environmental
activities,
Sustainability
activities, etc.
The Group has formulated its Sustainability Policy at the Board
of Directors, and has been promoting the Group’s sustainability
activities under the initiative of the Sustainability Management
Department. Especially it places emphasis on the response to
the risks relating to environmental and social issues, the
development of products and services contribute to the
resolution of the issues, and the social activities at each site of
the Group. Regarding our environmental preservation activities,
the Group has formulated the group’s common “Human Rights
Policy,” “Environmental Policy,” “Action Guidelines for Mitigating
Climate Change,” and “Action Guidelines for Preserving
Biodiversity,” and makes available, at its Directly Owned
Subsidiaries, environment-related investment and loan
products, trust products, and real property products, etc. to
individual and corporate customers. Further, the Group has
been promoting activities to reduce greenhouse gas emissions
from its business activities, and purchasing of papers that gives
consideration to the environment and society based on its CSR
procurement policy.
Formulation of
policies on
providing
information to
stakeholders
The “Basic Policy on the Social Responsibility of SuMi TRUST
Group (Sustainability Policy)” sets forth that the Group shall
“build sound and proper relationships with stakeholders, and
fulfill our responsibilities as members of society, engaging in fair
competition and appropriate disclosure of corporate information,
etc.” The Group provides relevant information through its
Sustainability reports and its website, etc. Also, in our annual
securities report, we provide detailed descriptions regarding our
approach to, and initiatives on, sustainability, including climate
change and human capital.
Others [Key initiatives for DE&I promotion]
To create a new business model that integrates a wide array of
functions, we respect various perspectives and aim to maximize
the potential of each individual. Therefore, we have established
a Diversity, Equity & Inclusion Office (DE&I Office) for the
Group and at SuMi TRUST Bank. Our key initiatives focus on
empowering women, promoting understanding about individuals
with disabilities, career hires, global employees, work-life
balance support, human rights, and LGBTQ issues. In this way,
we are committed to promoting DE&I throughout the Group.
SuMi TRUST Bank is promoting the creation of a work
environment where employees can work with peace of mind by
introducing a system for changing work locations and taking
leave during a spouse's transfer, providing regular information
Supplemental remarks
to employees on maternity and parental leave, conducting
seminars to support career development and smooth workplace
reintegration after returning to work, distributing handbooks for
employees on parental leave and management, holding training
for managers, expanding the so-called “company-led childcare
centers” available to employees, and implementing a system that
grants points for household and childcare services to women
who return to work early from maternity or parental leave
starting in April 2024. Also, in our general employer action plan
commitment, we set a KPI to achieve an average of 30 or more
days of childcare leave for male employees and recommend
taking one month of leave. The average number of days of
childcare leave taken by male employees in FY2025 was 29.4
days.
In addition to the above, to promote understanding of diversity
and enable each employee to demonstrate their capabilities to
the maximum extent, the Group is pressing forward with the
following initiatives:
• Implement e-learning programs for all employees to deepen
understanding about diversity;
• Support the active participation of employees with
disabilities in each workplace by increasing the number of
participants in courses for acquiring certification as a
vocational counselor for persons with disabilities, and
implement regular interviews with employees with disabilities
so as to address their concerns and requests after joining the
Group;
• Conduct various types of seminars designed to improve the
business mind, enhance skills and build networks for
employees hired at overseas bases;
• In order to deepen understanding on nursing care, conduct
nursing care seminars on a regular basis, provide
handbooks, set up consultation contact points, and measure
employees’ awareness of nursing care schemes and corporate
culture through annual surveys;
• Revise systems to enable employees to acquire accumulated
time off for the purpose of fertility treatment, and set up
consultation contact points; and
• Establish an in-house consultation contact point as a safety
net and offer congratulatory or condolence leave and a
condolence money system to employees who have a same-sex
partner, in addition to participating in LGBTQ events and
conducting internal training designed to promote
understanding of sexual orientation and gender identity.
• Introduce services providing online seminars and healthcare
support centered on health issues specific to women.
[External evaluations]
The Group received the following certifications and awards from
outside bodies in appreciation of its unfailing effort in the areas
of work style reform and DE&I promotion.
Supplemental remarks
• “Certified Health and Productivity Management Organization
(White 500)” (by the Ministry of Economy, Trade and
Industry and Nippon Kenko Kaigi, from FY2017 through to
FY2025
• J-Win Diversity Award, second prize for Basic Achievement
Award in the basic corporate category (by J-Win/FY2022);
grand prize in the 2025 Advanced Category (SuMi TRUST
Bank)
• “Nadeshiko Brand” (by the Ministry of Economy, Trade and
Industry and Tokyo Stock Exchange/FY2019)
• “Platinum Kurumin” (by the Ministry of Health, Labour and
Welfare, received by SuMi TRUST Bank and Custody Bank of
Japan, Ltd.)
• “Platinum Eruboshi” (by the Ministry of Health, Labour and
Welfare, received by Sumitomo Mitsui Trust Business Service
Co., Ltd.)
• Awarded Gold rating in PRIDE INDEX 2025 (by wwP (work
with Pride: a voluntary organization supporting the
promotion and establishment of LGBT-related diversity
management/; the award was jointly received by 6 Group
companies, including SuMi TRUST Group, SuMi TRUST
Bank, Sumitomo Mitsui Trust Asset Management, Sumitomo
Mitsui Trust Business Service, Sumitomo Mitsui Trust Club,
Sumitomo Mitsui Trust Panasonic Finance
*
. Amova Asset
Management also received Rainbow Certification.
- Sumitomo Mitsui Trust Panasonic Finance Co., Ltd. is to
change its trade name to SMTB Leasing Co., Ltd. on Oct. 1,
Our Group’s DE&I initiatives:
https://www.smtg.jp/english/about_us/management/human_r
esources/diversity_inclusion/
IV. Matters Regarding Internal Control System, etc.
- Fundamental Perspectives on Internal Control System and Establishment of Relevant
Structures (Updated)
As a bank holding company, the Board of Directors of SuMi TRUST Group is fully aware of
its responsibility for the management administration of the Group, and has developed “a
system to ensure the conformity of executive officers’ execution of duties with laws,
regulations, and the Articles of Incorporation, and other necessary systems to ensure the
appropriateness of business activities of SuMi TRUST Group and those of the corporate
group comprising SuMi TRUST Group and its subsidiaries, etc.” as follows, based on the
Board of Directors’ resolution concerning the “Basic Policy on Internal Control”:
(1) Compliance Structure
a. Basic compliance policies for the Group are established.
b. With respect to important issues pertaining to compliance, resolutions and
reporting are undertaken by the Board of Directors, based on a report by Risk
Committee, an advisory body of the Board of Directors.
c. A Basic Policy on the Management of Conflicts of Interest of the Group has been
prescribed and a management system is in place to ensure that the interests of
customers of the Group are not unfairly harmed.
d. Important matters concerning the management of conflicts of interests are resolved
by and reported at the Board of Directors meetings upon receiving reports from the
Conflict of Interest Committee, an advisory body to the Board of Directors.
e. A supervisory department for compliance is set up at the head office. In addition,
each department assigns a person of action and a person of authority.
f. A concrete action plan to ensure compliance (compliance program) is formulated
each fiscal year, and instructions are passed on to the Directly Owned
Subsidiaries, etc. for them to prepare their own plans. In addition, the status of
these plans – in terms of progress made and goals achieved –are monitored and
evaluated.
g. A handbook (compliance manual) for officers and employees is formulated.
Opportunities for compliance-oriented education and training are offered to them
on an ongoing basis.
h. Officers and employees must report violations of law pertaining to the operation of
SuMi TRUST Group’s business, and a compliance hotline system is established to
enable officers, employees, etc. to report directly to special contact points both in-
house and outside SuMi TRUST Group.
i. SuMi TRUST Group and its subsidiaries take a firm stand to prevent dealings with
antisocial forces and maintain no association whatsoever with such elements. A
structure, underpinned by close ties with external professionals, particularly the
police, is put in place to promote communication and cooperation among relevant
departments and thereby facilitate an organized response in the event an executive
or an employee is approached with an inappropriate request. Under no
circumstances will we engage in transactions to benefit persons or organizations
that threaten the order and safety of civil society.
j. Money laundering and terrorist financing are major threats to a sound financial
system, and SuMi TRUST Group takes a firm stand against money laundering and
terrorist financing and shall comply fully with related laws and regulations.
(2) Risk Management Structure
a. Basic risk management policies for the Group are established.
b. With respect to important issues pertaining to risk management, resolution and
reporting are undertaken by the Board of Directors, based on a report by Risk
Committee, an advisory body of the Board of Directors.
c. The Group will establish a Group-wide risk management system based on three lines
of defense.
d. A supervisory department for risk management is set up at the head office, and a risk
management department is established for each risk category.
e. A plan pertaining to risk management for the Group is formulated and instructions are
passed on to the Directly Owned Subsidiaries, etc. for them to prepare their own
plans. In addition, the status of these plans – in terms of improvements made and
goals achieved – are monitored and evaluated.
f. Opportunities for risk management-oriented education and training are offered to
officers and employees on an ongoing basis.
g. Management activities relating to business continuity in preparation for emergencies
have been developed to maintain and continue normal business operations of the
Group.
(3) Structure for Execution of Duties
a. Except for matters which are required by law to be decided by the Board of Directors,
the Board of Directors of SuMi TRUST Group, in principle, delegates decisions on the
execution of business to executive officers. In addition to establishing the Executive
Committee, comprising executive officers, etc., advisory bodies to the Executive Committee shall
be separately established.
b. The Board of Directors sets out basic points pertaining to the organizational structure
and the division of duties, as well as the organization of and authority granted to
officers and employees, to ensure the smooth and appropriate execution of duties by
executive officers (officers responsible for business execution at the subsidiaries, etc.).
c. In-house regulations are prepared in accordance with relevant legislation, and in the
event said legislation is revised or abrogated, required amendments to in-house
regulations will be implemented promptly.
(4) Ensuring Management Transparency
a. Internal control systems pertaining to financial reporting are developed to ensure the
appropriateness of accounting methods and reliability of financial reporting, and the
effectiveness of the systems is evaluated.
b. The Group shall establish an accounting hotline to receive reports from within the
Group and outside of the Group for information on accounting, internal controls
involving accounting and misconduct or improper treatment on audit items. The
hotline shall be established at a law firm, outside of the Group, and the Audit
Committee Office serves as the secretariat for its investigations.
c. Management-related information is managed appropriately and disclosed in a timely,
accurate and fair manner.
(5) The Group Management Structure
a. SuMi TRUST Group developed compliance and risk management structures applicable
to the entire Our Group.
b. SuMi TRUST Group reviews intra-Group transactions of particular significance to the
Group from the perspectives of risk management, compliance, and consistency with
Our Group’s strategic objectives.
c. Subsidiaries, etc. reports regularly to SuMi TRUST Group about their execution of
business activities and their financial situations, among other things.
d. SuMi TRUST Group manages the appropriateness and efficiency of the business
operation of subsidiaries, etc. according to the size and nature of their activities.
(6) Information Storage and Management Structure
a. Minutes which record progress on agendas and specific points of discussion are
prepared at the General Meeting of Shareholders and at Board of Directors and
Executive Committee meetings and kept with related materials.
b. The Board of Directors sets out the basic points pertaining to information storage and
management, such as the organizational structure for information management and
the classification of management categories, according to importance.
(7) Internal Audit Structure
a. An internal auditing unit, which is independent from business execution units and
sufficiently capable of fulfilling a restraining function, is established.
b. Internal audit plans and basic policies for developing internal audit structures for the
Group are established, and the internal auditing unit conducts audits of each
business execution units and, if necessary, of subsidiaries, etc. and point out matters
to be improved and make recommendations thereof.
c. The results of internal audits and the status of internal audit plans – in terms of
progress and goals achieved – are reported to the Board of Directors and Audit
Committee in a timely and appropriate manner.
(8) Structure for Audit Committee’s Audits
a. Employees assisting Audit Committee in its duties
(a) An Audit Committee Office is established to assist Audit Committee members in the execution of
their duties, and an appropriate number of directors, executive officers or employees, including
one office manager, are assigned thereto.
(b) Staff of the Audit Committee Office work to assist Audit Committee members with their
duties under the directions and orders of Audit Committee members.
(c) The personnel affairs and employment terms of staff of the Audit Committee Office are
discussed in advance with the Audit Committee.
(d) The executive officers give consideration so that staff of the Audit Committee Office are
not subject to unjust restrictions in conducting work to assist the Audit Committee’s
duties.
b. System for reporting to Audit Committee
(a) Directors (excluding directors who are Audit Committee members), executive officers
(*1) (*2), and employees shall immediately report to the Audit Committee if they have come
to know facts about possible significant damage to SuMi TRUST Group or its subsidiaries,
facts that could significantly damage the credibility of SuMi TRUST Group or its
subsidiaries, facts about material defects or problems concerning the system or
procedures of internal control, or material facts that could violate laws, regulations, or the
Articles of Incorporation.
(b) The FD and Compliance Department shall report to the Audit Committee on the details
of whistleblowing received through the compliance hotline system each time it is received.
(c) The Internal Audit Department shall report to the Audit Committee regularly, or at the
request thereof, on the progress and the results of internal audits it conducts in SuMi
TRUST Group and its subsidiaries.
(d) Directors (excluding directors who are Audit Committee members), executive officers ,
and employees shall promptly report to the Audit Committee when requested to do so by
the Audit Committee regarding the status of business execution and other matters.
(e) Directors, corporate auditors, executive officers, and employees of subsidiaries, etc., or
persons who have received reports from such persons shall report the matters described
in (a), (b) and (d) above to the Audit Committee of SuMi TRUST Group, immediately when
they have come to know the matters described in (a), each time they have received
whistleblowing as described in (b) through the internal whistleblowing systems of
subsidiaries, etc., and promptly when they are requested to report the matters described
in (d) at subsidiaries, etc. by the Audit Committee.
(f) The Audit Committee may demand a report, as necessary, from the persons described
in (a) through (e) above regarding the matters described in (a) through (d) above.
(g) Persons who have given reports based on (a) through (f) above shall not be treated
unfavorably on account of having given such reports, and that fact shall be thoroughly
communicated.
c. Other systems to ensure the effectiveness of Audit Committee’s audits
(a) Directors, executive officers , and employees cooperate with Audit Committee in good faith in
the audit activities.
(b) Full-time Audit Committee members are selected.
(c) Audit Committee members and the Audit Dedicated Executive Officer* may attend
meetings of the Board of Directors as well as any other meetings (including meetings of
subsidiaries) Audit Committee deems necessary to the execution of their duties.
(d) Representative executive officers exchange views with Audit Committee on a periodic
basis and at the request of Audit Committee.
(e) The internal auditing unit conducts prior consultations with and obtains the approval
of the Audit Committee regarding the internal audit plan, as well as conducts
investigations, etc. under the instruction of the Audit Committee, when so instructed. The
instructions of the Audit Committee regarding investigations, etc. supersede those of
executive officers or other parties.
(f) Representative executive officers or an executive officer in charge of the human
resources units shall have prior consultation with the Audit Committee for consent
regarding the appointment and dismissal of the Audit Dedicated Executive Officer or an
executive officer in charge of the internal auditing units and ranking staff of the internal
auditing units.
(g) Departments other than the Internal Audit Department that are involved in internal
controls including finance, risk management and compliance shall also strive to maintain
smooth cooperative relationships with the Audit Committee.
(h) To ensure the effectiveness of audits across the Group by the Audit Committee, when
selecting Internal Audit Department members from the Company or SuMi TRUST Bank as
part-time corporate auditors for subsidiaries (including Audit Committee members in
companies with a Nominating Committee and Audit Committee members in companies
with an Audit & Supervisory Committee, hereinafter the same), we present proposals for
auditor candidates (excluding candidates from other Group companies in joint ventures,
etc.) to the Audit Committee or each Audit Committee member. The Audit Committee or
each Audit Committee member may voice opinions, as necessary, regarding this proposal.
(i) Directors, executive officers, and employees shall provide support to the operation of a
system for external whistleblowing when the establishment of such a system has been
decided as deemed necessary by the Audit Committee.
(j) SuMi TRUST Group pays expenses necessary for the execution of duties by the Audit
Committee and Audit Committee members to ensure the effectiveness of audits.
*Appointed for the purpose of assisting the duties of the Audit Committee.
- Fundamental Perspectives on Eliminating Antisocial Forces and Establishment of
Relevant Structures
(1) Fundamental Perspectives
The Basic Policy on Internal Control states, “SuMi TRUST Group and its subsidiaries take
a firm stand to prevent dealings with antisocial forces and maintain no association
whatsoever with such elements. A structure, underpinned by close ties with external
professionals, particularly the police, is put in place to promote communication and
cooperation among relevant departments and thereby facilitate an organized response in
the event an officer or an employee is approached with an inappropriate request. Under
no circumstances will we engage in transactions to benefit persons or organizations that
threaten the order and safety of civil society.” In addition, the “Codes of Conducts (Value),”
with which Our Group’s officers and employees must comply, state, “We continue to take
a resolute stance against antisocial forces, which may threaten public order and the
security of civil society.”
(2) Establishment of Relevant Structures
SuMi TRUST Group has established a supervisory department for handling antisocial
forces and a department for communicating with external professionals, among other
units, and assigned staff in charge of preventing inappropriate requests. In addition, SuMi
TRUST Group has developed a compliance manual, etc. and informed and given training,
etc. to directors, officers and employees on the handling of antisocial forces. Further, it
has developed various systems to prevent transactions with antisocial forces, such as the
supervisory department, which conducts centralized management of information on
antisocial forces and uses it to prevent transactions with antisocial forces.
Each of the Group companies has also developed various systems in communication with
SuMi TRUST Group in order to handle antisocial forces.
V. Other
- Introduction of Defense Measures Against Takeovers
Introduction of defense measures against takeovers None
Supplementary Remarks on This Item
None.
- Other Matters Concerning the Corporate Governance System, etc. (Updated)
<Outline of Framework for Timely Disclosure>
Internal framework to ensure timely disclosure of SuMi TRUST Group’s corporate
information is outlined below.
-
Basic Initiative Policy
Adopting observance standards that all executives and employees must uphold to
ensure the transparency of corporate management through appropriate and fair
disclosure of corporate information, the Group has set out internal rules and has
established an internal control system to ensure that disclosures are made in
accordance with relevant laws, regulations and rules, including the Companies Act,
the Banking Act, and the Financial Instruments and Exchange Act. Based on this
philosophy, SuMi TRUST Group has established a “Disclosure Policy” (URL:
https://www.smtg.jp/english/disclosurepolicy/index.html)in order to clarify its
basic policy on disclosure both internally and externally, thereby ensuring
appropriate disclosure. In this way, it is working to ensure the transparency of
corporate management through appropriate disclosure of corporate information.
-
Internal Framework
(1) Corporate Communication Council
In order to ensure timely, accurate, and fair disclosure of management-related
information, the Group has established the Corporate Communications Council.
Members of the committee include the officer in charge of the Planning and
Coordination Department, who acts as chairperson, as well as officers in charge of the
Corporate Administration Department, the Planning and Coordination Department,
the Financial Planning Department, the IR/SR Department, the Corporate Planning
Department, and the Risk Management Department. To ensure the appropriateness of
information disclosure by the Group, the committee, when necessary, mainly
discusses the necessity of disclosure of management-related information and
information that could be management-related, and the appropriateness of the
disclosure thereof, as well as the appropriateness of developing and managing a
system for information disclosure and measures for improving it.
(2) Internal Rules regarding Timely Disclosure
The Group has set out internal rules as “Information Disclosure Rules” and
“Information Disclosure Guidelines”, etc.
(3) Department in Charge
The Corporate Administration Department is responsible for implementing disclosure,
working in cooperation with the Planning and Coordination Department, the Financial
Planning Department, and the IR/SR Department to ensure timely disclosure.
Appendix 1
<Reasons for appointment of directors (excluding outside directors)>
Name of directors Position Reasons for appointment
Kazuya Oyama
Director,
President
Executive
Officer
(Representative
Executive
Officer)
(CEO)*
1
Since Kazuya Oyama assumed the office of
Managing Executive Officer and General Manager
of the Corporate Planning Department of SuMi
TRUST Group in April 2017, he has consistently
been responsible for the formulation and
promotion of SuMi TRUST Group’s management
strategies. In April 2021, he assumed the office of
President of SuMi TRUST Bank and has been
responsible for the overall management thereof.
Following that, he was appointed President
Executive Officer (CEO) of SuMi TRUST Group in
April 2026. He also held the position of Director
and Executive Officer at SuMi TRUST Group from
June 2021 to June 2025, and based on the
experience he has cultivated so far in business
management and company management, SuMi
TRUST Group expects that, going forward, he will
continue to play a supervisory role in the overall
management of SuMi TRUST Group and exercise
leadership towards sustained growth and
enhancement of corporate value. Accordingly,
SuMi TRUST Group has selected him as a
Director.
Masanori
Watanabe
Director,
Managing
Executive
Officer
(Representative
Executive
Officer)
(CFO)*
2
After successively holding various posts,
including in Markets Business and the Financial
Planning Department in Japan and overseas of
both SuMi TRUST Group and SuMi TRUST Bank,
Masanori Watanabe has served as Executive
Officer and General Manager of the Financial
Planning Department of both SuMi TRUST Group
and SuMi TRUST Bank since April 2023, as
Managing Executive Officer, Executive Officer,
and General Manager of the Financial Planning
Department of SuMi TRUST Group and as
Managing Executive Officer and General Manager
of the Financial Planning Department of SuMi
TRUST Bank since April 2025, and as Managing
Executive Officer (CFO) of SuMi TRUST Group
since April 2026; therefore, he has extensive
knowledge and experience with regard to
management administration and business
operations of a trust group. SuMi TRUST Group
expects that based on his experience so far, he
will continue to exercise leadership towards
sustainable growth and enhancement of
corporate value. Accordingly, SuMi TRUST Group
has selected him as a Director.
Name of directors Position Reasons for appointment
Chikako
Matsumoto
Director,
Managing
Executive
Officer
(CSuO)*
3
Chikako Matsumoto has extensive experience in
international development finance and
sustainability at the Inter-American Development
Bank, the World Bank, and Ernst & Young
ShinNihon LLC. Since joining SuMi TRUST Bank
in October 2020, she has held various posts,
including Executive Officer and General Manager
of the ESG Strategy and Solution Department of
SuMi TRUST Bank from April 2022, Executive
Officer of SuMi TRUST Group from April 2023,
Managing Executive Officer (CSuO) of SuMi
TRUST Group from April 2024, and Director and
Managing Executive Officer (CSuO) of SuMi
TRUST Group from June 2025, among other
positions; therefore, she has extensive knowledge
and experience with regard to business
operations of a trust group. SuMi TRUST Group
expects that based on her experience so far, she
will continue to exercise leadership towards
sustained growth and enhancement of corporate
value. Accordingly, SuMi TRUST Group has
selected her as a Director.
Toru Takakura Director
(Kaicho)
After serving as an officer in charge of the
Corporate Management Department of SuMi
TRUST Group, Toru Takakura was appointed
President and Executive Officer in April 2021,
and Director, President, and Executive Officer
from June 2021 to March 2026 (including as CEO
from April 2024). He has a track record in leading
management from the perspective of supervising
overall management. He was appointed Director
and Chairman (Kaicho) in April 2026. He has
extensive experience of the Group’s corporate
management in general and expert knowledge of
general business operations, and based on the
knowledge and insight he has cultivated so far in
business management and company
management, SuMi TRUST Group expects that he
will be able to continue to contribute further to
SuMi TRUST Group's sustainable growth and
increase in corporate value by broadly advising
decision making and supervising the execution of
business. Accordingly, SuMi TRUST Group has
selected him as a Director.
Kouichi Kato Director Kouichi Kato has experience working in the Real
Name of directors Position Reasons for appointment
Estate Business and Corporate Management
Departments of SuMi TRUST Bank. He has also
served as the General Manager of the Wholesale
Business (Corporate Business), as a Managing
Executive Officer, and as a Director of SuMi
TRUST Group since June 2024, among other
roles; therefore, he has extensive knowledge and
experience with regard to management
administration and business operations of a trust
group. SuMi TRUST Group expects that based on
the experience he has cultivated so far, he has
knowledge and experience of auditing the overall
status of execution of business from a fair and
objective viewpoint and he will provide
contributions to the enhancement of soundness
and transparency of management. Accordingly,
SuMi TRUST Group has selected him as a
Director.
*1 Chief Executive Officer
*2 Chief Financial Officer
*3 Chief Sustainability Officer
<Reasons for appointment of executive officers)>
Name of
executive officer
Position Reasons for appointment
Kazuya Oyama President
Executive Officer
(Representative
Executive
Officer)
(CEO)*
1
Kazuya Oyama has working experience in the
Corporate Management Department and has
successively held positions such as General
Manager of branch offices at SuMi TRUST Bank,
as well as General Manager of the Human
Resources Department and Corporate Planning
Department of SuMi TRUST Group. He also
served as Managing Executive Officer of SuMi
TRUST Group for about two years, as Managing
Executive Officer of SuMi TRUST Bank for about
two years, as Director and Managing Executive
Officer of SuMi TRUST Bank for about two years,
and as President of SuMi TRUST Bank since
April 2021, and as President Executive Officer of
SuMi TRUST Group since April 2026. With these
achievements, he has the knowledge and
experience to carry out corporate management
accurately, fairly and efficiently, and we expect
that he will play a leading role in executing the
duties of the Company. Accordingly, we have
selected him as an Executive Officer.
Masanori
Watanabe
Managing
Executive Officer
(Representative
Executive
Officer)
(CFO)*
2
Masanori Watanabe has working experience in
Corporate Management Department, he has
successively held positions such as General
Manager of the London Market Business Unit,
General Manager of the Market Strategic
Investment Business Unit of SuMi TRUST Bank,
and General Manager of the Financial Planning
Department of SuMi TRUST Group. He has also
served as Executive Officer of SuMi TRUST
Group for about 2 years and Managing Executive
Officer of SuMi TRUST Group for one year. With
these achievements, we expect that he will play a
leading role in executing the duties of the
Company. Accordingly, we have selected him as
an Executive Officer.
Chikako
Matsumoto
Managing
Executive Officer
(CSuO)*
3
Chikako Matsumoto has working experience in
mainly advisory operations at international
organizations and auditing firms, as well as
practical experience from working in the
Wholesale Business (Corporate Business) at
SuMi TRUST Bank. She has also served as
General Manager of the ESG Strategy and
Solution Department, as an Executive Officer of
SuMi TRUST Group for approximately one year,
Name of
executive officer
Position Reasons for appointment
and as a Managing Executive Officer of SuMi
TRUST Group for about two years. With these
achievements, she has the knowledge and
experience to carry out corporate management
accurately, fairly and efficiently, and we expect
that she will play a leading role in executing the
duties of the Company. Accordingly, we have
selected her as an Executive Officer.
Takumi Fujisawa Senior Managing
Executive Officer
(CHRO)*
4
Takumi Fujisawa has working experience in the
Wholesale Business (Corporate Business) at
SuMi TRUST Bank and has successively served
as General Manager of branch offices, the
Wholesale Business Planning Department, and
the Wholesale Asset Management Business
Planning Department of SuMi TRUST Bank. He
has also served as a Managing Executive Officer
of SuMi TRUST Group for about three years and
as a Senior Managing Executive Officer since
April 2026. With these achievements, he has the
knowledge and experience to carry out corporate
management accurately, fairly and efficiently,
and we expect that he will play a leading role in
executing the duties of the Company.
Accordingly, we have selected him as an
Executive Officer.
Riro Sato Senior Managing
Executive Officer
Riro Sato has working experience in the
Wholesale Business (Corporate Business) at
SuMi TRUST Bank and has successively served
as General Manager of SuMi TRUST Bank’s
London Branch and as head of operations in
Europe. He has also served as a Managing
Executive Officer of SuMi TRUST Group for
about three years and as a Senior Managing
Executive Officer since April 2026. With these
achievements, he has the knowledge and
experience to carry out corporate management
accurately, fairly and efficiently, and we expect
that he will play a leading role in executing the
duties of the Company. Accordingly, we have
selected him as an Executive Officer.
Yuki Takada Managing
Executive Officer
(CCO)*
5
Yuki Takada has working experience in the
Corporate Management Department at SuMi
TRUST Bank and has successively served as
General Manager of the Investment Management
Department and Investor Services Business at
SuMi TRUST Bank. She has also served as
Executive Officer of SuMi TRUST Group for
Name of
executive officer
Position Reasons for appointment
about one year, and as Managing Executive
Officer for about three years. With these
achievements, she has the knowledge and
experience to carry out corporate management
accurately, fairly and efficiently, and we expect
that she will play a leading role in executing the
duties of the Company. Accordingly, we have
selected her as an Executive Officer.
Naoki Ishibe Managing
Executive Officer
Naoki Ishibe has working experience in the
Wholesale Business at SuMi TRUST Bank and
has successively served as General Manager of
the Financial Institutions Department and the
Corporate Business Planning Department of
SuMi TRUST Bank. He has also served as
Executive Officer of SuMi TRUST Bank for about
two years and Managing Executive Officer for
around one year. He has also served as
Managing Executive Officer of SuMi TRUST
Group for about a year. With these
achievements, he has the knowledge and
experience to carry out corporate management
accurately, fairly and efficiently, and we expect
that he will play a leading role in executing the
duties of the Company. Accordingly, we have
selected him as an Executive Officer.
Takahiro Yoshida Managing
Executive Officer
(CRO)*
6
Takahiro Yoshida has working experience in the
Corporate Management Department and has
successively held positions such as General
Manager of the Fiduciary Duties & Customer
Satisfaction Planning and Promotion
Department and the IT System Planning and
Management Department of SuMi TRUST Group.
He has also served as an Executive Officer of
SuMi TRUST Group for about three years and as
a Managing Executive Officer for about one year.
With these achievements, he has the knowledge
and experience to carry out corporate
management accurately, fairly and efficiently,
and we expect that he will play a leading role in
executing the duties of the Company.
Accordingly, we have selected him as an
Executive Officer.
Hisato Nakano Managing
Executive Officer
Hisato Nakano has working experience in the
Corporate Management Department and has
successively held positions such as president of
Sumitomo Mitsui Trust Bank (U.S.A.) Limited.
He has also served as an Executive Officer of
SuMi TRUST Bank for about three years,
Executive Officer of SuMi TRUST Group for
around one year, and as a Managing Executive
Name of
executive officer
Position Reasons for appointment
Officer of SuMi TRUST Group for about one year.
With these achievements, he has the knowledge
and experience to carry out corporate
management accurately, fairly and efficiently,
and we expect that he will play a leading role in
executing the duties of the Company.
Accordingly, we have selected him as an
Executive Officer.
Junya Ueda Managing
Executive Officer
(CISO)*
7
Junya Ueda has working experience in the
Corporate Management Department and has
successively held positions such as General
Manager of the IT System Promotion Department
of SuMi TRUST Bank and General Manager of
the Systems Development Department of a group
company. He has also served as an Executive
Officer of SuMi TRUST Bank for about three
years and as a Managing Executive Officer for
approximately six years. With these
achievements, he has the knowledge and
experience to carry out corporate management
accurately, fairly and efficiently, and we expect
that he will play a leading role in executing the
duties of the Company. Accordingly, we have
selected him as an Executive Officer.
Takahiro Ishige Managing
Executive Officer
Takahiro Ishige has working experience in the
Corporate Management Department and has
successively held positions such as General
Manager of the IT System Planning and
Management Department of SuMi TRUST Group
and President of Sumitomo Mitsui Trust
Systems & Services Co., Ltd. He has also served
as an Executive Officer of SuMi TRUST Bank for
about three years and as a Managing Executive
Officer for approximately one year. With these
achievements, he has the knowledge and
experience to carry out corporate management
accurately, fairly and efficiently, and we expect
that he will play a leading role in executing the
duties of the Company. Accordingly, we have
selected him as an Executive Officer.
Kazue Yamazaki Managing
Executive Officer
Kazue Yamazaki has working experience in the
Asset Management Department of SuMi TRUST
Bank and has successively held positions such
as General Manager of the Trust Funds
Investment Department of SuMi TRUST Bank
and President of Sumitomo Mitsui Trust
Business Service Co., Ltd. She has also served
as an Executive Officer of SuMi TRUST Bank for
Name of
executive officer
Position Reasons for appointment
about two years. With these achievements, she
has the knowledge and experience to carry out
corporate management accurately, fairly and
efficiently, and we expect that he will play a
leading role in executing the duties of the
Company. Accordingly, we have selected him as
an Executive Officer.
Manatomo
Yoneyama
Executive Officer
Manatomo Yoneyama has working experience in
the Corporate Management Department and has
successively served as General Manager of the
Business Process Management Department and
General Manager of the Corporate Planning
Department of SuMi TRUST Group. He has also
served as Managing Executive Officer of SuMi
TRUST Group for about three years, Senior
Managing Executive Officer of SuMi TRUST
Group for approximately one year. Also he
assumed the office of President of SuMi TRUST
Bank in April, 2026. With these achievements,
he has the knowledge and experience to carry
out corporate management accurately, fairly and
efficiently, and we expect that he will play a
leading role in executing the duties of the
Company. Accordingly, we have selected him as
an Executive Officer.
*4 Chief Human Resources Officer
*5 Chief Compliance Officer
*6 Chief Risk Officer
*7 Chief Information Security Officer
Appendix 2
Matters Concerning Compensation for Directors and Executive Officers
<1> Disclosure of compensation for individual directors
In fiscal year 2025 (April 1, 2025 through March 31, 2026), compensation amounts were
as follows.
- Total amounts of compensation etc. by officer category and by type of
compensation etc. as well as number of recipients of the submitting company
FY2025 (April 1, 2025 through March 31, 2026)
Classification
Pers
ons
paid
Compensation, etc. (¥ mn)
Total
compensati
on
Monthly
compensation
Performance-linked
compensation
Other
Fixed
compensa
tion
Individual
role-linked
performan
ce
compensat
ion
Directors’
bonus
Stock
compensat
ion
Directors (excl.
outside
directors)
5 202
129
27
22
23
-
Executive
officers (*1)
13 535
187
96
111
136
2
Outside
directors
8 176
176
-
-
-
-
Total
26 914
492
124
133
160
2
Note: 1. The compensation data is on an annual basis with amounts less than one
million yen are rounded down
2. Compensation etc. paid to executive officers concurrently serving as directors
is included in the amounts for executive officers.
For reference, consolidated amounts of compensation etc. including compensation paid
to directors and executive officers for their concurrent service as directors or executive
officers at Group companies, including SuMi TRUST Bank, were as follows.
Classification
Pers
ons
paid
Compensation, etc.
(
¥
mn)
Total
compensati
on
Monthly
compensation
Performance-linked
compensation
Other
Fixed
compensa
tion
Individual
role-linked
performan
ce
compensat
ion
Directors’
bonus
Stock
compensat
ion
Directors (excl.
outside
directors)
5
202
129
27
22
23
-
Executive
officers (*1)
13
1,001
349
185
210
250
6
Outside
directors
8
176
176
-
-
-
-
Total
26
1,380
655
213
232
274
6
Note: Compensation etc. paid to executive officers concurrently serving as directors is
included in the amounts for executive officers.
- Total amounts etc. of consolidated compensation etc. for directors and executive
officers of the submitting company
Name
(Classificati
on)
Total
consolidated
compensation
etc. (¥ mn)
Companies
Total compensation etc. (¥ mn)
Monthly compensation
Performance-linked
compensation
Other
Fixed
compensat
ion
Individual
role-linked
performance
compensatio
n
Directors’
bonus
Stock
compens
ation
Toru
Takakura
(executive
officer)
179
SuMi TRUST
Group
45
23
44
64
1
SuMi TRUST
Bank
-
-
-
-
-
Masakatsu
Sato
(executive
officer)
64
SuMi TRUST
Group
15
9
6
7
-
SuMi TRUST
Bank
10
6
4
4
-
Tetsuo
Ohkubo
(director)
129
SuMi TRUST
Group
56 27 22 23 -
SuMi TRUST
Bank
- - - - -
Kazuya
Oyama
(executive
officer)
161
SuMi TRUST
Group
-
-
-
-
-
SuMi TRUST
Bank
42
23
40
52
2
Note: Amounts shown are total consolidated compensation of Representative Executive
Officers and those whose compensation is more than
¥
100mn.
- Targets and results for indicators (KPIs) concerning performance-linked
compensation and the actual payment rate of the compensation of the
submitting company
Note: 1. (1) and (2) and (4) through (6) are fiscal 2025 results versus fiscal 2025 forecasts
announced in May 2025
- For the comparison indicator of relative TSR (3), both the rate of change in the TOPIX
sector index for banks (including dividends) and the rate of change in the JPX-Nikkei Index
400 (including dividends) are used to calculate an average relative TSR.
<2> Disclosure of policy for determining compensation amounts and calculation
methods
The Group defines its “Purpose” as “Trust for a flourishing future,” and the core of its
management philosophy is to contribute to the sustainable development of society and
to achieve the sustainable and stable growth of the Group through the balanced
creation of both social value and economic value. Recognizing the role that
remuneration for executives plays in each and every executive's efforts to realize and
act in a manner that embodies its “Purpose,” SuMi TRUST Group will constantly review
its policies and systems to ensure that they are based on this philosophy.
Note that in fiscal 2026, the compensation system for directors and executive officers
was revised as indicated below. This section describes, in principle, the compensation
system for directors and executive officers after the revision.
Key revisions to the compensation system for directors and executive officers in fiscal
year 2026
・
From the perspective of further strengthening the connection with shareholder
value, we have increased the evaluation weighting of relative TSR (total
shareholder return), one of the stock compensation evaluation indicators.
Types of
performance-
linked
compensation
Indicator
type Indicator types (KPIs) concerning performance-
linked compensation*
1
Target Actual
Payment
rate
■Bonus for
directors and
executive officers
Performance-
linked bonus
(short-term
incentive
compensation
)
Short-term
performanc
e indicators
(1) Consolidated net business profit
370.0 bn
yen
347.4 bn
Yen
Payment
rate
101%
(2) Net profit attributable to owners of parent
280.0 bn
yen
317.5 bn
yen
■Stock
compensation
Performance-
linked stock
compensation
(RS trust)
(medium- to
long-term
incentive
compensation
)
Performan
ce
indicators
(1) Consolidated net business profit
370.0 bn
yen
347.4 bn
Yen
Performa
nce-
linked
coefficien
t
108%
(2) Net profit attributable to owners of parent
280.0 bn
yen
317.5 bn
Yen
Share
price
indicator
(3) Relative TSR (total shareholder return)*
2
Financial
indicators
(4) Consolidated shareholders’ equity and ROE
Upper
8%
9.5%
(5) Consolidated CET1 ratio
(common equity tier 1 capital ratio)
Mid 10% 10.3%
(6) Consolidated OHR (overhead ratio) 62% 63.8%
Non-
financial
indicators
(7) Sustainability activity assessment - -
- Policy etc. for determining the amounts of compensation etc. for directors and
executive officers and calculation methods
(1) Policy etc. for determining the amounts of compensation etc. for individual directors
and executive officers and calculation methods
The Compensation Committee shall prescribe the policy on decisions on the
details of compensation etc. for individual directors and executive officers
(*1)(*2) of SuMi TRUST Group. The details are as described below.
(i) Compensation etc. for directors (excluding outside directors and internal
directors serving as Audit Committee members) and executive officers
(hereinafter “directors and executive officers”) shall effectively function as an
incentive for enhancing company performance and increasing corporate value,
in order to realize steady and sustainable growth of the Group.
(ii) A compensation system shall be established which takes into consideration the
balance between short-term incentives and medium- to long-term incentives and
puts a priority on attributes and capabilities of directors and executive officers
as senior management, without placing exclusive emphasis on performance
evaluation for a single fiscal year focusing on contribution to short-term revenue
but based on comprehensive evaluation reflecting the medium- to long-term
performance.
(iii) In order to fully demonstrate the function of supervising each of the Group
companies as a holding company, SuMi TRUST Group shall accurately grasp the
roles that directors and executive officers should fulfill in terms of business
management and their achievements, and determine individual compensation
based on a highly transparent, fair and objective evaluation.
(iv) The Compensation Committee shall conduct deliberations to establish a
compensation system/structure with high accountability and determine the fair
and efficient amounts of compensation by deepening collaboration of information,
when necessary, with the Nominating Committee, Audit Committee, and
voluntary committees such as Risk Committee and Conflict of Interest Committee.
(2) Compensation System
The specific compensation structure for us is as follows.
(i) In principle, compensation is paid with a combination of monthly
compensation, director and executive officer bonuses, and stock compensation.
(ii) The monthly compensation is fixed compensation based on position,
responsibilities, and roles.
(iii) For bonuses for directors and executive officers, the total amount is
determined based on indicators linked to near-term earnings such as
consolidated net business profit before credit costs and net income attributable
to owners of the parent, while the amount for each individual director and
executive officer reflects their previous fiscal year’s achievements and is paid at
the conclusion of the General Meeting of Shareholders for that fiscal year.
(iv)Restricted stock compensation (RS Trust) is granted based on a basic amount
determined by position and according to the following markers of company
performance: the annual target achievement rate for consolidated net business
profit and net income attributable to owners of the parent, and in comparison
to the final year results of the previous Medium-Term Management Plan; the
share price indicator of relative TSR; the financial indicators of consolidated
shareholder ROE and a qualitative evaluation of consolidated OHR; and a non-
financial indicator (sustainability activity assessment). The transfer restrictions
are lifted upon retirement.
(v) The proportion of the bonuses and stock compensation for directors and
executive officers as a percentage of total compensation shall be designed so
that they function sufficiently as an incentive.
(3) Compensation Weighting by Types
Types of Compensation
Fixed /
Performa
nce-
linked
Compensation
Weighting (standard)
President
Other than
president
■Monthly
compensation
Fixed compensation Fixed amount based on position, responsibilities, and roles
Fixed
Approx.
35%
Approx.
50%
■Bonus for directors
and executive officers
Performance-linked
bonus
(short-term
incentive
compensation)
Allocated according to the performance evaluation of each individual from
the total amount determined with reference to the following indicators of
near-term earnings: consolidated net business profit and net profit
attributable to owners of the parent
Performa
nce-
linked
Approx.
30%
Approx.
25%
■Stock compensation
Performance-linked
stock compensation
(RS trust)
(medium- to long-
term incentive
compensation)
・Stock-based compensation aimed at clarifying the link between
executive compensation and company earnings/stock value, and
enhancing awareness of contributing to long-term performance
improvement and increased corporate value.
・Annual restricted stock grants with transfer restrictions based on
performance indicators (consolidated net business profit before credit
costs and net income attributable to owners of the parent), share price
indicator (relative TSR), financial indicators (consolidated ROE and
consolidated OHR), and comprehensive evaluation of ESG activities.
Transfer restrictions are lifted upon retirement.
・Malus (reduction or forfeiture before transfer restrictions are lifted) and
clawback (recovery after transfer restrictions are lifted) provisions apply.
Performa
nce-
linked
Approx.
35%
Approx.
25%
Note: For details on Performance-linked compensation indicators, refer to "(4) Indicators
(KPIs) relating to Performance-linked compensation, reasons for selection, method for
determining payment amounts etc."
(4) Indicators (KPIs) relating to Performance-linked compensation, reasons for selection,
method for determining payment amounts etc.
Type of
performance-
linked
compensation
Indicators (KPIs)
concerning
performance-linked
compensation
Indicator
type
KPI selection reason
Evaluati
on
weight
Calculation method Final determination method Payment method
■Bonus for
directors and
executive
officers
Performanc
e-linked
bonus
(short-term
incentive
compensati
on)
(1) Consolidated net
business profit
Short-
term
performan
ce
indicators
Considered appropriate indicators of
the company’s business results and
capabilities in the fiscal year under
review
1.0
Calculated based on a
weighted average with a
2:1 weighting on the
achievement rates for
(1) and (2), respectively
Determined by the
Compensation Committee
based on target achievement
rates with special factors and
the like taken into full account
In principle, the reflection of
special factors in the
evaluation is limited to a range
of ±10%
Paid in cash after the
General Meeting of
Shareholders for that fiscal
year
(2) Net profit
attributable to owners
of parent
0.5
■Stock
compensatio
n
Performanc
e-linked
stock
compensati
on (RS
trust)
(medium-
to long-
term
incentive
compensati
on)
(1) Consolidated net
business profit
Performan
ce
indicators
Considered appropriate indicators of
the company’s business results and
capabilities in the fiscal year under
review and in the period of the
current Medium-Term Management
Plan
20%
Calculated with the
target achievement rate
for the current fiscal
year and a comparison
with the final year
results of the previous
Medium-Term
Management Plan by
averaging them at a
ratio of 1:1
Determined by the
Compensation Committee with
special factors and the
business environment taken
into full account
The performance-linked
coefficient is capped at 130%
(lower limit of 0%) so as to
provide an appropriate
incentive scheme.
●The Company sets up a
share delivery trust with
the director or officer as
the beneficiary and the
capital required to
purchase shares is placed
in trust
↓
●The trustee makes block
market purchases from the
market for the number of
shares expected to be
delivered to beneficiaries in
the future
↓
●The company grants
restricted stock with
transfer restrictions to
eligible directors and
executive officers based
on the performance-linked
coefficient determined by
the Compensation
Committee, as well as
position. The transfer
restrictions are lifted upon
retirement.
(2) Net profit
attributable to owners
of parent
10%
(3) Relative TSR
(total shareholder
return)
Share
price
indicator
Using relative TSR as a KPI for the
period covered by the Medium-Term
Management Plan was judged to be
appropriate in order to more clearly
link sustainable growth in corporate
value with improvements in
shareholder
20%
Calculated based on the
relative evaluation of
the Company’s TSR
during the period
covered by the
Medium-Term
Management Plan.
However, if the TSR is
below 100%, it will be
capped at a maximum of
100%.
(4) Consolidated
shareholders’ equity
and ROE
Financial
indicators
Using key financial indicators in the
Company’s Medium-Term
Management Plan was judged to be
appropriate
10%
Qualitative assessment
of progress on
achieving Medium-
Term Management Plan
targets and calculation
of assessment scores
(5) Consolidated OHR
(overhead ratio)
10%
(6) Sustainability
activity assessment
Non-
financial
indicator
In light of materiality, five key
categories were identified: climate
change, fiduciary duties (FD) and
client satisfaction (CS), employee
engagement, diversity (empowerment
of women), and assessments by
third-party evaluators. Using a
comprehensive evaluation of
activities in these categories from
both quantitative and qualitative
perspectives, underpinned by the
quantitative evaluation of the KPI
established for each category, was
judged to be appropriate as a holistic
assessment of sustainability
activities.
30%
Assessment score
calculated based on
overall assessment
comprising both
quantitative and
qualitative evaluations
of activities in each
assessment category
Note: 1. For the relative TSR comparison indicator in (3), we use the average relative TSR,
which is calculated using the rate of change of the industry-specific TOPIX
(banking) including dividends and the rate of change of the JPX-Nikkei 400 index
including dividends
2. The five key categories and KPIs for the sustainability activity assessment (6) are
listed below.
Five key categories KPI
-
Climate change
Cumulative value of sustainable finance
transactions*
1
-
Fiduciary duties (FD) and client
satisfaction (CS)
Four indicators of risk culture in the employee
awareness survey*
1
Client satisfaction survey*
1
-
Employee engagement
Vitality level in the employee awareness
survey*
1
-
Diversity (empowerment of women)
Proportion of female employees in
management positions*
2
Number of paid leave days taken*
1
- Assessments by third-party evaluators Assessments by external rating agencies*
3
*1 Assessed using SuMi TRUST Bank’s internal target achievement rates
*2 Assessed using the Group’s internal target achievement rates
*3 The external rating agencies are MSCI, FTSE, and Sustainalytics; evaluations are
based on relative rankings among competitors
Reference: Compensation system for directors and executive officers in fiscal year 2025
The amounts of compensation indicated in “<1> Disclosure of compensation for
individual directors” are calculated based on the following compensation system.
● Compensation Weighting by Types
Types of Compensation
Fixed /
Performa
nce-
linked
Compensation
Weighting (standard)
President
Other than
president
■Monthly
compensation
Fixed compensation Fixed amount based on position held
Fixed
Approx.
25%
Approx.
40%
Individual role-linked
compensation
Compensation that reflects each individual officer’s role expectations
during the fiscal year
Fixed
Approx.
15%
Approx.
20%
■Bonus for directors
and executive officers
Performance-linked
bonus
(short-term
incentive
compensation)
Allocated according to the performance evaluation of each individual from
the total amount determined with reference to the following indicators of
near-term earnings: consolidated net business profit and net profit
attributable to owners of the parent
Performa
nce-
linked
Approx..
25%
Approx.
20%
■Stock compensation
Performance-linked
stock compensation
(RS trust)
(medium- to long-
term incentive
compensation)
・Stock-based compensation aimed at clarifying the link between executive
compensation and company earnings/stock value, and enhancing
awareness of contributing to long-term performance improvement and
increased corporate value.
・Annual restricted stock grants with transfer restrictions based on
performance indicators (consolidated net business profit before credit
costs and net income attributable to owners of the parent), share price
indicator (relative TSR), financial indicators (consolidated ROE,
consolidated CET1 ratio, consolidated OHR), and comprehensive evaluation
of ESG activities. Transfer restrictions are lifted upon retirement.
・Malus (reduction or forfeiture before transfer restrictions are lifted) and
clawback (recovery after transfer restrictions are lifted) provisions apply.
Performa
nce-
linked
Approx.
35%
Approx.
20%
● Indicators (KPIs) relating to Performance-linked compensation, reasons for selection,
method for determining payment amounts etc.
Type of
performance-
linked
compensation
Indicators (KPIs)
concerning
performance-linked
compensation
Indicator
type
KPI selection reason
Evaluatio
n weight
Calculation method
Final determination
method
Payment method
■Bonus for
directors and
executive
officers
Performanc
e-linked
bonus
(short-term
incentive
compensati
on)
(1) Consolidated net
business profit
Short-
term
performan
ce
indicators
Considered appropriate indicators of
the company’s business results and
capabilities in the fiscal year under
review
1.0%
Calculated based on a
weighted average with
a 2:1 weighting on the
achievement rates for
(1) and (2),
respectively
Determined by the
Compensation
Committee based on
target achievement
rates with special
factors and the like
taken into full account
In principle, the
reflection of special
factors in the
evaluation is limited to
a range of ±10%
Paid in cash after the
General Meeting of
Shareholders for that
fiscal year
(2) Net profit
attributable to owners
of parent
0.5
■Stock
compensation
Performanc
e-linked
stock
compensati
on (RS
trust)
(medium-
to long-
term
incentive
(1) Consolidated net
business profit
Performan
ce
indicators
Considered appropriate indicators of
the company’s business results and
capabilities in the fiscal year under
review and in the period of the
current Medium-Term Management
Plan
20%
Calculated with the
target achievement
rate for the current
fiscal year and a
comparison with the
final year results of
the previous
Medium-Term
Management Plan by
averaging them at a
ratio of 1:1
Determined by the
Compensation
Committee with special
factors and the
business environment
taken into full account
The performance-
linked coefficient is
capped at 130% (lower
limit of 0%) so as to
●The Company sets
up a share delivery
trust with the director
or officer as the
beneficiary and the
capital required to
purchase shares is
placed in trust
↓
●The trustee makes
block market purchases
(2) Net profit
attributable to owners
of parent
10%
compensati
on)
(3) Relative TSR
(total shareholder
return)
Share
price
indicator
Using relative TSR as a KPI for the
period covered by the Medium-Term
Management Plan was judged to be
appropriate in order to more clearly
link sustainable growth in corporate
value with improvements in
shareholder
10%
Calculated based on
the relative evaluation
of the Company’s TSR
during the period
covered by the
Medium-Term
Management Plan.
However, if the TSR is
below 100%, it will be
capped at a maximum
of 100%.
provide an appropriate
incentive scheme.
from the market for the
number of shares
expected to be
delivered to
beneficiaries in the
future
↓
●The company grants
restricted stock with
transfer restrictions to
eligible directors and
executive officers
based on the
performance-linked
coefficient determined
by the Compensation
Committee, as well as
position. The transfer
restrictions are lifted
upon retirement.
(4) Consolidated
shareholders’ equity
and ROE
Financial
indicators
Using key financial indicators in the
Company’s Medium-Term
Management Plan was judged to be
appropriate
10%
Qualitative
assessment of
progress on achieving
Medium-Term
Management Plan
targets and calculation
of assessment scores
(5) Consolidated CET1
ratio (common equity
tier 1 capital ratio)
10%
(6) Consolidated OHR
(overhead ratio)
10%
(7) Sustainability
activity assessment
Non-
financial
indicator
In light of materiality, five key
categories were identified: climate
change, fiduciary duties (FD), client
satisfaction (CS), employee
engagement, DE&I (empowerment of
women), and ESG assessment
organizations. Using a
comprehensive evaluation of these
categories from both quantitative
and qualitative perspectives was
judged to be appropriate as a holistic
assessment of ESG.
30%
Assessment score
calculated based on
overall assessment
comprising both
quantitative and
qualitative evaluations
of activities in each
assessment category
Note: 1. For the comparison indicator of relative TSR (3), both the rate of change in the
TOPIX sector index for banks (including dividends) and the rate of change in the
JPX-Nikkei Index 400 (including dividends) are used to calculate an average
relative TSR
2. The five key categories and KPIs for the sustainability activity assessment (7) are
listed below.
Five key categories KPI
-
Climate change
Cumulative value of sustainable finance
transactions*
1
-
Fiduciary duties (FD) and client
satisfaction (CS)
Four indicators of risk culture in the
employee awareness survey*
1
Client satisfaction survey*
1
-
Employee engagement
Vitality level in the employee awareness
survey*
1
-
Diversity (empowerment of women)
Proportion of female employees in
management positions*
2
Number of paid leave days taken*
1
- Assessments by third-party evaluators Assessments by external rating agencies*
3
*1 Assessed using SuMi TRUST Bank’s internal target achievement rates
*2 Assessed using the Group’s internal target achievement rates
*3 The external rating agencies are MSCI, FTSE, and Sustainalytics; evaluations are based
on relative rankings among competitors
(5) Method for determining the content of individual compensation
The individual compensation of our directors and executive officers is determined by
the Compensation Committee. As reference data for verifying the objectivity and
appropriateness of the compensation level for each position, we use feedback
materials for management compensation provided by external specialists
organizations, etc. With respect to individual Performance-linked compensation in
particular, the Compensation Committee determines the base amount to be paid
based on the consolidated net business profit before credit costs, etc., and then
decides on an amount after comprehensively considering special factors, the business
environment, etc.
(6) Other important items
The Company has introduced a system to apply Provisions of Malus (reduction/
cancellation before transfer restrictions are lifted ) and clawback (recovery after transfer
restrictions are lifted) to RS trust funds , which are stock-based remuneration, to
drastically revise financial information for the previous fiscal year due to fraudulent acts,
record large losses due to excessive risk-taking and other such acts, serious violations of
laws and internal regulations, or conduct that significantly impairs the valuation or
corporate value of the Company through the prescribed internal procedures.
(7) Compensation etc. for internal directors serving as Audit Committee members
Compensation for internal directors serving as Audit Committee members shall be
composed of fixed monthly compensation alone, and shall be determined at the
Compensation Committee, taking into consideration the business conditions of SuMi
TRUST Group, the compensation level of its directors, and compensation levels at
industry peers and the like, taking into consideration a level appropriate for internal
directors serving as Audit Committee members.
(8) Compensation etc. for outside directors
Compensation for outside directors shall be composed of fixed monthly compensation
alone, with the addition of a predetermined amount when an outside director serves as a
statutory committee chairperson or member. For an outside director serving as
chairperson of the Board of Directors, a fixed compensation table has been established,
taking into consideration the compensation levels of internal directors and outside
directors. The compensation level shall be determined by the Compensation Committee,
taking into consideration the business conditions of SuMi TRUST Group, and
compensation levels at industry peers and the like.
(9) Reasons for the Compensation Committee's determination that the details of the
individual compensation, etc. of Directors and Executive Officers for fiscal 2025 are in line
with their policies on compensation decisions
The Compensation Committee has determined that the details of the individual
compensation, etc. of Directors and Executive Officers of SuMi TRUST Group for fiscal
2025 are in line with their policies on compensation decisions based on the method
described in "(5) Method for determining the content of individual compensation."
In the case of officers who serve concurrently at SuMi TRUST Bank or Sumitomo Mitsui
Trust Asset Management, the amount of compensation paid is split according to their
respective ratios of concurrent service.
- Process for the determination of the amounts of compensation etc. for officers
(1) Authority of the Compensation Committee
Rules on the Compensation Committee stipulate the details on the process for the
determination of the amounts of compensation for officers of SuMi TRUST Group. The
details include the committee composition, procedure for calling a committee meeting, its
authority and operation. The compensation for officers, whether subject to statutory
resolution or otherwise, is administered as follows under the authority of the
Compensation Committee.
(i) Matters decided by the Compensation Committee
Policy on decisions on the details of compensation etc. for individual directors and
executive officers of SuMi TRUST Group
Amounts of compensation etc. for individual directors and executive officers of SuMi
TRUST Group
Any member of the Compensation Committee, shall not vote on the resolution concerning
the amounts of his/her own compensation etc.
(ii) Matters deliberated by the Compensation Committee
Policy on decisions on the details of compensation etc. for individual directors and
executive officers of SuMi TRUST Bank Limited and Sumitomo Mitsui Trust Asset
Management Co., Ltd.
(iii) Matters reported to the Compensation Committee
Amounts of compensation etc. for individual executive officers and Audit Dedicated
Executive Officers of SuMi TRUST Group
Amounts of compensation etc. for individual directors and executive officers (*2) of SuMi
TRUST Bank Limited and Sumitomo Mitsui Trust Asset Management Co., Ltd.
(2) Outline of the procedure etc. at the Compensation Committee
Outside directors who are Compensation Committee members shall receive explanations
on matters including the concept of the compensation system in place, compensation
tables and how they operate, the mechanism of performance evaluation for individual
officers and the results thereof, and the method for reflecting the performance indicators
in officers’ bonuses, as well as explanations and information regarding industry peers’
executive compensation systems and the trend of corporate governance in the market.
These explanations are an effort to ensure incremental improvements for materializing the
still better executive compensation system of SuMi TRUST Group. Furthermore, as
reference data to verify the objectivity and validity of the level of compensation by position,
SuMi TRUST Group is using data from the executive compensation survey jointly
conducted by SuMi TRUST Bank and Deloitte Tohmatsu Group, as well as other executive
compensation feedback materials from external specialists organizations, etc.
(3) Activities of the Compensation Committee
(i) Number of committee meetings held in fiscal year 2025: 14
Annual activity cycle (administrative year) of the Compensation Committee runs from the
first committee meeting, which is held after the conclusion of the ordinary general meeting
of shareholders in June each year, to June the following year.
(ii) Attendance of individual members at Compensation Committee meetings in FY2025
As stated under II. Organizational Structure for Managerial Decision-Making, Execution,
Supervision and other Corporate Governance System, 2. Items Related to Business
Execution, Audit and Oversight, Nominations and Setting of Compensation, etc., (2)
Outline of Committees, B. Compensation Committee, (d) Status of Activities.
(iii) Major decisions, deliberations, and reporting matters at the Compensation Committee
in fiscal 2024
Date Major decisions, deliberations, and reporting matters
April 2025 Decisions on policies for determining compensation for directors
and executive officers in fiscal 2025
• Matters regarding performance-linked compensation for directors and executive officers
Decisions on compensation for directors associated with measures
related to cases of misconduct
May 2025 ・Matters regarding performance-linked compensation for
directors and executive officers
June 2025 • Determination of performance-linked compensation amounts for
directors and executive officers in fiscal 2024 and individual
compensation amounts in fiscal 2025
・Matters regarding the policies for determining compensation
and individual compensation amounts for directors and executive
officers of SuMi TRUST Bank and Sumitomo Mitsui Trust Asset
Management
• Revisions to stock granting regulations
August 2025
• Level of compensation for directors and executives
November 2025
• Review of compensation system for directors and executive
officers
December 2025
• Review of compensation system for directors and executive
officers
January 2026
• Review of compensation system for directors and executive
officers
February 2026
• Review of compensation system for directors and executive
officers
March 2026 • Determination of individual compensation amounts for directors
and executive officers due to transfers effective April 1, 2026
• Review of compensation system for directors and executive
officers
<Management Structure of SuMi TRUST Group>
*1 CFO Committee , CRO Committee, and CCO Committee
*2 Direct instructions and reports related to the Audit Committee’s audits utilizing the internal control system
*3 Reporting on the execution of duties by the executive officer in charge of the Internal Audit Department
4 Establishment of advisory bodies: Sustainability Council, Corporate Communication Council, Asset Management Business Council, and Human Capital Council
Group Management
Strategy Planning
Function
Business
Operations
Management
Function4
Management
Resources Allocation
Function
Business Planning
Risk Management
Internal
Auditing
Holding
Company
Corporate Governance System
Compliance
Committee
*1
Internal Auditing
Managing Function
Compliance
Management
Supervising Function
Risk Management
Supervising Function
Directly Owned Companies
Directly
Owned
Companies
Audit Committee
Risk Committee
Conflicts of Interest
Committee
Compensation Committee
Board of
Directors
Nominating Committee
General Meeting of
Shareholders
Executive
Committee
Supervision
Execution
Direct instruction
and reporting
※
2
Internal auditing
Reporting on the status of execution of duties
※
3
Instruction and reporting on the department operations
President
Auditing
Sumitomo Mitsui Trust Group
<Outline of SuMi TRUST Group’s Timely Disclosure System>
Others SuMi TRUST Group companies
Timely Disclosure
Corporate Communication Council
Corporate Management
Departments
Directly owned companies SuMi TRUST Bank, etc.
Secretariat: Planning and Coordination Department, Corporate Administration Department
・
Reporting of important information
・
Requests for timely disclosure
Discussion and examination of
・Necessity of disclosure and appropriateness of
information being disclosed
・Appropriateness of operations, disclosure system
development, and measures for improvement
Cooperation
Chairperson: Officer in charge of the Planning and Coordination Department
Members: Officers in charge of Planning and Coordination, Corporate Administration,
Financial Planning, IR/SR, Corporate Planning, and Risk Management Departments


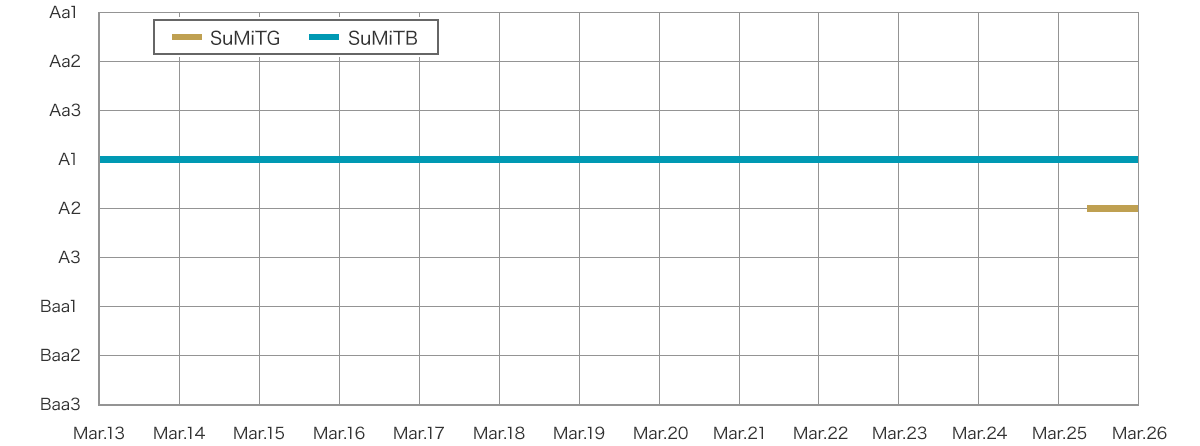
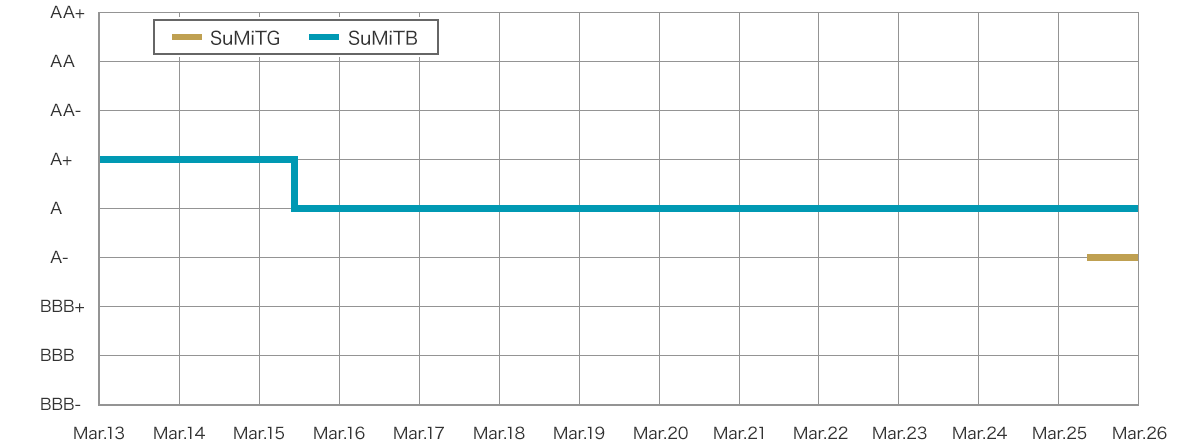
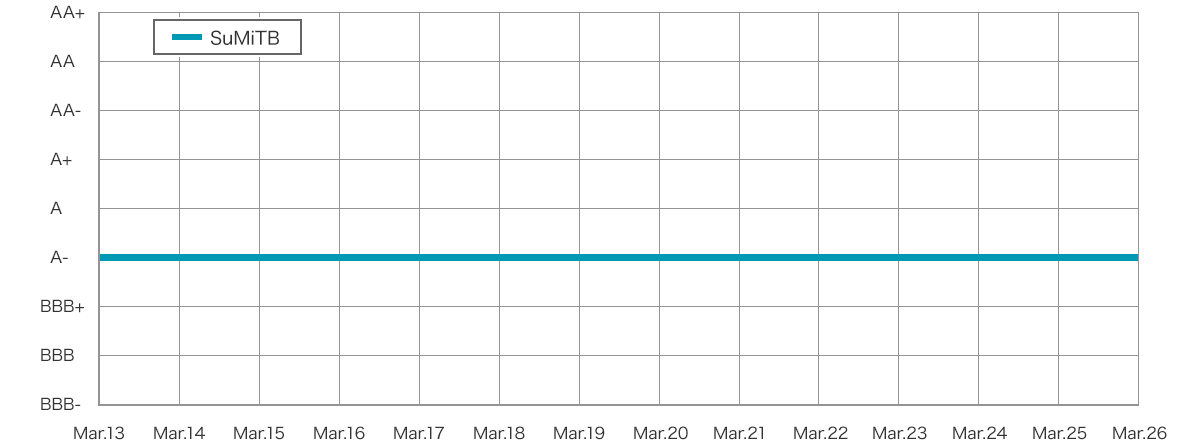
 (229KB)
 Symbol Mark
 Corporate Color


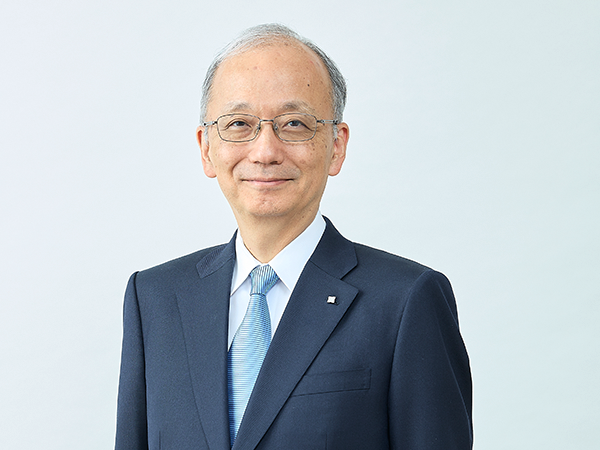
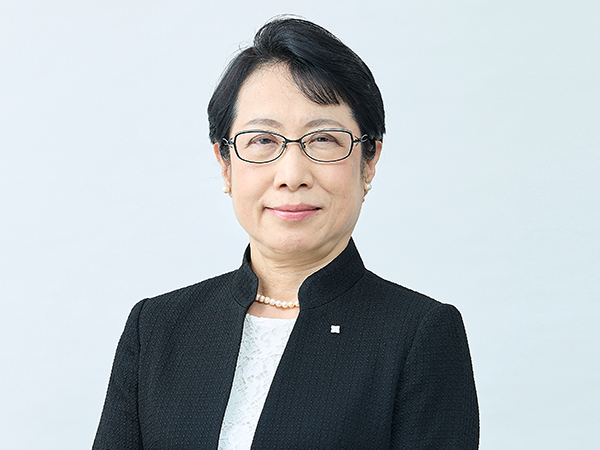
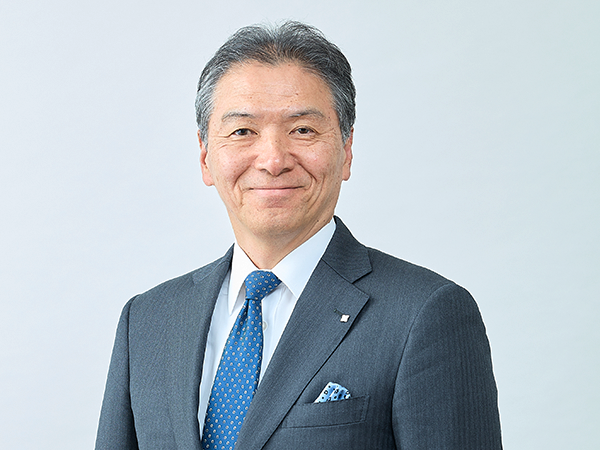
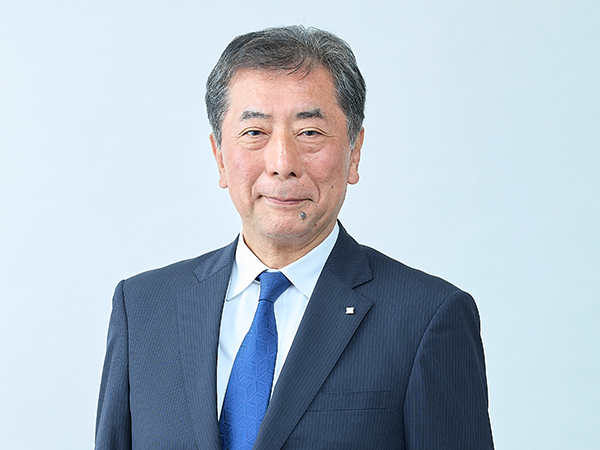
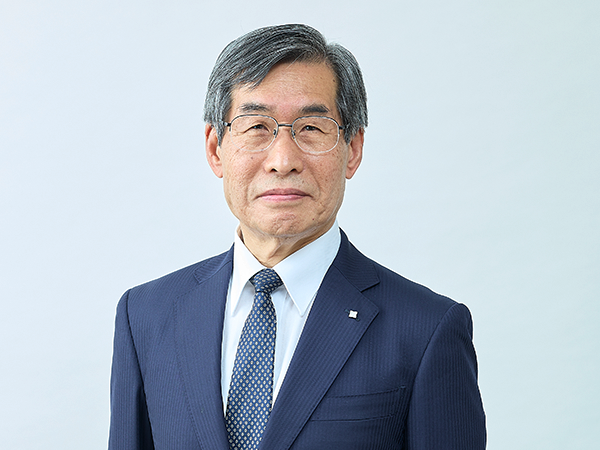
 History of the Group
 Organizational Chart
 Access