1 2026 年7月 17 日 各 位 会社名 加賀電子株式会社 代表者名 代表取締役 社長執行役員 門 良一 (コード番号:8154 東証プライム) 問合せ先 取締役 上席執行役員 管理本部長 石原 康広 TEL 03-5657-0111 新光商事株式会社(証券コード:8141)の普通株式に対する…
1
2026 年7月 17 日
各 位
会社名 加賀電子株式会社
代表者名 代表取締役 社長執行役員 門 良一
(コード番号:8154 東証プライム)
問合せ先
取締役 上席執行役員
管理本部長
石原 康広
TEL 03-5657-0111
新光商事株式会社(証券コード:8141)の普通株式に対する
公開買付けの買付条件等の変更に関するお知らせ
加賀電子株式会社(以下「公開買付者」といいます。)は、新光商事株式会社(証券コード:8141、株式会社
東京証券取引所(以下「東京証券取引所」といいます。)プライム市場上場、以下「対象者」といいます。)の
普通株式(以下「対象者株式」といいます。)を対象とした金融商品取引法(昭和 23 年法律第 25 号。その後の
改正を含みます。以下「法」といいます。)に基づく公開買付け(以下「本公開買付け」といいます。)を 2026
年5月 18 日より開始しておりますが、本日付の取締役会決議により、買付予定数の下限を 19,226,700 株から
15,988,500 株に変更することを決定いたしました。また、当該決定に伴い本公開買付けに係る公開買付届出書
の訂正届出書を提出する必要が生じたことから、本公開買付けにおける買付け等の期間(以下「公開買付期間」
といいます。)を、当該訂正届出書の提出日である 2026 年7月 17 日から起算して 10 営業日を経過した日に当
たる 2026 年8月3日まで延長し、公開買付期間を 55 営業日とすることといたしました。
これに伴い、2026 年5月 15 日付「新光商事株式会社(証券コード:8141)の普通株式に対する公開買付け
の開始に関するお知らせ」(2026 年6月 26 日付「新光商事株式会社(証券コード:8141)の普通株式に対する
公開買付けに係る公開買付期間延長のお知らせ」及び 2026 年7月 14 日付「新光商事株式会社(証券コード:
8141)の普通株式に対する公開買付けに係る公開買付期間延長のお知らせ」による変更を含みます。)の内容を
変更いたしますので、下記のとおりお知らせいたします。
なお、変更箇所には下線を付しております。
記
1.買付け等の概要
(変更前)
公開買付けの目的 完全子会社化
買付け等の期間 2026年5月18日(月曜日)から2026年7月29日(水曜日)まで(52営業日)
買付け等の価格 普通株式1株につき金1,580円
買付予定数の下限 19,226,700(株)
買付予定数の上限 ―(株)
対象者の意見
本公開買付けに賛同する旨の意見を表明するとともに、本公開買付けに応募するか否
かについては、対象者の株主の皆様のご判断に委ねる。
2
(注1)買付予定数の下限(19,226,700 株)について買付け等を行った場合における買付け等の後の株券等所
有割合は 66.67%です。なお、対象者が 2026 年5月15 日付で公表した「2026 年3月期決算短信〔日本
基準〕(連結)」(以下「対象者決算短信」といいます。)に記載された 2026 年3月 31 日現在の対象者の発
行済株式総数(31,010,566株)から、同日現在の対象者が所有する自己株式数(1,397,967株)(なお、当
該自己株式数には、対象者の「役員株式給付信託(BBT)」及び「従業員株式給付信託(J―ESOP)」の
信託財産として受託者である株式会社日本カストディ銀行(信託E口)が所有する対象者株式(1,062,700
株)を含めておりません。以下、対象者が所有する自己株式数について同じです。)を控除した株式数
(29,612,599 株、以下「本基準株式数」といいます。)に係る議決権の数(296,125 個)を分母として計算し
ております。
(変更後)
公開買付けの目的 完全子会社化
買付け等の期間 2026年5月18日(月曜日)から2026年8月3日(月曜日)まで(55営業日)
買付け等の価格 普通株式1株につき金1,580円
買付予定数の下限 15,988,500(株)
買付予定数の上限 ―(株)
対象者の意見
本公開買付けに賛同する旨の意見を表明するとともに、本公開買付けに応募するか否
かについては、対象者の株主の皆様のご判断に委ねる。
(注1)買付予定数の下限(15,988,500 株)について買付け等を行った場合における買付け等の後の株券等所
有割合は55.73%です。なお、対象者が2026年6月29日に提出した第73期有価証券報告書(以下「対
象者有価証券報告書」といいます。)に記載された 2026 年3月 31 日現在の対象者の発行済株式総数
(31,010,566株)から、同日現在の対象者が所有する自己株式数(1,397,967株)(なお、当該自己株式数
には、対象者の「役員株式給付信託(BBT)」及び「従業員株式給付信託(J―ESOP)」の信託財産として
受託者である株式会社日本カストディ銀行(信託E口)が所有する対象者株式(1,062,700株)(以下、対象
者の「役員株式給付信託(BBT)」の信託財産として受託者である株式会社日本カストディ銀行(信託E口)
が所有する対象者株式(471,500株)を「BBT所有株式」といいます。)を含めておりません。以下、対象者
が所有する自己株式数について同じです。)を控除した株式数(29,612,599 株、以下「本基準株式数」と
いいます。)に係る議決権の数(296,125個)を分母として計算しております。
2.買付け等の目的
(1)公開買付けの目的の概要
(変更前)
<前略>
公開買付者は、本公開買付けにおいて、19,226,700 株(所有割合:64.93%)を買付予定数の下限とし
て設定しており、本公開買付けに応募された株券等(以下「応募株券等」といいます。)の数の合計が買
付予定数の下限(19,226,700 株)に満たない場合は、応募株券等の全部の買付け等を行いません。他方、
上記のとおり、公開買付者は、対象者株式の全て(但し、公開買付者が所有する対象者株式及び対象者
が所有する自己株式を除きます。)を取得することにより、対象者を公開買付者の完全子会社とすること
を目的としていることから、買付予定数の上限は設定しておらず、応募株券等の数の合計が買付予定数
の下限(19,226,700 株)以上の場合は、応募株券等の全部の買付け等を行います。なお、買付予定数の
下限(19,226,700 株)については、本基準株式数に係る議決権の数(296,125 個)の3分の2(197,417
個)(小数点以下切上げ)に、対象者の単元株式数である 100 株を乗じた数(19,741,700 株)から、買
付者が所有する対象者株式数(515,000 株)を控除した株式数に設定しております。これは、公開買付
3
者が、本取引において、対象者を公開買付者の完全子会社とすることを目的としているところ、下記「(4)
公開買付け後の組織再編等の方針」の「② 株式併合」に記載の株式併合の手続を実施する際には、会社
法(平成 17 年法律第 86 号。その後の改正を含みます。以下「会社法」といいます。)第 309 条第2項に
規定する株主総会における特別決議が要件とされていることから、本取引の実施を確実に遂行すべく、
本公開買付け後に公開買付者が対象者の総株主の総議決権数の3分の2以上を所有することで、当該要
件を満たすことができるよう設定したものです。
<中略>
その後、公開買付者は、2026 年5月 18 日から本公開買付けを開始いたしましたが、対象者の株主の
皆様による本公開買付けへの応募状況及び今後の応募の見通し等を総合的に勘案し、対象者の株主の皆
様に本公開買付けへの応募について更なる判断機会を提供するため、2026 年6月 26 日、公開買付期間
(以下に定義します。以下同じです。)を 2026 年7月 14 日まで延長し、合計 42 営業日とすることを決
定いたしました。
その後、公開買付者は、対象者の株主の皆様による本公開買付けへの応募状況及び今後の応募の見通
し等を総合的に勘案し、対象者の株主の皆様に本公開買付けへの応募について更なる判断機会を提供す
るため、2026 年7月 14 日、公開買付期間を 2026 年7月 29 日まで延長し、合計 52 営業日とすること
(以下「本期間延長」といいます。)を決定いたしました。また、公開買付者としては、1,580 円という
本公開買付価格(以下に定義します。以下同じです。)は、対象者の価値を十分に反映した価格であり、
かつ、対象者の株主の皆様にとって最善なものと考えており、対象者の株主の皆様に対象者株式の合理
的な売却の機会を提供するものであると考えているため、本日現在、本期間延長後も本公開買付価格を
変更する予定はございません。
(変更後)
<前略>
公開買付者は、本公開買付けにおいて、15,988,500 株(所有割合:53.99%)を買付予定数の下限とし
て設定しており、本公開買付けに応募された株券等(以下「応募株券等」といいます。)の数の合計が買
付予定数の下限(15,988,500 株)に満たない場合は、応募株券等の全部の買付け等を行いません。他方、
上記のとおり、公開買付者は、対象者株式の全て(但し、公開買付者が所有する対象者株式及び対象者
が所有する自己株式を除きます。)を取得することにより、対象者を公開買付者の完全子会社とすること
を目的としていることから、買付予定数の上限は設定しておらず、応募株券等の数の合計が買付予定数
の下限(15,988,500 株)以上の場合は、応募株券等の全部の買付け等を行います。なお、買付予定数の
下限については、本公開買付けの開始の時点において、本基準株式数に係る議決権の数(296,125 個)
の3分の2(197,417 個)(小数点以下切上げ)に、対象者の単元株式数である 100 株を乗じた数
(19,741,700株)から、買付者が所有する対象者株式数(515,000株)を控除した株式数である19,226,700
株(所有割合:64.93%)に設定しておりました。これは、公開買付者が、本取引において、対象者を公
開買付者の完全子会社とすることを目的としているところ、下記「(4)公開買付け後の組織再編等の方
針」の「② 株式併合」に記載の株式併合の手続を実施する際には、会社法(平成 17 年法律第 86 号。そ
の後の改正を含みます。以下「会社法」といいます。)第 309 条第2項に規定する株主総会における特別
決議が要件とされていることから、本取引の実施を確実に遂行すべく、本公開買付け後に公開買付者が
対象者の総株主の総議決権数の3分の2以上を所有することで、当該要件を満たすことができるよう設
定したものです。
<中略>
その後、公開買付者は、2026 年5月 18 日から本公開買付けを開始いたしましたが、対象者の株主の
皆様による本公開買付けへの応募状況及び今後の応募の見通し等を総合的に勘案し、対象者の株主の皆
様に本公開買付けへの応募について更なる判断機会を提供するため、2026 年6月 26 日、公開買付期間
(以下に定義します。以下同じです。)を 2026 年7月 14 日まで延長し、合計 42 営業日とすることを決
4
定いたしました。
その後、公開買付者は、対象者の株主の皆様による本公開買付けへの応募状況及び今後の応募の見通
し等を総合的に勘案し、対象者の株主の皆様に本公開買付けへの応募について更なる判断機会を提供す
るため、2026 年7月 14 日、公開買付期間を 2026 年7月 29 日まで延長し、合計 52 営業日とすること
(以下「本期間延長」といいます。)を決定いたしました。また、公開買付者としては、1,580 円という
本公開買付価格(以下に定義します。以下同じです。)は、対象者の価値を十分に反映した価格であり、
かつ、対象者の株主の皆様にとって最善なものと考えており、対象者の株主の皆様に対象者株式の合理
的な売却の機会を提供するものであると考えているため、2026 年7月 14 日現在、本期間延長後も本公
開買付価格を変更する予定はない旨を公表いたしました。
また、公開買付者は、本公開買付けの公表後、一部の期間において対象者株式の市場株価が本公開買
付価格(1,580 円)を上回る水準で推移していたことを受けて、2026 年7月上旬、対象者株式の非公開
化に支障が生じない範囲内において、本公開買付けの成立の確実性を高めることを目的として、買付予
定数の下限の引き下げの可能性についても検討いたしました。
これらの検討を通じて、公開買付者は、本臨時株主総会(下記「(4)公開買付け後の組織再編等の方
針」の「② 株式併合」において定義します。以下同じです。)において、実際に行使される議決権の数
は不明であるものの、対象者の過去5年間の定時株主総会における議決権行使比率に着目した場合、議
決権行使比率の平均値は 78.11%(小数点以下第三位を四捨五入。以下、議決権行使比率の計算につい
て他に取扱いを定めない限り同じです。)、最大値は 84.95%となっており(注2)、保守的に平均値では
なく最大値である 84.95%を用いた場合でも、当該数値に株主総会の特別決議に必要となる3分の2を
乗じた 56.63%に相当する議決権の数を確保できれば、本臨時株主総会において本株式併合(下記「(4)
公開買付け後の組織再編等の方針」の「② 株式併合」において定義します。以下同じです。)に係る議
案が可決されない事態が生じる可能性を合理的に防ぎつつ、本公開買付けの成立の確実性を高めること
が可能であると考えるに至りました。
(注2)対象者有価証券報告書によれば、2026 年6月 25 日開催の第 73 期定時株主総会の基準日におけ
る総議決権の数は 295,931 個でしたが、当該議決権数から、対象者株式の議決権を一律不行使と
する旨が規定されているBBT所有株式に係る議決権の数(4,715 個)を控除した議決権の数は
291,216 個となるところ、全議案中最大の議決権行使数は 220,297 個であり、上記議決権の数
(291,216 個)に対する議決権行使比率は 75.65%に相当します。同様に過年度の全議案中最大
の議決権行使比率を算定すると、2025 年6月 25 日開催の第 72 期定時株主総会は 70.93%、2024
年6月 25 日開催の第 71 期定時株主総会は 76.52%、2023 年6月 23 日開催の第 70 期定時株主
総会は 82.47%、2022 年6月 24 日開催の第 69 期定時株主総会は 84.95%となり、対象者の過去
5年間の定時株主総会における議決権行使比率の最大値は 84.95%となります。
以上のような検討を経て、2026 年7月 14 日、公開買付者は、対象者に対して、上記の検討結果と合
わせて、本基準株式数(29,612,599 株)から、BBT所有株式(471,500 株)(注3)を控除した株式数
(29,141,099 株)に係る議決権の数(291,410 個)に対して、対象者の過去5年間の定時株主総会にお
ける議決権行使比率の最大値である 84.95%を乗じた議決権の数(247,552 個)に株主総会の特別決議の
可決に要する議決権比率である3分の2を乗じた議決権の数(165,035 個)(小数点以下切上げ)に対象
者の単元株式数である 100 を乗じて算出される株式数(16,503,500 株)から、公開買付者が所有する対
象者株式数(515,000 株)を控除した株式数(15,988,500 株、所有割合:53.99%)を買付予定数の下限
としたい旨の提案を行いました。
(注3)BBT所有株式については、法令上、議決権が存在するものの、対象者と株式給付信託の受託
者であるみずほ信託銀行株式会社(以下「みずほ信託銀行」といいます。)との間で締結されて
いる株式給付信託契約書(当該信託に係る信託管理人が従うべき信託管理人ガイドラインを含
みます。)において、本公開買付けのように対象者取締役会が賛同の意見を表明した公開買付け
5
においては、信託管理人は当該公開買付けに応募する旨の指示は行わない旨が規定されている
ため、本公開買付けへの応募が想定されず、また、みずほ信託銀行は信託管理人の指図に基づき
当該対象者株式の議決権を一律不行使とする旨が規定されているため議決権を行使することが
事実上想定されていないことを踏まえ、本取引を確実に実施できるよう本公開買付けの買付予
定数の下限の計算にあたっては、本基準株式数(29,612,599 株)から控除しております。
これに対して、2026 年7月 16 日、本特別委員会(下記「③ 対象者の公開買付けに関する意見の内容、
根拠及び理由」の「(i)検討体制の構築の経緯」に定義します。以下同じです。)から、慎重な協議及び
検討の結果、公開買付者が提案する買付予定数の下限の引き下げが行われた場合においても、本公開買
付けに賛同する旨の意見を表明するとともに、本公開買付けに応募するか否かについては、対象者の株
主の皆様のご判断に委ねる旨の意見を維持する予定である旨の回答を受領いたしました。
以上の検討・協議を経て、公開買付者は、2026 年7月 17 日付の取締役会決議により、買付予定数の
下限を 19,226,700 株(所有割合:64.93%)から 15,988,500 株(所有割合:53.99%)に変更する(以
下「本買付条件変更」といいます。)ことを決定いたしました。また、公開買付者は、公開買付期間を 2026
年5月 18 日(月曜日)から 2026 年7月 29 日(水曜日)まで(52 営業日)と定めておりましたが、本
買付条件変更を決定したことに伴う本公開買付けに係る公開買付届出書の訂正届出書の提出により、法
令に基づき、公開買付期間を当該訂正届出書の提出日である 2026 年7月 17 日から起算して 10 営業日
を経過した日に当たる 2026 年8月3日(月曜日)まで延長することといたしました。なお、公開買付者
としては、1,580 円という本公開買付価格は、対象者の価値を十分に反映した価格であり、かつ、対象
者の株主の皆様にとって最善なものと考えており、対象者の株主の皆様に対象者株式の合理的な売却の
機会を提供するものであると考えているため、本日現在においても、本公開買付価格を変更する予定は
ございません。
なお、本公開買付けにおいては、上記のとおり、買付予定数の下限を対象者の総株主の議決権の数の
3分の2に相当する議決権の数を確保できる株式数に設定していないことから、本公開買付けの成立後、
公開買付者が所有する対象者の議決権が対象者の総株主の議決権の数の3分の2を下回る場合、本株式
併合に係る議案が本臨時株主総会において承認されない可能性も理論上は否定できません。
しかし、仮に、当該承認が得られない場合であっても、公開買付者は、最終的に対象者株式の全て(但
し、公開買付者が所有する対象者株式及び対象者が所有する自己株式を除きます。)を取得し、対象者株
式の非公開化を行う方針であることから、本公開買付けにおける応募状況、当該時点における対象者の
株主の所有状況・属性、市場株価の動向並びに本臨時株主総会における議決権行使比率等も踏まえた上
で、本株式併合に係る議案が対象者の株主総会において現実的に承認される水準に至るまで、新たな公
開買付け又は市場内での買付け若しくは市場外での相対取得の方法により、対象者株式を追加取得し、
対象者株式の非公開化を目指す予定です。当該追加取得に関しては、公開買付者は、対象者が株式併合
又は株式分割等、支払う対価の調整を要する行為を行わない限り、新たな公開買付けの場合は買付予定
数の上限・下限を設定せず、本公開買付価格と同一の価格により、市場内取引の場合は市場価格により、
市場内取引以外の方法による場合は本公開買付価格と同一の価格により、対象者株式を取得する方針で
す。このような追加取得の具体的な時期及び方法並びにその後の株主総会による本株式併合に係る議案
の承認までに要する期間については、市況等の諸事情によるため現時点で決定することはできませんが、
公開買付者としては実務上可能な限り速やかに本株式併合が実施されるように最大限努めるものといた
します。
また、対象者が 2026 年7月 17 日付で公表した「(変更)「加賀電子株式会社による当社株式に対する
公開買付けに関する意見表明に関するお知らせ」の一部変更について」(以下「変更後対象者プレスリリ
ース」といいます。)によれば、対象者は、2026 年7月 17 日開催の対象者取締役会において、本公開買
付けに賛同する旨の意見を表明するとともに、本公開買付けに応募するか否かについては、対象者の株
6
主の皆様のご判断に委ねる旨の意見を維持することを決議したとのことです。
(2)公開買付けを実施するに至った背景、目的及び意思決定の過程並びに買付け等後の経営方針
① 公開買付者が公開買付けの実施を決定するに至った背景、目的及び意思決定の過程
(変更前)
<前略>
また、公開買付者は、2026 年2月2日に本特別委員会(下記「③ 対象者の公開買付けに関する意見
の内容、根拠及び理由」の「(i)検討体制の構築の経緯」に定義します。以下同じです。)より書面で
受領した(i)本取引の検討背景、(ii)本取引の意義・目的、(iii)本取引のストラクチャー・経済条
件・スケジュール、(iv)本取引実施後の経営方針・ガバナンスその他についての質問に対し、2026 年
2月 10 日に書面での回答を行い、2026 年2月 16 日に口頭での説明を行いました。
<中略>
以上の検討・協議・交渉の結果、公開買付者は、本日付の取締役会決議により、本取引の一環として、
本公開買付価格を 1,580 円(本公開買付価格の詳細については、下記「② 買付け等の価格の算定の経
緯及び基礎」をご参照ください。)として本公開買付けを実施することを決定いたしました。
(変更後)
<前略>
また、公開買付者は、2026 年2月2日に本特別委員会より書面で受領した(i)本取引の検討背景、
(ii)本取引の意義・目的、(iii)本取引のストラクチャー・経済条件・スケジュール、(iv)本取引実
施後の経営方針・ガバナンスその他についての質問に対し、2026 年2月 10 日に書面での回答を行い、
2026 年2月 16 日に口頭での説明を行いました。
<中略>
以上の検討・協議・交渉の結果、公開買付者は、2026 年5月 15 日付の取締役会決議により、本取引
の一環として、本公開買付価格を 1,580 円(本公開買付価格の詳細については、下記「② 買付け等の
価格の算定の経緯及び基礎」をご参照ください。)として本公開買付けを実施することを決定いたしま
した。
その後、上記「(1)公開買付けの目的の概要」に記載のとおり、2026 年7月 14 日、公開買付者は、
対象者に対して、上記の検討結果と合わせて、本基準株式数(29,612,599 株)から、BBT所有株式
(471,500 株)を控除した株式数(29,141,099 株)に係る議決権の数(291,410 個)に対して、対象者
の過去5年間の定時株主総会における議決権行使比率の最大値である 84.95%を乗じた議決権の数
(247,552 個)に株主総会の特別決議の可決に要する議決権比率である3分の2を乗じた議決権の数
(165,035 個)(小数点以下切上げ)に対象者の単元株式数である 100 を乗じて算出される株式数
(16,503,500 株)から、公開買付者が所有する対象者株式数(515,000 株)を控除した株式数(15,988,500
株、所有割合:53.99%)を買付予定数の下限としたい旨の提案を行いました。
これに対して、2026 年7月 16 日、本特別委員会から、慎重な協議及び検討の結果、公開買付者が提
案する買付予定数の下限の引き下げが行われた場合においても、本公開買付けに賛同する旨の意見を
表明するとともに、本公開買付けに応募するか否かについては、対象者の株主の皆様のご判断に委ねる
旨の意見を維持する予定である旨の回答を受領いたしました。
③ 対象者の公開買付けに関する意見の内容、根拠及び理由
(iii)対象者の意思決定の内容
(変更前)
<前略>
なお、上記取締役会決議の詳細については、下記「(3)公開買付けの公正性を担保するための
7
措置」の「⑤ 対象者における利害関係を有しない取締役(監査等委員である取締役を含む。)全員
の承認」をご参照ください。
(変更後)
<前略>
なお、上記取締役会決議の詳細については、下記「(3)公開買付けの公正性を担保するための
措置」の「⑤ 対象者における利害関係を有しない取締役(監査等委員である取締役を含む。)全員
の承認」をご参照ください。
その後、対象者及び本特別委員会は、2026 年7月 14 日、公開買付者から、本買付条件変更に関
する提案を受けたため、当該提案の妥当性及び本特別委員会から対象者取締役会に提出された本
答申書において表明された、本取引に係る本特別委員会の答申の内容に変更があるかについて、三
菱UFJモルガン・スタンレー証券及びアンダーソン・毛利・友常法律事務所の助言も参考に、2026
年7月 16 日に開催された特別委員会及び電子メールを通じて慎重に協議・検討を行ったとのこと
です。その後、対象者は、本特別委員会から、当該検討結果として、2026 年7月 17 日付「追加答
申書」(以下「本追加答申書」といいます。)の提出を受け、本買付条件変更を踏まえても、本答申
書における、対象者取締役会が、本公開買付けに賛同の意見を表明することは相当と認められるも
のの、本公開買付けに応募するか否かは対象者の株主の皆様の判断に委ねる旨の意見を表明する
ことが相当である旨の答申内容について、いずれの点についても変更はない旨の答申を得たとの
ことです。本追加答申書の内容は、大要、以下のとおりとのことです。
1. 「本取引は対象者の企業価値の向上に資するものであって、その目的は正当性・合理性を
有すると認められる」旨の意見を変更する必要はないこと。
・ 本答申書の提出以降、本取引の意義・目的、並びにメリット及びデメリットに重大
な変化は生じていない。
2. 「本取引の条件(買収対価の水準、買収の方法及び買収対価の種類その他の本取引の条件
を含む。)について妥当性を欠くものではないが、本公開買付価格が本公開買付けへの応
募を積極的に推奨できる水準の価格に達しているとまでは認められないことから、対象
者株主に対して本公開買付けへの応募を推奨すべきとまではいえない」旨の意見を変更
する必要はないこと。
・ 本公開買付価格に変更はなく、本公開買付けへの応募を積極的に推奨できる水準の
価格に依然として達しているとまでは認められない。
3. 「本取引に係る手続の公正性は確保されていると認められる」旨の意見を変更する必要
はないこと。
・ 本公開買付けを含む本取引に係る交渉過程及び意思決定に至る手続の公正性の確保
については、本特別委員会が本答申書で指摘した、(1)特別委員会の設置及び特別
委員会からの答申書の取得、(2)意思決定のプロセス、(3)独立したリーガル・
アドバイザーからの助言の取得、(4)独立した第三者算定機関からの株式価値算定
書の取得、(5)公開買付けの公正性を担保する客観的状況の確保、(6)マーケッ
ト・チェック及び(8)一般株主への情報提供の充実とプロセスの透明性の向上の
各項目の内容について、(5)及び(6)に関して本公開買付けの買付期間が 55 営
業日に延長される予定であることから、いずれも公正性に資する事情変更が生じた
ことのほかは、いずれも本追加答申書作成日(2026 年7月 17 日)時点においても
変更されておらず、引き続き維持されている。
8
・ 他方で、まず、(7)マジョリティ・オブ・マイノリティ(Majority of
Minority)の項目との関係では、本買付条件変更後の本公開買付けにおけ
る買付予定数の下限(15,988,500 株)が、マジョリティ・オブ・マイノリティ条件
を満たしていない。
・ もっとも、M&A指針 3.5.2 においては、取引阻害効果の懸念等から、マジョリテ
ィ・オブ・マイノリティ条件の設定は必須とはされておらず、対象会社の取締役会
や特別委員会において、「当該M&Aにおける具体的状況を踏まえて、マジョリティ・
オブ・マイノリティ条件の設定の有効性や弊害の有無等を総合的に判断し、その要
否を検討することが望ましいと考えられる。」とされている。
・ 公開買付者によれば、本公開買付けにおいて、マジョリティ・オブ・マイノリティ
の買付予定数の下限を設定すると、本公開買付けの成立を不安定なものとし、かえ
って本公開買付けに応募することを希望する対象者の一般株主の利益に資さない可
能性もある。
・ 他の公正性担保措置の内容によって対象者の少数株主の利益に十分な配慮がなされ
ていることにも鑑みて、マジョリティ・オブ・マイノリティ条件を設定しないこと
をもって、本取引の手続の公正性が損なわれるものではない。
・ また、(9)強圧性の排除の観点についても、本買付条件変更後の買付予定数の下限
が、本公開買付けの成立後に、本株式併合を確実に実施できる株式数に設定されて
いないため、これによって強圧性が生じる可能性を検討する必要がある。
・ しかし、公開買付者からの説明によれば、本株式併合を行うこと及び本株式併合の
効力発生を条件として単元株式数の定めを廃止する旨の定款の一部変更を行うこと
を付議議案に含む本臨時株主総会において、実際に行使される議決権の数は不明で
あるものの、対象者の過去5年間の定時株主総会における議決権行使比率に着目し
た場合、議決権行使比率の平均値は 78.11%(小数点以下第三位を四捨五入。以下、
議決権行使比率の計算について他に取扱いを定めない限り同じである。)、最大値は
84.95%となっており、保守的に平均値ではなく最大値である 84.95%を用いた場合
でも、当該数値に株主総会の特別決議に必要となる3分の2を乗じた 56.63%に相
当する議決権の数を確保できれば、本臨時株主総会において本株式併合に係る議案
が可決されない事態が生じる可能性を合理的に防ぎつつ、本公開買付けの成立の確
実性を高めることが可能であることから、本基準株式数(29,612,599 株)から、B
BT所有株式(471,500 株)を控除した株式数(29,141,099 株)に係る議決権の数
(291,410 個)に対して、対象者の過去5年間の定時株主総会における議決権行使
比率の最大値である 84.95%を乗じた議決権の数(247,552 個)に株主総会の特別決
議の可決に要する議決権比率である3分の2を乗じた議決権の数(165,035 個)(小
数点以下切上げ)に対象者の単元株式数である 100 を乗じて算出される株式数
(16,503,500 株)から、公開買付者が所有する対象者株式数(515,000 株)を控除
した株式数(15,988,500 株、所有割合:53.99%)を買付予定数の下限としたい旨の
提案を行ったとのことである。
・ なお、公開買付者によれば、本公開買付けの成立後において公開買付者が実質的に
所有する対象者株式に係る議決権の数が対象者の総株主の議決権の数の3分の2を
下回る場合においても、公開買付者は本臨時株主総会を開催することを要請する予
定とのことである。公開買付者としては、本公開買付けの成立後、万が一、本臨時
株主総会において本株式併合に係る議案が可決されない場合であっても、最終的に
対象者株式の全て(但し、公開買付者が所有する対象者株式及び対象者が所有する
自己株式を除く。)を取得し、対象者株式の非公開化を行う方針であることから、本
9
公開買付けへの応募状況、当該時点における対象者の株主の所有状況・属性、対象
者株式の市場株価の動向並びに本臨時株主総会における議決権行使比率等も踏まえ
た上で、本株式併合に係る議案が対象者の株主総会において現実的に承認される水
準に至るまで、新たな公開買付け又は市場内での買付け若しくは市場外での相対取
得の方法により、対象者株式を追加取得し、対象者株式の非公開化を目指す予定と
のことである。当該追加取得に関しては、公開買付者は、対象者が株式併合又は株
式分割等、支払う対価の調整を要する行為を行わない限り、新たな公開買付けの場
合は買付予定数の上限・下限を設定せず、本公開買付価格と同一の価格により、市
場内取引の場合は市場価格により、市場内取引以外の方法による場合は本公開買付
価格と同一の価格により、対象者株式を取得する方針とのことである。公開買付者
は、当該追加取得の結果、本株式併合に係る議案の可決が合理的に可能と見込まれ
ると判断した場合(なお、本臨時株主総会における本株式併合に係る議案への反対
の議決権の数等を踏まえて判断する予定とのことである。)、対象者に対し、改めて
本株式併合を行うこと及び本株式併合の効力発生を条件として単元株式数の定めを
廃止する旨の定款の一部変更を行うことを付議議案に含む本臨時株主総会の開催を
要請する予定とのことである。
・ 以上の公開買付者の説明に不合理な点が見当たらず、また、本株式併合に係る議案
の成立に必要な対象者株式の数の推計に当たって、対象者の過去5年間における定
時株主総会の議決権行使比率の平均値である 78.11%ではなく、保守的に、それよ
りも相当程度割合が高い最大値である 84.95%を用いていることを併せて考慮すれ
ば、本公開買付けが成立した場合に対象者株式の非公開化が実現されない可能性は
相当程度低いと認められ、また、対象者の株主に対し、本公開買付けの成立後にお
ける本株式併合の確実性や、本公開買付けの成立後、本臨時株主総会において本株
式併合に係る議案が否決された場合の追加取得の方針に関して詳細な開示が予定さ
れていることからすれば、本買付条件変更後においても、引き続き、強圧性は排除
又は十分に低減されているものと考えられる。
4. 「上記1.から3.を踏まえ、本取引を行うことが対象者の一般株主(東京証券取引所有価
証券上場規程第 441 条の2における「少数株主」と同義である。)にとって不利益なもの
ではないと認められる」旨の意見を変更する必要はないこと。
・ 上記1.乃至3.について、いずれも本答申書から意見を変更する必要はないと考え
られることを踏まえると、「上記1.から3.を踏まえ、本取引を行うことが対象者の
一般株主(東京証券取引所有価証券上場規程第 441 条の2における「少数株主」と
同義である。)にとって不利益なものではないと認められる」旨の意見を変更する必
要はない。
5. 「対象者取締役会が本公開買付けに賛同の意見を表明することは相当であると認められ
る。しかし、対象者取締役会が対象者の株主に対して本公開買付けに応募するか否かにつ
いて中立の立場をとり、株主の判断に委ねることが相当である」旨の意見を変更する必要
はないこと。
・ 上記1.乃至4.について、いずれも本答申書から意見を変更する必要はないと考え
られることを踏まえると、「対象者取締役会が本公開買付けに賛同の意見を表明する
ことは相当であると認められる。しかし、対象者取締役会が対象者の株主に対して
本公開買付けに応募するか否かについて中立の立場をとり、株主の判断に委ねるこ
とが相当である」旨の意見を変更する必要はない。
10
対象者は、上記の本追加答申書の答申を踏まえ、2026 年7月 17 日付取締役会において、引き続
き本公開買付けに賛同の意見を表明するとともに、本公開買付けに応募するか否かについては、対
象者の株主の皆様のご判断に委ねる旨の意見を維持することを決議したとのことです。
(3)公開買付けの公正性を担保するための措置
(変更前)
本日現在において、対象者は公開買付者の子会社及び関連会社ではなく、本公開買付けは支配株主に
よる公開買付け及びその他の関係会社による公開買付けには該当いたしません。また、対象者の経営陣
の全部又は一部が公開買付者に直接又は間接に出資することも予定されておらず、本公開買付けを含む
本取引は、いわゆるマネジメント・バイアウト(MBO)(注1)にも該当いたしません。もっとも、本
公開買付けは対象者を公開買付者の完全子会社とすることを目的の一環として実施されるものであるこ
とを踏まえ、対象者の株主の皆様の利益保護の観点から、公開買付者及び対象者は、本公開買付けの公
正性、透明性及び客観性を確保すべく、以下の措置を講じております。なお、以下の記載のうち、対象
者において実施した措置については、対象者から受けた説明に基づくものです。
<中略>
④ 対象者における独立した特別委員会の設置及び特別委員会からの答申書の取得
<中略>
(iii)本取引における判断内容
<中略>
5. 対象者取締役会が、本公開買付けに賛同の意見を表明すること及び対象者の株主に対し
て本公開買付けに応募することを推奨することの是非
諮問事項1.から4.において検討したとおり、対象者取締役会が、本公開買付けについ
て賛同の意見を表明することは相当である。他方で、本公開買付価格は、対象者の一般株
主に投資回収機会を提供する観点では一定の合理性があり、妥当性を欠くものとは認め
られないものの、本公開買付価格が本公開買付けへの応募を積極的に推奨できる水準の
価格に達しているとまでは認められないことから、対象者株主に対して本公開買付けへ
の応募を推奨することまではできず、本公開買付けに応募するか否かは対象者の株主の
判断に委ねる旨の意見を表明することが相当であると認められる。
⑤ 対象者における利害関係を有しない取締役(監査等委員である取締役を含む。)全員の承認
<中略>
上記の対象者取締役会においては、対象者の取締役(監査等委員である者を含みます。)11 名におい
て審議の上、その全員一致で本公開買付けに賛同の意見を表明するとともに、本公開買付けに応募する
か否かについては、対象者の株主の皆様のご判断に委ねることを決議したとのことです。なお、上記の
取締役会に参加した取締役 11 名において、公開買付者と兼職関係にある等、特別な利害関係を有する
役員は存在していないとのことです。
⑥ マジョリティ・オブ・マイノリティ(Majority of Minority)を満たす買付予定
数の下限の設定
公開買付者は、本公開買付けにおいて、買付予定数の下限を 19,226,700 株(所有割合:64.93%)と
設定しており、応募株券等の数の合計が買付予定数の下限(19,226,700 株)に満たない場合には、応
募株券等の全部の買付け等を行いません。なお、買付予定数の下限である 19,226,700 株(所有割合:
64.93%)は、本基準株式数から、公開買付者が所有する対象者株式数(515,000 株)及び本応募合意株
式数(8,900,700 株)を控除した株式数(20,196,899 株)を2で除した株式数(10,098,450 株(小数
11
点以下切上げ)、所有割合:34.10%)に、本応募合意株式数(8,900,700 株)を加算した株式数(18,999,150
株、所有割合:64.16%)を上回っております。これは、買付予定数の下限から本応募合意株式数を控
除した数が、公開買付者と重要な利害関係を有さない対象者の株主が所有する対象者株式の数の過半
数、いわゆる「マジョリティ・オブ・マイノリティ(Majority of Minority)」
に相当する数を上回っていることを意味しています。
これにより、公開買付者は、対象者の一般株主の意思を重視して、公開買付者と重要な利害関係を有
さない株主の過半数の賛同が得られない場合には、本公開買付けを含む本取引を行わないこととして
おります。
⑦ 本公開買付けの公正性を担保する客観的状況の確保
公開買付者は、法令に定められた公開買付けに係る買付け等の最短期間は 20 営業日であるところ、
公開買付期間を法令に定められた最短期間よりも長期間である 52 営業日としております。公開買付期
間を法令で定められた期間と比較して長期に設定することにより、対象者の株主の皆様に対して本公
開買付けに対する応募につき適切な判断機会を確保し、もって本公開買付価格の公正性を担保するこ
とを企図しております。
<中略>
⑧ 強圧性の排除
公開買付者は、下記「(4)公開買付け後の組織再編等の方針」に記載のとおり、(i)本公開買付け
の決済の完了後速やかに、公開買付者が本公開買付けの成立により取得する株式数に応じて、本株式売
渡請求(下記「(4)公開買付け後の組織再編等の方針」の「① 株式売渡請求」において定義します。
以下同じです。)をすること又は本臨時株主総会(下記「(4)公開買付け後の組織再編等の方針」の「②
株式併合」において定義します。以下同じです。)において、本株式併合(下記「(4)公開買付け後の
組織再編等の方針」の「② 株式併合」において定義します。以下同じです。)を行うこと及び本株式併
合の効力発生を条件として単元株式数の定めを廃止する旨の定款の一部変更を行うことを付議議案に
含めることを対象者に要請する予定であり、対象者の株主の皆様に対して、株式買取請求権又は価格決
定申立権が確保されない手法は採用しないこと、(ii)本株式売渡請求又は本株式併合をする際に、対
象者の株主の皆様に対価として交付される金銭は本公開買付価格に当該各株主(但し、公開買付者及び
対象者を除きます。)の所有する対象者株式の数を乗じた価格と同一となるように算定されることを明
らかとしていることから、対象者の株主の皆様が本公開買付けに応募するか否かについて適切に判断
を行う機会を確保し、これをもって強圧性が生じないように配慮しております。
(変更後)
本日現在において、対象者は公開買付者の子会社及び関連会社ではなく、本公開買付けは支配株主に
よる公開買付け及びその他の関係会社による公開買付けには該当いたしません。また、対象者の経営陣
の全部又は一部が公開買付者に直接又は間接に出資することも予定されておらず、本公開買付けを含む
本取引は、いわゆるマネジメント・バイアウト(MBO)(注1)にも該当いたしません。もっとも、本
公開買付けは対象者を公開買付者の完全子会社とすることを目的の一環として実施されるものであるこ
とを踏まえ、対象者の株主の皆様の利益保護の観点から、公開買付者及び対象者は、本公開買付けの公
正性、透明性及び客観性を確保すべく、以下の措置を講じております。なお、公開買付者は、本買付条
件変更を経て、本公開買付けにおいて、いわゆる「マジョリティ・オブ・マイノリティ(Majori
ty of Minority)」の買付予定数の下限を設定しておりませんが、本公開買付けにおい
て、いわゆる「マジョリティ・オブ・マイノリティ(Majority of Minority)」の
買付予定数の下限を設定すると、本公開買付けの成立を不安定なものとし、かえって本公開買付けに応
募することを希望する対象者の一般株主の皆様の利益に資さない可能性もあるものと考えております。
また、以下の①から⑦までの措置が講じられていることから、対象者の一般株主の皆様の利益には十分
12
な配慮がなされていると考えております。また、以下の記載のうち、対象者において実施した措置につ
いては、対象者から受けた説明に基づくものです。
<中略>
④ 対象者における独立した特別委員会の設置及び特別委員会からの答申書の取得
<中略>
(iii)本取引における判断内容
<中略>
5. 対象者取締役会が、本公開買付けに賛同の意見を表明すること及び対象者の株主に対し
て本公開買付けに応募することを推奨することの是非
諮問事項1.から4.において検討したとおり、対象者取締役会が、本公開買付けについ
て賛同の意見を表明することは相当である。他方で、本公開買付価格は、対象者の一般株
主に投資回収機会を提供する観点では一定の合理性があり、妥当性を欠くものとは認め
られないものの、本公開買付価格が本公開買付けへの応募を積極的に推奨できる水準の
価格に達しているとまでは認められないことから、対象者株主に対して本公開買付けへ
の応募を推奨することまではできず、本公開買付けに応募するか否かは対象者の株主の
判断に委ねる旨の意見を表明することが相当であると認められる。
(iv)本追加答申書についての検討等の経緯及び判断内容
その後、上記「(2)公開買付けを実施するに至った背景、目的及び意思決定の過程並びに買付
け等後の経営方針」の「③ 対象者の公開買付けに関する意見の内容、根拠及び理由」に記載のと
おり、本特別委員会は、公開買付者から、本買付条件変更に関する提案を受けたため、三菱UFJ
モルガン・スタンレー証券及びアンダーソン・毛利・友常法律事務所の助言も参考に、慎重に協議・
検討を重ねた結果、2026 年7月 17 日付で、対象者取締役に対し、委員全員の一致で、本追加答申
書を提出したとのことです。本追加答申書の内容は、大要、上記「(2)公開買付けを実施するに
至った背景、目的及び意思決定の過程並びに買付け等後の経営方針」の「③ 対象者の公開買付け
に関する意見の内容、根拠及び理由」に記載のとおりとのことです。
⑤ 対象者における利害関係を有しない取締役(監査等委員である取締役を含む。)全員の承認
<中略>
上記の対象者取締役会においては、対象者の取締役(監査等委員である者を含みます。)11 名におい
て審議の上、その全員一致で本公開買付けに賛同の意見を表明するとともに、本公開買付けに応募する
か否かについては、対象者の株主の皆様のご判断に委ねることを決議したとのことです。なお、上記の
取締役会に参加した取締役 11 名において、公開買付者と兼職関係にある等、特別な利害関係を有する
役員は存在していないとのことです。
その後、対象者は、上記「(2)公開買付けを実施するに至った背景、目的及び意思決定の過程並び
に買付け等後の経営方針」の「③ 対象者の公開買付けに関する意見の内容、根拠及び理由」に記載の
とおり、本追加答申書の答申を踏まえ、2026 年7月 17 日付取締役会において、対象者の取締役(監査
等委員である者を含みます。)11 名において審議の上、その全員一致で本買付条件変更を踏まえても引
き続き本公開買付けに賛同の意見を表明するとともに、本公開買付けに応募するか否かについては、対
象者の株主の皆様のご判断に委ねる旨の意見を維持することを決議したとのことです。なお、上記の取
締役会に参加した取締役 11 名において、公開買付者と兼職関係にある等、特別な利害関係を有する役
員は存在していないとのことです。
⑥ 本公開買付けの公正性を担保する客観的状況の確保
公開買付者は、法令に定められた公開買付けに係る買付け等の最短期間は 20 営業日であるところ、
13
公開買付期間を法令に定められた最短期間よりも長期間である 55 営業日としております。公開買付期
間を法令で定められた期間と比較して長期に設定することにより、対象者の株主の皆様に対して本公
開買付けに対する応募につき適切な判断機会を確保し、もって本公開買付価格の公正性を担保するこ
とを企図しております。
<中略>
⑦ 強圧性の排除
公開買付者は、下記「(4)公開買付け後の組織再編等の方針」に記載のとおり、(i)本公開買付け
の決済の完了後速やかに、公開買付者が本公開買付けの成立により取得する株式数に応じて、本株式売
渡請求(下記「(4)公開買付け後の組織再編等の方針」の「① 株式売渡請求」において定義します。
以下同じです。)をすること又は本臨時株主総会において、本株式併合を行うこと及び本株式併合の効
力発生を条件として単元株式数の定めを廃止する旨の定款の一部変更を行うことを付議議案に含める
ことを対象者に要請する予定であり、対象者の株主の皆様に対して、株式買取請求権又は価格決定申立
権が確保されない手法は採用しないこと、(ii)本株式売渡請求又は本株式併合をする際に、対象者の
株主の皆様に対価として交付される金銭は本公開買付価格に当該各株主(但し、公開買付者及び対象者
を除きます。)の所有する対象者株式の数を乗じた価格と同一となるように算定されることを明らかと
していることから、対象者の株主の皆様が本公開買付けに応募するか否かについて適切に判断を行う
機会を確保し、これをもって強圧性が生じないように配慮しております。
(4)公開買付け後の組織再編等の方針
(変更前)
公開買付者は、上記「(1)公開買付けの目的の概要」に記載のとおり、本公開買付けが成立したもの
の、本公開買付けにより、公開買付者が対象者株式の全て(但し、公開買付者が所有する対象者株式及
び対象者が所有する自己株式を除きます。)を取得できなかった場合には、本公開買付けの成立後、以下
の本スクイーズアウト手続を実施することを予定しております。
<中略>
② 株式併合
<中略>
本臨時株主総会において本株式併合の議案についてご承認をいただいた場合には、本株式併合がそ
の効力を生ずる日において、対象者の株主の皆様は、本臨時株主総会においてご承認をいただいた本株
式併合の割合に応じた数の対象者株式を所有することとなります。本株式併合により株式の数に1株
に満たない端数が生じるときは、端数が生じた対象者の株主の皆様に対して、会社法第 235 条その他の
関係法令の定める手続に従い、当該端数の合計数(合計した数に1株に満たない端数がある場合には、
当該端数は切り捨てられます。以下同じです。)に相当する対象者株式を対象者又は公開買付者に売却
すること等によって得られる金銭の額が交付されることになります。当該端数の合計数に相当する対
象者株式の売却価格については、当該売却の結果、本公開買付けに応募されなかった対象者の株主(但
し、公開買付者及び対象者を除きます。)に交付される金銭の額が、本公開買付価格に当該株主の皆様
が所有していた対象者株式の数を乗じた価格と同一となるよう算定した上で、裁判所に対して任意売
却許可の申立てを行うことを対象者に対して要請する予定です。また、対象者株式の併合の割合は、本
日現在において未定ですが、公開買付者は、対象者に対して、公開買付者が対象者株式の全て(但し、
対象者が所有する自己株式を除きます。)を所有することとなるよう、本公開買付けに応募されなかっ
た対象者の株主の皆様(但し、公開買付者及び対象者を除きます。)の所有する対象者株式の数が1株
に満たない端数となるように決定するよう要請する予定です。対象者プレスリリースによれば、対象者
は本公開買付けが成立した場合には、公開買付者によるこれらの要請に応じる予定とのことです。本臨
時株主総会を開催する場合、2026 年 10 月中旬を目途に開催される予定ですが、その具体的な手続及び
実施時期等については、対象者と協議の上、決定次第、対象者が速やかに公表する予定です。対象者は
14
本公開買付けが成立した場合には、公開買付者によるこれらの要請に応じる予定とのことです。
<後略>
(変更後)
公開買付者は、上記「(1)公開買付けの目的の概要」に記載のとおり、本公開買付けが成立したもの
の、本公開買付けにより、公開買付者が対象者株式の全て(但し、公開買付者が所有する対象者株式及
び対象者が所有する自己株式を除きます。)を取得できなかった場合には、本公開買付けの成立後、以下
の本スクイーズアウト手続を実施することを予定しております。
なお、公開買付者は、上記「(1)公開買付けの目的の概要」に記載のとおり、本公開買付けの成立後
において公開買付者が実質的に所有する対象者株式に係る議決権の数が対象者の総株主の議決権の数の
3分の2を下回る場合においても、本臨時株主総会において本株式併合に係る議案が可決される蓋然性
は高いと考えていることから、かかる場合であっても本臨時株主総会を開催することを要請する予定で
す。また、公開買付者としては、本公開買付けの成立後、万が一、本臨時株主総会において本株式併合
に係る議案が可決されない場合であっても、対象者株式の非公開化を行う方針であるため、本公開買付
けへの応募状況、当該時点における対象者の株主の所有状況・属性、対象者株式の市場株価の動向を踏
まえた上で、本株式併合に係る議案が対象者の株主総会において現実的に可決される水準に至るまで、
新たな公開買付け又は市場内での買付け若しくは市場外での相対取得の方法により、対象者株式を追加
取得し、対象者株式の非公開化を目指す予定です。当該追加取得に関しては、公開買付者は、対象者が
株式併合又は株式分割等、支払う対価の調整を要する行為を行わない限り、新たな公開買付けの場合は
本公開買付価格と同一の価格により、市場内取引の場合は市場価格により、市場内取引以外の方法によ
る場合は本公開買付価格と同一の価格により、対象者株式を取得する方針です。公開買付者は、当該追
加取得の結果、本株式併合に係る議案の可決が合理的に可能と見込まれると判断した場合(なお、本臨
時株主総会における本株式併合に係る議案への反対の議決権の数等を踏まえて判断する予定です。)、対
象者に対し、改めて本株式併合を行うこと及び本株式併合の効力発生を条件として単元株式数の定めを
廃止する旨の定款の一部変更を行うことを付議議案に含む本臨時株主総会の開催を要請する予定です。
<中略>
② 株式併合
<中略>
本臨時株主総会において本株式併合の議案についてご承認をいただいた場合には、本株式併合がそ
の効力を生ずる日において、対象者の株主の皆様は、本臨時株主総会においてご承認をいただいた本株
式併合の割合に応じた数の対象者株式を所有することとなります。本株式併合により株式の数に1株
に満たない端数が生じるときは、端数が生じた対象者の株主の皆様に対して、会社法第 235 条その他の
関係法令の定める手続に従い、当該端数の合計数(合計した数に1株に満たない端数がある場合には、
当該端数は切り捨てられます。以下同じです。)に相当する対象者株式を対象者又は公開買付者に売却
すること等によって得られる金銭の額が交付されることになります。当該端数の合計数に相当する対
象者株式の売却価格については、当該売却の結果、本公開買付けに応募されなかった対象者の株主(但
し、公開買付者及び対象者を除きます。)に交付される金銭の額が、本公開買付価格に当該株主の皆様
が所有していた対象者株式の数を乗じた価格と同一となるよう算定した上で、裁判所に対して任意売
却許可の申立てを行うことを対象者に対して要請する予定です。また、対象者株式の併合の割合は、本
日現在において未定ですが、公開買付者は、対象者に対して、公開買付者が対象者株式の全て(但し、
対象者が所有する自己株式を除きます。)を所有することとなるよう、本公開買付けに応募されなかっ
た対象者の株主の皆様(但し、公開買付者及び対象者を除きます。)の所有する対象者株式の数が1株
に満たない端数となるように決定するよう要請する予定です。対象者プレスリリースによれば、対象者
は本公開買付けが成立した場合には、公開買付者によるこれらの要請に応じる予定とのことです。本臨
時株主総会を開催する場合、2026 年 10 月下旬を目途に開催される予定ですが、その具体的な手続及び
15
実施時期等については、対象者と協議の上、決定次第、対象者が速やかに公表する予定です。対象者は
本公開買付けが成立した場合には、公開買付者によるこれらの要請に応じる予定とのことです。
<後略>
3.対象者の概要及び買付け等の条件等
(1)対象者の概要
(変更前)
① 名 称 新光商事株式会社
② 所 在 地
東京都品川区大崎一丁目2番2号 アートヴィレッジ大崎セントラルタ
ワー13 階
③ 代 表 者 の 役 職 ・ 氏 名 代表取締役社長 小川 達哉
④ 事 業 内 容
集積回路・半導体素子等の電子部品、アセンブリ製品及び電子機器の
販売、これらに関連する輸出入業務並びにこれらに付帯する事業
⑤ 資 本 金 95 億 193 万円(2025 年9月 30 日現在)
⑥ 設 立 年 月 日 1953 年 11 月 25 日
⑦
大 株 主 及 び 持 株 比 率
(2025 年9月 30 日現在)
日本マスタートラスト信託銀行株式会社(信託口) 11.24%
野村 絢
(常任代理人 三田証券株式会社)
9.48%
NORTHERN TRUST CO.(AVFC) RE NON TREATY CLIENTS ACCOUNT
(常任代理人 香港上海銀行東京支店)
5.72%
株式会社レスター 5.12%
有限会社キタイアンドカンパニー 4.86%
株式会社日本カストディ銀行(信託E口) 3.55%
北井 暁夫 3.19%
EUROPEAN DEPOSITARY BANK
SA-DUBLIN-BUTTERMERE DEEP VALUE FUND LIMITED
(常任代理人 シティバンク エヌ・エイ)
2.23%
株式会社日本カストディ銀行(信託口) 1.95%
加賀電子株式会社 1.70%
⑧ 公開買付者と対象者の関係
資 本 関 係
公開買付者は、本日現在、対象者株式 515,000 株(所有割合:1.74%)
を所有しております。
人 的 関 係 公開買付者と対象者との間には人的関係はありません。
取 引 関 係
公開買付者グループは、対象者との間で商品の販売及び仕入等の取引を
行っております。
関 連 当 事 者 へ の
該 当 状 況
対象者は、公開買付者の関連当事者に該当いたしません。
(注)「大株主及び持株比率(2025 年9月 30 日現在)」は、対象者が 2025 年 11 月 14 日に提出した第 73
期半期報告書の「大株主の状況」を基に記載しております。
16
(変更後)
① 名 称 新光商事株式会社
② 所 在 地
東京都品川区大崎一丁目2番2号 アートヴィレッジ大崎セントラルタ
ワー13 階
③ 代 表 者 の 役 職 ・ 氏 名 代表取締役社長 小川 達哉
④ 事 業 内 容
集積回路・半導体素子等の電子部品、アセンブリ製品及び電子機器の
販売、これらに関連する輸出入業務並びにこれらに付帯する事業
⑤ 資 本 金 95 億 193 万円(2026 年3月 31 日現在)
⑥ 設 立 年 月 日 1953 年 11 月 25 日
⑦
大 株 主 及 び 持 株 比 率
(2026 年3月 31 日現在)
日本マスタートラスト信託銀行株式会社(信託口) 10.16%
野村 絢
(常任代理人 三田証券株式会社)
9.69%
株式会社シティインデックスファースト 6.90%
株式会社レスター 5.23%
有限会社キタイアンドカンパニー 4.96%
株式会社日本カストディ銀行(信託E口) 3.59%
北井 暁夫 3.26%
EUROPEAN DEPOSITARY BANK
SA-DUBLIN-BUTTERMERE DEEP VALUE FUND LIMITED
(常任代理人 シティバンク エヌ・エイ東京支店)
2.28%
株式会社日本カストディ銀行(信託口) 1.88%
加賀電子株式会社 1.74%
⑧ 公開買付者と対象者の関係
資 本 関 係
公開買付者は、本日現在、対象者株式 515,000 株(所有割合:1.74%)
を所有しております。
人 的 関 係 公開買付者と対象者との間には人的関係はありません。
取 引 関 係
公開買付者グループは、対象者との間で商品の販売及び仕入等の取引を
行っております。
関 連 当 事 者 へ の
該 当 状 況
対象者は、公開買付者の関連当事者に該当いたしません。
(注)「大株主及び持株比率(2026 年3月 31 日現在)」は、対象者有価証券報告書の「大株主の状況」
を基に記載しております。
(2)日程等
②買付け等の期間
(変更前)
2026 年5月 18 日(月曜日)から 2026 年7月 29 日(水曜日)まで(52 営業日)
(変更後)
2026 年5月 18 日(月曜日)から 2026 年8月3日(月曜日)まで(55 営業日)
17
(4)買付予定の株券等の数
(変更前)
買付予定数 買付予定数の下限 買付予定数の上限
29,097,599 株 19,226,700 株 ―株
(注1)応募株券等の数の合計が買付予定数の下限(19,226,700 株)に満たない場合は、応募株券等の
全部の買付け等を行いません。応募株券等の数の合計が買付予定数の下限(19,226,700 株))
以上の場合は、応募株券等の全部の買付け等を行います。
<後略>
(変更後)
買付予定数 買付予定数の下限 買付予定数の上限
29,097,599 株 15,988,500 株 ―株
(注1)応募株券等の数の合計が買付予定数の下限(15,988,500 株)に満たない場合は、応募株券等の
全部の買付け等を行いません。応募株券等の数の合計が買付予定数の下限(15,988,500 株))
以上の場合は、応募株券等の全部の買付け等を行います。
<後略>
(5)買付け等による株券等所有割合の異動
(変更前)
買付け等前における公開買付者の
所有株券等に係る議決権の数
5,150 個 (買付け等前における株券等所有割合:1.74%)
買付け等前における特別関係者の
所有株券等に係る議決権の数
―個 (買付け等前における株券等所有割合:―%)
買付け等後における公開買付者の
所有株券等に係る議決権の数
296,125 個 (買付け等後における株券等所有割合:100.00%)
買付け等後における特別関係者の
所有株券等に係る議決権の数
―個 (買付け等後における株券等所有割合:―%)
対象者の総株主の議決権の数
( 2 0 2 5 年 9 月 3 0 日 現 在 )
302,397 個
<中略>
(注2)「対象者の総株主の議決権の数」は、対象者が 2025 年 11 月 14 日に提出した第 73 期半期報告書
に記載された 2025 年9月 30 日現在の総株主等の議決権の数です。但し、単元未満株式(但し、
対象者が所有する単元未満の自己株式を除きます。)についても本公開買付けの対象としている
ため、「買付け等前における株券等所有割合」及び「買付け等後における株券等所有割合」の計
算においては、本基準株式数(29,612,599 株)に係る議決権数(296,125 個)を分母として計算
しております。
(変更後)
買付け等前における公開買付者の
所有株券等に係る議決権の数
5,150 個 (買付け等前における株券等所有割合:1.74%)
買付け等前における特別関係者の
所有株券等に係る議決権の数
―個 (買付け等前における株券等所有割合:―%)
18
買付け等後における公開買付者の
所有株券等に係る議決権の数
296,125 個 (買付け等後における株券等所有割合:100.00%)
買付け等後における特別関係者の
所有株券等に係る議決権の数
―個 (買付け等後における株券等所有割合:―%)
対象者の総株主の議決権の数
( 2 0 2 6 年 3 月 3 1 日 現 在 )
295,931 個
<中略>
(注2)「対象者の総株主の議決権の数」は、対象者有価証券報告書に記載された 2026 年3月 31 日現在
の総株主等の議決権の数です。但し、単元未満株式(但し、対象者が所有する単元未満の自己株
式を除きます。)についても本公開買付けの対象としているため、「買付け等前における株券等所
有割合」及び「買付け等後における株券等所有割合」の計算においては、本基準株式数(29,612,599
株)に係る議決権数(296,125 個)を分母として計算しております。
(7)決済の方法
② 決済の開始日
(変更前)
2026 年8月5日(水曜日)
(変更後)
2026 年8月 10 日(月曜日)
(8)その他買付け等の条件及び方法
① 法第 27 条の 13 第4項各号に掲げる条件の有無及び内容
(変更前)
応募株券等の数の合計が買付予定数の下限(19,226,700 株)に満たない場合は、応募株券等の全部
の買付け等を行いません。応募株券等の数の合計が買付予定数の下限(19,226,700 株)以上の場合は、
応募株券等の全部の買付け等を行います。
(変更後)
応募株券等の数の合計が買付予定数の下限(15,988,500 株)に満たない場合は、応募株券等の全部
の買付け等を行いません。応募株券等の数の合計が買付予定数の下限(15,988,500 株)以上の場合は、
応募株券等の全部の買付け等を行います。
5.その他
(1)公開買付者又はその特別関係者による利益供与の内容
(変更前)
対象者プレスリリースによれば、対象者は、本日開催の対象者取締役会において、本公開買付けに賛
同する旨の意見を表明するとともに、対象者の株主の皆様に対して、本公開買付けへの応募を推奨する
ことを決議したとのことです。対象者取締役会の意思決定過程の詳細については、対象者プレスリリー
ス及び上記「(3)公開買付けの公正性を担保するための措置」の「⑤ 対象者における利害関係を有し
ない取締役全員(監査等委員を含む。)の承認」をご参照ください。
(変更後)
対象者プレスリリースによれば、対象者は、2026 年5月 15 日開催の対象者取締役会において、本公
開買付けに賛同する旨の意見を表明するとともに、本公開買付けに応募するか否かについては、対象者
19
の株主の皆様のご判断に委ねることを決議したとのことです。また、変更後対象者プレスリリースによ
れば、対象者は、2026 年7月 17 日付取締役会において、引き続き本公開買付けに賛同の意見を表明す
るとともに、本公開買付けに応募するか否かについては、対象者の株主の皆様のご判断に委ねる旨の意
見を維持することを決議したとのことです。対象者取締役会の意思決定過程の詳細については、対象者
プレスリリース及び上記「(3)公開買付けの公正性を担保するための措置」の「⑤ 対象者における利
害関係を有しない取締役全員(監査等委員を含む。)の承認」をご参照ください。
以 上


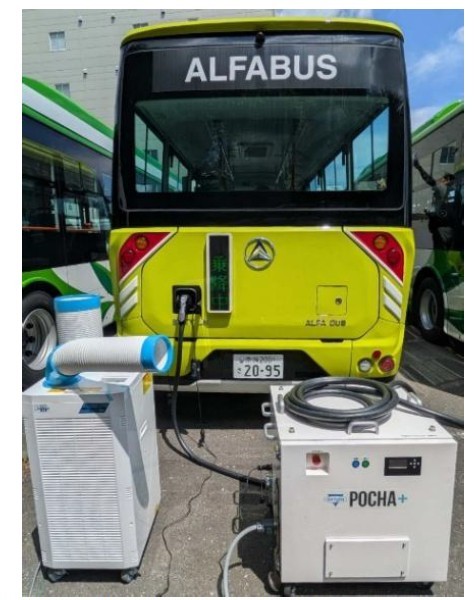 EVバス(L6)から急速充電器POCHA+を経由しスポットクーラーへ給電中の様子