|
Itochu Enex Co., Ltd. is an energy and automotive services company operating under the Itochu Group. The company manages four primary business segments: Car Life, Industrial Business, Power & Utility, and Home Life. In the Car Life segment, it provides gasoline, diesel, and lubricants, alongside automotive sales, maintenance services, and auto auctions. The Industrial Business segment supplies asphalt, marine fuels, industrial gases, and renewable fuels, including AdBlue and GTL fuels, while offering terminal tank leasing and PCB recycling services. The Power & Utility segment engages in power generation, corporate and residential electricity retail, renewable energy projects, and heat supply services. The Home Life segment focuses on LPG and city gas sales, automotive gas, and residential equipment e-commerce. Key subsidiaries include Enex Fleet, Kyushu Energy, Osaka Car Life Group, Nissan Osaka Sales, Itochu Industrial Gas, Enex Life Service, Enex Power, Oji-Itochu Enex Power Sales, Tokyo City Service, Itochu Enex Home Life, Ecoa, Enarc, and Japan Gas Energy. Summarised from the annual report, fiscal year ended Mar 2026 |
Industry Oil & Gas Refining & Marketing | Homepage itcenex.com |
| Sector Energy | IR page itcenex.com/ja | |
|
Tags
petroleum products, automotive sales, marine fuels, industrial gases, power generation, renewable energy, lpg, city gas, auto auctions, energy services, Enex Fleet, Kyushu Energy, Osaka Car Life Group, Nissan Osaka Sales, Itochu Industrial Gas, Enex Life Service, Enex Power, Oji-Itochu Enex Power Sales, Tokyo City Service, Itochu Enex Home Life, Ecoa, Enarc, Japan Gas Energy, AdBlue
|
Press page itcenex.com/ja/ir/news |
Metrics
| Valuation | |
|---|---|
| Market cap | ¥ 263.216B |
| Market cap (USD) | $ 1.645B |
| P/E | 10.71 |
| PEG | 2.10 |
| P/BV | 1.19 |
| P/S | 0.29 |
| P/OCF | 7.17 |
| P/FCF | 7.47 |
| Dividend yield | 2.9% |
| Turnover / mcap | — |
| Returns | |
|---|---|
| ROE | 7.8% |
| ROI | 7.5% |
| ROIC | 8.0% |
| Profit margin | 1.9% |
| Growth | |
|---|---|
| Revenue growing | No |
| Profits growing | No |
| Revenue up 3y | No |
| Revenue up 5y | No |
| Earnings growth 3y (net profit CAGR) | 5.1% |
| Quality | |
|---|---|
| Profitable | Yes |
| Margin expanding | No |
| Buying back stock | No |
| Diluting (TTM) | No |
| Debt/Equity | — |
| Podcast bulls (TTM) | Sign up |
| Podcast bears (TTM) | Sign up |
| Podcast sentiment (TTM) | Sign up |
| Podcast sentiment % (TTM) | Sign up |
| News sentiment (TTM) | 0 |
| Quality score | -11.1% |
| Insiders | |
|---|---|
| Buys, 1w | Sign up |
| Buys, 1m | Sign up |
| Buys, 1y | Sign up |
| Sells, 1w | Sign up |
| Sells, 1m | Sign up |
| Sells, 1y | Sign up |
Sign up to see this company's insider trades
| Figure | FY 2026 | FY 2025 | FY 2024 | FY 2023 | FY 2022 | FY 2021 | FY 2020 | FY 2019 | FY 2018 | FY 2017 | FY 2016 | FY 2015 | FY 2014 | FY 2013 |
|---|---|---|---|---|---|---|---|---|---|---|---|---|---|---|
| Revenue | 851.235B | 924.481B | 963.302B | 1.012T | 936.306B | 739.067B | 897.427B | 1.007T | 744.767B | 695.06B | 723.645B | 936.841B | 1.507T | 1.431T |
| Net profit | 16.058B | 17.102B | 13.887B | 13.832B | 13.194B | 12.168B | 12.056B | 11.559B | 11.025B | 10.405B | 7.469B | 5.503B | 7.403B | 5.577B |
| Free cash flow | 43.04B | 27.479B | 29.727B | 32B | 38.144B | 38.596B | 26.126B | 24.571B | — | — | — | — | — | — |
| Figure | FY 2026 | FY 2025 | FY 2024 | FY 2023 | FY 2022 | FY 2021 | FY 2020 | FY 2019 | FY 2018 | FY 2017 | FY 2016 | FY 2015 | FY 2014 | FY 2013 |
|---|---|---|---|---|---|---|---|---|---|---|---|---|---|---|
| Share price | 1.99K | 1.603K | 1.57K | 1.129K | 1.027K | 1.092K | 843.95 | 892.11 | 998.8 | 920.02 | 902.98 | 991.07 | 593.2 | 554.86 |
| Price performance 12m | 0.24 | 0.02 | 0.39 | 0.1 | -0.06 | 0.29 | -0.05 | -0.11 | 0.09 | 0.02 | -0.09 | 0.67 | 0.07 | — |
Filed figures
Lines the statements and their notes report beside the headline figures, read from the filings' XBRL as filed (no restatement applied), with figures computed from one filing's own lines. Cash-flow lines carry their cash direction: an outflow is negative. Each period links to its filing; a figure's period, report date and tag are in its tooltip.
| Figure | Mar 2017 | Mar 2018 | Mar 2019 | Mar 2020 | Mar 2021 | Mar 2022 | Mar 2023 | Mar 2024 | Mar 2025 | Mar 2026 |
|---|---|---|---|---|---|---|---|---|---|---|
| Balance sheet detail | ||||||||||
| Trade receivables (JPY) | — | 120B | 106B | 86.9B | 99.8B | 119B | 116B | 118B | 117B | 113B |
| ↳ YoY growth | -11.2% | -18.1% | +14.8% | +19.2% | -2.5% | +2.1% | -1.1% | -3.6% | ||
| ↳ 5y CAGR | -0.6% | +2.2% | +6.1% | +2.5% | ||||||
| Borrowings, current (JPY) | — | 12.4B | 11.2B | 7.02B | 3.04B | 23.1B | 7.03B | 1.17B | 1.48B | 1.23B |
| Borrowings, non-current (JPY) | — | 30.3B | 22.9B | 18.2B | 14.4B | 9.84B | 7.1B | 1B | 1B | 1B |
| Lease liabilities (JPY) | — | — | — | 62.3B | 60.8B | 57.6B | 57.7B | 56.8B | 54.2B | 54.8B |
| Cash and deposits (JPY) | 22.7B | 22.6B | 18.7B | 19.2B | 34.8B | 38.1B | 32B | 30.1B | 13.9B | 21.9B |
| Intangible assets (JPY) | — | 20.8B | 20.1B | 20B | 19.7B | 19.2B | 20.2B | 22.2B | 22.7B | 22B |
| Net debt (borrowings + leases - cash) (JPY) | — | 20.1B | 15.4B | 68.2B | 43.4B | 52.4B | 39.8B | 28.8B | 42.7B | 35.1B |
| Cash flow detail | ||||||||||
| Operating cash flow (JPY) | 17.8B | 24.2B | 25.4B | 28.1B | 40.2B | 40B | 34.8B | 34.5B | 31.7B | 45.1B |
| Purchases of property, plant and equipment (JPY) | — | — | -13.7B | -13.9B | -13.3B | -12.8B | -15B | -14.4B | -16.3B | -15.5B |
| Purchases of intangible assets (JPY) | — | -2.55B | -832M | -1.98B | -1.62B | -1.81B | -2.8B | -4.81B | -4.23B | -2.03B |
| Change in receivables (cash effect) (JPY) | — | -26B | 13.6B | 19.4B | -12.9B | -19.1B | 2.99B | -2.42B | 1.36B | 4.2B |
| Change in inventories (cash effect) (JPY) | — | -1.96B | -4.67B | 8.81B | -4.81B | 3.32B | -4.02B | -2.33B | -2.79B | 423M |
| Change in payables (cash effect) (JPY) | — | 26.5B | -5.79B | -37.7B | 19B | 17.1B | -5.41B | 10.2B | -7.64B | 1.65B |
| Dividends paid (cash effect) (JPY) | — | -3.9B | -4.97B | -4.86B | -5.08B | -5.76B | -5.54B | -5.88B | -6.33B | -7.34B |
| Share buybacks (cash effect) (JPY) | — | -121M | 0.00 | 0.00 | -1M | -1M | -42M | 0.00 | -210M | -1M |
| Interest paid (cash effect) (JPY) | — | -873M | -838M | -1.13B | -1.01B | -886M | -906M | -602M | -694M | -792M |
| Income taxes paid (cash effect) (JPY) | — | — | -8.51B | -5.84B | -10B | -7.16B | -6.52B | -11.3B | -8.9B | -7.66B |
| Operating cash flow before change in receivables (JPY) | — | 50.2B | 11.8B | 8.72B | 53.1B | 59.1B | 31.8B | 37B | 30.3B | 40.9B |
| Free cash flow (OCF - PPE - intangibles) (JPY) | — | — | 10.9B | 12.2B | 25.3B | 25.3B | 17B | 15.4B | 11.2B | 27.5B |
| Income detail | ||||||||||
| Total comprehensive income (JPY) | — | 13.7B | 13.2B | 14.1B | 15.2B | 16.2B | 16.3B | 18.5B | 19.4B | 19.1B |
| Comprehensive income to owners (JPY) | 10.9B | 11.5B | 11.1B | 12B | 12.9B | 13.8B | 14.2B | 15.4B | 16.3B | 16.8B |
| Segments | ||||||||||
| Car Life Division · Segment revenue (JPY) | — | — | 634B | 557B | 426B | 531B | 578B | 636B | 632B | 585B |
| ↳ YoY growth | -12.1% | -23.6% | +24.8% | +8.8% | +10.1% | -0.6% | -7.4% | |||
| Car Life Division · Segment operating income (JPY) | — | — | 9.23B | 8.24B | 7.6B | 7.66B | 8.95B | 12.5B | 11.5B | 9.85B |
| Home Life Division · Segment revenue (JPY) | — | 98.1B | 94.7B | 89.2B | 79B | 94.1B | 84.6B | 77.4B | 83.4B | 78.6B |
| ↳ YoY growth | -3.5% | -5.9% | -11.4% | +19.1% | -10.1% | -8.5% | +7.7% | -5.7% | ||
| Home Life Division · Segment operating income (JPY) | — | 3.12B | 3.56B | 2.8B | 1.55B | 2.64B | 2.04B | 1.48B | 2.53B | 2.85B |
| Industrial Business Division · Segment revenue (JPY) | — | — | 203B | 184B | 166B | 232B | 260B | 150B | 143B | 125B |
| ↳ YoY growth | -9.1% | -9.9% | +39.7% | +12.3% | -42.6% | -4.2% | -12.6% | |||
| Industrial Business Division · Segment operating income (JPY) | — | — | 2.45B | 2.81B | 5.01B | 4.67B | 8.53B | 5.04B | 6.89B | 6.01B |
| Life Industrial Energy Division · Segment revenue (JPY) | — | 473B | 717B | — | — | — | — | — | — | — |
| ↳ YoY growth | +51.8% | |||||||||
| Life Industrial Energy Division · Segment operating income (JPY) | — | 7.94B | 9.15B | — | — | — | — | — | — | — |
| Mobility Life Division · Segment revenue (JPY) | — | 104B | 112B | — | — | — | — | — | — | — |
| ↳ YoY growth | +7.0% | |||||||||
| Mobility Life Division · Segment operating income (JPY) | — | 2.03B | 2.35B | — | — | — | — | — | — | — |
| Power Utility Division · Segment revenue (JPY) | — | 80.4B | 99.4B | 94.1B | 88.9B | 106B | 124B | 121B | 77.6B | 71.4B |
| ↳ YoY growth | +23.6% | -5.4% | -5.5% | +19.5% | +16.8% | -2.7% | -35.7% | -8.0% | ||
| Power Utility Division · Segment operating income (JPY) | — | 4.63B | 2.73B | 5.83B | 5.22B | 6.18B | 2.16B | 4.63B | 5.81B | 4.44B |
| Reported | Jun 21, 2017 | Jun 19, 2019 | Jun 17, 2020 | Jun 17, 2020 | Jun 16, 2021 | Jun 21, 2022 | Jun 14, 2023 | Jun 19, 2024 | Jun 17, 2025 | Jun 16, 2026 |
Sign up to see institutional holdings
Sign UpPodcast Mentions
Sign up to see podcast mentions and sentiment
Sign UpTimely disclosures published on TDnet, newest first, titles as filed in Japanese. The link opens the disclosure on TDnet. Filings with EDINET (periodic reports, extraordinary reports, offerings, holding and buy-back reports), newest first, titles as filed in Japanese. The link opens the filing on EDINET. Press releases from the company's own website, newest first.
FACT BOOK2026 (2026年10月30日改訂) (30 th Oct, 2026)
(東証 8133)
(TSE , 8133)
Copyright©2026 ITOCHU ENEX CO.,LTD.All rights reserved.
0
目次 Contents Trends in Revenue and Profits
売上収益及び利益推移 Revenue by Segment
セグメント別売上収益 Operating Profit by Segment
セグメント別営業利益 Total Assets, Shareholders’ Equity, Equity Ratio
総資産・株主資本・株主資本比率 Net DER
ネットDER ROA and ROE
ROA・ROE Cash Flows
キャッシュフロー BPS and PBR
BPS・PBR PER and EPS
PER・EPS Dividends
配当
Share Price and Net Profit
株価・当期純利益
Share Price Performance and Trading Volume
株価パフォーマンス・出来高
P.2 P.3
P.4 P.5
P.6 P.7 P.8 P.9 P.10 P.11 P.12
Number of Employees at End of Period
期末従業員数
Balance Sheets for 10 Years
BS 10年
Statements of Income for 10 Years
PL 10年
Number of Service Stations of the Enex Group
当社グループ給油所数
Gasoline Sales Volume of the Enex Group
当社グループガソリン販売量
Kerosene Sales Volume of the Enex Group
当社グループ灯油販売量
Diesel Oil Sales Volume of the Enex Group
当社グループ軽油販売量
LP Gas Sales Volume of the Enex Group
当社グループLPガス販売量
Electricity Sales Volume of the Enex Group
当社グループ電力販売量 Power Plants of the Enex Group
当社グループ発電所
Overseas Development of the Enex Group
当社グループ海外事業
P.14 P.15
P.16 P.17
P.18 P.19 P.20 P.21
[Reference data]
【参考資料】 Trends in Crude Oil Prices
原油価格推移
Nationwide Monthly Gasoline and Kerosene Sales Volumes
全国月別ガソリン・灯油販売量 Trends in LP Gas Price
LPガス価格推移
Nationwide LP Gas Sales Volume by Use
全国LPガス用途別販売量
Nationwide Monthly LP Gas Sales Volume
全国月別LPガス販売量 Trends in Electricity Spot Price
電力スポット価格推移
Commercial Distribution of Main Businesses
主要事業の商流
P.26
P.27 P.28
P.29 P.30 P.31 P.32
P.22 P.23 P.24
P.13
※本資料の数値について、特に断りのない場合はすべて国際会計基準(IFRS)ベースで記載しています。 ※Unless otherwise noted, all the numerical values in this material are based on the International Financial Reporting Standards (IFRS). Copyright©2026 ITOCHU ENEX CO.,LTD.All rights reserved.
1
Trends in Revenue and Profits
売上収益及び利益推移
(億円)(100 million yen)
300
営業利益 Profit from operating activities
税前利益 Profit before tax
当期純利益 Net profit attributable to Itochu Enex's shareholders
売上収益 Net sales
10,120
10,071 250
200
9,363
8,974 7,448
197
193
192
9,633
194 179
193
200 193
200
282
222 209
247
269
260 241
236
4,000 171
104
8,000
6,000
214
172
100
50
10,000
9,245 8,512
230 150
12,000
7,391
6,951
(億円)(100 million yen)
110
116
121
122
132
138
139
161 2,000
0
0 '17/3
'18/3
'19/3
'20/3
'21/3
'22/3
'23/3
Copyright©2026 ITOCHU ENEX CO.,LTD.All rights reserved.
'24/3
'25/3
'26/3
2
Revenue by Segment
セグメント別売上収益 (億円)(100 million yen)
ホームライフ事業 Home-Life
カーライフ事業 Car-Life
産業ビジネス事業 Industrial Business
エネルギートレード事業 Energy Trade
電力・ユーティリティ事業 Power & Utility
その他 Other
11,000
10,120
10,071 994
9,000 7,448
2,027
7,391
635 769
2,168
804 887
1,241
889
2,240
9,633 1,207
1,062
954
6,951
7,000
9,363
8,974
2,438
1,495
9,245 776 1,432
8,512 714 1,251
1,660
5,000 6,335
3,000
5,205
5,528
5,912
6,362
6,323
5,855
4,711
4,886
868
939
947
892
790
855
846
774
834
786
-34
-69
-233
-244
-205
-322
-317
-205
-120
-93
'17/3
'18/3
'19/3
'20/3
'21/3
'22/3
'23/3
'24/3
'25/3
'26/3
4,256
1,000
-1,000
Copyright©2026 ITOCHU ENEX CO.,LTD.All rights reserved.
3
Operating Profit by Segment
セグメント別営業利益 (億円)(100 million yen) 290
ホームライフ事業 Home-Life
カーライフ事業 Car-Life
産業ビジネス事業 Industrial Business
エネルギートレード事業 Energy Trade
電力・ユーティリティ事業 Power & Utility
その他 Other
269 2
236
240
197 190
1
209 172 46
39
42
80
193
58
52
22
85 36
50
76
50
10 44
69 60
47
92 75
58
46
62
25
38 90
193
27 18
66 140
179
214
241
125
115
99
25
29
'25/3
'26/3
77
90
26
20
-2
-3
15 -1
'22/3
'23/3
'24/3
40 48
-10 '17/3
33
36
28
-5
-1
-4
16 -1
'18/3
'19/3
'20/3
'21/3
Copyright©2026 ITOCHU ENEX CO.,LTD.All rights reserved.
4
Total Assets, Shareholders’ Equity, Equity Ratio
総資産・株主資本・株主資本比率 (億円)(100 million yen)
総資産 Total assets
株主資本 Shareholder's equity
株主資本比率 Equity ratio
5,000
4,470
4,500
4,330
4,443
4,422
4,527
4,083
3,826
4,000 3,500
3,744
3,877
3,446
3,000 2,500 31.5%
2,000
30.3%
32.7%
33.1%
33.4%
32.3%
35.3%
1,500 1,000
1,161
1,283
1,085
1,223
1,362
'17/3
'18/3
'19/3
'20/3
'21/3
1,443
'22/3
1,530
36.6%
1,625
39.0%
1,723
40.2%
1,818
500
0 Copyright©2026 ITOCHU ENEX CO.,LTD.All rights reserved.
'23/3
'24/3
'25/3
'26/3
5
Net DER
ネットDER (億円)(100 million yen) 2,000
株主資本 Shareholder's equity
有利子負債 Interest-bearing debt
ネット有利子負債 Net interest-bearing debt
ネットDER Net DER
1,500 1,085
1,161
1,223
1,283
1,362
1,443
1,530
1,625
1,723
(倍)(Times)
1,818
0.80 0.70 0.60 0.50
1,000
0.40 0.30
500
0
0.17
0.17
410
427
183
0.20
0.13 201
341 154
0.05 252 59
175 -174
329 -52
0.10 141 -179
-0.04
'19/3
'20/3
'21/3
25
22
-114
-197
-0.07
-0.11
-0.17
-500 '18/3
-279
-0.12
-0.13 '17/3
22
'22/3
'23/3
※ネットDER(IFRS) = (有利子負債 ー 現金及び現金同等物の期末残高) / 株主資本 ※Net DER (IFRS) = (Interest-bearing debt ー Ending balance of cash and cash-equivalents) / Shareholders’ equity Copyright©2026 ITOCHU ENEX CO.,LTD.All rights reserved.
'24/3
0.00 -0.10 -0.20
'25/3
'26/3
6
ROA and ROE
ROA・ROE
ROA
12.0% 10.0% 10.0%
9.8%
9.7%
ROE 10.2%
9.6%
9.2%
9.4%
9.3%
9.1%
8.8%
8.0%
6.0%
4.0%
3.9%
3.2%
3.0%
'17/3
'18/3
3.1%
3.2%
'19/3
'20/3
3.1%
3.1%
3.1%
3.2%
'21/3
'22/3
'23/3
'24/3
3.6%
2.0%
0.0%
'25/3
'26/3
※ROA(総資産当期純利益率) = 当社株主に帰属する当期純利益 / 資産合計(期首・期末平均) ※ROA (return on asset) = Net profit attributable to Itochu Enex’s shareholders / Total assets (average of beginning and ending total assets) ※ROE(株主資本当期純利益率)= 当社株主に帰属する当期純利益 / 株主資本(期首・期末平均) ※ROE (return on equity) = Net profit attributable to Itochu Enex’s shareholders / Shareholders’ equity (average of beginning and ending shareholders’ equity) Copyright©2026 ITOCHU ENEX CO.,LTD.All rights reserved.
7
Cash Flows
キャッシュフロー (億円)(100 million yen)
営業活動によるCF Cash flows from operating activities 財務活動によるCF Cash flows from financing activities
500
402 400 300 200 100 0 -100
451
400 348
345
281
254
242
401
投資活動によるCF Cash flows from investing activities フリーキャッシュフロー Free cash flows
178
301
279
316
267
317
208
120 31
58
34
-12 -147
-59 -185
-200
-159 -134
-1
-14
-32 -176
-262
-245 -191
-66
-194
-149 -222
-299 -377
-300
-283
-400
-500 '17/3
'18/3
'19/3
'20/3
'21/3
'22/3
Copyright©2026 ITOCHU ENEX CO.,LTD.All rights reserved.
'23/3
'24/3
'25/3
'26/3
8
BPS and PBR
BPS・PBR (円)(Yen)
BPS(円)(yen)
1,800
1,527.6
1,600
6.0
1,439.9
1,400
1,200 1,000
(倍)(Times) 7.0 1,609.8
PBR(倍)(times)
960.4
1,028.6
1,083.4
1,136.9
1,206.9
1,278.3
1,355.4 5.0
4.0
800
3.0
600 2.0
400
0.96
0.97
0.82
0.74
0.90
0.80
0.83
1.09
1.05
1.24 1.0
200 0
0.0 '17/3
'18/3
'19/3
'20/3
'21/3
'22/3
※BPS(一株当たり純資産)= 株主資本 / 発行済株式数 ※BPS (book value per share) = Shareholders’ equity / Number of shares outstanding ※PBR(株価純資産倍率)= 株価(年度末終値) / BPS(一株当たり純資産) ※PBR (price-book value ratio) = Share price (closing price at the end of the period) / BPS (book value per share) Copyright©2026 ITOCHU ENEX CO.,LTD.All rights reserved.
'23/3
'24/3
'25/3
'26/3
9
PER and EPS
PER・EPS (円)(Yen)
EPS(円)(yen)
160
(倍)(Times)
PER(倍)(times)
151.6
40 142.3
140 116.9
120
100
92.1
97.6
102.4
106.8
122.5
123.0 30
107.8
80
20
13.99
12.76
60 9.99
10.23
40
8.71
10.13 7.90
8.79
10.57
9.21
10
20 0
0 '17/3
'18/3
'19/3
'20/3
'21/3
'22/3
'23/3
※PER(株価収益率) = 株価(年度末) / EPS(一株当たり当社株主に帰属する当期純利益) ※PER (price-earnings ratio) = Share price (end of the period) / EPS (earnings per share) ※EPS(一株当たり当期純利益) = 当社株主に帰属する当期純利益 / 発行株式数 ※EPS (earnings per share) = Net profit / Number of shares outstanding Copyright©2026 ITOCHU ENEX CO.,LTD.All rights reserved.
'24/3
'25/3
'26/3
10
Dividends
配当
(円)(Yen)
中間配当 Interim dividends
期末配当 Year-end dividends
記念配当 Commemorative dividends
70.0 62.0 60.0
54.0 50.0
50.0 40.0
42.0
44.0
48.0
50.0 35.0
6.0
34.0
40.0 32.0 30.0
20.0
66.0
24.0
22.0
23.0
25.0
26.0
28.0
28.0
18.5
10.0
20.0
21.0
23.0
24.0
26.0
28.0
31.0
13.5
16.0
16.0
'17/3
'18/3
'19/3
'20/3
'21/3
'22/3
'23/3
'24/3
'25/3
'26/3
34.8%
41.0%
41.0%
41.2%
46.4%
41.1%
40.8%
43.9%
40.9%
46.4%
0.0
Payout ratio (%) 配当性向(%)
Copyright©2026 ITOCHU ENEX CO.,LTD.All rights reserved.
11
Share Price and Net Profit
株価・当期純利益 (円)(Yen)
2,000
1,500
1,000
500
(億円)(100 million yen)
104
110
116
121
122
'18/3
'19/3
'20/3
'21/3
132
138
139
'22/3
'23/3
'24/3
171
161
'25/3
'26/3
0 '17/3
Copyright©2026 ITOCHU ENEX CO.,LTD.All rights reserved.
12
Share Price Performance and Trading Volume
株価パフォーマンス・出来高
出来高 Trading volume(monthly total)
300%
エネクス Enex
TOPIX
(千株)(Thousand shares)
6,000
250%
5,000
200%
4,000
150%
3,000
100%
2,000
50%
1,000
0% '17/3
0
'18/3
'19/3
'20/3
'21/3
'22/3
'23/3
Copyright©2026 ITOCHU ENEX CO.,LTD.All rights reserved.
'24/3
'25/3
'26/3
13
Number of Employees at End of Period
期末従業員数
連結(人)Consolidated (people)
7,000
6,000
単体(人)Non-consolidated (people)
5,958 5,613
5,619
5,583
5,558
5,641
5,461
5,365
5,191
5,193
5,000
4,000
3,000
2,000
1,000 642
656
641
644
663
661
642
640
579
559
'17/3
'18/3
'19/3
'20/3
'21/3
'22/3
'23/3
'24/3
'25/3
'26/3
0
Copyright©2026 ITOCHU ENEX CO.,LTD.All rights reserved.
14
Balance Sheets for 10 Years
BS 10年
(百万円)(1 million yen)
IFRS FY2017/3 '17年3月期 Current assets 流動資産 Non-current assets 固定資産 Total assets 資産合計 Current liabilities 流動負債 Non-current liabilities 非流動負債 Total liabilities 負債合計 Total shareholder's equity 株主資本合計 Non-controlling interests 非支配持分 Total equity 資本合計 Total liabilities and equity 負債・資本合計
FY2018/3 '18年3月期
FY2019/3 '19年3月期
FY2020/3 '20年3月期
FY2021/3 '21年3月期
FY2022/3 '22年3月期
FY2023/3 '23年3月期
FY2024/3 '24年3月期
FY2025/3 '25年3月期
FY2026/3 '26年3月期
178,127
212,769
199,775
161,240
183,865
197,146
191,141
216,519
200,419
210,487
166,476
169,852
174,598
226,417
224,462
249,871
241,883
227,785
241,731
242,203
344,603
382,621
374,373
387,657
408,327
447,017
433,024
444,304
442,150
452,690
143,751
174,929
165,463
133,224
150,941
185,337
166,123
172,858
163,994
167,761
73,375
70,626
64,344
102,549
95,987
90,482
86,573
79,237
75,409
74,394
217,126
245,555
229,807
235,773
246,928
275,819
252,696
252,095
239,403
242,155
108,511
116,104
122,290
128,333
136,233
144,297
152,961
162,543
172,285
181,772
18,966
20,962
22,276
23,551
25,165
26,901
27,367
29,666
30,462
28,763
127,477
137,066
144,566
151,884
161,399
171,198
180,328
192,209
202,747
210,535
344,603
382,621
374,373
387,657
408,327
447,017
433,024
444,304
442,150
452,690
Copyright©2026 ITOCHU ENEX CO.,LTD.All rights reserved.
15
Statements of Income for 10 Years
PL 10年
IFRS FY2017/3 '17年3月期 Revenue 売上収益 Cost of sales 売上原価
FY2018/3 '18年3月期
FY2019/3 '19年3月期
FY2020/3 '20年3月期
FY2021/3 '21年3月期
FY2022/3 '22年3月期
FY2023/3 '23年3月期
FY2024/3 '24年3月期
FY2025/3 '25年3月期
FY2026/3 '26年3月期
695,060
744,767
1,007,086
897,427
739,067
936,306
1,012,018
963,302
924,481
851,235
-601,456
-655,945
-922,876
-811,009
-652,178
-852,715
-922,462
-874,690
-830,058
-760,264
Gross profit 売上総利益
93,604
88,822
84,210
86,418
86,889
83,591
89,556
88,612
94,423
90,971
Selling, general and administrative expenses 販売費・一般管理費
-74,697
-70,931
-67,318
-68,858
-67,115
-68,065
-68,889
-70,227
-70,647
-69,351
Loss (gain) related to fixed assets 固定資産に係る損益
-982
-1,544
-241
-428
-1,369
-615
-594
4,635
-882
1,390
Other losses (gains) その他の損益
1,753
806
1,200
2,125
941
6,018
1,295
567
4,002
1,136
19,678
17,153
17,851
19,257
19,346
20,929
21,368
23,587
26,896
24,146
Interest income 受取利息
89
92
83
58
41
31
50
94
155
251
Dividend income 受取配当金
246
296
66
103
509
119
76
132
131
142
Interest expenses 支払利息
-966
-950
-906
-1,126
-1,070
-994
-897
-691
-797
-925
Other その他
-203
-241
755
-82
-513
-253
41
-380
9
9
Total finance income (costs) 金融損益・費用計
-834
-803
-2
-1,047
-1,033
-1,097
-730
-845
-502
-523
Share of profit (loss) of investments accounted for by the equity method 持分法による投資損益
500
493
1,565
1,768
1,726
2,409
2,398
1,945
1,779
2,392
2,326
Profit before tax 税引前利益
19,344
19,169
19,414
19,978
20,039
22,241
23,036
24,687
28,173
26,015
Income tax expense 法人所得税費用
-6,599
-5,945
-5,749
-5,793
-5,675
-6,675
-7,055
-7,683
-7,928
-7,672
Net profit 当期純利益
12,745
13,224
13,665
14,185
14,364
15,566
15,981
17,004
20,245
18,343
Net profit attributable to Itochu Enex's shareholders 当社株主に帰属する当期純利益
10,405
11,025
11,559
12,056
12,168
13,194
13,832
13,887
17,102
16,058
2,340
2,199
2,106
2,129
2,196
2,372
2,149
3,117
3,143
2,285
Profit from operating activities 営業活動に係る利益
Gain (loss) on sale of investments in subsidiaries and associates 関係会社投資に係る売却損益
Profit attributable to non-controlling interests 非支配持分に帰属する当期利益
Copyright©2026 ITOCHU ENEX CO.,LTD.All rights reserved.
(百万円) (1 million yen)
16
Number of Service Stations of the Enex Group
当社グループ給油所数
(カ所)(Locations)
当社グループ The Enex Group
(カ所)(Locations)
全国SS数 Number of SSs nationwide
直営CS Number of directly owned CSs (included)
2,000
全国シェア Nationwide share
1,800 1,888
30,000 1,812
1,600
1,766
1,704 1,687
32,333
1,636 1,610
1,400
1,566 1,546
31,467 30,747
1,496
30,070 29,637
20,000
1,200
29,005 28,475
6.0%
1,000
5.9% 5.9%
5.7%
800
5.8%
5.7% 5.8% 5.7% 5.7%
27,963 27,414 27,009
5.7%
10,000
600 400 200 208 0
205
204
190
190
191
183
175
171
166
'17/3 '18/3 '19/3 '20/3 '21/3 '22/3 '23/3 '24/3 '25/3 '26/3
0 '16/3 '17/3 '18/3 '19/3 '20/3 '21/3 '22/3 '23/3 '24/3 '25/3
※出典:石油連盟 Source: Petroleum Association of Japan ※25.3期は公表され次第更新 FY2025/3 will be updated as soon as it is announced. Copyright©2026 ITOCHU ENEX CO.,LTD.All rights reserved.
17
Gasoline Sales Volume of the Enex Group
当社グループガソリン販売量
(千 kL)(Thousand kL)
(千 kL)(Thousand kL) エネクス The Enex Group
4,000
8.0%
全国 Nationwide
70,000
全国シェア Nationwide share
3,500 3,000
7.5%
3,328 3,201
50,000 7.0%
2,767
2,500
2,000
60,000
3,587
2,510 2,477 2,469 2,431 2,386 2,347 6.5%
6.8% 6.5%6.5%
51,151 53,112 49,388 40,000 47,801
45,000 44,079 45,476 43,334 43,59444,681
30,000
1,500 6.0%
20,000
1,000
5.8% 500
5.6% 5.5%5.5% 5.5% 5.4% 5.4%
0 '17/3'18/3'19/3'20/3'21/3'22/3'23/3'24/3'25/3'26/3
5.5%
10,000
5.0%
0 '17/3 '18/3 '19/3 '20/3 '21/3 '22/3 '23/3 '24/3 '25/3 '26/3 ※出典:石油連盟 Source: Petroleum Association of Japan ※25.3期は公表され次第更新 FY2025/3 will be updated as soon as it is announced.
Copyright©2026 ITOCHU ENEX CO.,LTD.All rights reserved.
18
Kerosene Sales Volume of the Enex Group
当社グループ灯油販売量 (千 kL)(Thousand kL)
(千 kL)(Thousand kL)
エネクス The Enex Group
全国シェア Nationwide share
1,800 1,600
1,590
全国 Nationwide
25,000
1,565
1,448
20,000
1,400 1,229 1,145 10.9% 1,054
1,200 1,000
800 600 400
9.4%
17,139 15,000 915
9.1% 8.8%
16,937 14,375
858 842 854
8.5%
13,449 10,000
7.9%
7.9%
7.5% 7.3% 7.2%
13,277
12,976
12,465 11,983 11,252 10,738
5,000
200 0
0 '17/3 '18/3 '19/3 '20/3 '21/3 '22/3 '23/3 '24/3 '25/3 '26/3
'17/3 '18/3 '19/3 '20/3 '21/3 '22/3 '23/3 '24/3 '25/3 '26/3 ※出典:石油連盟 Source: Petroleum Association of Japan ※25.3期は公表され次第更新 FY2025/3 will be updated as soon as it is announced
Copyright©2026 ITOCHU ENEX CO.,LTD.All rights reserved.
19
Diesel Oil Sales Volume of the Enex Group
当社グループ軽油販売量 (千 kL)(Thousand kL) エネクス The Enex Group
(千 kL)(Thousand kL)
全国シェア Nationwide share
全国 Nationwide
4,000
40,000
3,500
35,000 10.6%
3,000
10.1% 10.5%
10.4%
10.3%
2,500 10.0% 2,000
1,500
10.5%
3,499 3,401 3,271
3,288
10.1%
10.0%
10.0%
3,282 3,217
3,164
30,000 32,857 25,000
32,690
20,000
3,173 3,154 3,068
10,000
500
5,000
'17/3'18/3'19/3'20/3'21/3'22/3'23/3'24/3'25/3'26/3
31,797 31,457 31,210 31,411 30,249 30,732
31,994
15,000
1,000
0
32,881
0 '17/3 '18/3 '19/3 '20/3 '21/3 '22/3 '23/3 '24/3 '25/3 '26/3
※出典:石油連盟 Source: Petroleum Association of Japan ※25.3期は公表され次第更新 FY2025/3 will be updated as soon as it is announced. Copyright©2026 ITOCHU ENEX CO.,LTD.All rights reserved.
20
LP Gas Sales Volume of the Enex Group
当社グループLPガス販売量 (千 t)(Thousand t) エネクス The Enex Group 700
(千 t)(Thousand t)
全国シェア Nationwide share
全国 Nationwide
16,000
600
500
4.2%4.2% 4.1% 3.9%3.9%3.9%
14,687
3.7% 3.7% 3.6% 3.6%
400
12,000 14,151
14,114 13,959 12,787
300
200
597 618 573
8,000 543
500 485 475
445 438 427
12,728 12,536 12,402 11,914 11,842
4,000 100
0
'17/3 '18/3 '19/3 '20/3 '21/3 '22/3 '23/3 '24/3 '25/3 '26/3
0
'17/3 '18/3 '19/3 '20/3 '21/3 '22/3 '23/3 '24/3 '25/3 '26/3 ※出典:日本LPガス協会(需給推移年報) Source: Japan LP Gas Association (Annual Report on Supply and Demand Trends) ※26.3期については「経済産業省資料“2026~2030年度石油製品需要見通し 液化石油ガス編”」 The value for FY2026/3, experts from the Ministry of Economy, Trade and Industry’s “Petroleum Product Demand Outlook for Fiscal Years 2026 to 2030 : LP Gas” 21
Copyright©2026 ITOCHU ENEX CO.,LTD.All rights reserved.
Electricity Sales Volume of the Enex Group
当社グループ電力販売量
新電力計 Total for power producers and suppliers
エネクス The Enex Group
新電力シェア Nationwide share
全体の電力需要に対する新電力需要の割合 (千 MWh)(Thousand MWh) Ratio of liberalized electricity demand to total electricity demand
(千 MWh)(Thousand MWh)
3,500
200,000 3,101
3,000 2,500 2,000
2,874 2,671 2,605 2,431
180,000 2,692
2,393
2,584
2,245 2,232
22.4%
160,000
18.7% 18.0% 15.3%
129,402
100,000
10.5%
1,500 1,000 500
80,000
2.6% 2.3% 2.0%
60,000
1.7% 1.6%1.5%1.4%1.7%1.6%
154,319
25.1%
22.1%
179,585
140,000
120,000
3.6%
24.9%
22.6%
19.2%
155,239
180,674
161,488
133,661
122,898
102,364 66,720
40,000 20,000
0 '17/3 '18/3 '19/3 '20/3 '21/3 '22/3 '23/3 '24/3 '25/3 '26/3
0 '17/3 '18/3 '19/3 '20/3 '21/3 '22/3 '23/3 '24/3 '25/3 '26/3
※当社グループ電力販売量には取次数量を含む ※出典:資源エネルギー庁 Source: Agency for Natural Resources and Energy ※Our Group’s electricity sales volume includes intermediary volume. ※25.3期は公表され次第更新 FY2025/3 will be updated as soon as it is announced. 22 Copyright©2026 ITOCHU ENEX CO.,LTD.All rights reserved.
Power Plants of the Enex Group
当社グループ発電所
Joetsu Energy Service Co., Ltd.
上越エネルギーサービス㈱
新潟県上越市 Joetsu City, Niigata 水力 Hydraulic power 8.8MW 天然ガス Natural gas 31.2MW
Sendai Power Station Co., Ltd.
仙台パワーステーション㈱
宮城県仙台市 Sendai City, Miyagi 石炭火力 Coal-fired power 56.0MW ※当社100%子会社(エネクス電力株式会社)にて50%出資の 持分法適用会社 ※Equity-method affiliate 50% owned by our wholly-owned subsidiary (ENEX Electric Power Co., Ltd.)
ENEX Electric Power Co., Ltd.
エネクス電力㈱
太陽光 Solar power
16.0MW
※発電設備は鹿児島県に4.2MW、兵庫県に11.8MWを保有 ※Power generation facilities: 4.2 MW in Kagoshima Prefecture and 11.8 MW in Hyogo Prefecture
SODATERU solar farm Co., Ltd.
そだてるソーラーファーム㈱ 太陽光 Solar power
※発電設備は徳島県・愛知県・埼玉県に合わせて2.1MWを保有 ※Power generation facilities: 2.1 MW in Tokushima, Aichi, and Saitama Prefectures
Saiene Dengen Kaihatsu Co., Ltd.
再エネ電源開発㈱
太陽光 Solar power
6.7MW
※発電設備は全国各地に合わせて6.7MW保有 ※Power generation facilities: 6.7 MW throughout Japan
2.1MW
Hofu Energy Service Co., Ltd.
防府エネルギーサービス㈱
山口県防府市 Hofu City, Yamaguchi 石炭火力 Coal-fired power 79.6MW Copyright©2026 ITOCHU ENEX CO.,LTD.All rights reserved.
※2026.9.30時点 ※As of Sep 30, 2026 23
Overseas Development of the Enex Group
当社グループ海外事業
ITC ENEX Southeast Asia CO.,Ltd. (The Kingdom of Thailand)
(タイ王国) タイ及び近隣諸国における事業の統括、マーケットリサーチ 等を行う現地法人を2020年4月設立。 A local corporation that managing of business in Thailand and neighboring countries, market research, etc was established in April 2020.
Isla Petroleum & Gas Corporation (The Republic of the Philippines)
(フィリピン共和国)
ITC ENEX(Thailand) Co.,Ltd. (The Kingdom of Thailand)
(タイ王国)
タイでの太陽光発電・省エネ関連事業の展開を行う現地法人 を2020年4月設立。
2016年4月、伊藤忠商事と共にフィリピンにおけるLPガス販売事業に参画(ISLA社、 当社社員常駐)。国内で培ったLPガス事業のノウハウを海外で応用。 In April 2016, the Company participated, along with ITOCHU Corporation, in the LP gas sales project in the Philippines (where employees of ISLA and the Company are stationed). The expertise in the LP gas business that was cultivated in Japan is applied overseas.
A local corporation that operating of the photovoltaic power generation and energy conservation businesses in Thailand was established in April 2020.
Copyright©2026 ITOCHU ENEX CO.,LTD.All rights reserved.
24
【Reference data】
【参考資料】
Copyright©2026 ITOCHU ENEX CO.,LTD.All rights reserved.
25
【Reference data】
Trends in Crude Oil Prices (Duty-Paid Price and Brent Crude Oil Price)
【参考資料】
原油価格推移(通関価格・ブレント原油価格)
($/bbl)
(円/kL)(Yen/kL) 120,000
140
石油通関(円/kl)Duty -paid price of crude oil (yen/kL) ブレント価格($/bbl)Brent crude oil price ($/bbl)
120
100,000
100 80,000
80 60,000 60 40,000 40 20,000
20
0 '16/3
'17/3
'18/3
'19/3
'20/3
'21/3
'22/3
'23/3
'24/3
'25/3
0 '26/3
※出典:経済産業省、IMF 他 Source: Ministry of Economy, Trade and Industry, IMF and others Copyright©2026 ITOCHU ENEX CO.,LTD.All rights reserved.
26
【Reference data】
Nationwide Monthly Gasoline and Kerosene and Diesel Sales Volumes
【参考資料】
全国月別ガソリン・灯油・軽油販売量 (千 kL)(Thousand kL)
ガソリン Gasoline
軽油 Diesel
灯油 Kerosene
5,000 4,500 4,000 3,500 3,000 2,500 2,000 1,500 1,000 500 0 '24/4
'24/7
'24/10
'25/1
'25/4
'25/7
'25/10
'26/1
※出典:経済産業省 ※Source: Ministry of Economy, Trade and Industry Copyright©2026 ITOCHU ENEX CO.,LTD.All rights reserved.
27
【Reference data】
Trends in LP Gas Price (Propane: CP and CIF)
【参考資料】
LPガス価格推移(プロパン:CP・CIF) (円/t)(yen/t)
CIF(円/t)(yen/t)
($/t)
CP($/t)
120,000
1,000 900
100,000
800 700
80,000
600 60,000
500 400
40,000
300 200
20,000
100 0 '16/3
'17/3
'18/3
'19/3
'20/3
'21/3
'22/3
'23/3
'24/3
'25/3
0 '26/3
※出典:日本LPガス協会 ※Source: Japan LP Gas Association Copyright©2026 ITOCHU ENEX CO.,LTD.All rights reserved.
28
【Reference data】
Nationwide LP Gas Sales Volume by Use
【参考資料】
全国LPガス用途別販売量
家庭業務用 For household and business use 都市ガス用 For city gas 大口鉄鋼用 For large-scale steel applications 電力用 For power generation
(千 t)(Thousand t) 17,000 15,229
15,000 13,000
11,000 9,000
168
14,151
2,698
294
109 1,045
2,572
964
97 985 995
3,948
7,000
2,933
14,687 182 2,762 79 940 1,110 3,230
14,114 145
13,959 81
一般工業用 For general industrial use 自動車用 For automobiles 化学原料用 For chemical feedstock
12,787 0
12,536
12,728
2,715
2,840
97 869 1,127
103 773 1,100
2,136 98 529 1,097
1,893 95 551 1,312
2,020 133 538
3,060
3,065
3,000
12,402
11,914
1,599
1,919 175 509 1,504
1,718 132 482 1,391
2,596
2,506
2,577
2,494
5,000 3,000
6,297
6,275
6,384
6,101
5,997
5,927
6,089
5,932
5,718
5,697
'16/3
'17/3
'18/3
'19/3
'20/3
'21/3
'22/3
'23/3
'24/3
'25/3
1,000 -1,000
※出典:日本LPガス協会(需給推移年報) Source: Japan LP Gas Association(Annual Report on Supply and Demand Trends)
Copyright©2026 ITOCHU ENEX CO.,LTD.All rights reserved.
29
【Reference data】
Nationwide Monthly LP Gas Sales Volume (Propane and Butane)
【参考資料】
全国月別LPガス(プロパン・ブタン)販売量 (千 t)(Thousand t) 1,400
プロパン Propane
ブタン Butane
1,200 1,000 800
600 400 200 0 '24/4 '24/7 ※出典:日本LPガス協会 ※Source: Japan LP Gas Association
'24/10
'25/1
'25/4
'25/7
Copyright©2026 ITOCHU ENEX CO.,LTD.All rights reserved.
'25/10
'26/1
30
【Reference data】
Trends in Electricity Spot Price
【参考資料】
電力スポット価格推移 (円/kWh)(yen/kWh)
JEPX-DA24 Electricity spot price
70.00
60.00
50.00
40.00
30.00
20.00
10.00
0.00 '16/4
'17/4
'18/4
'19/4
'20/4
'21/4
'22/4
※出典:JEPX ※Source: JEPX Copyright©2026 ITOCHU ENEX CO.,LTD.All rights reserved.
'23/4
'24/4
'25/4
'26/4
31
Commercial Distribution of Main Businesses
【Reference data】
主要事業の商流
【参考資料】 Car Dealers
Field
モ ノ の 流 れ
Commercial distribution
領 域
Product flow
自動車ディーラー
商 流
Automobile production
自動車生産 Assembly and registration
組立・登録
Marine transport ship
Parking lot
モータープール
海上輸送船
Automobile manufacturer
Car carrier
自動車メーカー
陸送業者
After-sales service
販売
アフターサービス
Store
カーキャリア
Land transport company
Sales
店舗
Automobile inspection/ maintenance
車検・整備
Car dealer
Car maintenance company or the like
各自動車ディーラー NISSAN OSAKA SALES CO., LTD.
日産大阪販売
Used car purchase
中古車買取
Used car dealer
整備会社等
中古車販売業者
NAL Net Communications Co., Ltd.
WECARS Co. Ltd.,
ナルネットコミュニケーションズ
WECARS
Auction exhibition
オークション出展
Auction company
オークション会社 IAA
Petroleum Products
Field
モ ノ の 流 れ
Commercial distribution
領 域
Product flow
石油製品
商 流
Crude oil
原油
Oil field
油田
Tanker
タンカー船
Refinement of products
Wholesaling of products
Retailing of products
製品精製
製品卸売
製品小売
Refineries
製油所
Oil terminal
油槽所
Tank lorry
Gas station
タンクローリー
ガソリンスタンド
Vehicles
各種車輛
Factory or the like
工場等
Oil producing country
産油国
Primary distributor
元売
Sales outlets
Dealer affiliated with a comprehensive trading company
販売店
広域商社系ディーラー ITOCHU ENEX
伊藤忠エネクス
Other companies in the same business/cooperative stores
同業他社・協力店
ENEX FLEET
エネクスフリート
Users
ユーザー
32
Liquefied Petroleum Gas (LPG or Propane) (Direct Sales/Wholesale)
領 域
モ ノ の 流 れ
Commercial distribution
Product flow
Field
LPG(プロパン)(直売・卸)
商 流
LP gas
LPガス Gas producing country
産ガス国
Wholesaling of products
Import
輸入
Retailing of products
製品卸売
Import bases (primary base)
Tanker
輸入基地 (1次基地)
タンカー船
Filling station (Enex Group sales company)
Tank lorry
充填所 (グループ販社)
タンクローリー
製品小売
Delivery of cylinders Filling cylinders
Direct selling
シリンダー配送
直売
戸建
シリンダー充填
Apartments
Wholesale
卸売
集合住宅
LP gas sales outlets
For business use
LPガス販売店
Gas producing country
産ガス国
ITC
エネクス
Primary distributor
グループ販社
Large-scale dealer
元売
業務用
Enex Group sales company
Enex
JGE
大規模ディーラー
Detached houses
Users
ユーザー
LP gas sales outlets
LPガス販売店
Electricity
領 域
モ ノ の 流 れ
Commercial distribution
Product flow
Field
電気
商 流
Generation fuel
発電燃料
Coal/LNG/Biomass
石炭・LNG・バイオマス
Import/ Procurement 輸入・調達
Power generation
Fuel tanker
Power plant
燃料輸送船
Supply and demand
発電
需給
Retail sales
小売 Building/Factory (Extra high voltage/High voltage)
Supply and demand adjustment
発電所
ビル・工場 (特別高圧、高圧)
需給調整
House (Low voltage)
住宅 (低圧)
LNG: Gas producing country
LNG:産ガス国
Coal: Producing Country
石炭:産出国
Biomass: Producing Area
バイオマス:生産地
Importer/Procurer Trading companies/ Primary distributor
輸入・調達事業者 商社・元売 PT.ENEX TRADING INDONESIA
Power generation business operator
発電事業者 ENEX Electric Power
エネクス電力
Power transmission and distribution business operator
送配電事業者
Sales business operator
販売事業者
ENEX Power & Supply Management Department
エネクス 電力需給部
Corporate user
ENEX Sales department of an enterprise
法人ユーザー
エネクス 電力法人営業部
Partner
OJEX・ELS
パートナー
OJEX/ELS
Personal user
個人ユーザー33
【ご注意】 資料の内容につきましては細心の注意を払ってはおりますが、掲載された情報の誤りおよび当資料に掲載された情報 に基づいて被ったいかなる損害についても、当社及び情報提供者は一切責任を負いかねます。 また、当資料に記載されている当社の現在の計画、戦略などは、当社が現時点で入手可能な情報を基礎として作成 した見通しであり、これらの将来予測には、リスクや不確定な要因を含んでおります。そのため、実際の業績につきまして は、記載の見通しと大きく異なる結果となることがあり得ます。従って、当社として、その確実性を保証するものではあり ませんのでご了承ください。
【Note】
We pay close attention to the content of the material, but the Company and information providers will not be liable for any damage caused by errors in the information posted or damage suffered based on the information posted in this material. The current plans and strategies of the Company posted in this material are forecasts prepared by the Company based on information currently available, and these future forecasts include risks and uncertainties. Accordingly, the actual results may differ materially from the forecasts posted. Please note that the Company does not guarantee the certainty of these forecasts.
Copyright©2026 ITOCHU ENEX CO.,LTD.All rights reserved.
34
【添付資料3】
伊藤忠エネクス株式会社 (東証プライム 証券コード:8133)
2027年3月期第2四半期(中間期) 決算説明会資料(兼補足説明資料) 2026年10月30日
Copyright©2020 ITOCHU ENEX CO.,LTD. All rights reserved. Copyright©2026 ITOCHU ENEX ENEX CO.,LTD. All rights Copyright©2020 ITOCHU CO.,LTD. All reserved. rights reserved.
ご注意
資料の内容につきましては細心の注意を払ってはおりますが、掲載された情報の誤り及び当資料に掲載された情報に基づいて 被ったいかなる損害についても、当社及び情報提供者は一切責任を負いかねます。 また、当資料に記載されている当社の現在の計画、戦略などは、当社が現時点で入手可能な情報を基礎として作成した見通し であり、これらの将来予測には、リスクや不確定な要因を含んでおります。そのため、実際の業績につきましては、記載の見通しと 大きく異なる結果となることがあり得ます。したがって、当社として、その確実性を保証するものではありませんのでご了承ください。 本資料の数値について、特に断りのない場合はすべて国際会計基準(IFRS)ベースで記載しています。
Copyright©2020 ITOCHU ENEX CO.,LTD. All rights reserved. Copyright©2026 ITOCHU ENEX CO.,LTD. All rights reserved.
1
業績ハイライト 2027年3月期第2四半期(中間期)決算概要 ■ 当社株主帰属中間純利益は146億円。 ■ 基礎収益(一過性損益を除いたもの)は127億円。
■ カーライフ事業におけるCSの売却に伴う一過性の利益と石油販売事業の堅調な推移、及び産業ビジネス事業 における関連会社の売却に伴う一過性の利益と市場環境を適切に捉えたオペレーションにより、当社株主帰属 中間純利益は増益。
売上収益 売上 総利益
4,763億円
営業利益
196億円
513億円
当社株主帰属 中間純利益
146億円 Copyright©2020 ITOCHU ENEX CO.,LTD. All rights reserved. Copyright©2026 ITOCHU ENEX CO.,LTD. All rights reserved.
2
目次 1 .2027年3月期第2四半期(中間期)決算概要 1) 全社概要 2) セグメント別概要
2.Appendix
Copyright©2020 ITOCHU ENEX CO.,LTD. All rights reserved. Copyright©2026 ITOCHU ENEX CO.,LTD. All rights reserved.
3
- 2027年3月期第2四半期(中間期)決算概要 1)全社概要
Copyright©2020 ITOCHU ENEX CO.,LTD. All rights reserved. Copyright©2026 ITOCHU ENEX CO.,LTD. All rights reserved.
4
2027年3月期第2四半期(中間期) 決算/サマリ- (億円)
25年度 1-2Q実績
26年度 1-2Q実績
26年度 通期計画
増減
売上収益
4,117
4,763
+646
売上総利益
442
513
+71
▲339
▲337
+2
0
17
+16
112
196
+85
5
24
+19
69
146
+77
76.5%
65.7%
10.8 pt の改善
販管費 固定資産損益 営業利益
持分法による投資損益 当社株主帰属中間純利益 売上総利益に対する販管費率
25年度実績 中間配当(円/株)
26年度実績
31
進捗率
245
80%
165
88%
増減
34
+3
❏ 当社株主帰属中間純利益は146億円となり、通期計画に対する進捗率は88%。 ❏ 基礎収益(一過性損益を除いたもの)は127億円。 ❏ カーライフ事業におけるCSの売却に伴う一過性の利益と石油販売事業の堅調な推移、及び産業ビジネス事業における関 連会社の売却に伴う一過性の利益と市場環境を適切に捉えたオペレーションにより、当社株主帰属中間純利益は増益。 Copyright©2020 ITOCHU ENEX CO.,LTD. All rights reserved. Copyright©2026 ITOCHU ENEX CO.,LTD. All rights reserved.
5
セグメント別当社株主帰属中間純利益 (億円)
25年度 1-2Q実績
26年度 1-2Q実績
146 140
45
120
100
80
69 16
40
26
0
▋カーライフ(前年同期差:+29億円、計画進捗率:90%) CSの売却に伴う一過性の利益及び石油販売事業の堅調な推移により増益
▋産業ビジネス(前年同期差:+27億円、計画進捗率:99%) 関連会社の売却による一過性の利益及び堅調な需給オペレーションにより増益
60
20
主たる増減要因
54
18
▋ホームライフ(前年同期差:+16億円、計画進捗率:61%) LPガス輸入価格の上昇に伴う連結子会社及び持分法適用会社における在庫影響により 増益
▋電力・ユーティリティ(前年同期差:+4億円、計画進捗率:87%)
22
26
電力市場価格の高騰により電力小売利幅が縮小した一方、前年同期に実施した発電所 の定期修繕影響の反動により増益
3
3
▋共通(前年同期差:△0億円)
2
Copyright©2020 ITOCHU ENEX CO.,LTD. All rights reserved. Copyright©2026 ITOCHU ENEX CO.,LTD. All rights reserved.
6
財政状態 季節・市況要因による営業債権減少等で総資産減少 (億円)
:季節・市況要因による営業債権減少等で 前期末比99億円減少し、4,428億円。
4,900
❏ 株主資本 :四半期純利益の積上げ等により、前期末比109億円 増加し、1,926億円。
3,900
❏ 総資産
(億円)
26年3月末 実績
26年9月末 実績
0.15
2,900
増減
2,400
4,428
△99
1,900
ネット有利子負債
▲197
▲137
+60
1,400
株主資本
1,818
1,926
+109
900
43.5%
4,428
3,400
4,527
40.2%
4,527
4,400
総資産
株主資本比率
0.25 (倍)
+3.4 pt
400
▲0.07
▲0.11倍
▲0.07倍
+0.04 pt
-600
0.05
▲0.05
▲0.11
-100
ネットDER
1,926
1,818
▲197
▲137
26/3末
26/9末
総資産
ネット有利子負債
株主資本
▲0.15 ネットDER (右軸)
Copyright©2020 ITOCHU ENEX CO.,LTD. All rights reserved. Copyright©2026 ITOCHU ENEX CO.,LTD. All rights reserved.
7
キャッシュ・フロー 堅調な実質営業CFの創出を継続 23年度 1-2Q実績
(億円)
24年度 1-2Q実績
25年度 1-2Q実績
26年度 1-2Q実績
125
171
209
126
5
▲78
▲73
▲83
▲200
100
▲20
実質投資キャッシュ・フロー(※1)
205
▲178
▲73
▲63
財務活動によるキャッシュ・フロー
▲212
▲96
▲118
▲95
実質営業キャッシュ・フロー(※2)
126
201
179
247
営業活動によるキャッシュ・フロー 投資活動によるキャッシュ・フロー 親会社への預け金
(※1)親会社への預け金を除く投資キャッシュ・フロー (億円) (※2)「営業CF」-「運転資金等の増減」
250
205
150 営業CF 実質投資CF 財務CF 実質営業CF
50
126
209
▲50
▲250
▲212 23年度 1-2Q実績
179
171
125
▲150
247
201
▲178 24年度 1-2Q実績
▲96
126 ▲73
25年度 1-2Q実績
▲118
▲63
▲95
26年度 1-2Q実績
Copyright©2020 ITOCHU ENEX CO.,LTD. All rights reserved. Copyright©2026 ITOCHU ENEX CO.,LTD. All rights reserved.
8
投資の推移
物流事業の買収、モビリティ関連DX、蓄電池事業投資等を実行 (億円)
350
250
50
34
40
292
300
26年度1-2Q実績 セグメント別
(億円)
投資実績(全社)※
27
30 20
225
9
10
200
167
176
174
0
カーライフ
産業ビジネス
ホームライフ
150
88
100
50 0 21年度 (通期)
22年度 (通期)
23年度 (通期)
24年度 (通期)
25年度 26年度 (通期) (1-2Q実績)
15 3 電力・ ユーティリティ
共通
主な新規・戦略投資実績 ▋カーライフ
物流関連事業、DX関連投資等
▋産業ビジネス
アスファルト事業、内航タンカー投資等
▋ホームライフ
LPガス営業権買収等
▋電力・ユーティリティ
蓄電池投資等
▋共通
ー
(※)投資によるキャッシュアウトのみの数値であり、キャッシュインは含みません。 Copyright©2020 ITOCHU ENEX CO.,LTD. All rights reserved. Copyright©2026 ITOCHU ENEX CO.,LTD. All rights reserved.
9
- 2027年3月期第2四半期(中間期)決算概要 2)セグメント別概要
Copyright©2020 ITOCHU ENEX CO.,LTD. All rights reserved. Copyright©2026 ITOCHU ENEX CO.,LTD. All rights reserved.
10
セグメント別業績 25年度 1-2Q実績
(億円)
26年度 1-2Q実績
増減率 %
増減
26年度
通期計画
進捗率
全社
売上収益 営業利益 当社株主帰属中間純利益
4,117 112 69
4,763 196 146
+646 +85 +77
+15.7% +75.8% +111.4%
― 245 165
― 80% 88%
▋カーライフ
売上収益 営業利益 当社株主帰属中間純利益
2,892 29 16
3,071 75 45
+179 +46 +29
+6.2% +156.4% +182.1%
― ― 50
― ― 90%
▋産業ビジネス
売上収益 営業利益 当社株主帰属中間純利益
553 34 26
816 62 54
+262 +28 +27
+47.4% +82.6% +104.1%
― ― 54
― ― 99%
▋ホームライフ
売上収益 営業利益 当社株主帰属中間純利益
298 2 2
340 12 18
+43 +10 +16
+14.4% +434.4% +845.6%
― ― 30
― ― 61%
▋電力・ ユーティリティ
売上収益 営業利益 当社株主帰属中間純利益
374 41 22
536 41 26
+162 +1 +4
+43.3% +1.5% +19.7%
― ― 30
― ― 87%
Copyright©2020 ITOCHU ENEX CO.,LTD. All rights reserved. Copyright©2026 ITOCHU ENEX CO.,LTD. All rights reserved.
11
▋カーライフ事業 (億円)
25年度 1-2Q実績
売上総利益
26年度 1-2Q実績
増減
230
256
+26
▲203
▲200
+3
営業利益
29
75
+46
当社株主帰属 中間純利益
16
45
+29
販管費
25年度 1-2Q実績
26年度 1-2Q実績
増減比
24
+13
ガソリン(千KL)
1,077
1,007
△6%
5
+3
軽油(千KL)
1,389
1,316
△5%
新車(千台)
11
11
△4%
中古車(千台)
9
8
△5%
エネクスフリート
10
日産大阪販売
2
(当社持分52.63%)
CS※数
50
販売数量
26年度 1-2Q実績
26年 3月末
26年 9月末
1,496
1,474
増減
進捗率
CSの売却に伴う一過性の利益及 び石油販売事業の堅調な推移に より増益。
増減
25年度 1-2Q実績
主な関係会社損益
26年度 計画
主たる増減要因
90%
△22 (※)CSとは、カーライフ・ステーションの略であり、当社が提案する複合サービス給油所 Copyright©2020 ITOCHU ENEX CO.,LTD. All rights reserved. Copyright©2026 ITOCHU ENEX CO.,LTD. All rights reserved.
12
▋産業ビジネス事業 (億円)
25年度 1-2Q実績
売上総利益
26年度 1-2Q実績
増減
66
96
+30
販管費
▲34
▲34
+0
営業利益
34
62
+28
当社株主帰属 中間純利益
26
54
+27
主な関係会社損益 伊藤忠工業ガス
25年度 1-2Q実績
26年度 1-2Q実績
4
4
26年度 計画
主たる増減要因
関連会社の売却による一過性の利 益及び市場環境を適切に捉えたオ ペレーションにより増益。
54
25年度 1-2Q実績
26年度 1-2Q実績
重油(千KL)
317
391
+23%
アスファルト(千t)
135
134
△1%
産業用ガス(千t)
30
31
+4%
増減
販売数量
+0
進捗率
99%
増減比
Copyright©2020 ITOCHU ENEX CO.,LTD. All rights reserved. Copyright©2026 ITOCHU ENEX CO.,LTD. All rights reserved.
13
▋ホームライフ事業 (億円)
25年度 1-2Q実績
売上総利益
26年度 1-2Q実績
増減
78
89
+11
▲77
▲77
△0
営業利益
2
12
+10
持分法損益
2
16
+13
当社株主帰属 中間純利益
2
18
+16
販管費
26年 9月末
増減
LPガス直売軒数
568
564
△5
25年度 1-2Q実績
26年度 1-2Q実績
増減比
177
174
△2%
伊藤忠エネクス ホームライフ
2
4
+2
エコア (当社持分51%)
1
4
+2
エネアーク (当社持分50%)
1
4
+3
販売数量
ジャパンガスエナジー (当社持分20%)
1
9
+8
LPガス(千t)
増減
30 26年 3月末
26年度 1-2Q実績
進捗率
LPガス輸入価格の上昇に伴う連結 子会社及び持分法適用会社にお ける在庫影響により増益。
顧客軒数(千軒)
25年度 1-2Q実績
主な関係会社損益
26年度 計画
主たる増減要因
61%
Copyright©2020 ITOCHU ENEX CO.,LTD. All rights reserved. Copyright©2026 ITOCHU ENEX CO.,LTD. All rights reserved.
14
▋電力・ユーティリティ事業 (億円)
25年度 1-2Q実績
売上総利益
26年度 1-2Q実績
増減
69
73
+4
販管費
▲31
▲33
△2
営業利益
41
41
+1
当社株主帰属 中間純利益
22
26
+4
30
26年度 1-2Q実績
増減
顧客件数(千件)
エネクス電力グループ
4
7
+3
電力供給件数(全社計)
エネクスライフサービス
5
1
△4
東京都市サービス
8
7
△1
2
1
△1
(当社持分66.6%)
王子・伊藤忠エネクス電力販売 (当社持分60.0%)
26年 3月末
26年 9月末
318
87%
増減
339
+21
販売数量
25年度 1-2Q実績
26年度 1-2Q実績
増減比
電力小売(GWh)※
1,387
1,915
+38%
高圧販売※
856
1,409
+65%
低圧販売※
530
506
△5%
熱供給量(TJ)
842
715 △15%
内訳
進捗率
電力市場価格の高騰により電力小 売利幅が縮小した一方、前年同期 に実施した発電所の定期修繕影 響の反動により増益。
25年度 1-2Q実績
主な関係会社損益
26年度 計画
主たる増減要因
(※)電力小売については、取次数量を含む Copyright©2020 ITOCHU ENEX CO.,LTD. All rights reserved. Copyright©2026 ITOCHU ENEX CO.,LTD. All rights reserved.
15
- Appendix
Copyright©2020 ITOCHU ENEX CO.,LTD. All rights reserved. Copyright©2026 ITOCHU ENEX CO.,LTD. All rights reserved.
16
(参考)市場動向 原油・CP・電力共に直近3ヵ月は前年同期間を上回る価格で推移 前年同月
直近一年(2025.10~2026.9)
Dubai原油価格推移
直近3ヵ月平均
($/bbl) 128.52
74.94
80.41
72.62
73.23
65.00
64.47
62.05
61.97
2025/10
2025/11
2025/12
2026/1
プロパンCP価格推移
105.70
79.45
77.92 68.40 2026/2
635
495
2025/10
635
475
495
2025/11
2025/12
63.73
69.27
70.87
69.39
70.01
2026/3
2026/4
2026/5
2026/6
2026/7
2026/8
2026/9
卸電力取引市場推移
70.09
直近3ヵ月平均 635
615
545
545
2026/2
2026/3
525
2026/1
前年差 +22.98
93.07
76.75
67.74
($/MT) 625
88.75
72.49
750
625
113.71
103.15
750
760 580
615
610
600
2026/4
2026/5
2026/6
575 2026/7
(円/kWh)
17.91 12.68
12.42
12.26
12.43
13.94
12.12
11.67
10.55
10.58
11.27
10.45
11.31
2025/10
2025/11
2025/12
2026/1
2026/2
2026/3
14.77
14.06
9.82
8.92
2026/4
2026/5
620
625
520
520
2026/8
2026/9
19.14
19.12
15.10
10.87 2026/6
前年差 +70
608 538
直近3ヵ月平均 18.72 前年差 +6.60
12.75
11.98
11.62
2026/7
2026/8
2026/9
12.12
Copyright©2020 ITOCHU ENEX CO.,LTD. All rights reserved. Copyright©2026 ITOCHU ENEX CO.,LTD. All rights reserved.
17
Appendix 【参考】 ガソリン・軽油の国内販売状況(全国統計) ガソリン月別販売量単位(千kL)
前年同月
直近一年(2025.9~2026.8)
4,032 3,909
3,761 3,628 3,724
2025/9
3,558 3,816
3,564
2025/10
軽油月別販売量
3,444
2025/11
3,601 3,450 3,352
2025/12
2026/1
3,261
2026/2
2,627
2,662
3,310
2026/3
2026/4
3,482 3,442
3,366
2026/5
2026/6
2026/7
4,010
2026/8
2,651
2,450
2,335
2025/11
2025/12
2,754
2,649
2,650
2,649
2025/10
3,397
3,900
単位(千kL)
2,455
2025/9
3,622
3,588
3,182
2,736 2,636
4,164
2026/1
2,424
2,607
2,687
2,410
2,514
2,420
2026/2
2,607 2,519
2,465
2,392
2,367
2026/3
2026/4
2026/5
2026/6
2,474
2026/7
2026/8
※経済産業省の統計資料を基に作成 Copyright©2020 ITOCHU ENEX CO.,LTD. All rights reserved. Copyright©2026 ITOCHU ENEX CO.,LTD. All rights reserved.
18
Appendix 【参考】 LPガス月別販売数量(9月~8月全国統計) 9月
10月
11月
単位(千t)
12月
1月
2月
2024
2025
増減
2024
2025
増減
2024
2025
増減
2024
2025
増減
2025
2026
増減
2025
2026
増減
家庭・ 業務用
377
394
+5%
494
483
△2%
563
581
+3%
767
813
+6%
793
786
△1%
737
733
+0%
自動車 用
29
29
+1%
31
27
△14%
28
26
△7%
29
29
+0%
26
25
△3%
25
24
△5%
合計
406
423
+4%
525
510
△3%
591
607
+3%
796
842
+6%
819
811
△1%
762
757
△1%
3月
4月
5月
6月
7月
8月
合計
2025
2026
増減
2025
2026
増減
2025
2026
増減
2025
2026
増減
2025
2026
増減
2025
2026
増減
前年 年間
直近 年間
増減
家庭・ 業務用
728
730
+0%
616
594
△4%
522
482
△8%
456
435
△5%
425
447
+5%
351
369
+5%
6,828
6,846
+0%
自動車 用
28
27
△1%
26
25
△4%
27
24
△12%
28
26
△8%
31
29
△7%
29
27
△8%
338
319
△6%
合計
756
757
+0%
642
619
△4%
549
506
△8%
484
460
△5%
455
476
+5%
381
396
+4%
7,167
7,165
+0%
※日本LPガス協会の統計資料を基に作成 Copyright©2020 ITOCHU ENEX CO.,LTD. All rights reserved. Copyright©2026 ITOCHU ENEX CO.,LTD. All rights reserved.
19
Appendix 【参考】新車/月別販売台数(普通車・小型車、軽自動車)(10月~9月全国統計) 単位(千台)
10月
11月
12月
1月
2月
3月
2024
2025
増減
2024
2025
増減
2024
2025
増減
2025
2026
増減
2025
2026
増減
2025
2026
増減
普通・ 小型車
231
214
△7%
222
202
△9%
185
182
△2%
217
200
△8%
234
211
△10%
288
265
△8%
軽自 動車
106
114
+7%
108
105
△3%
96
96
+1%
112
108
△3%
120
117
△3%
133
142
+7%
合計
338
328
△3%
331
307
△7%
280
278
△1%
328
308
△6%
355
329
△7%
421
408
△3%
4月
5月
6月
7月
8月
9月
合計
2025
2026
増減
2025
2026
増減
2025
2026
増減
2025
2026
増減
2025
2026
増減
2025
2026
増減
前年 年間
直近 年間
増減
普通・ 小型車
191
223
+17%
178
187
+5%
217
248
+14%
221
243
+10%
160
173
+8%
230
236
+3%
2,574
2,585
+0%
軽自 動車
96
91
△5%
92
89
△2%
112
112
+1%
106
109
+3%
89
80
△11%
128
124
△3%
1,297
1,290
△1%
合計
287
315
+10%
269
277
+3%
329
360
+10%
326
351
+8%
249
253
+1%
357
361
+1%
3,871
3,875
+0%
※ 日本自動車販売協会連合会及び 全国軽自動車協会連合会の統計資料を基に作成 Copyright©2020 ITOCHU ENEX CO.,LTD. All rights reserved. Copyright©2026 ITOCHU ENEX CO.,LTD. All rights reserved.
20
Appendix 2026年度取り組み状況(トピック) SUIREN GT
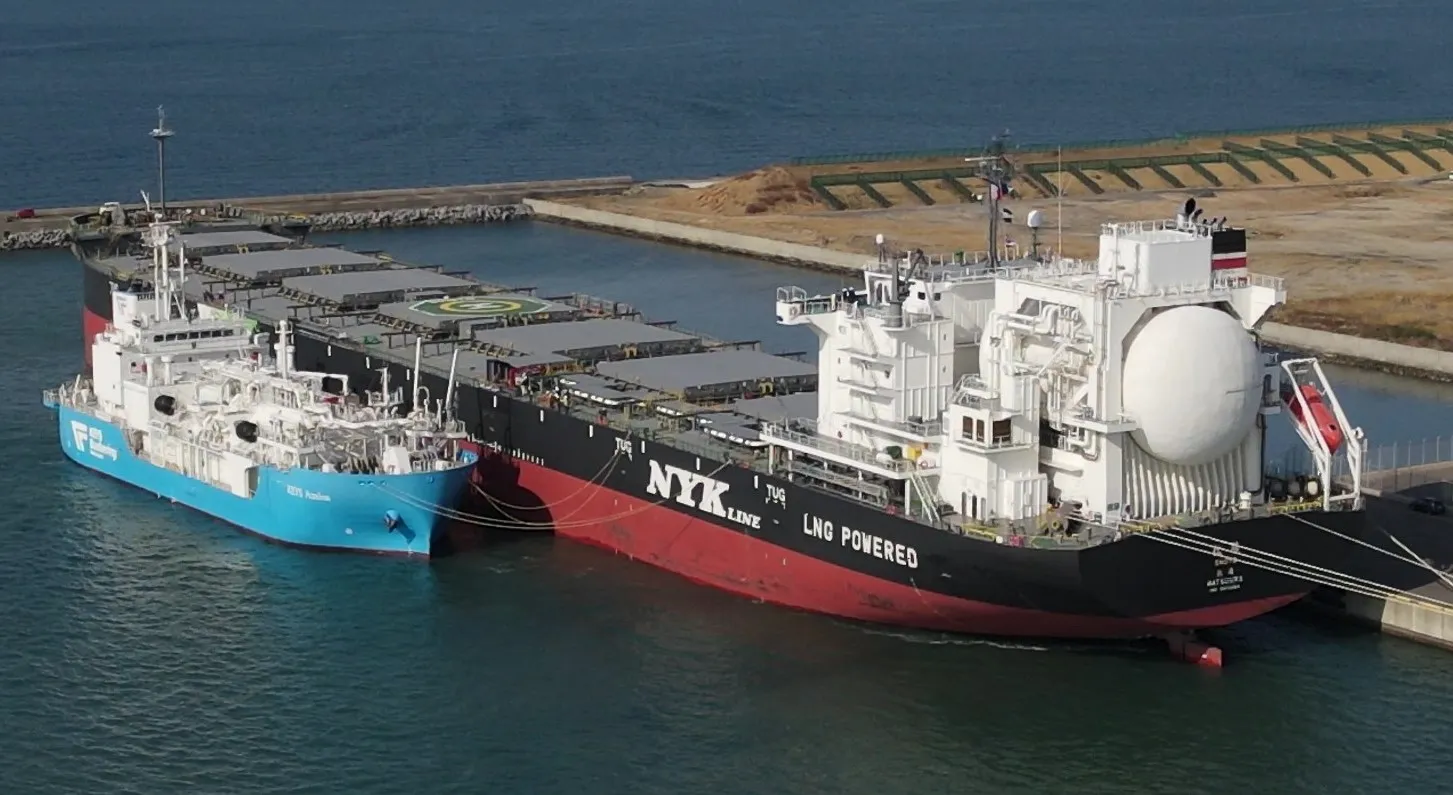
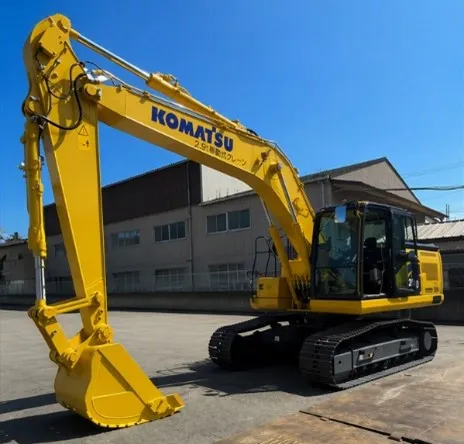
当社保有船で最大の内航タンカー「SUIREN GT」が就航。 エネルギーの安定供給を支える海上輸送体制を強化すると ともに、SAFなど次世代燃料の輸送にも対応し、燃料の多 様化を物流面から支える。
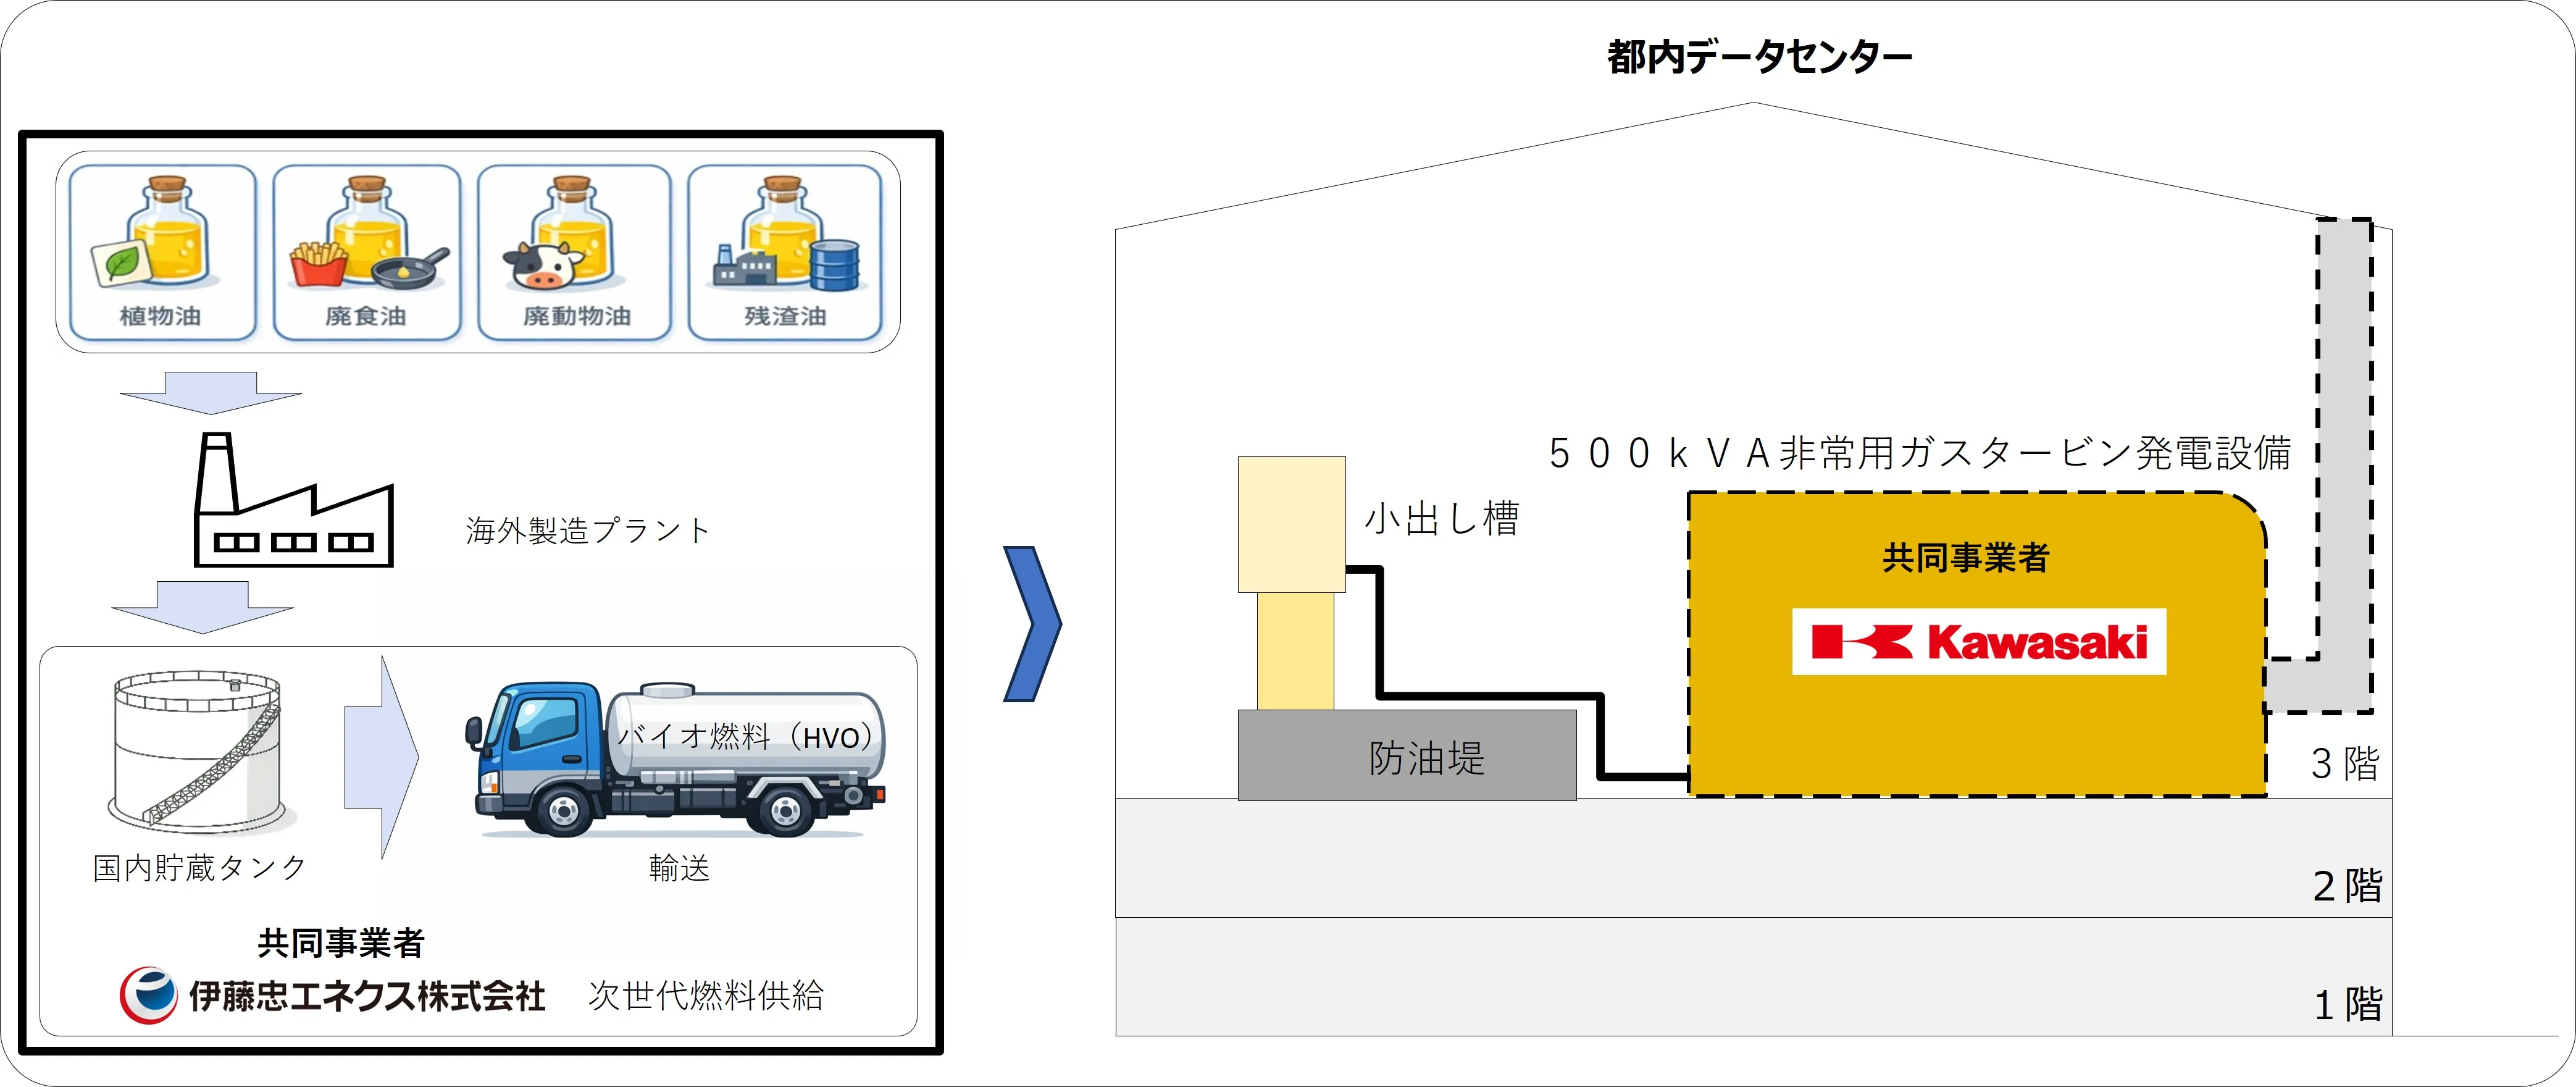
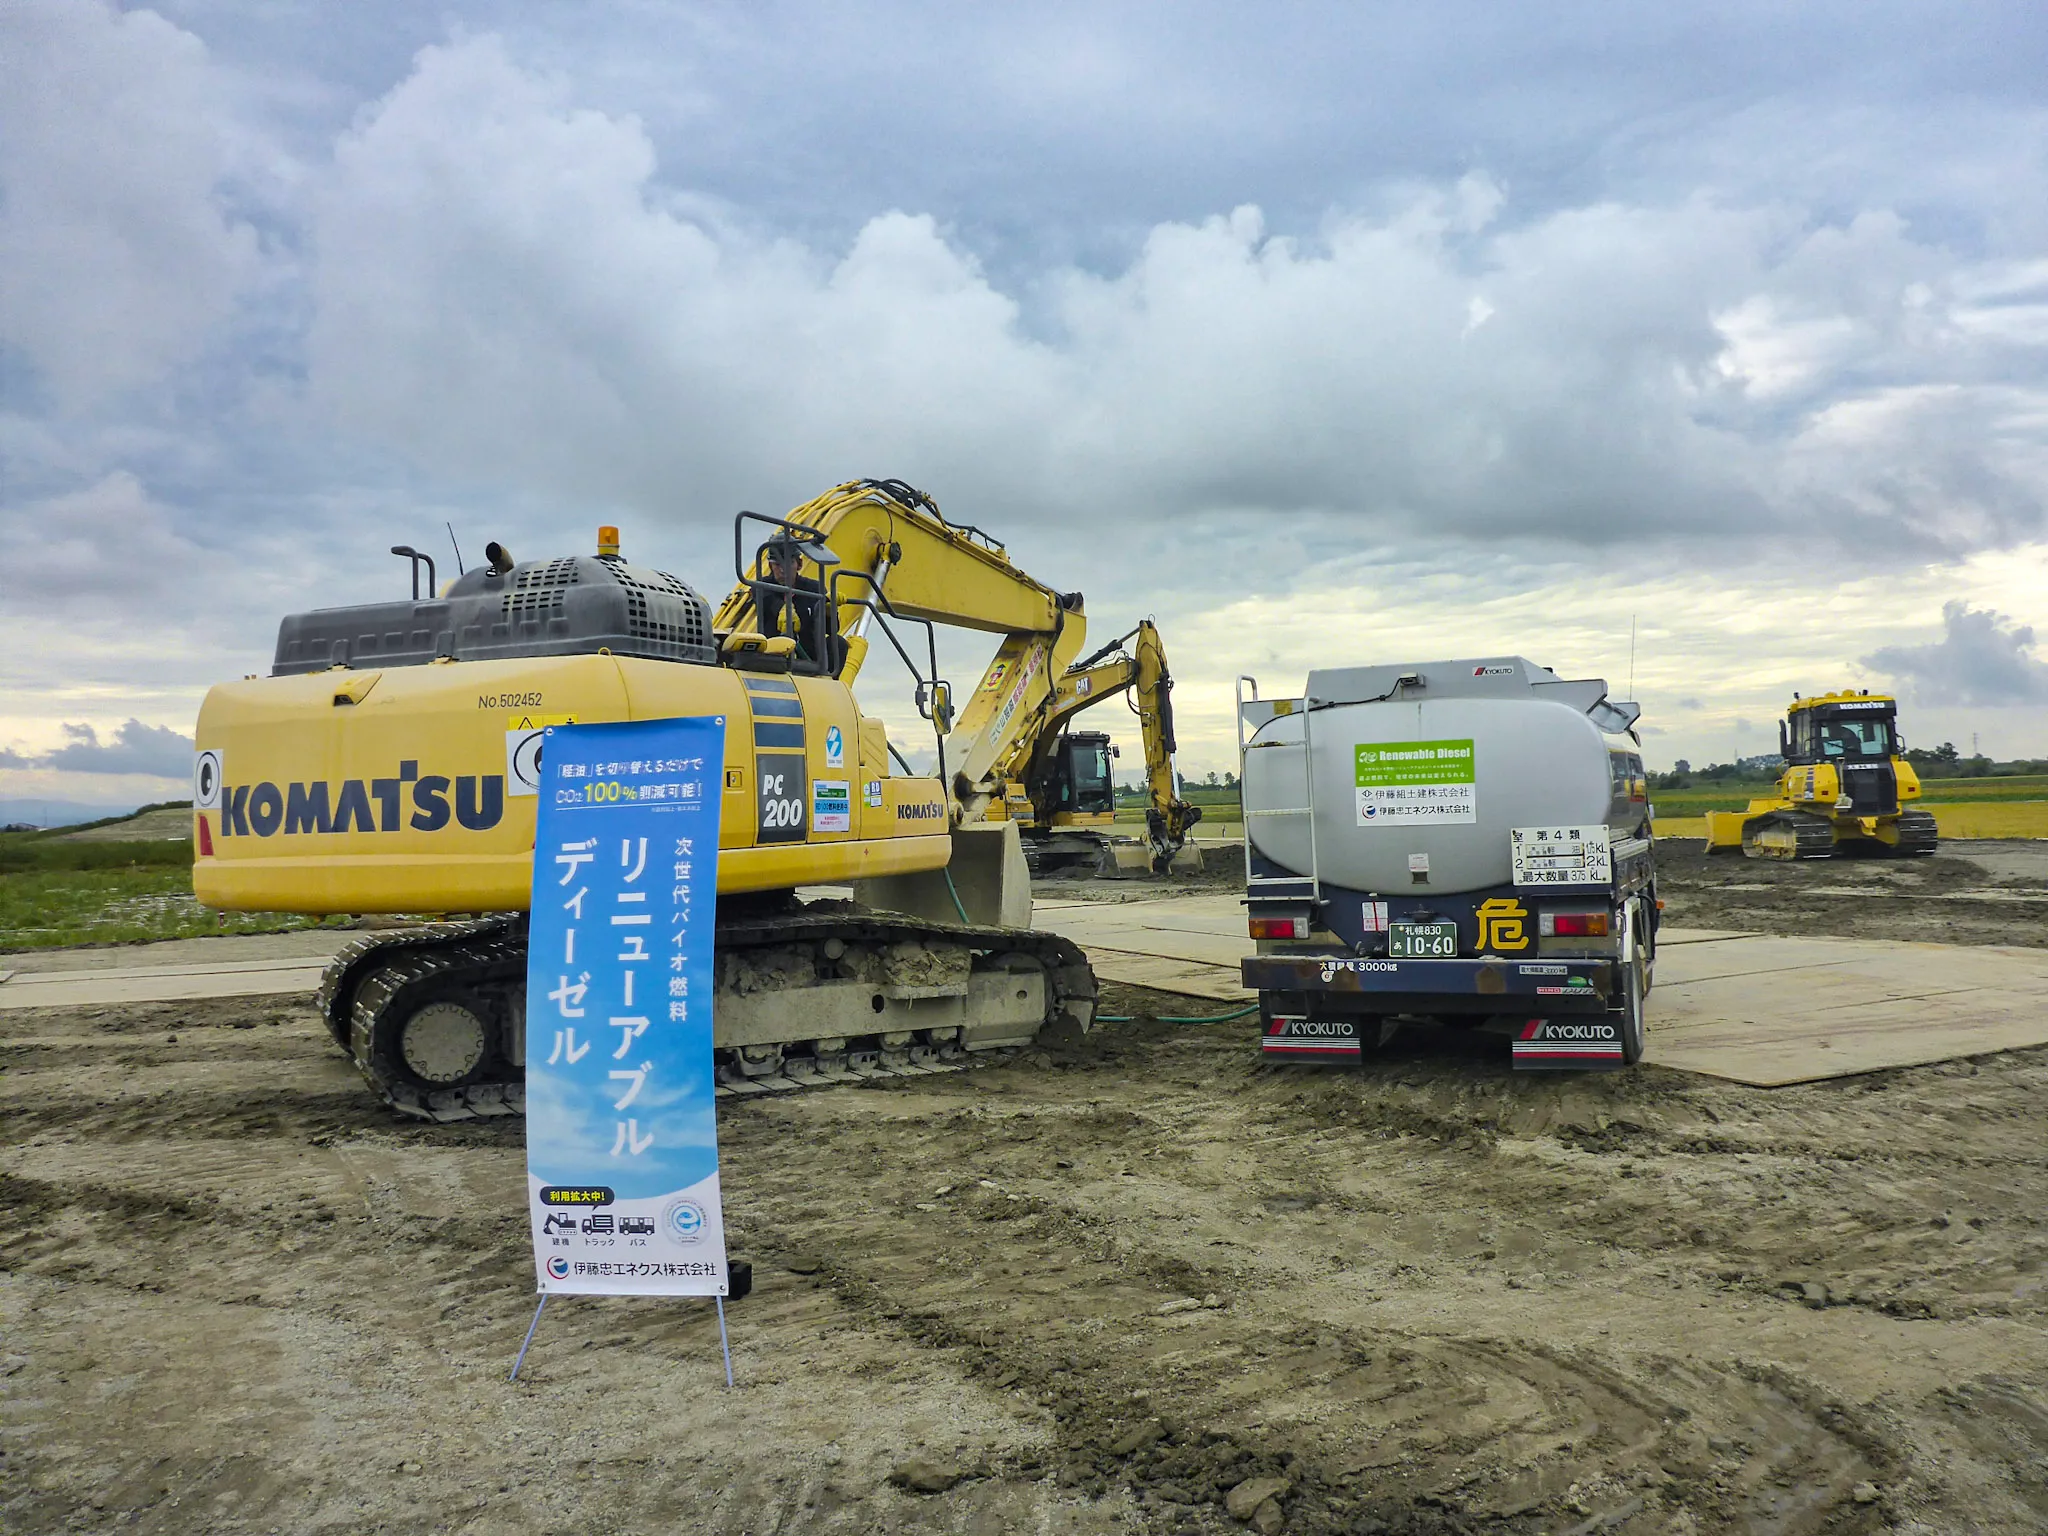
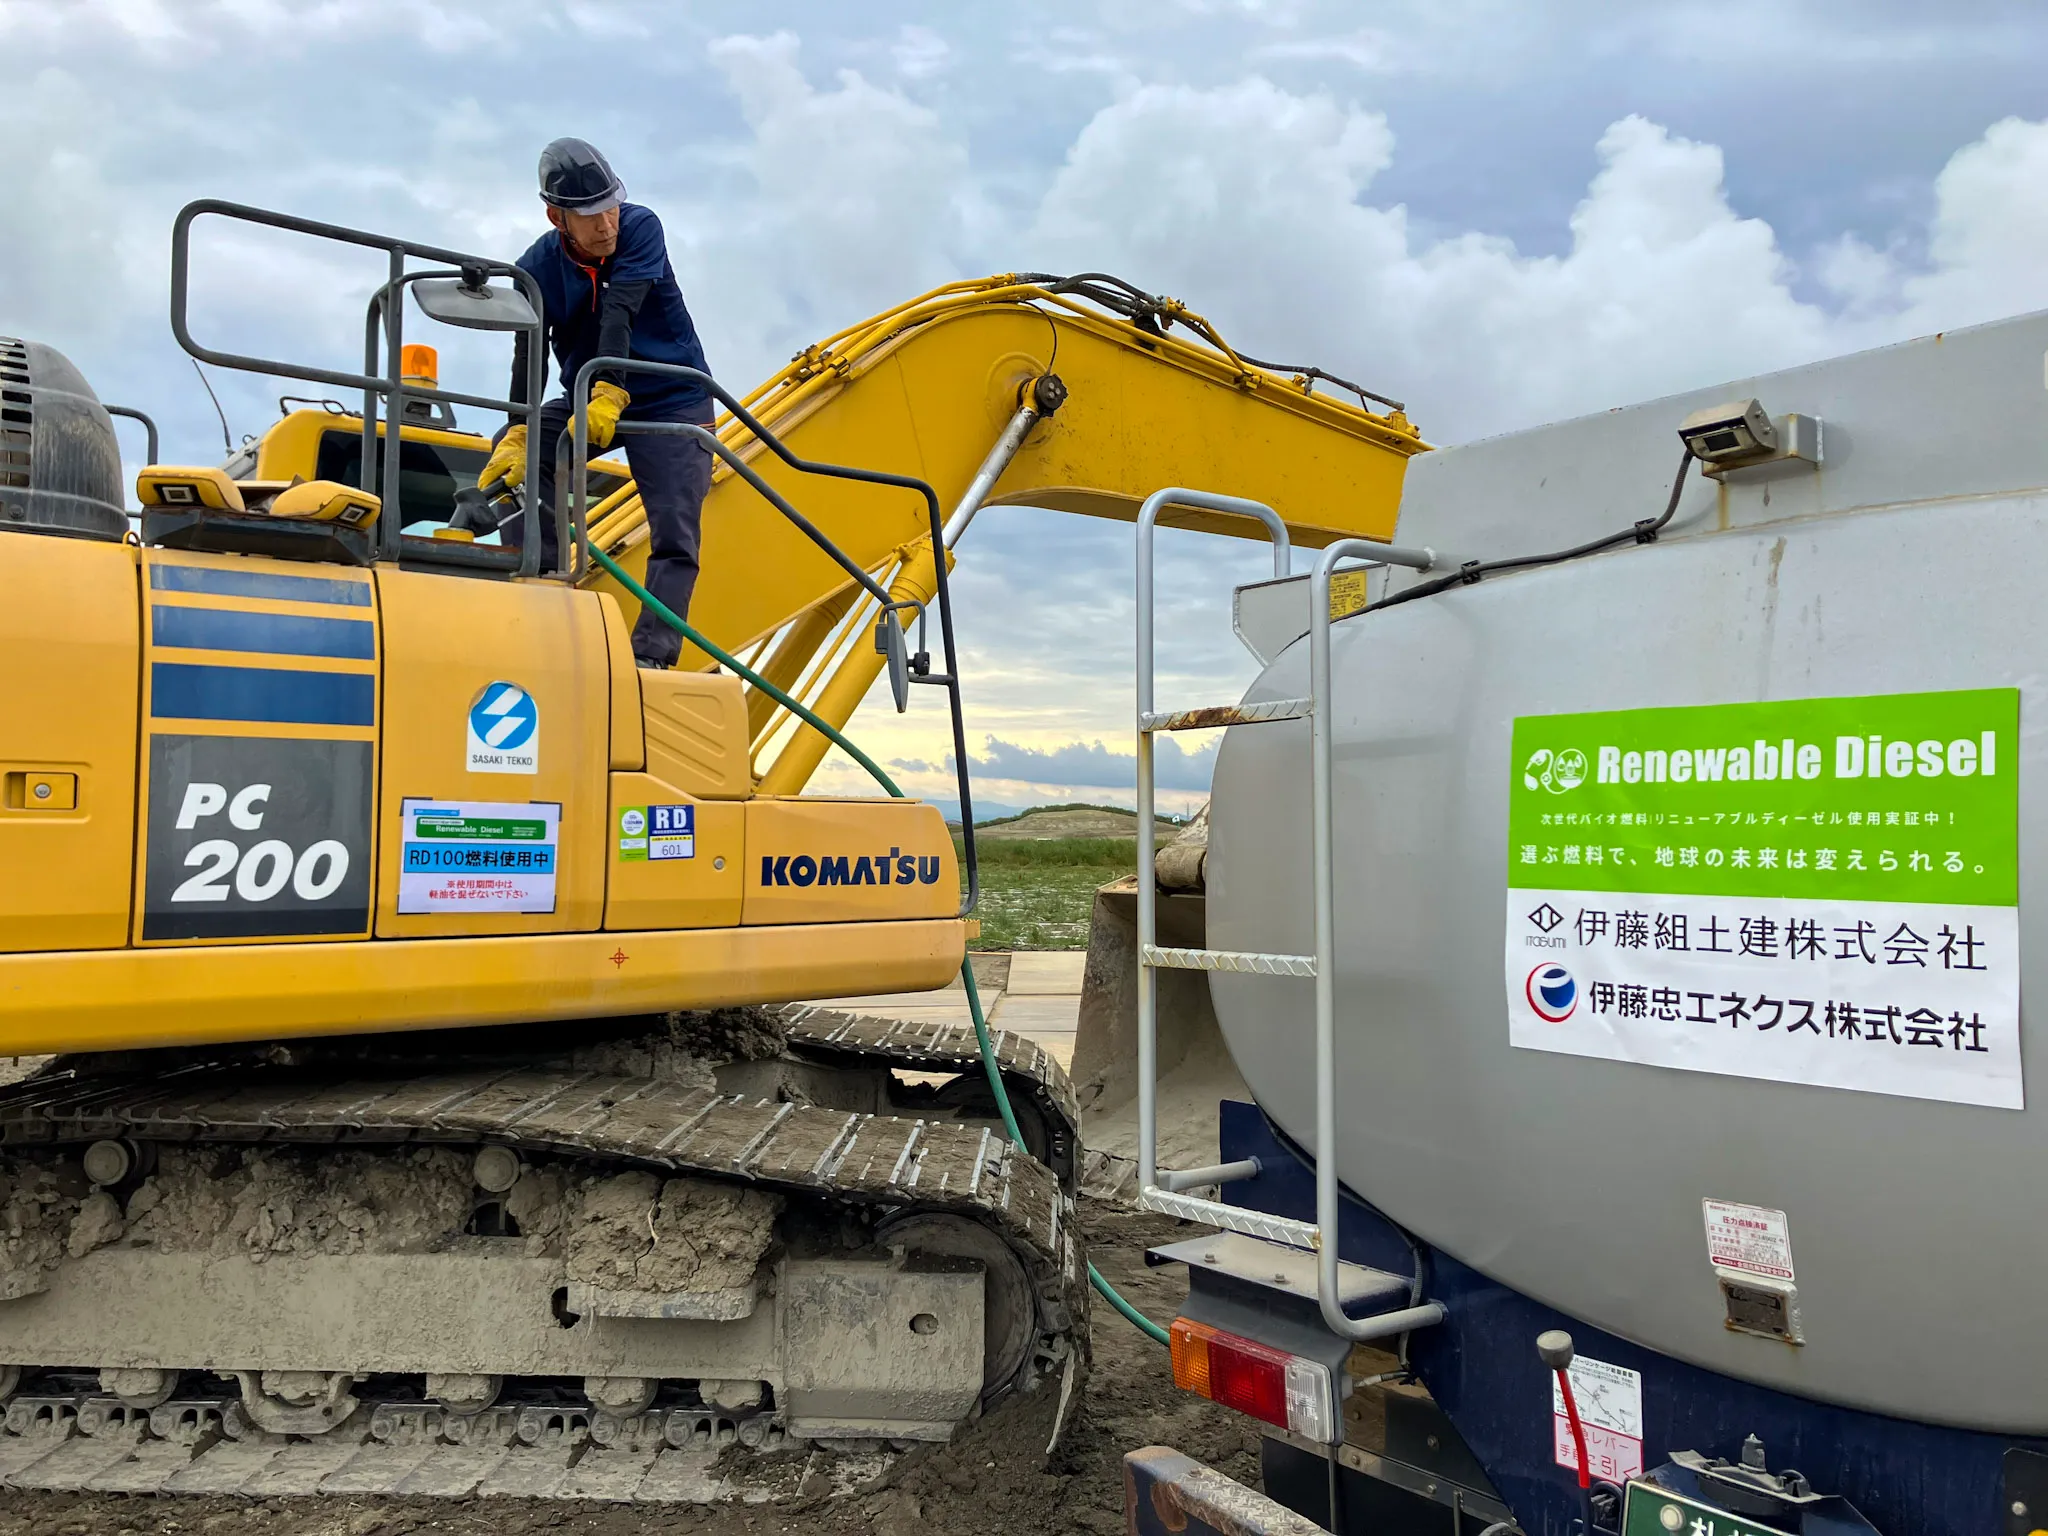
次世代バイオ燃料導入に向けた取り組み
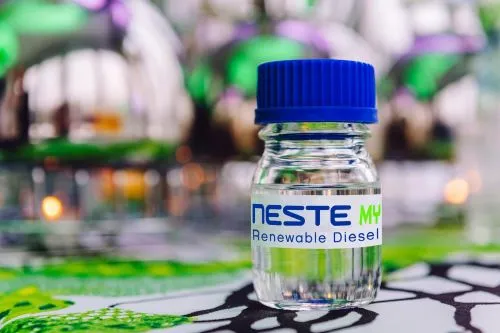
JR九州グループの保有する鉄道車両で、次世代バイオ燃料 FINE DIESEL(リニューアブルディーゼル/最大40%と軽油 の混合油)を使用する実証試験を開始。 Copyright©2020 ITOCHU ENEX CO.,LTD. All rights reserved. Copyright©2026 ITOCHU ENEX CO.,LTD. All rights reserved.
21
Appendix 2026年度取り組み状況(トピック) ㈱AGENCIAの株式取得
系統用蓄電池事業への出資参画
※イメージ画像(28年9月稼働開始予定)
人工知能技術を用いた360°画像生成サービスを提供する ㈱AGENCIAの株式を取得。「360°画像×AI」技術による モビリティ関連領域のDX社会実装と事業拡大を図る。
大分県日出町における系統用蓄電池事業(51MW) に参画。再生可能エネルギーの導入拡大に伴う調整力需 要の拡大を見据え、次世代電力インフラ分野への事業領 域拡大と収益基盤の強化を推進。 Copyright©2020 ITOCHU ENEX CO.,LTD. All rights reserved. Copyright©2026 ITOCHU ENEX CO.,LTD. All rights reserved.
22
問い合わせ先
IR・財務課 担当:坂本、森田 【TEL】03-4233-8025 【FAX】03-4533-0103 【E-MAIL】[email protected]
Copyright©2020 ITOCHU ENEX CO.,LTD. All rights reserved. Copyright©2026 ITOCHU ENEX CO.,LTD. All rights reserved.
23





 社長メッセージ
 中期経営計画 ENEX2030
 統合報告書(エネクスレポート)
 What's ENEX(5分でわかるエネクス)
 統合報告書(エネクスレポート)
 有価証券報告書「サステナビリティ情報開示」
 コーポレート・ガバナンス報告書
 What's ENEX(5分でわかるエネクス)
 決算短信・決算説明会資料
 統合報告書(エネクスレポート)


Prompts
Click prompts to add them under the company line, click again to take one out, then copy the result into your AI chat. Shared by Asian Century Stocks and Uncovered Thai Stocks. Thank you.
ETFs Holding Itochu Enex Co., Ltd.
Exchange-traded funds whose newest published daily portfolio holds one of the company's listings, largest weight first.
| ETF | Weight in ETF | Shares | Market value | As of |
|---|---|---|---|---|
| AVDV | 0.05% | 731,900 | $ 9.426M | Nov 16, 2026 |
| AVDS | 0.02% | 6,100 | $ 78.559K | Nov 16, 2026 |
| DXIV | 0.02% | 3,000 | $ 38.555K | Nov 12, 2026 |
| DFIS | 0.01% | 60,300 | $ 774.962K | Nov 12, 2026 |
| DFSI | 0.01% | 7,400 | $ 95.103K | Nov 12, 2026 |
| DFIC | 0.01% | 73,800 | $ 948.462K | Nov 12, 2026 |
| DFAX | 0.00% | 40,400 | $ 519.212K | Nov 12, 2026 |
| DFAI | 0.00% | 31,000 | $ 398.405K | Nov 12, 2026 |
| DISV | 0.00% | 23 | $ 295.59 | Nov 12, 2026 |
| AVDE | 0.00% | 21,800 | $ 280.752K | Nov 16, 2026 |