SANGETSU REPORT 2026 サンゲツ統合報告書 SANGETSU REPORT 2026 表紙デザイン 表紙デザインは、サンゲツのシンボルマーク8色を ベースにし、それぞれの色が混ざり合い融合するこ とでひとつの大きな力へと変化していく姿を表現し…
SANGETSU
REPORT
2026
サンゲツ統合報告書
SANGETSU REPORT 2026 表紙デザイン
表紙デザインは、サンゲツのシンボルマーク8色を
ベースにし、それぞれの色が混ざり合い融合するこ
とでひとつの大きな力へと変化していく姿を表現し
ました。多様性を力に変え、それぞれの個性が境界
を越えてつながることで、変革と挑戦を重ね、新たな
イノベーションを生み出していくサンゲツの意志と、
未来へと力強く踏み出す姿勢を象徴しています。
編集方針
SANGETSU REPORT 2026のポイント
対話・開示の全体像と本報告書の位置付け
財務情報
● 決算・経営戦略説明会
対話
● 機関投資家とのミーティング
● 個人投資家向けIRイベント
● 株主総会
開示
資料
WEB
● 決算短信
● 有価証券報告書
● 事業報告書
●
非財務情報
Point1
目指す企業像の再定義と変革への決意
● 施設見学会
● 機関投資家と監査等委員との対話
● 株主さま向け会社説明会
SANGETSU REPORT
● コーポレート
財務情報と非財務情報を
合わせた統合報告書
ガバナンス報告書
● 環境レポート
IR・投資家情報サイト
サステナビリティサイト
https://www.sangetsu.co.jp/
https://www.sangetsu.co.jp/
company/ir/
company/sustainability/
2026年度にスタートした「中期経営計画 2029」の発表にあわせて、
「素材とデザ
インを起点に、インテリアから文化をつくる企業」を新たな目指す企業像に掲げま
した。
トップメッセージでは、
「変革と挑戦」
「イノベーションの創出」をスローガンに、
企業価値の向上を実現していく経営の決意をお伝えします。
▶トップメッセージ|P.08
Point2
強みを価値創造につなげる仕組み
素材・デザイン・物流・施工を統合し、
ソリューション提案を担う
「トータルインテリ
統合報告書「SANGETSU REPORT」は、サンゲツグループの価値創造のプロセスや成長戦略など
ア」は、幅広い顧客層をカバーする販売ネットワークを通じて、その価値を最大化し
について、ステークホルダーの皆さまにご理解いただくことを目的として毎年発行しています。本
ています。本セクションでは、独自のビジネスモデルによる価値提供を通じて、経済
報告書の編集にあたっては、財務情報と非財務情報の有機的な連携を意識し、客観的かつ透明性
価値と社会価値を生み出す仕組みを紹介します。
の高い情報開示に努めています。なお、作成においてはIFRS財団の「国際統合報告フレームワー
▶サンゲツグループの価値創造|P.14
ク」や、経済産業省の「価値協創ガイダンス」をはじめとする国内外の枠組みを参考にしています。
「収益認識に関する会計基準」の適用について
2021年度の期首から
「収益認識に関する会計基準」
( 企業会計基準第29号 2020年3月31日)な
どを適用しており、2021年度以降に係る各数値については、当該会計基準などを適用した後の数
値となっています。
Point3
成長戦略「中期経営計画 2029」
中期経営計画では、国内インテリア事業の収益力を一段と高めるとともに、海外イ
ンテリア事業を利益成長の牽引役へと成長させます。さらに、エクステリアや空間
将来の見通しに関する注記事項
本報告書に記載されている、将来に関する記述を含む歴史的事実以外の全ての記述は、当社グループ
総合事業を育成し、新規事業の創出にも挑みます。本セクションでは、事業ポート
が現在入手している情報に基づく、2026年8月末時点における予測、期待、想定、計画、認識、評価など
フォリオの最適化、戦略的な資本配分、人的資本やデジタル資本の強化など、具体
を基礎として記載しています。
また、予想数値を算定するためには、過去に確定し正確に認識された事実
的な戦略や施策を解説します。
以外に、予想を行うために不可欠となる一定の前提(仮定)を用いています。
▶成長戦略「中期経営計画 2029」|P.22
● 報告の対象範囲
● 対象期間
株式会社サンゲツおよびグループ会社
2025年4月1日〜2026年3月31日 ● 発行月
2026年9月
01
0
INDEX
01 サンゲツグループのあゆみとビジョン
03 成長戦略「中期経営計画 2029」
05 サステナビリティ
03 コーポレートアイデンティティ
22 中期経営計画【BX 2025】の振り返り
44 サステナビリティマネジメント
04 At a Glance
23 「中期経営計画 2029」のビジョンと全体戦略
45 知的資本
06 サンゲツグループのあゆみ
25 事業戦略国内インテリアセグメント
46 持続可能なサプライチェーンマネジメント
08 トップメッセージ
28 事業戦略国内エクステリアセグメント
47 社会参画
29 事業戦略海外セグメント
49 自然資本
「誠実」を原点に、インテリアから心豊かな未来をつくる。
31 財務・資本戦略
34 経営基盤の強化
35 人材戦略
37 DX戦略
04 特集企画
38 「社長×社員」座談会
06 ガバナンス
53 役員紹介
54 コーポレートガバナンス
60 コンプライアンス
61 リスクマネジメント
強みを掛け合わせ、未来を創る
−サンゲツグループの変革と挑戦
02 サンゲツグループの価値創造
07 データセクション
14 価値創造プロセス
62 10年間の連結財務サマリー
15 強み・競争優位性
63 ESGデータ集
18 経営資本
64 会社概要・株式情報
19 マテリアリティ
65 株主・投資家との対話、外部評価
02
01
サンゲツグループのあゆみとビジョン
コーポレートアイデンティティ
当社は、
「中期経営計画 2029」の始動にあたり、企業理念に加えて社是「誠実(INTEGRITY)」を改めて掲げました。
「誠実(INTEGRITY)」は、1849年の創業以来、私たちが大切にしてきたDNAであ
り、アイデンティティであり、常に立ち返るべき原点です。また、当社が目指す企業像を「素材とデザインを起点に、インテリアから文化をつくる企業」
と定めました。当社のコアである、素材・デザイン・物流・
施工を統合したソリューション提案力、すなわち「トータルインテリア」を磨き続けることで、経済価値と社会価値の両立を実現し、持続的かつ力強い成長を目指していきます。
Corporate Credo │社是
Brand Statement │ブランドステートメント
誠実(INTEGRITY)
Sangetsu Group Philosophy │サンゲツグループ企業理念
Corporate Vision │目指す企業像
素材とデザインを起点に、インテリアから文化をつくる企業
Purpose │存在意義
すべての人と共に、やすらぎと希望にみちた空間を創造する。
サンゲツは、襖や障子といった表具に始まり、さまざまなインテリア商品に、
素材・デザイン・施工・物流を掛け合わせ、空間の価値を高め、届ける力を磨いてきました。
時を過ごす空間は、人々の生活に、そして人生に、やすらぎと希望をもたらしえます。
これからもその強みを起点に、お客さまの求める暮らしを実現し、
安心して快適に過ごせる空間は、人々に明日を生きる力を、
新たな暮らしの文化を育んでいきます。
よろこびと感動にみちた空間は、未来を思い描く力を与えます。
サンゲツグループは、空間に関するあらゆる人々の想いや課題を分かち合い、
デザインとクリエイティビティの力により、誰もが明日の夢を語れる世界の実現に貢献します。
海外
インテリア
事業
Dream │実現する未来像
インテリア事業
誰もが明日の夢を語れる世界
海外
空間総合
事業
素材
Belief │大切にする信念
施工
企業の誠実さが、社会を変える力になる。
トータル
インテリア
●
●
物流
自我と共創
変革と飛躍
エクステリア
事業
インテリア事業
●
空間総合事業
国内エクステリアセグメント
デザイン
エクステリア事業
海外セグメント
Way │私たちの姿勢
自由と公正
国内インテリアセグメント
空間総合
事業
●
海外インテリア事業
●
海外空間総合事業
03
01 サンゲツグループのあゆみとビジョン | At a Glance
At a Glance
歴史と信頼
[創業]
事業体制
[営業利益黒字継続]
1849
73
年
年
[国内事業拠点]
53
拠点
33 拠点
9 拠点
製造拠点 3 拠点(壁紙製造)
ショールーム 8 拠点
営業拠点
物流拠点
[グループ会社]
11
[自己資本比率]
64.3
素材
社
%
うち海外
グループ会社
4社
成長と稼ぐ力
施工
トータル
インテリア
デザイン
[売上高]
2,064
経営基盤
[営業利益]
億円
194
[社員数]
億円
3,299
名
うちサンゲツ単体
物流
海外
30 %
国内
70 %
1,345 名
[取締役構成]
[ROIC]
13.7
%
[ROE]
12.5
※ROIC=税引後営業利益÷(運転資本+有形固定資産+無形固定資産)
%
社外取締役比率
57
%
(4名/7名)
女性取締役比率
29
%
(2名/7名)
04
01 サンゲツグループのあゆみとビジョン | At a Glance
国内インテリアセグメント(インテリア事業・空間総合事業)
サンゲツグループは、市場ニーズ、社会課題に応える「品揃え」、並
[売上高構成比]
79.5 %
びに、素材・デザイン・物流・施工を統合し、ソリューション提案を担う
「トータルインテリア」をコアとしています。
場に提供するインテリア事業、並びに、空間に関する幅広いソリューション提案
を行う空間総合事業は、サンゲツグループの基幹事業です。
施工・その他
ファブリックユニット
101
184
億円
(6.2%)
億円
(11.2%)
1,641
売上高
床材ユニット
壁装ユニット
556
799
億円
(33.9%)
億円
床材市場シェア
壁装材
市場シェア
億円
2025年度
2,064
住宅から非住宅、あらゆる室内空間を彩る壁装材、床材、ファブリック等を市
塩ビ製床シート
約
30〜50%
プリント系
塩ビ製床タイル
●
カーペットタイル等
億円
(48.7%)
※各シェアは当社推計
※カッコ内は売上高構成比
[売上高構成比]
売上高
1,641
営業利益
73
1
海外セグメント
350
▲0.4
194
業績の詳細|https://www.sangetsu.co.jp/company/ir/library/briefing̲report.html
3.5%
北米、東南アジア、中国・香港を重点市場としてインテ
東海・関東地方を中心に 住宅 の 門扉、フェンス、カー
リア事業を展開し、今後の高成長を実現していきます。東
ポートをはじめとしたエクステリア商品を取り扱い 、空
南アジアにおいては空間総合事業にも参入しています。
間提案から施工までを一貫して行っています。
中国・香港
東南アジア
2,064
国内エクステリアセグメント(エクステリア事業)
[売上高構成比]
17.0%
(億円)
193
国内エクステリアセグメント
合計
55%
●
●
海外セグメント(海外インテリア事業・海外空間総合事業)
国内インテリアセグメント
約
2.5
33.2
%
※セグメント業績はグループ会社 サングリーンのみで構成
%
350億円
北米
※地域別割合は各地域の売上高単純合計より算出
64.3
%
プライベートブランドカタログ
「Greenscape」
05
01 サンゲツグループのあゆみとビジョン | サンゲツグループのあゆみ
COMPANY HISTORY 1849~1989
サンゲツグループは、創業以来一貫してさまざまな「空間」に携わり、インテリアを通して、
社会の発展に貢献するための挑戦を続けてきました。
この思いを受け継ぎ、私たちは、企業理念「すべての人と共に、やすらぎと希望にみちた空間を創造する。」のもと、
さらなる価値創造を目指しています。
100億円達成
売上高:
営業利益:
1849
1953
1960
くりに深く携わった表具師にあります。
「施工現場のニー
ズ」や「職人の立場」を理解し、対応する姿勢は、当社の事
業活動における原点でもあり、現在の基盤となっています。
涅槃図裏面
日比弥助の署名(嘉永2年)
1953年株式会社山月堂商店設立
1956年他社に先駆け、壁紙の取り扱いを開始
1960年社是「誠実」を制定
初の壁紙見本帳「60-61 SSユニーククロス」を
発刊
1965年初の自社オリジナル壁紙「エリート」を発売
1950年代当時、壁紙は日本に導入されたばかりの先
進的な商品でした。当初は問屋として事業を展開していま
1980
1970~1989
当社の原点は、襖や障子をしつらえ、当時の内装空間づ
1950~1969
1849~
1849年表具師日比弥助が山月堂を創業
1970
1970年
1989
株式会社サンゲツへ改称
1970年〜 ジャスト・イン・タイムの原点となる
全国物流網の基盤を構築
ファブリックへと商品ラインアップを拡充
1979年〜床材、
1980年
名古屋証券取引所市場第2部上場
1980年〜 テレビCMの開始や大型ショールームを開設
1989年
世界デザイン博覧会「インテリア館」出展
全国の物流網整備や、床材・ファブリックの商品ライン
したが、販売を通じて得た顧客ニーズに迅速かつ的確に応
アップ拡充等を推進し、空間のソリューション提案を行う
えたいという思いから、当時の社長・日比賢昭は、
「素材・デ
「トータルインテリア」の基盤を確立しました。
これらを通じ、
ザイン」を企画・開発するブランドメーカーへの転換を決断
サンゲツブランドとして市場における確固たるポジションを
しました。
構築していきました。
社旗
「SSユニーククロス」見本帳
本社ショールーム
自社直行便の開始
06
01 サンゲツグループのあゆみとビジョン | サンゲツグループのあゆみ
2,000億円達成
COMPANY HISTORY 1990~2025
1,000億円達成
売上高:
営業利益:
1990
2000
1996年東京証券取引所市場第1部上場
(現東証プライム市場)
ニューヨーク・シンガポール事務所開設
現地法人サンゲツアメリカ設立
2005年 サングリーン社をグループ会社化し、
エクステリア事業に参入
2006年総合展示発表会「デザイニングショー」開催
2008年山田照明社をグループ会社化し、照明事業に参入
(2019年同社株式を譲渡)
2014~2025
1990~2013
1991年売上高1,000億円達成
2010
2016年
2014
北米の壁紙製造・販売業Koroseal社を
グループ会社化し、海外事業を本格化
2016年〜物流機能の高度化や効率化を目指し、国内物流網の
2017年
2020
2025
(年度)
2021年壁紙の安定供給を実現すべく、
ウェーブロックインテリア社
(現クレアネイト社)
をグループ会社化し、製造事業に参入
2024年新たな価値創造拠点となるPARCs Sangetsu Group
再構築に着手
Creative Hub開設
フェアトーン社をグループ会社化し、空間総合事業に参入
D Perception社をグループ会社化し、
アジア地域での
シンガポールの内装材専門商社Goodrich社を
グループ会社化し、
アジアの事業展開を加速
日本国内市場で培った知見、
ノウハウを横展開し、市場の成長を
取り込むべく、海外事業を拡大しています。
海外空間総合事業に参入
を公表
2026年「中期経営計画 2029」
コアである
「トータルインテリア」のソリューション提案力をさらに
高度化し、持続的な成長に向けた成長戦略を推し進めています。
経営インフラの基盤強化を図るとともに、事業領域の
拡大に着手しました。
エクステリア事業への参入
Koroseal社本社
関西ロジスティクスセンター
新たな価値創造拠点「PARCs」
クレアネイト社東広島事業所
07
01 サンゲツグループのあゆみとビジョン | トップメッセージ
TOP MESSAGE
「誠実」を原点 に、
インテリアから心豊 かな
未来をつくる。
社長メッセージ
株式会社サンゲツ
代表取締役社長執行役員
近藤康正
色や素材を選び、空間を思い描くことには、日々の暮らしをより心地よく、心豊かなものへと
変えていく喜びがあります。また、
インテリアは、美しさや快適さだけでなく、新たな機能やデザ
インによって、人々にやすらぎや希望をもたらし、社会が抱えるさまざまな課題の解決にも貢献
できるものです。私たちは、創業以来受け継いできた「誠実」を原点に、
こうしたインテリアの可
能性を追求していきます。
「素材とデザインを起点に、
インテリアから文化をつくる企業」を目指し、
グループの多様な
人財と機能を結集するとともに、パートナーの皆さまとの協働を深めることで、人々の感性を
刺激し、新たな喜びをもたらす商品や空間を社会へ広げてまいります。
08
01 サンゲツグループのあゆみとビジョン | トップメッセージ
「トータルインテリア」のコアに立ち返り、その強みを梃子とする成長戦略へ
当社は1849年に表具師として創業し、1950年代から、壁
ことで、商品提供にとどまらず、空間を通じて人々の感性を
機会が広がっています。
紙をはじめ、床材、
カーテン等へと商品を広げながら、卸売に
こうした課題や 環境認識 のもと、当社は「中期経営計画
とどまらず、商品の企画・開発から物流、施工までを一貫して
2029」において、改めて自社のコアに立ち返り、その強みを
担う独自のビジネスモデルを築いてまいりました。その根幹
梃子とする成長戦略へと舵を切ります。
刺激し、多様な暮らしの実現に貢献していきます。
また、新たな中期経営計画のスタートに合わせて、改めて
「誠実(INTEGRITY)」を社是として掲げます。創業以来、
である
「トータルインテリア」の価値提供は、サンゲツブランド
そのうえで、目指す企業像を「素材とデザインを起点に、
イ
「誠実」は社員全員、そして、ステークホルダーの皆さまをつ
へ の安心感と信頼の源泉であり、高い市場シェアにもつな
ンテリアから文化をつくる企業」
と定めました。これは、
「トー
なぐ当社のDNAであり、アイデンティティであり、常に立ち返
がっています。
タルインテリア」
というコアへの回帰であるとともに、
より強固
るべき原点であります。
「誠実(INTEGRITY)」を社是とし、
その一方で、既存市場の汎用化、量産化に対応するなか
な収益基盤の確立に向けた新たな出発点となるものです。
社員一人ひとりが誠実さと倫理観を持ち、自らの信念に忠実
で、成長市場や新たな市場に対し、当社が本来持つ訴求力
当社のコアは、
インテリア商品の品揃えの拡充にとどまら
を十分に発揮しきれない側面がありました。
また、中核である
ず、素材・デザイン・物流・施工を統合し、
ソリューション提案
日本国内でのインテリア事業への依存度が 高く、新たな事
を担う
「トータルインテリア」にあります。私たちはこの強みを
業を生み出し、育成していくことが課題となっていました。
基盤に、空間に新たな価値をもたらし、人々の感性と暮らし
こうしたなか、2020年に発表した長期ビジョン【DESIGN
に行動してまいります。
を豊かにしてきました。今後は、このコアをさらに進化させる
2030】
( 2020~2029年度)では、
「内装企業からスペースクリ
エーション企業への転換」
を掲げ、事業領域の拡張と提供価
値の高度化に取り組んできました。スペースクリエーション
企業 へ の 転換を加速 す べく、中期経営計画【 B X 2 0 2 5 】
(2023~2025年度)では、人的資本とデジタル資本の強化を
通じて、提案力の向上と事業基盤の拡充を推進しました。
こ
海外
インテリア
インテリア事業
事業
海外
空間総合
事業
国内インテリアセグメント
の6年間において、主力であるインテリア事業は着実に成長
素材
●
を遂げ、海外においても収益改善が進んだ一方、空間総合
事業とエクステリア事業については、それぞれの事業特性に
施工
起因する課題もあり、当初想定した成長スピードには至りま
物流
当社を取り巻く事業環境は大きく変化しています。国内市
価値観の多様化、社会課題の高度化、テクノロジーの進展、
エクステリア
事業
●
空間総合事業
国内エクステリアセグメント
デザイン
●
せんでした。
場の縮小や 人手不足といった制約が強まる一方、暮らしの
トータル
インテリア
インテリア事業
エクステリア事業
海外セグメント
空間総合
事業
●
海外インテリア事業
●
海外空間総合事業
さらには海外市場のポテンシャルにより、新たな価値創出の
09
01 サンゲツグループのあゆみとビジョン | トップメッセージ
「変革と挑戦」
「イノベーションの創出」の実行へ
当社 の日本国内でのインテリア事業 の基盤は強固であ
当社の成長を支える基盤は、人的資本とデジタル資本の
り、それを横展開して、海外インテリア事業の収益改善も着
両輪であり、
さらにその根幹にあるのは「人財」です。
「変革
実に進んでおります。
しかしながら、今後、国内市場の縮小
と挑戦」
「イノベーションの創出」を一人ひとりの行動として
が 避けられないなか 、当社の成長戦略においては、新たな
実践していくため、社員が 培うべき要件として、全社員に対
事業や 新たなビジネスモデルを生み出し、育成していくこと
して「構想力」
「実行力」
「倫理観」を加えて、管理職に対し
が 必要不可欠です。そのために、全社員、全グループ 員が
ては「戦略的意思決定」
「変革推進」
「リーダーシップ 発揮」
向き合っていくべきテーマが、
「変革と挑戦」
「イノベーション
を掲げました。これらの要件と連動した人事評価制度の運
の創出」であり、この二つを新中期経営計画 のスローガン
用も開始します。
として掲げました。
また、複雑化・高度化 する事業環境 のなか 、データ・ファ
2 0 2 4 年 4月に社長に就任して以来、私は一貫してこの二
クト・ロジックに裏付けられた意思決定プロセスの革新、な
つを発信してきました。従ってこれらを新中期経営計画のス
らびに、デジタル資本の戦略的活用を進め、生産性の向上
ローガンに掲げることは、必然であったと考えています。同
と新たな価値の創造を図ってまいります。
時に、改めてスローガンとして明示した狙いは、市場からの
成長期待にきちんと向き合い、成長を着実に実現するため
に、全社員、全グループ員の意識変革と行動変容を一層促
すことにあります。
デジタル資本の活用に向けた「変革と挑戦」の実践:
Googleローコードツール「AppSheet」利活用プロジェクト
中核であるインテリア事業においては、成長市場でのポジ
事業ポートフォリオの最適化
新中期経営計画のスタートに伴い、事業構造やビジネス
モデルの違い、そして経営資源の配分を明確にすべく、当社
グループが担う事業を、
「インテリア」
「海外インテリア」
「 エク
ステリア」
「空間総合」
「海外空間総合」の5つに分けて経営
管理を行うこととしました。
インテリア事業を引き続き当社グループの成長の中核とし
て強化し、
より強固な収益基盤を構築してまいります。海外に
おいても、
インテリアを軸として、北米およびアジアでの成長
を加速させます。
ショニング向上、
プロダクトミックスの最適化、サプライチェー
ンの最適化、モノづくり力の強化、企業ブランドの向上を重
点戦略とし、
さらなる進化を図ります。
注力市場分野としては、高成長が見込まれる非住宅分野
や、引き続き堅調な推移が見込まれるリフォーム・リニューア
ル分野において、当社のさらなるポジショニング向上の機会
があるものと位置付けています。そして、市場ニーズや 社会
課題の複雑化・高度化が加速するなか、市場へのアクセスを
今まで以上に強固なものにするとともに、社内においては商
品企画・開発、デザイン、営業、物流をはじめとする、すべて
空間総合事業とエクステリア事業は、
インテリア事業の強
の機能を一連のチェーンとして連携し、それぞれの市場分野
みを横展開した拡張領域として位置付け、そのシナジーを最
に適したソリューション提案力を高めます。また、個社の枠を
大化しながら、中長期的な成長事業として、着実に育成して
超えてパートナー企業とのアライアンスの強化を図り、新しい
まいります。
商品、新しいビジネスモデルの構築に取り組んでまいります。
10
01 サンゲツグループのあゆみとビジョン | トップメッセージ
海外インテリア事業については、当社グループの成長の
り、販売拠点の拡充や自社ブランド商品の開発を進め、
より
こうした事業ポートフォリオの最適化と各施策 の着実な
起爆剤として、収益力の飛躍的な向上を目指します。M&A
付加価値の高いビジネスモデルへの転換を目指します。
実行により、新中期経営計画の最終年度である2 0 2 9 年度
を通じて事業基盤を構築してきた北米・アジアでは、経営体
空間総合事業および 海外空間総合事業については、中
に売上高 2 , 5 0 0 億円、営業利益 2 5 0 億円、営業利益率 1 0 %
制 の 刷新 や、各地域での 緻密な成長戦略 の 推進により収
核であるインテリア事業とはビジネスモデルが異なることか
を達成する目標を掲げています。これらは、当社として確実
益改善が 進んでおり、成長フェーズへと移行しつつありま
ら、現時点では基盤構築を優先 する段階にあります。一方
に達成すべき水準と位置付けています。
す。北米では、
メーカー機能の高度化や 流通網の拡充に加
で、
インテリアに隣接し将来的にシナジーを創出できる事業
え、M&Aによる事業領域の拡大も視野に入れ 、成長を加速
であると確信しています。
トータルインテリアの一翼を担い、
させます。北米に比 べて改善スピードが 緩やかなアジアに
収益に貢献 する事業 へと育成 すべく、事業基盤構築 の 進
おいても、
グループ間の連携を強化して商品ポートフォリオ
捗や 収益性を見極めながら、段階的に投資を実行してまい
を拡充 するとともに、現地主導 の経営体制 の強化を進め、
ります。
さらに、既存事業 の隣接、周辺領域で、当社が 強 みを発
収益改善に取り組んでまいります。
揮できる新たな事業機会を探索し、将来の収益源となる新
エクステリア事業では、卸売をベースとする現在 の事業
規事業の立ち上げに臨んでまいります。
基盤から、いかに収益性を高めていくかが 課題となってお
● 事業ポートフォリオ
高
長期ビジョン【DESIGN 2030】2020年度〜2029年度
成長事業
中期経営計画
2029
空間総合事業
海外事業
インテリアとのシナジー
グル ープ全体 の成長と
を創出し、
収益性を向上
高収益化 を力強くリー
2026年度〜2029年度
中期経営計画
【BX 2025】
ドする牽引役
「変革と挑戦」
「イノベーションの創出」
2023年度〜2025年度
「次の飛躍に備える3年間」
次世代事業の探索・創出
成長性
売上高
営業利益
2,500
ROE
(単位:億円)
1,898
エクステリア事業
2,003
2,064
250
収益基盤 を高度化、
収益性を向上
インテリア事業
191
14.1%
グル ープのコアビジネスとして、
181
11.4%
事業の高度化による、キャッシュ
194
12.5%
14.0%
創出力を強化
育成事業
低
基盤事業
収益性
高
(年度)
2023
2024
2025
2029 計画
11
01 サンゲツグループのあゆみとビジョン | トップメッセージ
成長投資と資本最適化の両立
当社の資本配分に関する基本方針は、これまで同様、成
げてまいります。具体的には、重点事業であるインテリア事
有しています。今後は、投資規律を基本としながら、案件の
長投資と資本最適化を両立することです。新中期経営計画
業および海外インテリア事業を中心に、成長が期待でき、当
内容や 規模に応じて、手元資金と有利子負債を適切に組
では、営業利益率 1 0 % 、RO E 1 4 %の達成を重要な経営指
社の競争優位性を発揮できる分野へ 優先的に資本を配分
み合わせていきます。また、株主還元とのバランスを重視す
標として掲げ、収益性と資本効率の双方の向上を目指して
します。また、成長戦略を支える新素材や 新商品 の開発を
る考えに変わりはありません。安定増配を基本としながら、
います。
はじめとするR & D 機能の拡充、企業ブランディング の強化
自己株式取得も含めた、柔軟な還元策を検討していきます。
当社は、安定した収益基盤を背景に、健全な財務体質を
に向けた投資を拡大していきます。
維持してきました。中期経営計画【 B X 2 0 2 5 】では、基盤投
同時 に 、戦略投資と基盤投資 の 実効性を高 めるため 、
資が計画どおり進められた一方、収益に直結する成長投資
2025年4月に立ち上げた投融資委員会の権限を高め、案件
が十分には実行されなかったことにより、結果として手元資
ごとの戦略的意義、経済合理性、
リスクの所在と対応策等
金が 積み上がりました。新中期経営計画期間においては、
を多面的に検証し、
より精度の高い投資判断を行う体制の
事業戦略や 資本コストを踏まえ、中長期的な成長に向けた
構築を進めています。
資本構成については、有利子負債の活用余地を十分に
投資を戦略的に拡大し、持続的な企業価値 の向上につな
成長投資
企業
ブランディング
200億円
550億円
M&A
新規事業
250億円
〜
R&D
おきましては、脱炭素と資源循環に資する施策として、新素
材やリサイクル素材を活用した環境配慮型商品の開発、見
本帳のリサイクル推進、国内外グループ 会社における再生
可能エネルギーへの切り替え等を進めております。また、当
社グループにとどまらず、サプライチェーン全体への働きか
けや、パートナー企業とのアライアンスを通じて、環境負荷
株主還元
350億円
人的資本
デジタル資本
250億円
450億円
ロジスティクス
拠点整備
300億円
〜
〜
70億円〜230億円
営し収益を確保していくことを両立し、持続可能な社会 の
て事業活動を継続するための前提となっています。当社に
基盤投資
有利子負債の活用・資産圧縮
(手元流動性適正化含む)
社会的責任をしっかり果たすことと、企業経営を健全に運
地球環境保全の取り組みは、世界のあらゆる産業におい
450億円
〜
〜
770億円
な社会の実現があってこそ成り立つものです。企業としての
ンスの4点です。
Cash Out
戦略投資
730億円
当社の持続的な成長と企業価値の最大化は、持続可能
が、地球環境保全、人権尊重、社会貢献活動、そしてガバナ
中期経営計画 2029 キャッシュ・アロケーション(2026〜2029年度累計)
営業CFの創出
企業活動を通じた持続可能な社会の実現
実現 に向けて最大限貢献してまいります。その 軸となるの
財務戦略|資本配分
Cash In
サステナビリティ
の低減に取り組んでまいります。
12
01 サンゲツグループのあゆみとビジョン | トップメッセージ
人権尊重と社会貢献活動については、事業運営における
当社は「素材とデザインを起点に、
インテリアから文化を
人権 の尊重を徹底 するとともに、児童養護施設 のリフォー
つくる企業」という新たな企業像 のもと、自らのコアに立ち
ム、NPO・福祉団体への継続的な支援といった多岐にわた
返り、国内外のインテリア事業の収益力を高めるとともに、
る活動を進めており、今後はこうした取り組みをさらに拡大
その強みをいかしてエクステリア事業と空間総合事業を成
してまいります。
長事業として育成してまいります。
さらに、隣接・周辺領域に
ガバナンスの強化も、企業価値の向上に向けた最重要課
題の一つです。当社は、取締役会の実効性向上とコンプラ
おいて新たな収益源を創出し、持続的な成長へとつなげて
いきます。
イアンスの 徹底に、引き続き取り組んでまいります。コーポ
この成長戦略を実行するには、当社単独の力だけでなく、
レートガバナンス・コードの改訂を踏まえ、中長期的な企業
グループ 全体 の力や 社外 の知見を結集 することが 不可欠
価値の向上に主眼を置いて、取締役会を一段と活性化させ
です。連結経営を強化してグループ 内のシナジーを創出す
ていきます。新中期経営計画のモニタリングをはじめ、事業
るとともに、パートナー企業との協業やアライアンスも積極
運営上の重要事項に関する議論を深め、監督機能のさらな
的に進めてまいります。
る強化を図ります。
そして、経済価値と社会価値を両立させながら、持続的か
つ力強い成長を実現します。また、その進捗と成果を積極的
ステークホルダーの皆さまへ
私は、企業とは「創業の精神を尊重し、事業環境の変化に応
じて自らのカタチを変え、企業活動を通じて経済価値および社
に発信し、ステークホルダーの皆さまとの対話を深めていき
ます。新中期経営計画を着実に遂行し、新たな価値の創造
に挑み続けることで、皆さまのご期待に応え、企業価値のさ
らなる向上を実現してまいります。
会価値を創出し続けるもの」であると考えています。当社は創
業以来、177年にわたる歴史の中で品揃えを拡充し、
さまざまな
機能を強化するとともに、
それらを有機的に連携させてソリュー
ション提案力を高めることで、
「トータルインテリア」
というコアを
確立してきました。一方で、今、当社がステークホルダーの皆さ
まから問われていることは、
「その先に何があるのか」
「次の成
長戦略をどのように描くのか」
ということだと認識しております。
その問いに応えるためにも、数値目標 の裏付けとなる地
に足の着いた戦略を示し、具体的な施策を着実に実行して
いきます。
13
02
サンゲツグループの価値創造
価値創造プロセス
目指す企業像
素材 と デ ザ イン を 起点 に 、イン テ リ ア か ら 文化 を つ くる 企業
経営資本
Business Activities & Business Model
Output
中核である
「インテリア事業」の強みを梃子として、
商品・機能・体験の多角的な提供を通じて、経済価値の創出と3つの社会価値の実現を両立
「海外」
「エクステリア」
「空間総合」の成長を加速するとともに、
周辺隣接領域で新たな事業を生み出し、
人的資本
デジタル
資本
商品
イノベーションを創出する強靭な企業グループへの変革を実現する
海外
インテリア
事業
社会価値
インテリア事業
トータル
インテリア
あらゆる顧客層を
カバーする
販売ネットワーク
ソリューション 提案
施工
貢献する商品とサービス
海外
空間総合
事業
素材
社会・関係
資本
デザイン
● 消費者
(ユーザー)
● 多様なニーズに応える見本帳、
商品バリエーション
● 責任ある調達に基づく安全・安
心な品質
● 事業主・施主
機能
● デザイン・設計会社
● デベロッパー
● ハウスメーカー
● ホームビルダー
● ゼネコン・工務店
物流
● ウェルビーイングを実現する
空間ソリューション提案
● 強靭な製造・在庫・物流ネット
ワークに基づく安定供給
● 内装施工事業者
エクステリア
事業
空間総合
事業
長期ビジョン【DESIGN 2030】
2029年度計画
Inclusive みんなで
◎ 売上高
誰もが安心して快適に
2,500 億円
体験
● 代理店
● 見本帳やショールームを通じ
た「創るよろこび・選ぶよろこ
び」の提供
● 次世代の文化育成と地域社会
の発展に寄与する社会貢献プ
過ごせるインクルーシブな
社会の実現
◎ 営業利益
250 億円
◎ 当期純利益
170 億円
● リフォーム事業者
製造資本
知的資本
経済価値
● 地球環境保全、
社会課題解決に
財務資本
自然資本
Purpose
Outcome
◎ ROE
14.0%
◎ ROIC
11.0%
Sustainable いつまでも
地球環境を守る
サステイナブルな
社会の実現
Enjoyable 楽しさあふれる
より豊かで
エンジョイアブルな
社会の実現
ログラム
再投資・資本の強化
新たな課題への対応
す べ て の 人 と 共 に ︑や す ら ぎ と 希望 に み ち た 空間 を 創造 す る ︒
Input
社是|誠実(INTEGRITY)
14
02 サンゲツグループの価値創造 | 強み・競争優位性
強み・競争優位性
素材
当社の競争優位の源泉は、素材・デザイン・物流・施工の4つの機能を統合し、最適なソリューションを提供する「トー
施工
タルインテリア」にあります。
トータル
インテリア
販売ネットワーク
デザイン
さらに、多層的な顧客接点を有する販売ネットワークを通じて、多様なニーズをきめ細かく捉え、その実現まで一貫
して支援することで、
「トータルインテリア」の価値を最大化しています。
物流
4つの機能と販売ネットワークが生み出す競争優位
建築の意匠選定から施工に至るプロセスには、多層的にさまざまな関係者が 携わっており、それぞ
当社の強みの源泉は、事業部門がハブとなり、これら「4つの機能」と
「販売ネットワーク」を掛け合わ
れが商品選定において重視する価値やニーズは多種多様です。また、インテリア商品は建築工程の最
せて運用する総合力にあります。多様なお客さまの多層的なニーズに応えるソリューションを、日々の営
終段階にあたるため、前工程の遅れや工期変更の影響を受けやすく、現場では「工期厳守(即納・確実
業やショールーム活動を通じて迅速かつ最適に届けます。この「トータルインテリア」を実現するオペレー
な供給)」が強く求められます。こうした複雑かつ変化の激しい現場においては、多様な課題に応えるソ
ション力こそが、サンゲツグループの競争優位性につながっています。
リューションが不可欠です。当社は、業界最大規模の営業体制(単体約570名)に加え、全国9カ所のロジ
スティクス拠点やサービスクルーによる自社配送体制、全国8カ所のショールームを展開しています。約
販売ネットワークを通じた提供価値の最大化
拠点・体制
96,000社にのぼる幅広いお客さまとの接点を築き、日々の営業活動や年間150万件を超える問い合わ
せを通じて、現場ごとの細かなニーズや課題をいち早く・的確に捉えるインフラを整備しています。この
広範な販売ネットワークを通じて捉えたニーズに対し、最適な解決策を提供するための核となるのが、素
材・デザイン・物流・施工の4つの機能を統合し、
ソリューション提案を担う
「トータルインテリア」です。
グループ体制の強化を通じて培った4つの機能を
販売ネットワークと掛け合わせ、多様な顧客ニーズの実現を一貫して支援
9支社 33営業拠点
営業体制
営業員:単体約570名(連結約1,200名)
受電数:年間150万件以上
ショールーム
拠点
ショールーム8拠点
提供価値
全国をカバーする多層的な営業網(顧客数:約96,000社)
と受発注・即日出荷に即応する手厚いサポート体制により、
個別ニーズに寄り添ったコンサルティング提案から問合せ・
トラブル対応、スピーディな現場サポートまでを網羅
実物サンプルや空間に触れるリアルな体験提案を通じた、コ
ンセプトの具現化と
「創るよろこび・選ぶよろこび」の提供
多様な顧客群
● 代理店
● 内装施工
事業者
● ゼネコン
● デベロッパー
● 工務店
● リフォーム事業者
● ハウスメーカー
● ホームビルダー
● デザイン・
設計会社
● 事業主・施主
商品・出荷能力
4つの機能×販売ネットワーク
製造
商品企画
調達
商品販売
ロジスティクス
拠点
物流
設計・施工
サンゲツグループ
9拠点
全国即日配送を支える高度なロジスティクス基盤による、
(基幹LC 2カ所/地域7カ所)
「現場を止めない」確実な供給の安心感
商品点数約12,000点
約30種類の見本帳・デジタルカタログによる意匠選定(ス
1日当たり出荷量:約10万点
ペックイン)の強力なバックアップと、工期変動に即応する圧
(商品6万点/サンプル4万点)
倒的な即納・サンプル供給
関連仕入先約420社
サプライチェーン
(インテリア約270社/
(調達・商品開発)
エクステリア約150社)
多角的な仕入先とのパートナーシップに基づく、市場ニーズ
に応えるマーケットイン視点での商品開発・確実な調達
サンゲツ
クレアネイト
サンゲツ沖縄
クロス企画
サンゲツヴォーヌ
SDS
サングリーン
フェアトーン
施工基盤
年間施工件数
見積り・調達から施工・現場管理までを一貫して引き受ける
約12,500件超(グループ合算)
グループ体制による高品質な施工ソリューション
15
02 サンゲツグループの価値創造 | 強み・競争優位性
デザイン
素材(商品)
素材は、空間の意匠や居心地を形づくるとともに、耐久性・施工性・環境性能などの機能価値を支える
当社におけるデザインの強みは、
「商品デザイン」
と
「空間デザイン」の2つの軸から構成されています。
重要な要素です。当社では、素材が持つ高い意匠性や機能性をいかすことで、主力のインテリア市場に
商品デザインは、当社商品における重要な要素であり、物性や機能を備えた素材と組み合わされること
とどまらず、意匠性に加えて耐久性・耐候性が求められるエクステリア市場への領域拡大や、高い空間ソ
で、その価値を発揮します。当社は長年にわたり、豊富な素材、商品の知見を基盤に、色柄や質感、機能を
リューション提案力を伴う空間総合、海外市場の開拓を推し進めています。これを支えるのが、国内シェア
組み合わせ、顧客の構想や用途に適した商品を提案するデザイン力を培ってきました。さらに、商品開発
約55%を誇る壁紙をはじめ、約12,000点の商品を常時在庫する豊富な商品ラインアップと、現場が求め
る商品をタイムリーにお届けする安定した供給体制です。インテリア約270社・エクステリア約150社の
製造協力会社や仕入先との密接な連携に加え、グループ会社であるクレアネイトの製造・R&D機能を駆
使し、独自の商品開発と幅広い商品の安定供給を両立する製造・調達体制を築いています。全国をカバー
する販売ネットワークを通じて得られるニーズを開発へ還元し、素材や製造技術に関する知見と掛け合わ
や多様な物件への提案を通じて、空間を構成する素材の魅力を引き出すノウハウを蓄積しています。社
会の変化に伴って価値観が多様化し、これまで以上に空間デザインの重要性が高まるなか、当社は商品
起点のデザイン力をさらに進化させ、個々の商品のコーディネートにとどまらず、設計・施工やエクステリ
アまでを視野に入れた、空間全体のソリューション提案を強化しています。
せることで価値を最大化しています。今後は事業戦略に基づき、環境配慮型商品の拡充や省施工商品の
開発を加速させ、専門部署による品質設計・検証と厳格な品質管理を通じて、お客さまから信頼される商
品を提供し続けます。
Furniture
● 構想を空間として具現化するデザイン
顧客が思い描く構想や、空間が抱える課題を的
サンゲツの主要な商品ラインアップ(約12,000点)
壁装材
イン テリア
● フロア
● 壁紙(塩ビ系壁紙)
ファブリック
● カーペットタイルNT350
● カーテン
● ロールスクリーン/ブラインド
戦略商品
● ガラスフィルム
● フロアタイル
エクステリア
● モザイクタイル
Design
Exterior
あり方を描きます。素材・商品の特性に加え、設計
や施工までを見据えることで、意匠性と実現性を
兼ね備えた空間へと具現化します。
● 椅子生地
● カーペットタイル
(NT350除く)
Material
セラミックタイル
● 大判タイル
Construction
確に捉え、用途や利用者の視点から最適な空間の
床材
● カーペット
● 壁紙
(XSELECT) ● リアテック
Interior
エクステリア
● 乾式浮床
● 人工木デッキ
● プランターシステム
● 景観用人工芝
● ハイブリッドフローリング
● インテリアからエクステリアまで
「空間の連続性と開放性」をデザイン
建物の「ウチ」
と
「ソト」を連続する空間と捉え、インテリアとエクステリアを一体的にデザインします。境
界を持たない自由な空間で新たなコミュニケーションを創出することにより、空間が抱える課題を解決
し、心を満たす新たな空間価値を創造します。
● 安定供給体制の強化に向けた、
クレアネイト東広島工場を新設
当社グループの主力商品である壁紙市場では、量産壁紙にお
ける需給のタイト化が進んでおり、供給体制の強化が急務となっ
● 多様な案件で培った知見
ています。
こうした課題に対して、持続的な安定供給を実現する
オフィス、ホテル、医療・福祉施設、商業施設、共同住宅など、さまざまな用途の空間づくりに携わって
ため、2025年10月に東広島新工場を開設しました。既存の一
きました。そこで蓄積した知見をいかし、施設の用途や利用者、地域などによって異なるニーズや課題を
東広島工場
一関工場
捉え、それぞれの空間に適したデザインを提案します。
関・成田工場との3拠点体制により供給能力を強化するとともに、 2025年10月開設
生産余力を確保することで、災害等の緊急時にもバックアップ機
能を果たします。
さらに、地理的メリットをいかした調達・配送距
成田工場
本社(東京都)
離の短縮によるコスト削減と環境負荷低減を実現していきます。
OFFICE
HOSPITAL
LOGISTICS
SHOPPING MALL
APARTMENT
HOTEL
16
02 サンゲツグループの価値創造 | 強み・競争優位性
物流
施工
内装工事は建築工程の最終段階にあたるため、前工程の遅れや工期変更の影響を受けやすく、現
施工は、空間を創造するための根源的な機能であり、当社グループの商品すべてが施工によって
場の状況に応じた細かな調整も求められます。そのため、受注した商品を必要なときに迅速かつ確
空間を具現化する素材です。一方で、建設業界全体で人手不足や高齢化が進んでおり、施工の担い手
実に届ける物流対応力が重要です。また、多種多様な内装材から商品を選定する過程では、必要なサ
の確保が課題となっています。こうしたなか、当社は施工を重要な機能と位置付け、体制強化に向け
ンプルを速やかに届けることが、当社商品の採用機会を高めるうえで重要な役割を果たします。当社
た整備を進めてきました。2017年にはフェアトーンをグループ会社化し、それまで施工応援業務が
では、1日約10万点の商品・サンプルを迅速かつ正確に出荷する体制を構築しています。豊富な商品
中心であった当社グループに、内装施工機能を取り込みました。さらに、2026年4月にはフェアトー
ラインアップを効率的に供給するため、全社的な在庫効率と生産性の向上を担う
「SCMセンター(サ
ンと、グループ会社である壁装を統合し、全国規模の施工体制を一層充実させています。また、空間
プライチェーンマネジメントセンター)」の拡充を進めるとともに、デジタル技術を活用したSCMの高
創造に関するソリューションを提供するビジネスモデルをより実効的に進めるため、空間総合事業部
度化と、サプライチェーン全体の最適化に取り組んでいます。また、人手不足や高齢化への対応と働
において、専門スキルを有する人材を拡充し、設計・施工力の強化を図っています。インテリアの強み
きやすい環境の整備を見据え、全国のロジスティクス拠点で自動化・省人化を推進しています。配送
と提案力を融合させ空間価値を高める空間総合事業において、
フェアトーンをはじめとするグループ
面では、作業の効率化と配送機能の内製化を組み合わせることで、柔軟かつ安定した配送体制を構
会社と密に連携し、より事業主に近い立場で空間全体を具現化する「総合施工力」を高めていきま
築しています。
す。建設業界の構造的な課題が深まるなか、
「総合施工力」を独自の強みとしてさらに強化すること
で、競争優位性を一層高めていきます。
ロジスティクス9拠点の整備と
配送体制の強化に向けた
サービスクルー体制の拡充
物流機能の内製化
当社では配送体制のさらなる強化に向けて、九
沖縄LC
北海道LC
47 12,481
フェアトーンを核とする施工機能の強化
件
フェアトーンは、
デザイン力、施工技術力、
プロジェクト管理力を結集し、企画から施工ま
都道府県対応
で一貫して担う専門工事会社です。
サンゲツグループの販売ネットワークと品質管理体
州をカバーするクロス企画(2022年)や、当社
制をいかし、大規模プロジェクトから小規模リニューアルまで、多様なニーズに応える空
の物流拠点におけるエリア配送や広域の拠点間
間づくりを実現しています。
年間施工件数
2,381
件
年間プロジェクト件数
輸送を担うSDS(2025年)をグループ会社化し
ました。物流機能を内製化することで、将来的な
事業領域
配送困難やコスト高騰などのリスクを低減し、自
東北LC
中国四国LC
社配送網による持続可能な安定供給体制を確
立します。併せて、地域に即したきめ細かな配送
オフィス新築
リノベーション・リニューアル
内装施工
や、調達物流の効率化・高度化、環境負荷低減を
北関東LC・SCM
センター
東京LC
九州LC
推進し、サプライチェーンの強化に努めます。
中部I/II LC
基幹ロジスティクスセンター(2カ所)
地域ロジスティクスセンター(7カ所)
空間の価値を最大化する、
デザイン性の高
壁紙、床材、間仕切、窓まわり、化粧フィル
いリノベーションを提供します。
ム・ガラスフィルム、家具、設備関連(電気・
水道・空調 ほか)、その他室内装飾品等の
関西LC
ロジスティクス拠点
新規オフィスの企画・デザイン・施工を一括
で。理想の働く空間を実現します。
施工・管理を行います。
ソリューション
サービスクルー体制
デザイン設計
運用エリア
株式会社SDS 大阪事業所
レイアウト変更
家具・什器手配
工程管理・品質管理
ブランドイメージを体現するデ
働き方の変化に合わせた最適な
デザインに調和する家具・什器
プロジェクト全体を俯瞰し、
品質と
ザインをご提案します。
レイアウトをご提案・施工します。 の選定から納品まで対応します。 スケジュールを徹底管理します。
17
02 サンゲツグループの価値創造 | 経営資本
経営資本
これまでの事業活動を通じて培ってきた多様な経営資本は当社の持続的な成長を支える重要な基盤です。人的資本をベースとして、財務資本、社会・関係資本、製造資本、自然資本、知的資本を複合的・
多層的・総合的に組み立ててビジネスを深化させ、デジタル資本を活用したビジネスプロセスの最適化を図ることで、企業価値の向上につなげます。
資本
目指す姿
持続的 な 企業価値向上に向けた 最重要施策として「人的資本
人的資本
P.35
の 強化」を掲げ ており、一人ひとりの成長意欲 を土台に、個 の
力 と 組織の力 を高めて双方の成長を実現します。
実績
3,299 名うち海外931 名
空間デザイン人材(空間設計・企画)105 名
一級・二級建築士 40 名施工管理技士 112 名
1,200 名
商品デザイン人材 90 名
物流人材約1,000 名(うち委託先作業員約490名)
● 連結従業員数
● 連結営業人材
●
●
●
●
サプライチェーンの多様な情報をデータ化して正確に把握する
デジタル資本
P.37
とともに、生成 A Iの活用や業務 の自動化を推進します。最新の
セキュリティ基盤 のもとで事業 の 効率化を図り、新たな付加価
P.31
社会・関係資本
P.16
自然資本
P.49
知的資本
P.45
31 名
● デジタル活用人材
229 名
金配分を 通じて、持続的 な 収益拡大と企業価値 の 向上を目指
します。
さまざまなステークホルダーとの信頼関係を深め、協働を通じて
新たな価値を創出することで、共に持続的な成長を実現します。
※単体での集計
● 中期経営計画
【BX 2025】
期間中の営業CF
463億円
● サプライヤー
インテリア事業仕入先
● 顧客直接販売先
P.47
製造資本
● 情報システム人材
値の創出につなげます。
成長投資と 資本効率 の 最適 な バランスを 追求し、戦略的 な 資
財務資本
10 万点/日
● 受注データ
6,000社
180 億円
期間中の成長投資
期間中の株主還元
254億円
270社 エクステリア事業仕入先150社
関連取引先 20 万社以上
海外販売先 44カ国
信頼の 礎となる安定供給の 維持、向上に向けて、製造資本 の強
● 製造
● 物流
化による生産性向上や 環境負荷低減、物流設備 や 配送網 の 体
在庫、加工、出荷拠点(国内) 拠点
制拡充を図ります。
クレアネイト(国内の大手壁紙メーカー)
Koroseal( 米国の老舗壁紙メーカー)
自然資本 の 保全および 回復は事業活動 を推進するうえで 非常
● GHG排出量
(Scope1&2)
に重要な課題であり、企業の責務として持続可能な社会の実現
21,634 t-CO2e(2021年度比29.0%削減)
再生可能エネルギー使用率 62.5%
見本帳リサイクル冊数約10万冊
●
に貢献します。
●
独自技術に関するアイデアや デザイン、ブランド等 の 無形資産
● 知的財産権
(特許権・実用新案権・意匠権・商標権)登録累計
を「知的財産」として戦略的に可視化・活用することで、当社の
競争優位性を高め、中長期的な企業価値の向上を実現します。
9
12,000点
● 商品点数約
● 見本帳約
582件
30 種類
※単体での集計
18
02 サンゲツグループの価値創造 | マテリアリティ
マテリアリティ
マテリアリティの考え方
サンゲツグループでは、持続可能な社会の実現に向けた重要課題として、5つのマテリアリティ
を特定しています。課題の特定においては、社会価値と経済価値の両立の観点から、
「社会課題の
マネジメント体制
解決」と
「サンゲツグループの持続的な成長」の2つの軸で重要テーマを抽出しました。
「社会課題
選定したマテリアリティごとに指標および目標を設定し、四半期に一度開催されるESG委員
の解決」につながる商品・サービスを提供することで社会に不可欠な企業となり、その土台として
会を通じて、取り組み状況の進捗管理や課題解決のための議論を行っています。ESG委員会
事業基盤・人的資本・ガバナンスを強化することで、
「持続的な成長」を実現します。私たちは、マテ
は、委員長を社長が、統括責任者を担当執行役員が務め、6つの分科会で構成されています。活
リアリティに基づきこの両輪を推進することで、持続的な企業価値の向上を図ります。
動内容については取締役会へ報告しており、取締役会による強い監督のもと、マテリアリティに
関連する取り組みを推進しています。
マテリアリティの特定プロセス
実行部門
STEP 1
STEP 2
テーマの選定
マテリアリティの
特定
承認
目標設定と評価
社会 にとっての 重要
特定したマテリアリティ
ESG委員会を通じ、特
ISO26000など主要な
テーマ、
サンゲツグルー
について、経営会議で
定したマテリアリティの
国際的ガイドラインを
プにとっての重要テー
審議したのち、取締役
対応方針、
指標・目標の
マを抽出してマテリア
会で承認・決定
設定、活動の評価と改
GRI、
SASB、
参照
STEP 3
リティを特定
STEP 4
善計画の実行
ガバナンス分科会
監査等
委員会
取締役会
人的資本分科会
コーポレート部門
事業部門
ロジスティクス部門
社会資本分科会
商品統括部門
委員長
統括責任者
(社長)
(担当執行役員)
社会参画分科会
DX部門
課題認識
事務局
● 主力市場である日本では、
人口減、高齢化等により新築住宅市場を中心に
外部課題
海外事業部門
(ESG推進課)
市場規模は想定よりも縮小傾向
● 大都市圏におけるインバウンド・オフィス需要などをはじめ、
半導体等新工場が
環境分科会
ESG委員会
DX分科会
各グループ会社
立ち上がる地方など、特定の市場・地域では需要が伸長
● 環境配慮型商品等の社会課題の解決につながる商品の需要は増加
● 製造・物流・施工を担う人手の不足、
原材料費・物流費・人件費等が継続的に上昇
マテリアリティの見直しについて
● 国内インテリアセグメントの収益が着実に拡大する一方、
国内エクステリア、
海外の2セグメントの収益貢献が限定的
内部課題
● 海外、
エクステリア、空間総合の3事業における専門人材が不足
● 壁装材、
床材に次ぐ、空間を構成する商品ポートフォリオの拡充が不十分
● グループ会社を含め販管費の増大が先行しており、
収益への貢献が遅れている
現在、当社グループでは「中期経営計画 2029」や昨今の外部環境の変化を踏まえ、マテリアリティ
の項目および中長期的な指標・目標値の見直しを進めています。マテリアリティの見直しと指標・目標
の設定が 完了次第、当社WEBサイトや次年度以降の統合報告書等を通じて速やかにステークホル
ダーの皆さまへ開示します。
19
02 サンゲツグループの価値創造 | マテリアリティ
マテリアリティの詳細
マテリアリティ
区分
● 社会構造の変化に対応するイノベーションの創出
(▶社会課題の解決を支える新機軸商品|P.26)
● コミュニティとの共生・共創
(▶P.47)
誰もが安心して快適に
● 人権の尊重
過ごせる社会の実現
特定の背景とアプローチ
日本国内における少子高齢化や労働人口の減少により、事業を取り巻く環境は大きく変化しています。また、世界が
直面する貧困や人権問題に加え、教育や生活環境における格差も、公正で平等な社会の実現を阻む深刻な課題で
す。サンゲツグループは、このような社会構造の変化や課題に対応するため、イノベーションの創出や、社員による社
会参画活動、バリューチェーン全体での人権を尊重した企業活動を通じ、誰もが安心して快適に過ごせる社会の実現
に貢献します。
社会課題の解決
気候変動、大気・海洋汚染や生物多様性の損失など環境問題の深刻化が進んでおり、環境に配慮した企業活動が従
● カーボンニュートラルへの貢献
(▶P.50)
サステイナブルな
会として捉え、環境の取り組みを推進することが重要だと認識しています。人と環境が調和する、持続可能な空間づく
● 自然との共生
(▶P.52)
りを行うために、環境配慮型商品の開発やサプライチェーン全体の環境負荷低減などに努め、サステイナブルな地球
環境の実現に貢献します。
地球環境の実現
● ソリューション提案力による付加価値の高い
空間の提供(▶空間総合事業の重点施策|P.27)
● 品質マネジメントの革新
● サプライチェーンマネジメントの高度化
(▶P.27、37)
事業基盤の強化
来以上に求められています。
このような状況に対し、単なるリスクマネジメントの対応に終始せず、成長するための機
● サーキュラーエコノミーへの貢献
(▶P.51)
● DXによる事業の高度化
(▶P.37)
長期的な企業価値の向上には、事業の成長を支える事業基盤の強化が不可欠です。商品を提供することのみにとど
まらず、商品、デザイン、物流、施工といった各種機能を複合的に組み合わせることによりソリューション提案力を高
め、付加価値の高い空間を創出し、収益力の向上を目指します。また、品質マネジメントの革新を通じて顧客からの信
頼性向上に努めるとともに、DXにより最適なサプライチェーンマネジメントなどを実現することで、
ビジネスモデル・
事業プロセスの変革を推進し、競争優位性の確立を図ります。
● 人材育成・活躍支援
(▶P.36)
サンゲツグループは、持続的な企業価値向上のための重要施策として
「人的資本の強化」を掲げ、経営戦略と連動し
サンゲツグループの
● 社員エンゲージメントの向上
(▶P.35)
た人材マネジメントを実行しています。社員の多様性をいかし、変革・挑戦し続ける企業風土を醸成することで、人的
持続的な成長
● ダイバーシティ・エクイティ&インクルージョンの
推進(▶P.36)
資本経営を加速させます。具体的には、一人ひとりの意欲と能力を最大限に引き出す人材育成と活躍支援、エンゲー
ジメントの向上、そしてダイバーシティ・エクイティ&インクルージョンを推進します。
人的資本経営の加速
誠実かつ透明性の高い
● コーポレートガバナンスの強化
(▶P.54)
事業環境の変化に迅速に対応し、持続的な成長を続けるため、誠実で透明性の高い組織を目指します。コーポレート
● コンプライアンスの徹底
(▶P.60)
ガバナンス体制を高度化し、ステークホルダーとの対話を通じて多様な視点を経営に反映させるとともに、コンプラ
● リスクマネジメントの徹底
(▶P.61)
イアンスとリスクマネジメントをグループ全体で徹底・管理する体制を構築していきます。
組織の実現
20
02 サンゲツグループの価値創造 | マテリアリティ
マテリアリティの指標・目標
マテリアリティ
誰もが安心して
快適に過ごせる
社会の実現
サステイナブルな
地球環境の実現
事業基盤の強化
誠実かつ透明性の
高い組織の実現
範囲
25年度目標
25年度実績
評価・今後の取り組み方針
社会構造の変化に対応する
イノベーションの創出
省施工商品の開発
連結
開発中の省施工商品のテスト
マーケティングおよび上市
省施工商品「INNO PANEL」の上市
目標達成。拡販を推進するとともに、次期商品の開発に着手する。
コミュニティとの共生・共創
児童養護施設等のリフォーム
支援件数
連結
50件
47件
概ね計画どおり。引き続き支援先ニーズに寄り添った活動を継続する。
人権の尊重
人権デューデリジェンスの実施
単体
負の影響の特定
グループ会社における人権リスクの把握
段階的に進捗。今後は仕入先等サプライチェーンへ対象を拡大し、
負の影響の特定を進める。
カーボンニュートラルへの
貢献
GHG排出量削減率(2021年度比)
連結
28%削減
29%削減
再生可能エネルギー使用比率
連結
60%
62.5%
サーキュラーエコノミーへの
貢献
リサイクル率
連結
70%
63.1%
目標未達。廃棄物回収スキームの強化により
リサイクル率を向上させる。
自然との共生
持続可能な森林からの調達率
単体
8%
21.5%
大幅達成。今後も適用範囲を拡大し、
持続可能な調達を強力に推進する。
ソリューション提案力による
付加価値の高い空間の提供
空間総合事業売上高
連結
非開示
非開示
順調に推移。
ソリューション提案力の強化により
事業成長を加速させる。
品質マネジメントの革新
クレーム発生率(対前年)
単体
3%減
1%増
目標未達。引き続き品質管理マネジメントを徹底する。
サプライチェーン
マネジメントの高度化
総在庫回転日数
単体
最適化
計画どおり
計画どおり進捗。サプライチェーンマネジメントの高度化による
さらなる効率化を図る。
DXによる事業の高度化
デジタル活用人材
単体
100名増
60名増
目標未達。育成プログラムの見直しを図り、
DX人材の育成を加速させる。
正社員一人当たりの教育研修に
かかる費用
単体
10万円
6.2万円
正社員一人当たりの教育研修に
かかる時間
単体
30時間
25.6時間
社員エンゲージメントの向上
エンゲージメントサーベイ
単体
58.0(A)
59.4(A)
目標達成。サーベイ結果を分析し、中期経営計画に基づく
重点項目を定め、改善アクションを実行する。
ダイバーシティ・エクイティ&
インクルージョンの推進
女性管理職比率
単体
25%
24.2%
概ね計画どおり。育成プログラムの実行により管理職候補となる
女性社員の計画的育成および継続的な登用を図る。
コーポレートガバナンスの
強化
IR面談件数
連結
100件以上
93件
概ね計画どおり。引き続きステークホルダーとの積極的な
対話機会を創出するとともに、透明性の高い情報開示を推進する。
コンプライアンスの徹底
グループ各社へのコンプライアンス
意識の浸透と必要知識の強化
連結
研修、勉強会等の
実施・法令情報の発信充実
国内外グループ会社に対する
研修・勉強会の実施
計画どおり実施。
定期的な啓発活動を通じてグループ全体への浸透を図る。
リスクマネジメントの徹底
サイバー攻撃等への対策基盤整備に
向けての準備
単体
人材の育成、社員教育と
対策基盤整備
社員への教育および対策基盤整備
計画どおり実施。最新動向を踏まえたセキュリティ対策を
継続的に強化する。
人材育成・活躍支援
人的資本経営の
加速
主要な指標
目標達成。省エネ施策の徹底と再エネ導入の拡大により、
さらなる排出量削減を推進する。
目標未達。教育体系の見直しおよび研修の拡充は実施。
多様な学習の提供と、主体的に学ぶ環境整備を進める。
21
03
成長戦略「中期経営計画 2 0 2 9 」
中期経営計画【BX 2025】の振り返り
業績の総括
経済価値
(単位:億円)
中期経営計画【BX 2025】
2025年度
修正計画
2024年度
(2025年5月)
2022年度
2023年度
2025年度
1,898
2,003
2,064
2,100
98.3%
営業利益
202
191
181
194
190
102.1%
当期純利益
140
142
125
146
130
112.6%
ROE(%)
15.3
14.1
11.4
12.5
11.5
+1pt
ROIC(%)※
16.5
14.8
13.6
13.7
14.0
▲0.3pt
CCC(日)
77
71
72
79
70
+9日
売上高
1,479
1,591
1,639
1,641
1,667
98.4%
営業利益
211
194
189
193
188
102.8%
売上高
62
64
66
73
76
96.2%
海外
2025年度計画
実績
単体
2018年度比 60%削減
2018年度比 66.7%削減
連結
2021年度比 28%削減
2021年度比 29.0%削減
使用エネルギー量減
単体
2018年度比 6%削減
2018年度比 22.4%削減
リサイクル率(有効利用率)
単体
90%以上
80.8%
エンゲージメントスコア
単体
58.0(A)
59.4(A)
女性管理職比率
単体
25.0%以上
24.2%
障がい者雇用率
単体
4.0%以上
3.7%
男性育休取得率
単体
2週間以上 100%
100%
児童養護施設改修活動
連結
50件/年間
47件/年間
GHG排出量
1,760
国内エクステリア
範囲
2025年度
修正計画比
売上高
国内インテリア
社会価値
4
▲0.7
0.1
1
0.5
236.3%
売上高
217
242
297
350
357
98.1%
営業利益
▲12
▲3
▲7
▲0.4
1
営業利益
地球環境
人的資本
社会資本
財務の総括
※ROIC=税引後営業利益÷(運転資本+有形固定資産+無形固定資産)
インテリア事業
国内インテリア
セグメント
2025年度の自己資本を950〜1,050億円とする
国内需要の停滞、継続的なコスト上昇や職人不足など変化の大きい事業環境
の下、
コアビジネスとしての底堅い収益力を示した。
自己資本1,215億円
株主還元は配当を主体とし、
1株当たり年間配当金は130円を下限に、安定的な増配を目指す
市場の状況により自己株式の取得も検討する
空間総合事業
国内エクステリア
セグメント
実績
還元方針
セグメント別の進捗と課題
エクステリア事業
海外インテリア事業
実施なし
組織体制の整備や人材の拡充をはじめ、事業基盤の強化は進み、売上高は増
加するも利益貢献には至っていない。
事業規模・領域拡大のための人的投資や新たな営業拠点の設置を進めたが、
利益貢献には至っていない。
北米が高成長、東南アジアが黒字転換、香港・中国が赤字縮小と、改善が着実
に進んだ。
海外セグメント
海外空間総合事業
増配を継続、2025年度の1株当たり年間配当金は155円
2024年7月にシンガポールのD Perception社をグループ会社化し、事業基
盤の整備を進めるも、
業績は計画未達となった。
中期経営計画(3ヵ年累計)
Cash In
Cash Out
実績(3ヵ年累計)
Cash In
営業CF
成長投資
営業CF
成長投資
200〜250億円
463億円
180億円
借入金増減
株主還元
借入金増減
株主還元
▲80〜60億円
250〜350億円
35億円
254億円
資産圧縮による収入等
保有現金同等物(2025年度)
22億円
357億円
270億円
200〜250億円
140.0
Cash Out
470〜510億円
保有現金同等物(2022年度) 保有現金同等物(2025年度)
1株当たり配当金(円)
150.0 155.0
105.0
(年度)
2022
2023
2024
2025
22
03 成長戦略「中期経営計画 2029」|「中期経営計画 2029」のビジョンと全体戦略
「中期経営計画 2029」のビジョンと全体戦略
「中期経営計画 2029」の位置付け「変革と挑戦、そして、イノベーションの創出」
成長を実現する6つの基本方針
持続的な成長と企業価値向上に向けて、以下の6つの基本方針を定めています。
「中期経営計画 2029」では「変革と挑戦」
「イノベーションの創出」を
追求し、持続的な成長と企業価値向上を牽引する6つの基本方針を定め
ました。当社のコアビジネスであるインテリア事業の基盤強化や海外事
業の飛躍的成長に加え、空間総合・エクステリア事業の育成と次世代事
業の探索・創出を進め、収益力のさらなる強化を目指します。新たに定め
取締役常務執行役員
た目指す企業像「素材とデザインを起点に、インテリアから文化をつくる
事業部門ゼネラルマネージャー
企業」の実現に向け、当社のDNAである社是「誠実(INTEGRITY)」のも
兼 エクステリア事業担当
01.インテリア事業の強化
インテリアの総合企業として、市場ニーズ、社会課題に対応した商品の開発、空間を構成
する商品の拡充、デザインをはじめソリューション提案力の強化、ビジネスモデルの変革
を加速し、事業の高度化を推進する。
兼経営戦略担当
と、全員が倫理観をもって行動し、グループの総合力で確実な利益創出
02.空間総合事業とエクステリア事業の育成
松尾豊
を実現してまいります。
インテリア事業とのシナジーを梃子として、グループ会社を含めた事業基盤を確立し、サ
ンゲツグループの中核事業に育成する。
長期ビジョン【DESIGN 2030】2020年度〜2029年度
中期経営計画
【BX 2025】
中期経営計画
【D.C. 2022】
中期経営計画
【PLG 2019】
売上高
04.次世代事業の探索・創出
源となる次世代事業を探索・創出する。
2,500
2,003
80
2014
50
2017
05.人的資本
「変革と挑戦」
「イノベーションの創出」を実現、加速すべく、経営戦略に連動した人事施
250
14.1%
4.2%
2,064
1,453
191
3.7%
を尊重しつつ、サンゲツグループ内の協業・共創を加速し、収益力の飛躍的向上を図る。
インテリアをはじめとするサンゲツグループの既存領域、隣接領域において未来の収益
1,898
1,320
2026年度〜2029年度
「次の飛躍に備える3年間」
「基幹事業の
質的成長による
収益の拡大」
(単位:億円)
1,563
成長の起爆剤と位置付ける海外事業において、各地域・各グループ会社の独自性・主体性
「変革と挑戦」
「イノベーションの創出」
2023年度〜2025年度
ROE
営業利益
03.海外事業の成長
中期経営計画
2029
11.4%
策を実行し、サンゲツグループの人材基盤を強化する。
194
181
12.5%
14.0%
06.デジタル資本
67
収益力と資本効率を最大化する戦略資本へと進化させ、蓄積したデジタル資本を駆使し
5.1%
2020
てデータドリブン経営を実践し、確かな財務価値を生み出すDX(デジタル変革)を推進
2023
2024
2025
2029 計画
(年度)
する。
23
03 成長戦略「中期経営計画 2029」|「中期経営計画 2029」のビジョンと全体戦略
事業戦略
経営指標 2029年度計画
● 事業ポートフォリオ
経営指標|連結
高
成長事業
空間総合事業
海外事業
インテリアとのシナジー
グル ープ全体 の成長と
を創出し、収益性を向上
高収益化 を力強くリー
(単位:億円)
2025年度
2029年度
実績
計画
売上高
2,064
2,500
営業利益
194
250
当期純利益
146
170
ROE(%)
12.5
14.0
ROIC(%)※
13.7
11.0
ドする牽引役
■■売上高
営業利益
親会社株主に帰属する当期純利益
(単位:億円)
2,500
2,064
250
194
次世代事業の探索・創出
成長性
エクステリア事業
収益基盤 を高度化、
170
146
(年度)
2025
収益性を向上
2026
2027
2028
2029 計画
※ROIC=税引後営業利益÷(運転資本+有形固定資産+無形固定資産)
インテリア事業
グループのコアビジネス
として、事業の高度化に
経営指標|セグメント別
よる、キャッシュ創出力
育成事業
2025年度
2029年度
実績
計画
売上高
1,641
1,880
営業利益
193
215
売上高
73
78
営業利益
1
5
売上高
350
542
営業利益
▲0.4
30
売上高
2,064
2,500
基盤事業
収益性
低
高
国内
● 強みの高度化と成長領域への展開による収益力の向上
インテリア
コアビジネスであるインテリア事業の基盤強化を軸に、事業ポートフォリオの最適化を推進しま
す。国内インテリアにおいてはソリューション提案力やSCMの高度化によりキャッシュ創出力を高
めます。また、成長の牽引役である海外事業では北米・アジアにおける領域拡大と飛躍的な収益拡
国内
エクステリア
大を図ります。さらに、強みを横展開した空間総合・エクステリア事業の育成や次世代事業の探索
に挑み、グループ全体の持続的なトップライン成長と収益力向上を実現します。
(単位:億円)
国内インテリア
を強化
海外
(▶事業戦略|P.25〜30)
194
海外
542
合計
営業利益
国内エクステリア
250
78
350
73
1,880
1,641
▲0.4
1
30
193
売上高
営業利益
2025
5
215
売上高
(年度)
営業利益
2029 計画
24
03 成長戦略「中期経営計画 2029」| 事業戦略
事業戦略
国内インテリアセグメント
国内インテリアセグメント
持続的成長に向けたビジネスモデルの進化
国内インテリアセグメントのインテリア事業は、当社グループの収益を支えるコアビジネスであり、その強みをいかして空間総合事業を展開しています。
日本国内の建設・内装市場が中長期的な縮小トレンドにあ
る一方、市場ニーズの多様化、社会課題の複雑化に対応し、品揃えの拡充、機能強化によるソリューション提案力の向上を通じた「トータルインテリア」のビジネスモデル進化を掲げています。今後は、
「成長市場での
ポジショニング向上」
「プロダクトミックスの最適化」
「サプライチェーンの最適化」
「モノづくり力の強化」
「企業ブランドの向上」
という、相互に深く結びついた5つの重点施策を軸に質的成長を実現していきます。
インテリア事業は、日本国内の市場環境の厳しさが増すなか、成長市場へのアクセスを強め、既存
事業環境
事業の徹底的な磨き込みと高付加価値化により、収益力の一段の強化を目指します。商品戦略にお
新築市場の縮小
労働需給ギャップの深刻化
人口減少に伴い、新築需要は減少トレンドが継続。
建設業界の職人不足・高齢化が加速。
高い付加価値を持つ「戦略商品」の拡販や、環境配慮・省施工といった社会課題の解決に寄与する
ストック・非住宅の拡大
原材料・物流・エネルギーコスト等の上昇
「新機軸商品」の開発に注力し、最適なプロダクトミックスを構築します。
また、
これらの戦略を支える
ライフスタイルの多様化により、
リフォームや非住宅
世界情勢・経済情勢を背景に、原材料価格やエネル
(オフィス・商業・宿泊施設など)の空間価値向上ニー
ギー・配送コストが上昇。
ズは増加。
いては、収益の柱である壁紙や床材といった「主力商品」の機能や競争力を高めていきます。同時に、
基盤として、R&D(研究開発)拠点の整備を通じた機能開発から品質管理までのモノづくり体制の強
化を推進していきます。
さらに、AI等のデジタル技術を活用した需要予測や拠点最適化によるサプラ
イチェーンの強靭化を進め、安定供給と高い在庫回転率を両立させます。
また、企業・商品等におい
て一貫性のあるブランディング戦略を展開し、
さらなる企業価値向上に取り組む方針です。
成長戦略
国内インテリアセグメント売上高/営業利益
成長市場でのポジショニング向上
住宅・非住宅とも国内市場規模が縮小する事業環境の下、
リフォーム・リノベーション、IR(統合型リゾート)
・イ
■■売上高(億円)
1,880
■■営業利益(億円)
ンバウンド関連、大規模再開発案件等成長市場でのポジショニングを向上させる。
プロダクトミックスの最適化
1,479
1,220
1,591
1,641
1,639
1,230
1,117
211
量産壁紙をはじめとする主力商品の競争力強化、
シェア拡大を図るとともに、市場ニーズ・社会課題の解決に資
194
189
215
193
する機能性、技術優位性を有する商品の開発、拡販に取り組み、収益性の向上を目指す。
サプライチェーンの最適化
93
90
70
デジタル技術によるサプライチェーンプロセス全体の最適化ときめ細かい運用により、安定供給と高い在庫回
転率を両立し、収益性を高め、競争優位性を確立する。
モノづくり力の強化
(年度)
2019
2020
2021
2022
2023
2024
2025
2029 計画
※2021年度より収益認識基準を適用
R&D、デザイン、素材・商品開発、品質管理等モノづくりに関わる全機能の強化、機能間連携を図り、ブランド
メーカーとしての競争力、提案力を強化する。
企業ブランドの向上
「素材とデザインを起点に、インテリアから文化をつくる」企業としての企業ブランド、企業認知度を高めるべく、
プロモーション施策を強化する。
CAGR
売上高年平均
成長率
3.4
%
セグメント売上高
2025年度
1,641億円
セグメント営業利益
2029年度
1,880
億円
2025年度
193億円
2029年度
215
億円
25
03 成長戦略「中期経営計画 2029」| 事業戦略
国内インテリアセグメント
成長市場でのポジショニング向上
プロダクトミックスの最適化
国内インテリアセグメントでは、新設住宅着工数の減少な
どにより建設市場の成長が限定的となるなか、各市場の需要
売上規模と収益力の向上を両立させ、セグメント全体の収益基盤をより強固なものとするため、商品構成を「主力商品」
「戦略商
品」
「新機軸商品」の3軸に分類し、
プロダクトミックスの最適化を推進しています。
動向を見極め、住宅・非住宅の両市場において当社のシェア
壁紙や床材、カーペットタイル、カーテンといった「主力商品」においては、機能拡充や競争力強化を通じて市場シェアの維持・拡
を向上させていく方針です。具体的には、住宅市場において
大を図り、安定した収益基盤を確立します。同時に、高い意匠性と機能性を有するリアテックやフロアタイルなどの「戦略商品」の販
は、
リフォーム・リニューアルのストック市場、都市部の賃貸マ
売を拡大し、高付加価値化と成長市場でのポジショニング向上を図るとともに、
「新機軸商品」として、施工現場の課題を解決する
ンションや中古住宅の買取再販、大規模修繕を重点領域と定
省施工商品や、循環型社会の実現に貢献する環境配慮型商品の開発・拡充にも注力していきます。
め、インテリアコーディネート機能の全国的な強化や、ハウス
メーカー・ビルダーに向けた営業活動を推進します。非住宅市
高
主力商品
場においては、インバウンド需要の拡大を背景としたホテル・
● 壁紙
(塩ビ系壁紙)、
フロア、
カーペットタイルNT350、カーテン
商業施設やIR(統合型リゾート)、働き方の変化に伴うオフィ
機能拡充、競争力強化、成長市場でのポジショニング向上により、シェア
スの価値向上、さらには半導体やデータセンター等の設備投
の維持拡大を図り、収益力を強固にする。
資分野を重点領域と定め、グループの総合力をいかしたアプ
場に対して、お客さまの課題解決に直結する付加価値の高い
戦略商品
主力商品
シェア
ローチにより、大型案件の獲得を目指します。これらの成長市
● 壁紙
(XSELECT)、
リアテック、ガラスフィルム、フロアタイル、カーペッ
トタイル(NT350除く)、椅子生地
提案により、市場における優位性を発揮していきます。
新築:多様化するニーズに沿ったソリューション提案の推進
●
リノベーション市場
リフォーム/リノベーション:リフォーム市場、
(不動産価値の向上)に対する商流拡大
●
拡大に注力する。
新機軸
商品
住宅
●
市場の成長、
シェアの拡大、グローバル展開のポテンシャルが高く、
シェア
戦略商品
注力分野
新機軸商品
● 環境配慮、
省施工、サステイナブル、素材開発、ほか
市場ニーズの多様化、社会課題に応じ商品ポートフォリオの拡充に取り
収益性
低
高
組む。
賃貸マンション:都市部の世帯数増加に伴う賃貸マンション需要の
獲得
●
中古買取再販市場:新規需要の獲得
非住宅
社会課題の解決を支える新機軸商品
建設業界が直面する人手不足や時間的制約といった社会課題に対応する新建材として、壁紙
●
IR・インバウンド:IR需要、再開発プロジェクトに伴う大型案件の獲得
と石膏ボードが一体化した「INNO PANEL(イノパネル)」を発売。従来現場で行っていた施工工
●
オフィス:リノベーション市場(オフィス価値向上)、新規需要の獲得
程を商品で補完することで、
「省施工」を通じた現場作業の軽減、ひいては建設業界の生産性・持
●
:リニューアル・インバウンド需要拡大に伴う
宿泊施設(ホテル)
続性の向上を目指します。
商業・宿泊市場における新規需要獲得
(官民)重点投資分野:設備投資方針に伴う内装関連需要の獲得
●
「INNO PANEL」の紹介|https://www.sangetsu.co.jp/newproduct/innopanel/
(壁装材・床材の機能性商材)
26
03 成長戦略「中期経営計画 2029」| 事業戦略
国内インテリアセグメント
サプライチェーンの最適化
空間総合事業の重点施策
安定供給と高い 在庫回転率の両立は、単なる業務効率化にとどまらず、グループ 全体の次な
空間総合事業では、コアであるインテリア事業の強みに、空間デザインのノウハウに基づくソ
る成長を牽引する強力なエンジンとなります。サプライチェーン全体の最適化に向け、仕入先を
リューション提案力を融合させることで、ビジネスモデルを進化させていきます。これにより、オ
含む全体の在庫情報を活用した「需要予測ロジックの構築」と、実際の「物流現場の効率化」の
フィスやホテ ル 、商業施設、医療・福祉施設、共同住宅など、あらゆる物件 の 規模・用途におい
2つの側面から体制整備に取り組んでいます。これらを通じた安定供給により販売機会の喪失
てお 客さまの 多様なニーズに 応える空間づくりを実現します。当社 の 強 みである「全国に 広が
を防ぎ、顧客満足度を高めるとともに、適正な在庫コントロールによりキャッシュ創出力の向上
る強固な販売ネットワークと顧客基盤」を最大限にい かし、部門間およびグループ 企業間 の 連
を実現します。さらに、これらの取り組みや情報を、商品開発や受注効率化などのオペレーショ
携を強化し、組織的な受注拡大を図ります。販売ネットワークと顧客基盤を活用し、それぞれの
ンと連携させることで、収益性の改善につなげていくことも目指しています。AIなど最新のデジ
ターゲット分野において、さらなる顧客層の開拓を進めるとともに、経営基盤を一段と強化する
タル技術を活用し、変化に強く効率的な物流ネットワークを構築することで、競争優位性を確立
ことで、持続的な収益の拡大を実現していきます。
し、持続可能な成長と企業価値の向上を目指します。
SCM強化の全体像
(調達・購買)
仕入先(製造)
空間総合事業の納品事例
※LC:ロジスティクスセンター
取引先
サンゲツ
(LC)
関連
見本帳
品質管理
出荷
補充依頼
生産指図
(発注)
全体在庫
データ 各LC在庫データ
適正在庫
生産
LC
LC
出荷
配送
インテリア事業の強みをいかした営業活動
全国にわたるきめ細かなサンゲツの販売ネット
ワークを活用し、インテリア事業とのシナジーを
マーケット
通じて営業活動を強化する。
受注
注力分野への取り組み強化
ロジ機能
インテリア事業とのシナジ ー が 期待さ れるオ
フィス市場、ホテル市場ならびに各エリア地場
市場 を 対象 に 顧客基盤 を 確立し、サンゲツグ
Step2
Step3
Step1
Step4
● LC別の適正在庫算出
(需要予測) ● サンゲツ全体在庫の適正化 ● 庫内作業生産性の向上 ● 全LC最適化
● 仕入先プロセス整流
● 庫内配置最適化
● 最適ルーティング
補充プロセス標準化
● 安定した在庫コントロール
オペレーション
ループのトータルソリューション提案を行う。
名古屋マリオットアソシアホテル
商品調達の多様化
壁装材、床材、ファブリックにとどまらず、家具を
含めた空間を構成する商品を強化し、顧客満足
度を高める。
事業基盤の構築・高度化
営業・設計・施工の各機能を高めるとともに、一
気通貫したプロジェクトマネジメント体制を構
築し、競争力強化と収益性の向上を図る。
Landport東海大府Ⅰ
実績の紹介|https://www.sangetsu.co.jp/business/space-solutions-group/works/
27
03 成長戦略「中期経営計画 2029」| 事業戦略
事業戦略
国内エクステリアセグメント
国内エクステリアセグメント
エクステリア事業の変革と成長
国内エクステリアセグメントは、住宅から非住宅市場まで幅広いエクステリア商品の販売および外構の設計・施工を展開しています。新設住宅着工数の減少や種々コスト高騰といった厳しい外部環境の
なか、事業領域の拡大、グループ間シナジーの創出、自社ブランド商品の開発等を進め、持続的な成長に向けて事業基盤の再構築を図ります。
エクステリア事業においては、中核であるサングリーンによる地域密着の強固な営業基盤と、サン
事業環境
ゲツの販売ネットワークを梃子に東海・関東地区を重点に更なる販路拡大を進めます。
インテリア領
新築市場の縮小
リフォーム需要の拡大
域で培ったデザイン力により、
インテリアとエクステリア一体の空間提案力を独自の強みとして強化し
人口減少に伴い、新築需要は減少トレンドが継続。
住宅の長寿命化や省エネ化を目的としたリフォーム
エクステリア市場における位置付けを高めます。
や、バリアフリー対応等も含めた底堅い需要が顕在。
施工職人・ドライバーの慢性的人手不足
防災・減災需要の高まり
建設・物流業界における労働時間規制の定着や職人
住宅のレジリエンスを高めるエクステリアへのニー
の高齢化加速により施工力と配送力が低下。
ズが増加。
原材料・エネルギーコストの高騰
商品戦略としては、従来の幅広いエクステリア商品の卸売事業にとどまらず、市場ニーズを的確に
捉えたオリジナル商品(プライベートブランド)の企画・開発を加速させます。自社ブランド商品の収益
性改善と他社との差別化を図り、競争優位性を確立します。
また、
グループ会社および協力企業との連
携による配送、施工体制の強化に加え、業務プロセスの標準化やDX推進を通じた業務効率化を図り
ます。
アルミ地金、樹脂をはじめとする原材料の価格高騰
や、製造・輸送コストが上昇。
国内エクステリアセグメント売上高/営業利益
■■売上高(億円)
収益認識基準適用前
160
153
146
成長戦略
202
■■営業利益(億円)
160
156
62
64
174
164
機能間連携によるソリューション提案力強化
主力市場である東海、注力市場である首都圏でのインテリア・エクステリアの融合、連携により販路拡大を図る
べく、商品、施工、物流、空間提案等各機能の拡充およびソリューション提案力の強化を実行し、エクステリア商
58
6
5
社としてのポジショニングを強化する。
78
73
66
5
4
4
オリジナル商品の企画・開発
パートナー企業との協業を加速しシェア向上を図るとともに、市場ニーズ、社会課題の解決に資する商品の企
画・開発にサンゲツグループ全体で取り組みオリジナル商品の拡充による差別化を通じて競争優位性を高める。
物流・施工機能の強化
物流をはじめとする自社サプライチェーンの効率化・強靭化を図るとともに、グループ間連携、協力企業との連
携を通じて物流・施工機能の強化を進める。
成長投資
業界再編を視野に入れ、事業領域・事業規模の拡大につながる成長投資を推進する。
▲0.7
2019
2020
2021
2022
2023
0.1
2024
1
(年度)
2025
2029 計画
※2021年度より収益認識基準を適用
CAGR
売上高年平均
成長率
1.6
%
セグメント売上高
セグメント営業利益
2025年度
2029年度
73億円
億円
※収益認識基準適用前ベースの売上高
2025年度:174.5億円
78
2025年度
2029年度
1億円
億円
5
2029年度:202.0億円(CAGR 3.7%)
28
03 成長戦略「中期経営計画 2029」| 事業戦略
事業戦略
海外セグメント
海外セグメント
経営基盤の強化と地域別戦略の深化
海外セグメントは、北米、東南アジア、中国・香港を主力市場とし、地域ごとにグループ会社を設け、インテリア商品の製造・販売および設計・施工事業を展開しています。市場規模や成長性のポテンシャ
ルは大きく、地域特性に応じて各社の機能を高めながら、サンゲツの強みを横展開し、飛躍的な成長、収益力の拡大を実現していきます。
「中期経営計画 2029」最終年度にはインオーガニックな成長も含めて、海外セグメント営業利
事業環境
益30億円の達成を目指します。これを実現するため、商品、人材、経営基盤を強化し、各地域の事
北米
業基盤の再構築とグループシナジーの創出を推進します。商品戦略においては市場の特性に応じ
環境意識の高まりや顧客ニーズの多様化により、従来型壁装材に加え、非PVC素材を含む高付加価値商品の需要が拡大。
た「核となる自社商品」の確立に向け、グループ全体で商品ポートフォリオを管理するとともに、国
東南アジア
内インテリアセグメントの商品ラインアップの海外展開や、地域戦略に適した新たなブランド確立
都市化や経済成長を背景に、ホテル・商業施設・ヘルスケア分野を中心とした内装需要の拡大が期待。一方、各国
を加速させます。グループ会社各社の事業基盤の強化に向けては、海外事業を持続的に牽引する
市場では競争激化や価格志向の高まりも進んでおり、地域ごとの特性に応じた商品・販売体制の強化を推進。
経営者・管理職層の育成に向け、サクセッションプランの策定を進めながら、次世代リーダー候補
中国・香港
の早期特定や、グループ内での人材交流・ローテーションを通じて、グローバルに対応できる人的
不動産市況により集合住宅市場の縮小、
デフレによる需要低迷、ホテル・オフィスでも各種コスト上昇の影響が拡大。
資本を拡充します。
成長戦略
海外セグメント売上高/営業利益
海外インテリア事業
北米
542
350
■■売上高(億円)
297
■■営業利益(億円)
〜成長の加速〜
壁紙製造・販売ビジネスの強化を図るとともに、隣接かつ成長余力の大きい防音材・木質パネル・ファブリック
159
150
等のビジネスへの参入を図り、さらなる成長を加速する。
中国・香港
242
217
198
〜事業基盤再構築と収益の確保〜
30
事業基盤を再構築するとともに、収益性の高い市場・領域への選択と集中、中核商品の確立に取り組み、収益
力を高める。
(年度)
東南アジア(インテリア)〜成長軌道へのシフト〜
シンガポール、マレーシア、タイ、ベトナムでの収益基盤を確固たるものとし、注力すべき市場・領域に経営資源
を集中し、成長軌道へのシフトを実行する。
▲9
▲9
2019
2020
▲18
2021
▲3
▲12
2022
2023
▲7
2024
▲0.4
2025
2029 計画
※2023年度より、サンゲツ単体の海外事業部門損益を算入
海外空間総合事業
東南アジア(空間総合)〜収益基盤の強化〜
D Perceptionは、CEOのリーダーシップに依存した経営から組織ドリブン型経営に移行し、
フラットな組織と
着実な収益基盤を確立する。
CAGR
セグメント売上高
売上高年平均
成長率
2025年度
%
350億円
11.5
セグメント営業利益
2029年度
2025年度
2029年度
億円
▲0.4 億円
億円
542
30
29
03 成長戦略「中期経営計画 2029」| 事業戦略
海外セグメント
北米
●
●
東南アジア
積極的な製造受託ビジネス拡大による塩ビ系壁紙
●
注力市場・分野への経営資源の集中
●
経営管理の適正化と事業基盤の再構築
の販売数量増加ならびにコスト競争力強化
●
連結経営体制再構築による生産性向上
●
市場に適したコアとなる商品の確立
既存事業との 親和性 の 高 い 隣接分野 の 取り扱 い
●
地域間のシナジー創出とグループ間の共通アセット
●
中国・香港の連結経営体制の強化
商品群拡張
●
中国・香港
の有効活用
非住宅市場における競争力強化
北米市場の中核であるKorosealは、2022年の新経営
東南アジアは人口増加や都市化、ホテル・商業施設などの
中国・香港市場は不動産市場の低迷や雇用環境の悪化に
体制移行後から顕著な業績回復を遂げています。
「中期経営
建設需要を背景に中長期的な成長が期待される市場であり、
よる消費意欲の低下などを背景に、依然として厳しい市場
計画 2029」では製造・販売基盤を活用し、非住宅市場にお
各国市場の成熟度や競争環境を踏まえた地域ごとの収益性
環境が続いています。このようななか、事業基盤の再構築と
ける競争力強化を推進し、成長の加速を目指します。主力の
向上が重要課題です。業績改善が進む地域においては、
シェ
早期の黒字化を最優先事項とし、インテリア商品の販売に
壁装材事業では、自社ブランドの商品力向上に取り組むとと
ア拡大が見込める市場分野へのリソース集中や、商品ポー
よる収益の確保に注力します。事業立て直しの鍵となる商品
もに製造受託の拡大により工場稼働率の安定と収益性の確
トフォリオの見直しを含めたさらなる収益力強化と持続的成
戦略については、日本ブランドへの評価や高付加価値商品
保に努めます。また、北米において市場が限定的な塩ビ系壁
長に向けた人材育成に注力します。また、シンガポールでは
の需要の高まりに向け、サンゲツおよび各社との連携によ
紙への依存から、防音材や建築パネル、
ファブリックなど、既
本社機能を整理し、グループ全体の生産性と効率性を高め
り、市場ニーズに適応した商品戦略への転換を図ります。さ
存領域と親和性の高い隣接分野への展開を推進していきま
る連結経営体制を再構築します。一方、設計・施工事業を担う
らに、中国と香港の拠点間で販売戦略の連携や商品開発の
す。2029年度の飛躍的な成長に向け、M&Aも視野に入れ
D'Perceptionについては、組織ドリブン型の経営体制へと移
水平展開など、両地域間のシナジーを高めることで厳しい
た事業領域の拡大を通じて、北米市場での確固たる地位を
行させることで、組織の安定化と収益力の強化を図り、確固た
事業環境を乗り越え、早期に安定収益を生み出す基盤を構
築き、海外セグメント全体を牽引していきます。
る事業基盤を確立します。
築したうえで、次なる成長戦略へと着手します。
2025年度
売上高
225.6億円
営業利益
8.6億円
2029年度
394.0
30.0
億円
億円
インテリア
2025年度
売上高
2025年度
2029年度
43.1億円
0.6億円
営業利益
63.8
3.0
億円
億円
売上高
8.8億円
2.2億円
営業利益 ▲
2029年度
13.2
0.5
億円
億円
空間総合
2025年度
売上高
73.1億円
▲2.6 億円
営業利益
2029年度
72.0
2.6
億円
億円
※各数値はサンゲツ単体の海外事業部門損益を含まない個社数値
30
03 成長戦略「中期経営計画 2029」| 財務・資本戦略
財務・資本戦略
PBRの向上に向けた主な取り組み
執行役員 コーポレート部門
財務経理部長
兼投融資担当
事業ポートフォリオの変革や資本の最適化、経営基盤の強化を通じて、持続的なエクイティスプレッドの拡大を目指します。
宇都和久
利益創出力の向上
財務・資本戦略を事業戦略に連動させ、
コア事業の高収益化と成長事業の育成
2029年度 14.0%
ROEとPERの双方を高めることで、
最適な
資本構成の追求
PBRの向上につなげていきます
配当下限155円と配当
性向60%以上目安、自
己株式の取得による資
本コントロール
PBR向上
当社グ ル ープ は 、持続的 な 企業価値 の 向上 に 向
け 、事業戦略と財務・資本戦略を一体で推進してい
PER向上
中期経営計画【BX 2025】では、空間総合事業お
● 開示拡充と実績による成長確度の向上
● 経営基盤の強化
● ガバナンスの高度化
持続的な
成長期待の醸成
らなかったことに 加え、途上に ある成長投資 の 未達
● 市場との対話拡充
資本コスト:現時点では6〜8%程度(CAPM、インプライド・コスト、投資家対話等)を推計
や 緩 や か な 還元水準向上 の 結果、手元資金 が 積 み
ROE・ROICと資本コストの推移
い 、利益創出力 の 強化と、持続的 に 資本コストを 上
ROE(%)
回るリターンの実現を目指します。具体的には、成長
領域 へ の 戦略的 な 資本配分を通じて収益力を高 め
縮減 などを 踏まえた キャッシュ・アロケー
ションや最適な資本構成の継続検討
事業・財務リスクの低減
市場からの評価
向上を目指す
よびエクステリア事業が 想定した 成長スピードに 至
「中期経営計画 2 0 2 9 」では 、この 課題 に 向き合
● 資産・資本コントロール
現預金や負債活用、継続的な政策保有株の
資本コスト抑制
ます。
上がる課題を残しました。
● 事業ポートフォリオ変革を実現する事業戦略
連結営業利益率10%
ROE向上
2025年度 12.5%
ROIC(%)
16.0
税引後営業利益÷(運転資本+
有形固定資産+無形固定資産)
13.7
るとともに 、非事業資産 の 適切 な 圧縮 によるバラン
スシートの 適正化 や 、積極的な株主還元による最適
12.0
12.5
な 資本構成 の 追求を 通じて、R O E の 持続的 な 向上
を図ります。さらに、目標の達成に向けた進捗や、将
11.0
8.0
資本コスト6〜8%
(CAPM、
インプライド、投資家ヒアリング等)
来 のキャッシュフロー 創出 のストーリーを透明性高
く発信し、株主・投資家の皆さまとの対話を一段と深
14.0
4.0
めてまいります。
(年度)
0.0
2016
2017
2018
2019
2020
2021
2022
2023
2024
2025
2029 計画
※2029年度のROICについては、新リース会計基準の適用を見込んだ目標値
31
03 成長戦略「中期経営計画 2029」| 財務・資本戦略
利益創出力の向上
総資産回転率・財務レバレッジ
R O E 向上 の 牽引役となるの は 、事業 ポ ートフォリオ変革
ROEの向上において、PLの改善のみならず、BSの最適化を通
き検討していく方針です。
また、新リース会計基準の適用(アセットオン
を通じた 収益性 の 向上です。今回発表した 中期経営計画で
じた「資産・資本効率の向上」と
「適切なリスクテイク」が必要と認
バランス化)に伴うROIC低下に対しては、本業の収益力強化とモニタ
識しています。
「総資産回転率」については、SCM戦略の推進によ
リングの徹底により、資本効率の維持・向上に取り組んでいきます。
り棚卸資産適正化の成果が表れている一方で、余剰現預金や投資
● 資産・資本の構成と最適化方針
は、本業の稼ぐ力を示す連結営業利益250億円(営業利益率
10%)の達成と、連結当期純利益170億円を目指しています。
収益基盤である国内インテリア事業では、全国を網羅する
販売ネットワークをいかし、市場ニーズを捉えた商品ポート
フォリオの最適化を進めることで、成長市場におけるポジショ
ン強化を図ります。また、サプライチェーン全体のコストコント
ロールに取り組むことで、マージンの維持・拡大を推進します。
有価証券といった非事業資産の簿価増加に加え、収益貢献度の高
い事業資産への投資が限定的であったことなどから横ばいでの推
移にとどまっています。こうした課題に対し、政策保有株式につい
率を意識した対応を進めています。前中計期間中においては5銘
柄を売却し、2025年度の残高は100億円(対純資産比率8.3%)
となりました。政策保有株式の縮減をはじめとする資産最適化に
ており、当社グループの利益成長を力強く牽引するドライバー
よって創出した資金は、成長投資および株主還元へ機動的に再配
とするべく、成長投資を実行する計画です。さらに、事業ポート
分し、さらなる企業価値向上へと結び付けていきます。
「財務レバ
フォリオの変革に向け、次世代事業や新商品等への投資にも
レッジ」については、実質無借金の状態にあり、成長投資規模に応
果敢に挑戦し、中長期的な新たな成長の柱となる事業を育成
じた機動的な有利子負債の活用も含め、最適な資本構成を引き続
これらの事業戦略と連動して、投融資の管理や連結経営の
高度化をはじめ、事業変革を支える人的資本やデジタル基盤
への投資を計画的に実行し、事業戦略を後押ししていきます。
● キャッシュ・アロケーション
(2026〜2029年度累計)
Cash Out
成長投資
棚卸資産
218 億円
政策保有株の縮
減( 2 0 2 5 年度
100億円・対純
資産比率8.3%)
成長投資に応じ
た有利子負債活
用方針
自己資本
1,215 億円
自己資本比率
投資その他資産
236 億円
64.3 %
持続的な資本収
益性向上に向け
た 資本 コ ント
ロール
450億円
550億円
770億円
中期経営計画期間中に200〜250億円の戦略投資枠を設定し、
コアビジ
● 成長投資の重点領域
R&D
M&A
企業
ブランディング
新規事業
200億円
〜
730億円
7.1
6.3
主にSCM戦略
による最適化
145
億円
を集中的に投入する計画です。
〜
総資産回転率(回)
〜
財務レバレッジ(倍)
営業CFの創出
7.5
357億円
有利子負債
ネスの高度化と新領域の開拓に向けて、以下の3つの重点領域へ経営資源
戦略投資
8.0
現預金・
有価証券
総資産1,889億円
キャッシュ・アロケーションの方針
Cash In
売上高当期純利益率(%)
成長投資・株主
還元による適正
化方針
ては、保有に伴うコストとリターンを厳格に見極めながら、資産効
一方、北米インテリア事業は本格的な収益貢献フェーズに入っ
していきます。
2025年度
250億円
R&D
● 新素材、
新商品の開発を強化すべくR&D拠点を開設
● パートナー企業とのアライアンス強化
企業ブランディング
4.8
● 目指す企業像「素材とデザインを起点に、
インテリアから文化をつくる企業」
を社会全
基盤投資
0.8
2016
1.8
1.7
1.7
1.7
1.6
1.6
有利子負債の
活用・資産圧縮
1.6
1.0
1.7
1.0
0.9
0.9
0.9
0.9
2017
2018
2019
2020
0.2
2021
1.1
1.1
1.1
1.1
2022
2023
2024
2025
(手元流動性適正化含む)
(年度)
70億円〜230億円
350億円
人的資本
デジタル資本
250億円
〜
1.6
株主還元
〜
2.2
1.5
体へ発信すべく、
マーケティング、
プロモーション機能を強化
3.3
2.9
450億円
ロジスティクス
拠点整備
300億円
M&A・新規事業
● インテリア事業における商品ポートフォリオ拡充
● インテリア事業隣接領域における事業機会ならびに業界再編に伴う事業機会の検討
● 北米をはじめとして、
海外での事業領域、規模の拡大
32
03 成長戦略「中期経営計画 2029」| 財務・資本戦略
PERの向上に向けた市場との対話
株主還元方針
当社は2013年度以降、業績の変動に関わらず安定的な増配を継続しており、前期までに12期連続の増配を実現してまいりま
2022年度以降、EPSが伸長する一方、当社のPERは一定水準
した。今回の中期経営計画においても、還元の基本ポリシーである安定的かつ継続的な増配の姿勢に変わりはなく、企業の成長
にとどまっており、持続的な成長に対する市場の期待を十分に高
フェーズに応じた最適な利益配分に努める方針です。一方で、成長投資と株主還元を両立するべく、株主還元方針をアップデート
めるには至っていないと認識しています。
しました。具体的には、
「 1株当たり年間配当金の下限を130円から155円」へ引き上げるとともに、株主・投資家の皆さまとの対話
中期経営計画発表後の対話においても、投資家の皆さまから
を踏まえ、還元の予見可能性を高めるため「連結配当性向60%以上」を目安に掲げています。これは、配当原資となる利益創出に
「戦略と目標との関連性が十分に示されておらず、将来のキャッ
向けた成長投資を着実に実行・回収し、持続的な利益成長に連動した増配を実現していくという、経営のコミットメントを示すもの
シュフロー創出の確度を判断しにくい」
とのご指摘をいただき、
です。さらに、資本効率の観点から、配当の維持・拡大に加え、市場環境や成長投資の進捗などを総合的に勘案した機動的な自己
課題として真摯に受け止めています。引き続き、各戦略の妥当性
株式の取得を実施していきます。
や進捗に加え、それらが業績や資本効率の向上にどのように結
● 株主還元は安定配当を基本とし、
1株当たり年間配当金155円の下限設定と配当性向60%以上を目安に増配を目指す
● 市場環境や資本効率、
成長投資等の状況を鑑み、適宜自己株式の取得を検討する
び付くのか、
より透明性の高い開示に努める方針です。当社は、
株式の流動性や機関投資家へのヒアリングを踏まえ、現時点で
は資本コストを6〜8%程度と認識しています。一方、株主・投資家
※配当性向の算出における利益は「一過性の特殊要因」を控除したものをベースとします。
の皆さまとの継続的な対話を通じて、市場が事業・財務リスクを
どのように評価し、資本コストに織り込んでいるかの把握に努め
EPS(円)
一株当たり年間配当金(円)
238.7
ます。
その内容を経営戦略や情報開示の改善に反映し、中長期的
249.0
243.4
な資本コストの低減を図ります。
こうした対話と開示の好循環を
配当性向(%)
創出し、持続的な成長に対する期待の醸成に貢献していきます。
213.6
328.4
EPS(円)
53.6%
79.5%
97.9%
243.4%
73.3%
1,494.0%
44.0%
57.5%
70.2%
PER(倍)
62.2%
68.1
140.0
150.0
155.0
32.0
57.2
55.5
213.6
105.0
78.9
68.9
52.5
56.5
35.1
70.0
57.5
58.0
21.2
19.1
97.5
23.5
68.9
78.9
57.2
4.6
23.5
4.6
(年度)
2016
249.0
238.7 243.4
97.5
2017
2018
2019
2020
2021
2022
2023
2024
2025
2016
2017
2018
2019
2020
2021
13.7
13.6
12.4
2023
2024
2025
9.4
(年度)
2022
33
03 成長戦略「中期経営計画 2029」| 経営基盤の強化
経営基盤の強化
持続的な価値創造に向けた基盤構築
● 人的資本「変革と挑戦」
を支える人材と組織の共創
● 連結経営
「変革と挑戦」
「イノベーションの創出」を推進する源泉として人的資本の強化を図ります。
「構想
当社グループが将来にわたって持続的な成長を果たしていくうえで、国内外グループ会社の成
力・実行力・倫理観」を備えた人材と
「オープンマインド・共創・心理的安全性」のある組織を共創
長、収益力の強化、ならびにサンゲツグループとしての連結経営の重要性は一段と高まっていま
し、経営戦略と連動した人材基盤を構築します。
す。各社が独自の強みをいかして自律的に成長しながら、グループ間のシナジーを最大化する体
(▶人材戦略|P.35〜36)
制を構築します。
● デジタル資本戦略資本への進化と財務価値を生み出すDXの推進
サンゲツグループ 営業利益構成 ※個社単純合計
蓄積したデジタル資本を「戦略資本」へと進化させ、データドリブン経営を推進します。ビジネス
プロセスの自動化やSCMの高度化により
「生産性の向上」と
「新たな価値の創造」を両立し、確か
な財務価値を生み出します。
サンゲツ(単体)
国内グループ会社合計
2029年度
(計画)
各社の成長戦略を着実に遂行し、
2025年度
グループ全体の収益力の底上げを図る
(▶DX戦略|P.37)
● サステナビリティ経営の高度化
海外グループ会社合計
● サステナビリティ目標
当社は社会的責任と企業成長を両立し、持続可能な社会の実現に貢献します。目指す企業像
経済価値の創出と歩を合わせ「社会価値」を確実に実現するため、事業を通じて
「地球環境保全」
「素材とデザインを起点に、インテリアから文化をつくる企業」の実現を支える強固な基盤として、
「DE&I」
「コミュニティへの参画」の3つの重要テーマに優先的に取り組みます。各テーマで2029年
ESG各領域の重要課題に取り組み、サステナビリティ経営を高度化していきます。
度に向けた具体的なKPIを設定し、目標達成を通じて持続的な企業価値の向上を図ります。
(▶サステナビリティ|P.44〜52)
DE&I
地球環境保全
●
脱炭素:サプライチェーン全体のGHG削減
●
環境配慮型商品の拡充:社会課題の解決、市場ニーズに資する商品開発の強化
●
資源循環:廃棄物削減、見本帳リサイクルの推進
コミュニティへの参画(児童養護施設改修活動)
● 女性管理職比率
単体
27
%
● 男性育休取得率
100
単体
● 連結ベース
50
%
件
企業活動における人権尊重
●
サプライチェーンにおける公正な取引および人権尊重
●
すべての企業活動における人権侵害の撲滅
● 脱炭素
社会貢献活動の推進
●
支援が必要な子どもたち、難民等への継続的支援
●
企業活動を通じた文化・芸術への貢献
企業価値向上に向けたガバナンス体制の強化
●
グループ全体でのコンプライアンスの徹底
①Scope1&2(2021年度比)
単体:カーボンニュートラル
ガバナンスの強化
●
地球環境保全
●
取締役会の実効性強化
②Scope3
55%削減
連結:
連結:仕入先GHG排出量削減
● 資源循環
● 商品を通じた環境負荷低減
単体:見本帳リサイクルの推進
単体:環境配慮型商品の拡充
34
03 成長戦略「中期経営計画 2029」| 人材戦略
人材戦略
4つの重点領域
執行役員
中期経営計画
コーポレート部門ゼネラルマネージャー
兼連結経営担当
長期ビジョン
「変革と挑戦」
「イノベーションの創出」
山下栄二
既存の枠組みを超える「構想力」を育み、
人財
変革をリードする人財と組織へ
サンゲツグループは、中期経営計画における「変革
と挑戦」
「 イノベーションの創出」を通じ、経済価値と
持続的成長を
支える人材基盤強化
組織
エンゲージメント
(構想力・実行力・倫理観)
事業戦略を
リードする人材の強化
(オープンマインド・共創・心理的安全性)
多様な個性を、共創の力に
個の活力を、推進力へ
DE&Iの深化
ウェルビーイングの向上
社会価値を両立した力強い 成長を目指しています。
● 教育研修体系の拡充
● 経営人材、
次世代リーダー育成
● 女性活躍推進
● 自律的なキャリアデザインの促進
このミッションを成し遂げるための最重要ドライバー
● リスキリングの推進
● グローバル人材の育成
● 共育て風土
● 働き方の多様化
● 人事制度の実効性向上
● 高度専門人材のキャリア採用
● 障がい者活躍推進
● 健康経営の推進
● グループ全体での人材育成の進化
● DX人材の育成
● グローバル人材の活躍
が、経営戦略と連動した人材戦略、すなわち「人財」と
「組織」の変革です。私たちは、経営戦略に連動した人
材ポートフォリオを描き、これを起点とした各種人事
施策を着実に実行しています。
当社の事業基盤を支えてきたのは、社員の誠実さ
と高い「現場力・実行力」であり、今後も大切にすべき
強みです。一方で、不確実な未来を切り拓くには、既
存の枠組みに捉 わ れず新 たな価値を描く
「構想力」
を持った次世代リーダーの育成が 急務です。この課
エンゲージメント
企業価値の向上においては、企業と個人の成長ベクトルの一致が重要な基盤となります。
この状態を継続的にモニタリングすべく、全
社員を対象としたエンゲージメントサーベイを導入しています。結果から組織の現状や多角的な課題を客観的に把握し、組織長とメン
バーが一体となり具体的な改善へつなげています。今期からは、中期経営計画に掲げる
「変革と挑戦」
「イノベーションの創出」実現のため
の組織改革を推進しており、特に「変革活動」
と
「組織風土」に着目し、双方の期待値・満足度が共に高い組織の比率を引き上げていきま
す。経営と現場の対話による改善を通じて、一丸となってさらなる成長を牽引する組織へ進化します。
題に対して、実践的な育成プログラムの導入や戦略
的な登用を通じ、次世代の経営・事業を牽引するリー
現状の課題と対応策
エンゲージメントスコアの推移 ※
ダーが継続的に輩出される仕組みを構築します。
います。自律的に行動する「人財」
と、心理的安全性に
裏打ちされた挑戦意欲あふれる「組織」の土壌づくり
課題区分
現状の課題認識
変革活動
業務改善レベルでの意識はあるが、
「外部環境への変化への意識」
「未
来に向けた先行的な試み」
「外部環
境の変化の共有」に関して、意識・実
行力ともに低い
57.7(BBB)
同時に、多様な個性が尊重され、安心して意見を交
わせる環境からこそ真の共創が生まれると確信して
59.4(A)
目標
58.0(A)
55.0(BBB)
● 新たな評価制度において
「イノベーションの創出」
の項目を目標に設置し、挑戦マインドを引き出す
● 異業種交流や部門間交流を通じて新たな事業ア
イデアを考える機会をつくる
53.7(BB)
● 中期経営計画の浸透を通じて、
部署を越えた「全
を両輪で推進し、持続的な企業価値の最大化へつな
げます。
今後の対応策
組織風土
2023年12月 2024年9月 2025年2月
2026年2月
※株式会社リンクアンドモチベーション社の提供するサービス
「モチベーションクラウド」によるスコア
部署内におけるコミュニケーション
は良好なものの、部署を越えた「全
社的な連帯感」や「階層間の意思疎
通」が不足している
社的な連帯感」を醸成する
● 社長はじめ経営層と社員との双方向の対話機会
を設け、
「階層間の意思疎通」を活性化する
● WEB社内報を活用し、
組織の枠を超えたコミュニ
ケーションの活性化を図る
35
03 成長戦略「中期経営計画 2029」| 人材戦略
構想力・実行力・倫理観をもつ人材育成
DE&Iの深化
当社は、
「構想力・実行力・倫理観」を備えた人材の育成を企業価値向上の要と位置付け、
「持続的成長を支える人材基盤強化」
当社は、DE&Iの推進を持続的な企業価値向上を牽引する
と
「事業戦略をリードする人材の強化」を柱として教育体系の拡充を進めています。当社の教育体系は、新入社員から役員に至る
「価値創造 の 源泉」と位置付けています。多様化する市場 や
階層別研修をベースに、
「構想力・イノベーション」
「 DX・AI」
「グローバル」、そして「キャリアデザイン」などの重点領域に合わせた
顧客ニーズを鋭敏に捉え、イノベーションを創出し続けるた
テーマ別研修を有機的に連動させ、社員の多様なスキル開発を網羅的に支援しています。なかでも、課長クラスの選抜層向け「事
めには、年齢、性別、国籍、キャリアなどの背景が異なる多様
業構想実践プログラム」は、事業戦略をリードする人材の育成に向けた重要施策です。将来の経営を担う部長層に求められる「先
な人材が互いを尊重し、刺激し合うことで生まれる「共創」が
見性」
「洞察力」
「戦略構想力」の開発を目的とし、自社の事業課題を題材とした実践型ワークショップを行います。現職より一段高
不可欠です。
い視座での意思決定や事業立案を体験することで、不確実な環境下でも成果を生み出す戦略実行力と変革推進力を養います。ま
当社ではその最重要テーマの一つとして、女性のキャリア
た、社員の主体的なキャリア構築を後押しするべく、社内インターン制度を活用した支援体制などを整備しています。さらに、この
支援と意思決定層 へ の 登用( 女性管理職比率 の 向上 )に 注
人材育成の枠組みは当社単体にとどまらず、グループ会社とも研修面での連携を深めており、グループ全体で強固な人材基盤の
力し、多様な視点が経営戦略にダイレクトに反映される組織
構築を目指しています。
づくりを推進しています。具体的には 、次世代女性リーダー
教育体系図
を育成するキャリア研修 や 管理職向けの 支援スキル 向上研
階層別
必須
選抜・選択
役員
・
部長
新任役員研修
新任課長研修
※ビジネススクール
BX推進・組織マネジメント
※経営応用
若手
4年目研修
財務知識
3年目研修
3年目
2年目研修
2年目
※マネジメント基礎
※リーダーシップ
新入社員導入研修
(夏季・冬季)
メンター/
ブラザーシスター研修
40
30
グループ
また、誰もが自分らしく能力を発揮できるよう、コアタイム
のないフレックスタイム制度やテレワークの「中抜け制度」、
ガバナンス
研修
時間単位の有給休暇といった、時間や場所に捉われない 柔
経営職研修
助なども整備し、環境面とスキル開発の両輪でDE&Iの真の
軟な働き方を整備するとともに、育休復職支援や育児費用補
定着を図っています。
マネジメント
研修
女性管理職比率(各年4月1日時点)
管理職
基礎研修
リーダー
研修
21.3%
17.9%
13.7%
36
新入社員
導入研修
新規導入講座
※他社・異業種交流
22.6%
中期経営計画2029
27.0%
24.2%
18.3%
13.7%
20.1%
18.0%
15.8%
46
導入研修
新入社員
1年目
マーケティング
︵基礎︶
※女性次世代リーダー研修
54
歳・歳・歳︶
次世代リーダー
キャリア
デザイン
社内インターン・部署紹介企画
昇格者 リーダー研修
オンライン学習・資格助成
中堅
※経営基礎
昇格者
マネジメント基礎研修
職種別専門研修
※経営シミュレーション研修
DXパートナー・DXリーダー育成講座
(課長クラス)
事業構想実践プログラム
社内外小集団活動︵アイデアソン︶
※
目標設定・評価研修
新任管理職基礎知識
その他
年齢別研修︵
経営人材(部長クラス)
グローバル
マインドセット・異文化理解ビジネススキル・語学
新任部長研修
DX・AI
DX・AIリテラシー研修
経営戦略・事業構想
イノベーション
構想力・
イノベーション
マーケティング
︵応用︶
管理職
ガバナンス研修
P職任用者研修
修を実施しています。
テーマ別
55
63
33
23
24
33
38
41
2022年
2023年
2024年
2025年
2026年
2030年
女性管理職人数(マネジメント職)
女性管理職人数(プロフェッショナル職)
女性管理職比率(マネジメント職)
女性管理職比率(プロフェッショナル職含む)
36
03 成長戦略「中期経営計画 2029」| DX戦略
DX戦略
サンゲツグループのDXとは
執行役員 DX部門ゼネラルマネージャー
兼 サイバーセキュリティ担当
兼 サプライチェーンマネジメント担当
柴垣香平
ビジネスプロセス
【イノベーション】
自動化
進化×深化を担い
化と生産性向上を図る
● 成長領域や新商品開発を支えるシステム基盤を進化させ、
事業拡大に寄与する
● 客観的なデータに基づく意思決定によりSCM構造改革を進め、
適正在庫の維
直接的な
財務価値を創出
● ITによるビジネスプロセス自動化およびAIによる判断高度化により業務の標準
SCM高度化
ITと生成AIの力でビジネスプロセスを
持、倉庫内の処理能力の向上、最適な在庫配置を実現する
● サプライヤーとの連携を含めた発注・補充の仕組みを整え、
サプライチェーン
全体での利益創出を目指す
根本から変革し、サンゲツグループの
さらなるスケール拡大を牽引します
【ガバナンス・レジリエンス】
新たにスタートした「中期経営計画 2029」において、私
持続可能な
たちDX部門は、サンゲツグループの持続的な成長を技術
インフラ整備
成長のための
た従来のIT部門の役割にとどまらず、
より直接的なビジネ
スへの貢献にコミットしている点です。その中核となるの
が、当社のビジネスモデルの要であり利益の源泉である
「サプライチェーンマネジメント
(SCM)の高度化」
です。
こ
の変革をDX部門が主導し、客観的なデータに基づいてサ
プライチェーン全体を改革することで、直接的なキャッシュ
フローの創出と事業スケールの拡大を実現し、
トップライン
私たちのミッションです。現在、
ビジネス環境は生成AIの登
場によって劇的な
「ゲームチェンジ」の真っ只中にあります。
この新たなテクノロジーの活用を先送りすることは、競争
優位性の喪失や、社員の業務負担拡大といった重大なリス
クにつながるものと認識しています。だからこそ当社は、従
業員全体のITリテラシーの底上げを図り、AIの活用を前提
とした業務プロセスの再設計を推進します。私たちDX部門
は、
こうしたITリテラシーの向上や強靭なセキュリティをは
じめとするDX基盤の整備を通じて、あらゆる部門が自発的
な変革を生み出す組織能力を高めることに貢献し、
サンゲ
ツの次なるステージへの挑戦を力強く支えていきます。
サイバーセキュリティ
● 従業員全体のデジタルスキル
(ITリテラシー)の底上げを図り、AIの活用を前
提とした業務プロセスの再設計を推進する
● 全部門がDXに取り組み、
現場主導で変革を生み出せる組織能力を構築する
● ゼロトラスト※化を加速させ、
サプライチェーン全体の安全を確立する
● クラウド技術の全面的な活用を進め、
システム障害に対する強さと、迅速な復
旧力を強化する
※ゼロトラスト:従来の「社内ネットワークは安全」
という境界型の考え方を捨て、社内外を問わずすべてのアクセスに対して都度認証・検証を行うセキュリティの概念
● SCM×AI戦略:高精度な需要予測による収益基盤の強化
需要予測の高度化による価値創出プロセス
当社は、持続的な企業価値向上に向けたDX戦略として、SCM(サプ
インプットデータ
ライチェーン・マネジメント)
とAIの融合を推進しています。その実現に
向けた鍵となるのが、客観的なデータに基づく意思決定の高度化と、
過去実績データ
次世代型の在庫・発注プロセスの構築です。従来の当社の強固なサプ
● 日次・週次販売量
● 商品の基本属性
(デザイン・機能性など)
● 過去の欠品状況
● 見本帳の属性
(収録時期・種類など)
ライチェーンは、担当者が長年培った高い専門性と経験知によって支え
られてきました。今後は、社内に分散して蓄積されていた膨大なデータ
を統合し、現場のノウハウと掛け合わせることで、他社には模倣困難な
「当社独自の資産」へと昇華させ、競争力を強化します。具体的には、
日
次・週次販売量や過去の欠品状況といった「過去実績データ」
と、
デザ
商品ごとの特徴データ
● 季節・市況の変動要因
(気候・トレンドなど)
AI
解析
の伸長とボトムラインの拡大を強力に牽引していくことが
ビジネススタイル整備
フレーム最新化
とイノベーションで支える決意を一層強くしています。当社
のDX部門の最大の特長は、
システムの保守や運用といっ
生成AI前提の
需要予測の高度化と提案
業務システムとの連動
● 需要予測の精度向上
● 自動発注の段階的拡大
イン・見本帳の属性、気候・トレンドといった季節・市況の変動要因など
● 最適発注量の算出・利用
● 需要予測のさらなる精緻化
の「商品ごとの特徴データ」
を掛け合わせ、AIによる高度な解析を行い
2026年度〜
2027年度〜
ます。
このAI解析から導かれる需要予測の高度化により、
まずは2026
年に予測精度の向上と最適発注量の算出・利用を実現します。
さらに
2027年以降は、業務システムと連動させた自動発注の段階的拡大を
進めます。一連の取り組みにより、
「在庫コストの低減」
「欠品・過剰在庫
期待される効果・価値創出
在庫コストの
低減
欠品・過剰在庫の
抑制
納期遵守率の
向上
の抑制」
「納期遵守率の向上」
といった確実な成果を創出し、最終的に
はこれらを「PL・BS・CFの改善」へとつなげることで、当社の成長を支
PL・BS・CFの改善
える強固な基盤を確立します。
37
04
「社長
社員」座談会
強みを掛け 合わせ、未来を創る―サンゲツグループの変革と挑戦
将来のサンゲツグループを担う社員と社長が一堂に会し、それぞれの現場で感じる課題や可能性、実現したい未来について率直に語り合いました。
部門や会社の垣根を越えた連携のあり方や、新たな価値創造に向けた挑戦をテーマに、サンゲツグループの未来像を展望します。
ロジスティクス部門
企画開発室
松本宏美
商品統括部門
イノベーション戦略室
プロモーション課
佐竹詔子
海外事業部門
海外事業部
フェアトーン株式会社
東日本営業部東京SC2課
宗和佑磨
吉田拓也
代表取締役
社長執行役員
近藤康正
コーポレート部門
財務経理部
DX部門
SCM統括室 SCM推進課
渡辺 みなみ
事業部門
レジデンシャル営業部
リフォーム事業推進室
豊田竜也
山﨑彩
38
04「社長×社員」座談会 | 強みを掛け合わせ、未来を創る―サンゲツグループの変革と挑戦
サンゲツの持続的成長に向けた課題
近藤 サンゲツは強固な経営基盤を持っていますが、
これを形
成するビジネスモデルが確立されたのは50年以上前のことで
す。
この財産をいかして、
いかに新しいものを生み出していくか
が重要な課題であり、逆に言えば大きな成長のポテンシャルで
あると考えています。
これからのサンゲツをつくっていくために
何が必要と考えているか、
皆さんの考えを聞かせてください。
佐竹
サンゲツの強みは、長年培ってきた歴史と信頼、
なかで
も壁装材の分野で人々の暮らしを支えてきた実績にあると思い
ます。一方、課題として、
そうした歴史やアーカイブの価値は十
分に認知されていません。今後は、価格や機能だけでなく、文
化的価値も差別化の軸として重要性が増していくと思います。
また、壁紙自体の魅力や文化的価値を広く発信していくため
に、
業界全体を巻き込んだ取り組みも必要だと考えています。
宗和「長年培った信頼と実績」
に通じるかもしれませんが、業
界におけるブランド力に加え、全国に広がる営業・物流・ショー
ルームのネットワーク、
そして商品の企画・開発力を含めた総合力
海外事業部門海外事業部
宗和佑磨
国内の多様な現場・職種を経験した知見をいかし、現在はグローバル市場に向けた新たな価値
提供の推進や国内見本帳の海外展開を主導。
が、
国内トップシェアの基盤を形成していると思います。
ただし国内
市場は中長期的に縮小が見込まれており、
グローバル市場でのブ
ランド力を確立し、
さらなる成長を実現していくことが必須であると
考えています。
山﨑過去築いてきたブランド力や総合力は大きな強みである一
方、
これからの未来に向けて、
さらなる進化が必要なフェーズにあ
るということですね。
営業の現場でも、
過去の強みに安住せず、
より
高い価値を提供することを日々模索しています。
そのためには、
営
業担当者が持つ専門知識や提案ノウハウ、
人脈を組織全体で共
有・継承していくことが重要です。
若手が主体的に考える力を養い
ロジスティクス部門
ながら成長できる環境を整え、
組織全体の営業力向上につなげて
営業部門、マーケティング等を経て現職。社会課題でもある物流の効率化に向け、サプライチェ
ーン全体と協力して業務のデータ化を推進。
いきたいですね。
企画開発室
松本宏美
吉田 グループ会社としてお客さまと接するなかでも、
長年培われ
てきたサンゲツブランドへの信頼と認知度の高さを実感していま
豊田渡辺さんのご指摘のとおり、
FP&Aの立場から見ても、
物
す。
どれだけ商品が優れていても、
施工品質が悪ければサンゲツ
流コストをはじめ経営判断上の重要なデータが十分に可視化さ
全体の評価を下げることにつながりかねないため、
施工もサンゲツ
れていない場面があります。
サンゲツに眠っている価値あるデー
ブランドの価値を支える重要な要素であると自負しています。
フェア
タを経営資産として有効活用することで、
業務改革はもちろんの
トーンは施工力を強みとしていますが、
空間デザインや提案力の面
こと、
より精度の高い経営判断を通じた企業価値の向上にもつ
では学ぶべき点もあり、
グループ間の連携をさらに深めることで、
お
なげていきたいです。
客さまへの提供価値を高めていけると考えています。
松本物流の現場でもまさに同じ課題を抱えています。
物流もサ
渡辺知識やノウハウの組織的な展開という観点では、
データ活
ンゲツの競争力を支える大きな強みの一つですが、
現場の経験
用にも大きな成長余地があります。
当社には豊富なデータが蓄積さ
やノウハウによって支えられてきた部分が多く、
知見のデータ化
れていますが、
それを十分に活用できていない面があります。
現在
と活用が課題となっています。
特に即納体制は、
お客さまから高
はデータを活用可能な状態に整理している段階ですが、
活用基盤
く評価いただいている一方、
その維持のために物流現場に負荷
の構築や知識の社内浸透も大きなテーマです。
AI活用への関心が
が集中しやすいという構造的な課題も抱えています。
サービス品
高まるなか、
データに基づいて判断しようという意識も広がりつつ
質を維持しながら業務の平準化や効率化を進めることで、
より
あります。
この好機を捉え、
データに基づく意思決定を組織に根付
持続可能で働きやすい物流体制の実現にも挑戦していきたい
かせることで、
サンゲツの変革や成長を加速していきたいです。
ですね。
39
04「社長×社員」座談会 | 強みを掛け合わせ、未来を創る―サンゲツグループの変革と挑戦
サンゲツの「コア」の強みをいかした価値創造
近藤
他業界を見渡しても、時代に合わせてビジネスモデ
ルは大きく変化していくものです。新たな中期経営計画で
は「トータルインテリア」
という総合力を掲げましたが、皆さ
んはサンゲツグループの「コアの強み」は何だと考えてい
ますか?
佐竹
私は「空間全体の体験をデザインする力」だと捉え
ています。サンゲツの強みである商品の企画・開発力やデ
ザイン力は、単に商品を生み出すだけでなく、新しい価値
提案につなげられる可能性があると思います。見本帳の開
発から商品企画、提案までを一貫して手掛けているからこ
そ、空間全体の価値や体験をデザインするような事業へ発
展させていけるのではないでしょうか。
渡辺
佐竹さんが 挙 げた 価値提案を確 かなものにする
「サンゲツのサプライチェーン」
ももう一つの大きなコア、強み
です。現状でも強力ですが、データ活用によって業務をさら
に効率化し、社員がより創造的な業務に時間を使えるよう
になれ ば 、新たな価値創造を促進できるはずです。また、
高度化したサプライチェーンそのものが競争力となり、新し
いビジネスの可能性にもつながると考えています。
松本
全国をカバーする販売ネットワークも当社の強みで
す。市場の声や 変化をいち早く捉え、新たな商品やサービ
スにつなげる動きがさらに活性化すれ ば 、大きな価値創造
につながると思います。既存のインテリア商品に限らず、こ
のネットワークと親和性の高い領域に色々な可能性があり
そうです。
山﨑
強みを最大限にいか すためには、私たち営業も変
わっていく必要があります。先ほどお 話ししたように、これ
からは良い商品を単に売るだけでなく、お 客さまの課題解
コーポレート部門財務経理部
豊田竜也
全社的な与信管理体制の強化に加え、2026年に新設されたFP&A担当として、データドリブン
な意思決定基盤の構築を推進。
決を支援 するコンサルタント的な役割にシフトしていかな
けれ ば 、持続的な成長はないのではないかと危機感を抱
いています。サンゲツには 幅広 いお 客さまとの 接点 が あ
り、多くの情報や 知見が蓄積されています。
しかし、それら
が 個別 に散在し、十分 に活用しきれ ていない 面もありま
す。営業がハブとなって社内外の知見をつなぎ、課題解決
につなげることができれ ば 、新たなビジネスや 価値創造の
可能性も広がると思います。
豊田
山﨑さんがおっしゃったようなコンサルタント的なソ
リューション提案を進めていくためには、お客さまが抱える
さまざまな課題に寄り添う視点が 欠か せないと思います。
そのためには商品知識や 業界知識だけでなく、経営や 財
経営者目線でお 客さまを理解し、課題解決に向けた提案
ができるよう、財務や 経営の視点が必要な場面では、私た
ち財務経理部も積極的にバックアップしていきたいと考え
ています。
近藤
まさに今皆さんが 語ってくれたように、サンゲツの
強みを個別に捉えるのではなく、総合力として結び 付ける
ことが 重要ですね。市場やお 客さま、仕入先さまとの接点
から変化をいち早く捉え、新たな価値へと転換していくこと
が 、次の成長やイノベーションの創出につながると考えて
います。
務に関 する知識も含めた総合的な力が 求められます。一
方で、そうした知識を身につけたり、お 客さまごとに最適な
提案を考えたりする付加価値を生み出すための時間を十
DX部門 SCM統括室 SCM推進課
渡辺 みなみ
SCMの進化に向け、データやAIの力を活用した業務変革に挑戦中。現場のリアルな課題感に
寄り添うことを心掛けている。
分に確保できていないことも課題です。営業一人ひとりが
40
04「社長×社員」座談会 | 強みを掛け合わせ、未来を創る―サンゲツグループの変革と挑戦
イノベーションを生み出す組織への変革
豊田 イノベーションの源泉の一つは、部門を越えた連携に
あると感じています。全社視点で課題の本質を捉え、仕組み
化することが、社会の変化に対応する新たな価値創造や変
革につながると考えています。私自身の経験として、財務経
理部の立場から、空間総合事業の業務プロセス構築に関わ
るなかで、営業活動にも大きな変革が求められていることを
実感しました。従来の商品提案にとどまらず、
プロジェクト全
体を俯瞰した収益管理や多数の関係者との調整など、
より
多角的な視点で提案する力が重要になっています。
こうした
変化に対応するには、個人の資質や経験のみに頼ることな
く、必要な視点を業務フローやシステムに組み込む、部署連
携による仕組みづくりこそが重要であると再認識しました。
宗和
豊田さんの言う
「部門を越えた連携」の手応えは私が
携わっている海外事業の新たな取り組みでも感じています。
日本と海外のメンバーが協働し、商品だけでなく見本帳のあ
り方や提案手法まで含めて検討を進めることで、従来の国
内市場中心の発想に捉われない新たな価値が生まれつつ
あります。一方で、商品そのものを通じたイノベーションという
工現場の視点」
も商品の開発段階から取り入れていただき
たいです。人手不足が深刻化するなか、持続可能な施工体
制を確保していくためには、施工現場の工夫だけでは限界
があり、
メーカーも含めた業界全体で取り組む必要があると
考えています。例えば、施工しやすい商品を開発することで
作業時間を短縮できれば、現場の負担軽減や生産性向上
につながります。商品開発の段階から施工現場の課題を捉
え、
より働きやすい環境づくりに貢献していくことが、今後の
重要なテーマだと思います。
松本
吉田さんから施工現場の人手不足についてお話が
ありましたが、物流の現場でも同様の課題を抱えており、年
齢や性別を問わず活躍できる職場づくりがこれまで以上に
ションの創出という面では、一部門の中だけでキャリアを完
結させるだけではなく、他部門で経験を積んで視野を広げる
ことや、そこで得た知見を出身部門に還元することも有効だ
と考えています。多様なキャリアパスを整備し、一人ひとりが
成長できる環境をつくることが、組織力の強化にもつながる
のではないでしょうか。
佐竹
商品開発に十分いかし切れているとはいえません。実際に
向き合う社員が多い一方で、知見やデータが個人や部署内
商品改善や新商品の開発につながるケースもありますが、
に蓄積されたまま、十分に活用されていない面があります。
取り組みに濃淡があるのが現状です。今後は、現場の知見
部門横断プロジェクトやデータ共有化に向けた動きは出てき
を個人の経験にとどめず、豊田さんが指摘されたような「組
ているので、部門や職種を越えた連携の価値を理解する人
織的に収集・活用する仕組み」へと強化することが必要だと
を増やしていくことで、新たな発想やイノベーションが生まれ
考えています。
やすくなると思います。
山﨑
材が増えていて、異なる知識や経験が社内に蓄積されてい
ます。
そうした多様な視点を掛け合わせることで、新しい発想
や事業機会を生み出していけると思います。
カジュアルな場
も含めて日常的なコミュニケーションを活性化し、小まめな
接点を増やしていくことが連携の第一歩だと思います。
その意味では、個人の成長とともにメンバーや部門
間の連携も鍵になりそうですね。サンゲツには仕事に真摯に
現場の声を商品開発にいかすという点ではぜひ「施
山﨑彩
入社以来11年間非住宅領域の営業に従事したのち、2026年から住宅分野を担当。管理職と
して、多様性をいかしたチームづくりにも注力。
求められています。
この多様な人材の活躍を通じたイノベー
観点では、営業が現場で得ているお客さまの声や気付きを、
吉田
事業部門 レジデンシャル営業部 リフォーム事業推進室
近年はさまざまなバックグラウンドを持つキャリア人
41
04「社長×社員」座談会 | 強みを掛け合わせ、未来を創る―サンゲツグループの変革と挑戦
社会に必要とされる企業であり続けるために
佐竹
全国をカバーする販売ネットワークを通じて多くの
人に価値を届けられるという優位性があるからこそ、変化
を追いかけるだけでなく、自ら新しい価値を提案し、市場
そのものを創り出していく存在であるべきだと思っていま
す。
宗和
新しい価値とは、事業成長だけでなく、社会的・文
化的価値を創造し続けることが重要ですよね。例えば 、日
本各地の伝統技術や 産地のものづくりの中には、その価
値が十分に発信されないまま失われつつあるものもありま
す。サンゲツのブランド力や企画力をいかし、そうした技術
や 素材の魅力を広く社会に発信していくことは、大切な役
割 の一つではないでしょうか 。地域活性化や 持続可能な
社会の実現にも貢献できるよう、インテリア業界の枠を超
えた連携を通じて新たな価値を創造していきたいですね。
吉田
持続可能な社会の実現という点では施工現場の
視点からも、サステナビリティへの貢献が 重要だと思いま
す。環境に配慮したモノづくりやリサイクルの推進はもちろ
んですが 、そこに施工と商品開発の両方の知見を掛け合
わ せながら、環境負荷の低減と使いや すさを両立した商
品やサービスを生み出していくことができるのではないで
しょうか。
山﨑
営業の現場でも環境配慮への期待は年々高まって
います。一方で、
リサイクルや 資源循環の仕組みづくりに
はコストの問題があり、一企業だけでは解決が難しい課題
もあります。だからこそ、業界全体を巻き込みながら、社会
の意識や 行政を含めた仕組みを変えていくようなムーブメ
フェアトーン株式会社東日本営業部東京SC2課
ントを生み出していくことが、
トップランナーであるサンゲツ
オフィス内装の営業担当として見積り作成から現場管理まで一連の業務を経験後、2026年か
らはマネジメントとして組織目標達成に向けた仕組みづくりを担う。
には求められていると思います。
近藤
吉田拓也
皆さんの意見のとおりですね。改めて、空間の価値
や 豊かな暮らしを創造するという原点に立ち返り、宗和さ
んが触れたような社会的価値や文化的価値の創出につな
がる新たな挑戦を進めていくことが 重要です。一方で、先
ほど吉田さんや松本さんから出た施工や物流の人手不足
への対応も急務です。
インテリア業界では、人手に依存す
る業務や 伝統的な商慣習がまだまだ残っています。このま
までは人材が離れてしまうリスクがあります。高いシェアを
持つ当社だからこそ、施工性や 物流効率に優れた商品開
発、働き方改革を進めるのはもちろんのこと、業界全体の
構造改善そのものに踏み込んでいかなければなりません。
企業と社会の持続性を両立した成長ストーリーを示し、人
材に選ばれる業界づくりをリードしていくことは、
トップラン
ナーである当社の使命だと考えています。
商品統括部門 イノベーション戦略室 プロモーション課
佐竹詔子
2025年からブランディング担当として「文化をつくる企業」としてのサンゲツのブランド資産の
構築を推進。同年開催された『壁を装う展』にはプロジェクトリーダーとして参画。
42
04「社長×社員」座談会 | 強みを掛け合わせ、未来を創る―サンゲツグループの変革と挑戦
実現したい未来と挑戦
吉田
皆さんとの対話を通じて、
グループ間の連携にはま
だ大きな可能性があると改めて感じました。相互理解をさ
らに深め、
グループ一体となって力を発揮することで、
より
大きな社会価値の創出につなげていきたいです。
佐竹
今回のように直接対話することは、
グループブラン
ディングの観点からも非常に有意義だと感じたので、今後
も継続的にこのような場を作っていきたいですね。私はイン
テリアをもっと身近で能動的に楽しめるものにしたいと考え
ています。内装を“選ぶ楽しさ”や“文化”として広げていくこ
とで、市場そのものを創り出し、暮らしを豊かにする価値を
発信していきたいです。
豊田
現場の声や課題といった「点」の情報を経営戦略に
つながるデータへと整理し、数字と現場の行動を結び付け
ていきたいと考えています。
データ基盤や 経営管理の仕組みづくりを通じて収益向上
のドライバーや改善ポイントを可視化し、現場の皆さんがよ
り良い意思決定を行い、効率的に業務を進められる環境
づくりに貢献していきたいです。
ジネスモデルは成り立ちません。だからこそ、物流を持続的
な競争力として進化させ、1 0 年、2 0 年とビジネスが 変化し
ていってもサンゲツの発展を支える礎として進化させ続け
たいと思います。
渡辺
サンゲツが「サプライチェーン先進企業」
と呼ばれる
存在になることを目指したいです。データ活用や部門間連
携によってサプライチェーン全体を高度化し、お客さまへの
価値向上と働きやすさの両立、
さらには新たなビジネスの
創出という好循環を生み出していきたいと考えています。
山﨑
私は、
「仕事は絶対に一人ではできない」という考
えを大切にしています。サンゲツには、自分にはない知識
や経験、能力を持った人がたくさん集まっており、一人ひと
力になると考えています。今後は会社や 部門の枠を超え、
グループ全体で知見や 強みをいかし合うことで、サンゲツ
グループとしてさらに大きな価値を生み出していきたいで
すね。
近藤
皆さんがサンゲツの課題や可能性を深く理解し、強
い当事者意識を持って変革に取り組んでいることを大変
頼もしく感じています。皆さんも実感しているように、新たな
価値創造は一つの部門や一社だけで実現できるものでは
にすることです。そのためには、新たな商品や 価値の創出
ありません。部門間やグループ 会社、
さらには外部との連
だけでなく、国内外のグループ会社とのコミュニケーション
携を一層深め、
この先の4年間で、
しっかりと種をまき、少し
を一層円滑にし、連携をさらに深めることが欠かせません。
でも芽が出るようなことを具体的にやり遂げていってもらい
グループ全体の力を結集しながら、世界に新たな価値を発
たいと強く思っています。経営としても、
「中期経営計画
信していきたいと思います。
2029」の実現に向けて挑戦を後押しする基盤整備を進め、
松本
サンゲツの事業を支える重要な基盤である物流機
能が弱れば、
どれだけ優れた商品や提案力があっても、
ビ
近藤康正
りの強みを掛け合わ せることが 、課題解決や 成長の原動
私の目標は、サンゲツを世界中で認知される企業
宗和
代表取締役社長執行役員
着実な事業成長と未来につながる新たな価値創造を加速
していきます。
43
05
サステナビリティ
サ ステナビリティマネジメント
サステナビリティに関する考え方
サステナビリティマネジメント体制
当社グループの根底には、
「人々の暮らしを豊かにし、社
当社グループは、サステナビリティ課題へ適切に対応するため、
「監督」
と
「執行」および現場の役割を明確にしたマネジメント体制
会の発展に貢献する」という創業者の想いがあり、これがサ
を構築しています。執行体制においては、ESG委員会が中心となり、マテリアリティの設定や指標・目標の審議、活動の進捗確認を行っ
ステナビリティに関する考え方の原点となっています。企業
ています。また、
リスク管理委員会、投資融資委員会、コンプライアンス委員会の各委員会が経営会議と密接に連携し、サステナビリ
の持続的な成長は、社会や環境の健全性なしには成り立ち
ティ施策を推進しています。ここで決定された方針や施策は速やかに現場へと展開され、各部署が主体となってPDCAサイクルを回
ません。そのため、自社の経営基盤(人材・DX・知財・ガバナ
すことで、活動の継続的な改善と実効性の向上を図っています。これらのサステナビリティ活動の状況や成果は取締役会へ定期的に
ンス等)の強化にとどまらず、事業パートナーから周辺コミュ
報告され、適切な監督を受けています。さらに、外部のステークホルダーに対して積極的な情報開示を行うとともに、得られた評価を
ニティ、そして地球環境に至るまで、サステナビリティを構成
経営にフィードバックし、多様な視点を取り入れることで、透明性の高いマネジメントと持続的な企業価値の向上に努めています。
する各スコープに対する働きかけを広げることが重要だと
考えています。この考え方をマテリアリティに落とし込み、創
出した経済価値を、次なる社会価値へと還元するサイクルを
サステナビリティ関連のマネジメント体系
取締役会
監督
回すことで、社会と企業双方の持続的な成長を実現します。
監督
意思決定・統括
サステナビリティ構成要素と価値創造のスコープ
社会参画
(▶P.47)
コミュニティ
持続可能な
サプライチェーン
(▶P.46)
事業パートナー
サンゲツ
グループ
リスク管理委員会
投融資委員会
コンプライアンス委員会
(▶P.60)
方針・施策展開
Plan
経営会議
年度計画
立案
情報開示
評価
D
o
知的資本
(▶P.45)
連携
実行・
推進
各主管部署
改善
ct
A
DX戦略
(▶P.37)
● 指標・目標の審議
● 活動の進捗確認
(▶P.61)
施策実行
人材戦略
(▶P.35)
ESG委員会 (▶P.19)
● マテリアリティ設定・審議
ステークホルダー
地球環境
報告
執行
自然資本
(▶P.49)
外部
ion
進捗
確認
Chec
k
ガバナンス
(▶P.53)
44
05 サステナビリティ | 知的資本
知的資本
知的資本に関する考え方
知的財産に関する取り組み
当社は、
「中期経営計画 2029」で掲げる「素材とデザイン
当社が保有する知的財産権は、2026年3月末時点で特許権27件、実用新案権2件、意匠権262件、商標権291件と着実に拡充
を起点に、インテリアから文化をつくる企業」の実現に向け、
しています。特許の権利化については、2024年より、事業の自由度を拡大し競争力を高めるべく、社内のアイデア発掘に積極的に
知的資本を経営の重要基盤の一つと位置付けています。当社
取り組んでいます。意匠については見本帳掲載商品に加え、空間デザインや物件向けデザインの権利取得も推進し、汎用性の高い
事業における独自技術に関するアイデアやデザイン、
ブランド
デザインにおいても競合他社による模倣の抑止を図っています。取得した知的財産を単なる権利として捉えるだけでなく、販売活
等の無形資産を「知的財産」として戦略的に可視化・活用する
動やプロモーション活動での活用も含めて事業活動のあらゆるフェーズで有機的に連携させ、事業の成長や新たなビジネスチャ
ことで、当社の競争優位性を高め、中長期的な企業価値の向
ンスの創出につなげていきます。また、2026年については、当社およびグループ会社のクレアネイト社にて特許庁の企業インター
上を実現します。
ン(企業等派遣実習)に協力するとともに、意見交換などを行いました。こうした外部連携も活用し、社員への教育や啓発を積極化
これらの知的財産戦略を事業成長の推進力とするため、当
社では専門人材による部門横断的な知財活動を展開してい
ます。具体的には、商品開発の初期段階から知財専門人材と
連携し、競争力の要となる商品の独自技術に関する特許権取
得を推進しています。さらに、意匠や商標などを組み合わせた
「知財ミックス」を活用することで、コア技術からデザイン・ブラ
ンドに至るまで多面的に保護・活用しています。また、IPランド
スケープの視点を取り入れ、顧客ニーズ・競合の動向把握、ア
ライアンスやM&A候補の探索、知財情報をいかしたプロモー
ションなどにもつなげており、バリューチェーン全体にわたる
知財活用を積極的に推進するための取り組みを加速させて
います。
することで、事業に知的財産をいかす機運をさらに高めています。
当社の知的財産権の具体例
2025年10月にグッドデザイン賞を受賞した「ノンスキッド・エアコン排水目地蓋付きタイプ」は、共同住宅の共用廊下などに設置さ
れたエアコン室外機からの排水を、速やかに漏れなく側溝へ誘導するための目地材です。取り外し可能な蓋によって清掃性に優れ、台
車の滑走を妨げにくく耐久性のある独自設計により、特許を取得しています。
また、その構造に不可欠なカバーと本体の係合部に関す
るデザインでも意匠権を取得しており、商品の差別化された構成を特許権と意匠権の「知財ミックス」
で多面的に保護・活用することで、
市場における競争力を高めています。
さらに、当社では商品のみならず、見本帳に関する知的財産の取得にも取り組んでいます。見本帳
は、壁紙等の商品見本と仕様情報を一冊にまとめた、設計者やデザイナーなどが現場で用いる重要な商品選定プラットフォームの役割
を担っています。顧客接点の起点となるこのツールにおいて、当社は顧客の作業効率(ユーザビリティ)
を高める
「構造の知財化」
を推進
しています。その代表例が、2025年に取得した製本仕様に関する特許です
(特許第7743665号)。見開きページの前後どちらにも重
ねられる
「見本シート」により、商品見本と機能性等の詳細情報を同時に見比べられる操作性を実現しました。
この製本仕様により、顧
客が求める機能やデザインを備えた商品をプロユーザーが提案しやすくなり、商品選定における意思決定プロセスを大幅に効率化さ
商品企画・技術探索
開発・デザイン
IPランドスケープ
● 知財情報収集
● 技術動向把握
● 知財発掘
知財戦略
● 権利網構築
量産
販売
権利取得
非侵害調査
モニタ
リング
せるという新たな付加価値を生み出しています。今後も知的財産の創出と活用により、持続的な競争優位性を築いていきます。
(組図)
8
排水目地における外はめ構造を権利化(特許第7594150号)
前後の商品ページに重ねられる見本シートにより、商品見本と機能性等の
その外はめ構造に必要なカバーと本体の係合部に関するデザインでも
詳細情報を同時に見比べられる操作性を実現した見本帳仕様(特許第7743665号)
意匠権を取得(意匠第1795834号・第1795835号)
45
05 サステナビリティ | 持続可能なサプライチェーンマネジメント
持続可能なサプライチェーンマネジメント
持続可能な
サプライチェーンマネジメントに関する考え方
CSR調達の推進
労働安全衛生
CSR調達推進の基盤として、当社グループの方針をまと
当社では、物流および施工機能の拡充に伴い、自社従業員
サンゲツグループのサプライチェーンマネジメント
(SCM)
めた「サンゲツグループCSR調達方針」と、取引先へのお願
のみならず、物流パートナーや施工事業者を含めたサプライ
チェーン全体での労働安全衛生の確保を重視しています。
は、事業競争力を高める効率的な供給網の追求にとどまら
いを明文化した「お取引先さま向けCSRガイドライン」を策
ず、その基盤となる持続可能で強靭な供給体制の構築を重要
定し、サプライチェーン全体でCSR対応を強化する体制を構
この認識のもと、物流機能をロジスティクス部門、施工機
課題と位置付けています。変化の激しい事業環境において、
築しています。2017年からは、仕入先を対象にCSRガイド
能を空間総合事業部が管轄し、法令遵守や「お取引先さま
数多くの仕入先や物流パートナーと協働する当社にとって、人
ラインの遵守状況調査を実施しています。
向けCSRガイドライン」に基づく合意形成を前提に、各機能
権や環境、安全管理、およびコンプライアンスといった観点を
アンケートを通じ、法令遵守や環境配慮などの評価結果
の特性に応じた安全管理体制を構築しています。特に物流
踏まえたCSR調達の推進は、サプライチェーンに潜むリスクを
を個別にフィードバックすることで課題を可視化し、自律的
面については、出荷・配送拠点である各ロジスティクスセン
未然に防ぐために不可欠です。当社は、サプライヤーとの継続
な改善を促進しています。さらに、仕入先への直接訪問によ
ターにおいて、
リスクアセスメントによるリスク管理を徹底す
的な対話と連携により、機能の拡充と効率化を進めつつ、不
る対話を通じて、サステナビリティに関する取り組みの進捗
るとともに、危険予知訓練や安全パトロール、ヒヤリハット活
測の事態にも柔軟に対応できるレジリエンスを高めます。そし
確認や改善活動への具体的なアドバイスも行っています。今
動の計画的な実施のほか、協力会社やグループ会社が参加
て、事業に関わるすべての人々との相互信頼と連携を重視し、
後も丁寧な情報共有や対話を重ね、仕入先とともに持続可
する「安全衛生協議会」を年3回開催しています。当協議会で
サプライチェーン全体の健全性を維持向上させることで、社
能性の高いサプライチェーンの構築を推進していきます。
は、事故防止や体調管理などの対策を共有するほか、課題改
善に向けたディスカッションや専門家による講演を行ってい
会から信頼され続けるSCM体制の実現を目指しています。
ます。こうした活発な意見交換を通じ、全体の安全意識を一
段と高めています。
企業価値向上
2025年度アンケート結果(79社回答、調達金額カバー率:94.4%)
今後も協力会社との連携を深め、すべての人が安全・安心
CSRに関わるコーポレートガバナンス
に働ける環境を共創することで、強固な事業基盤の確立を目
100(%)
地域社会との共生
指します。
人権
60
攻 めの 要素
事業競争力を高める効率的な供給網
調達の最適化
40
サプライチェーン
労働
20
0
物流の最適化
情報セキュリティ
環境
守 りの 要素
24年度実績
持続可能で強靭な供給体制の構築
品質・安全性
人権・
環境配慮
労働安全衛生
コンプライ
アンス
公正な企業活動
25年度実績
25年度目標
重点管理項目
フォークリフトの安全教育
46
05 サステナビリティ | 社会参画
社会参画
社会参画に関する考え方
児童養護施設のリフォーム支援
サンゲツグループは、豊かな社会づくりに貢献することを
当社グループ の事業領域と強みをいかした社会貢献活
目指し、
「事業を通じて、社員一人ひとりが自主的に社会に
動として、児童養護施設をはじめとする社会福祉施設のリ
奉仕すること」を目的としたコミュニティ活動に積極的に取
フォーム支援を重点的に行っています。予算の制約により快
り組んでいます。企業理念における未来像として掲げている
適な生活環境の維持が難しい施設に対し、快適な住空間を
Dream「誰もが明日の夢を語れる世界」の実現に向け、未
提供することで、子どもたちが心豊かに成長できるよう活動
来を担う子どもたちへの「次世代支援」を重点領域とし、こ
に取り組んでいます。
のほか「DE&I支援」や「環境保全」といったテーマの活動に
実施にあたっては、施設スタッフの方々と打合せを重ね、
も取り組んでいます。こうした社会参画活動は、社員のエン
用途やイメージに合わせて壁紙やカーテンなどを決定し、
リ
ゲージメントや自社への誇りを高めるだけでなく、事業活動
フォームを実施しています。この活動は、子どもたちへの支
の拡大にもつながっています。さらに、社員の自発的な活動
援にとどまらず、人的資本強化にも大きく寄与しています。
を支援する制度として
「マッチングギフトプログラム」を導入
社員が子どもたちの喜ぶ姿を間近で感じ、自社商品が空間
しています。社員の社会参画活動に応じて付与される「スマ
にもたらす効果や価値を再認識することで、自身の業務への
イルポイント(S-mile)」を金額換算し寄付する仕組みを導
意欲や着想、そして誇りを深めています。
入することで、全社員が社会貢献に積極的に関与し、企業理
念を体現できる組織風土の醸成につなげています。
本活動は国内にとどまらず、国内外のグループ会社でも
それぞれの地域特性や事業の強みをいかして実施してお
り、
グループ全体として社会課題の解決に向き合う企業風土
社会参画と企業価値向上のつながり
の醸成につながっています。2014年の活動開始以来、これ
を展開しています。廃棄見本帳のリサイクルに必要
な「素材の分別作業」を競技化し、子どもたちが壁
紙サンプルを楽しく剥がしてフォトフレームを作る
企画です。遊びを通じてリサイクルの大切さとイン
テリアの 楽しさを学 べる点 が 評価され 、
「第19回
キッズデザイン賞」を受賞しました。
2023年度の開始当初は当社単独での実施でし
たが、直近では顧客主催ご家族向けイベントにて、
共同開催する取り組みも始めています。集客はもち
ろん、地域貢献、
リサイクル活動の促進、ブランド浸
透など、双方にメリットがあります。パートナーとと
もに社会課題解決に向けた価値を創り、その輪を
広げることは、当社の持続的な成長を支えるネット
ワーク構築につながっています。
経済価値の 創出
従業員
寄付・支援
事業活動
︵ 商品・サー ビスの 提供 ︶
業務への
好影響
ント「ビリビリンピック&エコフォトフレームづくり」
実施しました。
社会
やりがい・
気付き
次世代支援と環境保全を融合させた体験型イベ
までに累計348件(2025年度末時点)の施設リフォームを
社会価値の創出
社会参画活動
TOPIC(ビリビリンピック&エコフォトフレームづくり)
活動支援
サンゲツグループ
リフォーム支援の様子
47
05 サステナビリティ | 社会参画
障がいのある作家の活躍支援
多様な社会課題解決に向けた継続支援
TOPIC:ベトナムでの住宅建築支援
「誰もが 明日 の 夢を語 れる世界」の 実現に 向け、障が い
当社は、さまざまな格差の影響を受ける人々や、多様化す
の あるアーティストの 活躍支援を通じた 、D E & I の 推進に
る社会課題の解決に取り組む団体への、継続的な支援を強
ヒューマニティ・ジャパンを通じ、海外の住居課題解決
取り組んでいます。この 一環として、
「HERALBONY Art
化しています。2023年度からは、専門的な知見と幅広い活
に参画しています。2026年にはベトナムのアンザン省
Prize」や「アートパラ深川おしゃべりな芸術祭」への協賛に
動実績を持つ4つの団体への継続支援を開始しました。支
における住宅建設プロジェクトを支援し、3世帯分の住
おける企業賞の選定に、部門を越えた有志社員が参加して
援先の選定にあたっては、社員から広く意見を募り、各団体
宅建設に貢献しました。入居されたご家族からは「住ま
継続支援先である認定NPO法人ハビタット・フォー・
います。多様な視点からアートの持つ可能性を議論するこ
の理念や活動方針を慎重に検討しました。決定後は、毎年
いへの不安が軽減され、子ども達が落ち着いて勉強で
とは、社員が社会課題を自分ごととして捉え、高い視座で業
の全社説明会を通じて、社会課題の現状や支援の意義を共
きる環境が整った」
と喜びの声が届いています。専門団
務に臨む組織風土の醸成につながっています。また、このほ
有しています。寄付の実施のみならず、こうしたプロセスに
体との協働により、当社のパーパスである
「やすらぎと
かにも、さまざまな社外アーティストとの共創として、その作
社員が参画することで、社員一人ひとりの社会課題に対する
希望にみちた空間の創造」をグローバルに実践してい
品を当社の壁紙や床材などの商品デザインに採用していま
関心と当事者意識を高めています。今後も、専門団体との長
ます。
す。多様な感性を魅力的な商品づくりにいかし、アーティス
期的なパートナーシップを通じて社会への貢献を果たすと
トに持続的な活躍の場を提供することで、事業を通じた社
ともに、社会課題の解決に向き合う組織風土の醸成につな
会貢献を実践しています。
げていきます。
認定NPO法人 ハビタット・フォー・
ヒューマニティ・ジャパン
エレナ クツァロヴァさま
支援先団体
概要
団体名
ハビタット・フォー・
ヒューマニティ・ジャパン
みらいこども財団
ザン省における貧困世帯への住居建設プロジェクト」に
世界」の実現を目指し、
おいても支援いただきました。劣悪な住環境や衛生設
選定理由・当社の想い
この作品は、柔らかく淡い色彩と
「家」のモチーフが、見る人を穏やかな気持ちにさせて
くれるような魅力的な作品です。暮らしや働き方が多様化し、空間のあり方も進化する
なか、本作に描かれた色とりどりの家々からは、ぬくもりと共に、そこに集う人々のよろ
こびや未来への希望を感じます。この豊かな世界観は、当社の企業理念と深く共鳴する
「存分に生きるを、一緒に。」を理念に、
愛知県にこどもホスピスを設立し、
備の不足という課題に直面する農村部に、安全で耐久
性のある住まいを提供し、住民の生活の安定と安心に、
貢献いただきました。新たな住まいは、健康や教育環
小児緩和ケアの普及活動と
境の改善にもつながっています。
これらの成果は、ハビ
人材育成を実践
タットの理念とサンゲツさまの「やすらぎと希望に満ち
た空間を創造する。」
という想いの共鳴により実現した
児童養護施設で暮らす子どもたちと直接
ふれあい、心のケアに注力。学習・就業
「HERALBONY Art Prize 2026」sangetsu賞
作品名:いえいえ 作家:むろはら まい
フィリピンでの住居建築支援に続き、
「ベトナム・アン
「誰もがきちんとした場所で暮らせる
国内外で住まいに関する支援を実施
愛知こどもホスピス
プロジェクト
VOICE
支援や、施設卒業後のサポートを行う
ものです。今後も継続的なパートナーシップを通じ、
より
多くの人々に変化を届けられることを期待しています。
ベトナム
チャンス・フォー・
チルドレン
経済格差による子どもの教育格差の解消
を目指す。学習や体験活動に利用できる
スタディクーポンを提供
アンザン省における
住宅建設プロジェクト
(支援前後の様子)
ことから、sangetsu賞に選出しました。
48
05 サステナビリティ | 自然資本
自然資本
自然資本に関する考え方
環境負荷の状況
当社の事業活動は、主力商品である壁紙の木材資源使用
当社は、
より良い空間を提供する企業として、環境保全への取り組みを重要な責務と位置付けています。事業活動に伴う環境負
や、化石エネルギー使用など、自然資本と密接に関わっており、
荷の低減はもとより、グループ各社や関係会社と連携し、持続可能な社会の実現に貢献できるよう努めています。商品や見本帳の
自然資本の保全および回復は、非常に重要な課題です。また、
製造に際しては、エネルギーおよび原材料を適切に管理・使用し、壁紙においてはFSC認証木材など持続可能な天然資源の活用
建設業界においても、調達物品の選定にあたり、CO2の排出
を通じて、責任ある調達を推進しています。また、製造から輸送、加工、施工、使用に至る各段階で発生する温室効果ガス(GHG)お
削減や資源循環に貢献する商品を選ぶニーズは日増しに高
よび廃棄物についても、その発生量を最小限とすべく、再生可能エネルギーの導入拡大や、各工程で発生する端材の回収・リサイ
まっています。
このような背景から、当社は自然資本に関するマ
クル体制の構築・強化、さらには環境配慮型商品の開発などにより、環境負荷の緩和を推進しています。
テリアリティを選定し、環境負荷低減に取り組んでいます。具体
的には、環境配慮型商品の開発やサプライチェーン全体の効
環境影響図
率化を通じて、持続可能な地球環境の実現という社会価値と、
INPUT
新たな販売機会の創出や規制対応コスト削減といった経済価
関係会社事業領域
OUTPUT
サンゲツグループ事業領域
値の両立につなげています。
また、自然資本の3つのマテリアリ
ティは相互に影響し合うため、各取り組み間のトレードオフを
回避しつつ、相乗効果を生み出すための統合的な推進が重要
リサイクル
エネルギー
開発・管理部門
商品開発・管理業務
GHG排出
Scope1&2
です。環境問題は、社会にとって喫緊の課題であり、事業活動の
さまざまな点から課題解決に取り組んでいきます。
生産拠点
仕入先メーカー
原材料
製造
自然資本の取り組みと企業価値向上のつながり
マテリアリティ
カーボン
ニュートラルへの
貢献
サーキュラー
エコノミーへの
貢献
ロジスティクスセンター
建築物施工事業者
消費者
輸送・加工
施工
使用
(商品)
廃棄物
埋蔵資源
(化石燃料 etc )
(
自然との共生
製造
見本帳・
サンプル
)
営業部門
顧客/事業主/施主/設計
デザイナー/施工事業者
営業活動
● 適切な環境リスク対応
商品・原材料
資源
商品選定
自然資本
廃棄物
GHG(Scope1&2)
天然資源
(木材 etc )
● 環境配慮型商品の拡大
GHG排出
Scope3
GHG(Scope3)
見本帳リサイクルセンター
● 持続可能な自然資源の活用・自然保護活動
分別
経済価値の創出
社会価値の創出
● 販売機会の創出
● サステイナブルな
● 環境リスク対応コスト削減
地球環境の実現
リサイクル
自然保全
自然資本に関するその他の取り組み|https://www.sangetsu.co.jp/company/sustainability/environment/
49
05 サステナビリティ | 自然資本
自然資本<気候変動>
気候変動に関する考え方
TCFD(気候関連財務情報開示タスクフォース)
シナリオ分析の結果
シナリオ
地球温暖化による気候変動は、人々の生活や自然の生態系
当社では、気候変動による将来への不確実な影響に対応
にさまざまな影響を与えています。その主たる原因である温室
するため、TCFDが提言するシナリオ分析を実施し、
リスクと
効果ガス
(GHG)
を削減することは、企業における社会的責任
機会の特定と財務インパクトを算定しました。
であると考えています。当社では、GHG排出量削減目標として、
2029年度にグループ全体で55%削減(2021年度比)、サン
項
目
内
法規制
1.5℃
容
GHG排出規制
炭素税の拡大によりGHG排出量に応じ
環境に配慮したエシカル消費の拡大によ
を占めており、サプライチェーンを含めたGHG排出量削減の
り、生産時のCO2排出量が高い商品や、
取り組みがより重要です。特に、全体の8割以上を占めるカテ
ズが減少し、売上が減少する
1.5℃
小
55%削減(2021年度比)
サンゲツ単体
カーボンニュートラル
移行
リスク
市
場
仕入先への炭素税導入の影響や、脱炭素
中
各企業のカーボンニュートラル達成に向
成り行き
40,000
施策例
35,000
30,000
25,000
20,000
15,000
10,000
21,634
55%減
省エネ
空調設備更新・車両電動化
創エネ
太陽光発電設備の設置
再エネ
電力証書
再エネ電力メニュー切替
電力証書購入
クレジット
クレジット購入
13,714
(年度)
2021
2029
原材料購入先の複数
さいながらもあると計算された
社化等 の サプ ライ
● 対策の具体例
(太陽光発電の自家消費・自己託送)
大
当社では、中部LCⅡの太陽光発電設備をいかし、自家消
費および自己託送の取り組みを推進しています。中部LCⅡ
で発電された電力は、隣接する中部LCⅠでの自家消費とし
小
て総発電量の約53%、名古屋本社・中部支社での自己託送
として約38%を使用しています。これらの取り組みにより、
供給機能の停止
小
浸水、強風)の激甚化により、納期どおり
物理
リスク
急
性
2025年度にはサンゲツ単体で約10%の電力使用削減を
達成しました。
に商品供給ができなくなる
保有施設の改修・BCP対応コスト増加
中部LCⅡ
● 台風やゲリラ豪雨など自然災害
(洪水や
中部LCⅠ
棄損し、改修するためのコストが増加する
小
● 自然災害の激甚化に備えた保有施設の改
本社・中部支社
総発電量の
約38%
浸水、強風)の激甚化により、保有施設が
自己託送
修や、ある拠点の供給機能が停止した時
に他の拠点でカバーするといったBCP対
応コストが増加する
送電
環境配慮型商品の売上増加
機
会
製
品
生産時のCO2フリー商品のラインアップ
を拡充することで、S c o p e 3 の 削減を目
配電
系統統合自家消費
大
指す顧客 や 環境意識 の 高 い 顧客 からの
5,000
物の災害対策実施、
修・B C P 対応コスト増加 のリスクが 小
将来的に、今回分析したどちらのシナリオが訪れても、適切な対応を取り、持続的
高まり、
オフセットのコストが増加する
目標
● BCP体制の構築(建
り、供給機能 の 停止 や 保有施設 の 改
な成長を実現できるよう、分析結果をもとに導き出した対策を実施していきます。
オフセットのコスト増加
け、
カーボンクレジットや電力証書の需要が
販売拡大
ジメント強化)
仕入コストの増加
商品の開発コスト増加により、仕入コスト
GHG排出削減 ロードマップ(サンゲツグループ)
実績
削減
● 環境配慮型商品の
チェーンのリスクマネ
台風やゲリラ豪雨など自然災害(洪水や
(t-CO2e)
した G H G 排出量 の
● 気温上昇に伴う台風やゲリラ豪雨によ
4℃
が増加する
サンゲツグループ
高い商品の売上損失の影響が大きいこ
きくなると計算された
4℃
使用時 の 省エネ効果 の 低い 商品 のニー
GHG排出量削減目標(Scope1&2)
2029年度目標
● サプライヤーと協働
消費者行動の変化
は目標策定に向けた取り組みを開始しています。
組み促進
化により、生産時・使用時の環境負荷の
とが分かった
財務への影響 ※
コストが増加する
社の事業活動に伴って排出されるGHGはScope3が9割以上
対象範囲
● 省エネ、
創エネの取り
アップ拡充による売上増加の影響が大
る排出量のオフセットにより、目標達成を目指します。
また、当
ゴリ1(購入した製品、サービス)
での排出量削減に向け、
まず
● 炭素税の導入による仕入コストの増加
● 一方、機会は環境配慮型商品のライン
においては、省エネおよび、自社でエネルギーを創出する創エ
ネに注力し、計画的な再生可能エネルギーへの切替と残存す
対策
リスクが大きく、次いで消費者行動の変
リスクと機会
ゲツ単体でカーボンニュートラルを掲げています。Scope1&2
分析結果
受注が増加する
※財務影響(営業利益)の程度:小(10億円未満)、中(10億円以上60億円未満)、大(60億円以上)
総発電量の約53%
TCFD提言に基づく情報開示|
https://www.sangetsu.co.jp/company/sustainability/
environment/climatechange.html
50
05 サステナビリティ | 自然資本
自然資本<サーキュラーエコノミー>
サーキュラーエコノミーに関する考え方
世界的な人口増加を背景とした経済発展や利便性の追
カーテンリサイクル <帝人フロンティアとの協業>
見本帳リサイクル
当社は、帝人フロンティア株式会社と協業し、不要・使用
当社見本帳は、約12,000点にもおよぶ多数の商品を、お
求により、資源消費のスピードが加速するなか、資源枯渇リ
済みのポリエステル製カーテンを新たなカーテンへと再生
客さまにご覧いただくための重要なビジネスツールです。一
スクを軽減するためには、資源循環の取り組みが重要です。
する「水平循環リサイクルシステム」の運用を開始しました。
方、発刊冊数は年間で約150万冊におよんでおり、使用後の
当社は、これまで取り組んできた廃棄物・排出物の削減を
従来、同カーテンの多くは使用後に廃棄されており、当社の
見本帳はさまざまな場所で、
リサイクルされずに廃棄されて
継続しつつ、再生材の利用や、
リサイクルに適した構造・素
販売終了品の余剰在庫においても、焼却に頼らない有効な
います。この環境負荷への対応として、見本帳のリサイクル
材の採用といった環境配慮型商品の提供を拡大し、資源循
活用方法の確立が 課題でした。本取り組みでは、当社が 構
を行っています。2021年3月に設置した「見本帳リサイクル
環の取り組みを強化しています。当社商品の主素材の一つ
築した全国規模のカーテン回収スキームと、同社が有する
センター」では、さまざまな素材が混在している当社見本帳
であるポリ塩化ビニル(塩ビ)は、優れた加工性・耐久性・経
高度なケミカルリサイクル技術を融合することにより、回収
を分別し、マテリアルリサイクルを通じた資源循環を行って
済性を併せ持つ素材として、建築業界で広く使用されていま
した自社製ポリエステル100%のカーテン等を再生原料化
います。今後も、関連事業者との連携によるリサイクルに加
すが、複合的な素材として活用されていることによって、
リサ
し、新たなカーテンとして商品化しました。本商品は、2026
え、お客さまのニーズに合わせた見本帳の発行の適正化を
イクルが困難な状況となっています。塩ビのリサイクル化は
年春発刊の見本帳「2026-2029 AC」に収録しました。今
図り、
ライフサイクル全体での環境負荷低減を推進します。
当社だけでなく業界全体の課題であり、素材メーカーやリサ
後も商品のライフサイクル全体で環境負荷低減を実現し、
イクル事業者と連携した取り組みを推進していきます。
循環型社会に貢献します。
使用済み見本帳の
リサイクル冊数(2025年度)
リサイクル
事業廃棄物におけるリサイクル実績および目標(連結)
回収
マテリアル・ケミカルリサイクル
(t)
12,000
11,317
有価物
サーマル処理
約 10 万冊
30 万冊
単純焼却、埋め立て等
年間発刊数
11,058
150万冊
10,000
8,000
見本帳リサイクルフロー図
17.6%
6,000
30.2%
サーマル処理を削減し、
マテリアル・ケミカル
4,000
0
42.7%
28.6%
(年度)
2025
サン ゲツ見本帳
リサイクルを拡大
2,000
見本帳
再資源化
有効利用
塩ビ商品チップ
再生塩ビ
床バッキング
遮音シート
表紙・台紙・小冊子
再生紙
紙製品
取手・プラ類
再生プラ
プラスチック
製品
サンプルつき台紙
セメント
建築材料
部材
2029
51
0
05 サステナビリティ | 自然資本
自然資本<自然との共生&環境配慮型商品>
自然との共生に関する考え方
森林保全活動支援
環境配慮型商品と新たな取り組み
当社の事業活動は、主要商品である壁紙の原材料の一つ
サンゲツグループ長期ビジョン【DESIGN 2030】に掲げ
気候変動を中心とする環境問題への対応がグローバルな
(裏打ち紙)として森林資源を利用するなど、自然の恵みを
る「地球環境を守るサステイナブルな社会の実現」に向け、
課題となるなか、消費者が商品選択の軸に「環境配慮」を据
享受している一方、廃棄物や水の使用により、環境へ負荷を
2023年度より森林保全活動支援を開始し、森林保全と地
える流れは、当社の属する建設・インテリア市場においても
与えています。自然の恵みなくしては当社の事業を継続する
域社会への貢献を進めています。2025年度には、事業活動
顕著です。こうしたニーズに応えるため、当社は環境配慮型
ことはできないため、事業による環境負荷を通じて、生物多
と環境保全を結び付ける取り組みとして、対象となる木目調
商品の開発・販売に注力しています。商品の環境性能に関す
様性の損失を食い止め回復軌道に乗せる、ネイチャーポジ
壁装材の販売数量に連動して森林保全活動へ寄付を行う
る情報の可視化を推進するほか、CASBEEやLEED等で加
ティブへの貢献を目指しています。また、事業活動以外でも、
新たな仕組みを構築しました。この結果、初年度の実績とし
点対象となる商品を拡充し、環境対応を強化するお客さま
事業所周辺の生態調査やNPO法人と連携した活動を進め
て、約370万円を適切な森林管理を通じた保全活動(FSC
の課題解決をサポートします。
ており、事業活動と自然共生の両立を目指しています。
ジャパン)に寄付しました。
FSC 認証壁紙
【ハイブリッドフローリング】
VOICE
®
FSC ®ジャパン
当社は、持続可能な社会の実現に向け、調達面での環境
負荷低減を目的に 、国内初 の F S C ® 認証 ※ の 塩ビ壁紙 の 採
®
事務局長
西原智昭さま
2026年9月発売
優れた意匠性と耐久性を備え、製造
段階から環境負荷低減を追求した
持続可能な床材です。基材の木質部
には製材時の副産物などの再生材
用・販売を推進しています。国内壁装材の主流である塩ビ壁
持続可能な森林資源の利用を社会へ広げるためには、
を100%使用しているほか、接着剤
紙でFSC ® 認証を取得したことは、壁紙業界における、原材
最終製品を提供する企業が市場をけん引することが重要
を抑えています。ラミネートフローリ
料調達の環境負荷低減に向けた第一歩であると捉えてい
です。
サンゲツさまが国内初となるFSC®認証塩ビ壁紙を採
ング分野で世界初となるEUエコラ
ます。販売開始以来、着実に普及が進み、2025年度には当
用され、
認証製品のラインアップを着実に拡充していること
ラベルを取得しており、L E E D 認証
社の取り扱う FSC ® 認証壁紙の比率は21.5%に達していま
は、
壁紙業界のサプライチェーン全体に持続可能な調達へ
における点数獲得にも貢献します。
す。今後も、FSC ® 認証商品のラインアップ拡充に加え、環境
の意識を広げ、
市場変革を後押しする大きな力となります。
に配慮した商品の開発・提供をさらに強化し、持続可能な社
また、木目調商品の販売を通じた森林保全活動への寄付
(FSC®N004634)
会の実現に貢献します。
は、
自然の美しさから得た価値を自然へ還元する循環を、
お
客さまとともに実現する意義深い仕組みです。
この寄付は
国内のFSC®認証林の管理支援に活用されます。企業と現
塩化ビニル樹脂層(表面)
FSC ® 認証裏打紙(施工面)
壁紙断面図
※Forest Stewardship Council®が運営する国際的な森林認証制度で、責任ある森林管理
を広めることで、生物多様性を守り、森林破壊や気候変動に立ち向かうための仕組みです。
場がつながり、
気候変動対策や生物多様性保全といった森
林管理の意義について相互理解を深めることが、
日本の森
林を健全な状態で未来へ引き継ぐ力になります。
今後もサ
ンゲツさまが、
責任ある調達と森林保全への参画を通じ、
持
続可能な社会の実現をリードされることを期待しています。
不要の施工方法で有害物質の排出
ベルをはじめ、各種国際基準のエコ
【アートフラワー】
2026年5月発売
見本帳 の 切り替えに 伴う廃番カー
テンや椅子生地、壁紙を、新たな価
値を持つ造花へとアップサイクルし
た商品です。株式会社スペディーレ
の「 L o v é c o 」との 連携 により誕生
しました 。幅広いインテリア商品を
取り扱う当社 ならでは の 強 みをい
かし、多様 な 色柄 や 異素材を 組 み
合わせることで、空間に美しく調和
するアイテムへと再生しています。
FSC®WEBサイト|https://www.fsc.org
52
06
ガバナンス
役員紹介
こん どう
や す まさ
近藤康正
代表取締役社長執行役員
う
だ がわ
けんいち
宇田川憲一
社外取締役(監査等委員)
1986年
4月三菱商事株式会社入社
2004年
6月東ソー株式会社取締役
2010年
4月三菱商事プラスチック株式会社(出向)執行役員
2008年
6月同社常務取締役
2013年
4月三菱商事株式会社合成樹脂部長兼塩化ビニール部長
2009年
6月同社代表取締役社長
2016年
4月同社化学品グループ事業投資担当
2016年
3月同社取締役相談役
2017年
4月中央化学株式会社常務執行役員
2018年
6月同社名誉顧問
2018年
4月同社代表取締役社長社長執行役員
2019年
6月同社名誉顧問退任
2022年 12月株式会社サンゲツ入社執行役員社長室担当
2019年
6月当社社外取締役(監査等委員) 現在に至る
2023年
4月執行役員管理担当兼 サイバーセキュリティ担当
2023年
6月取締役執行役員管理担当兼 サイバーセキュリティ担当
2023年
7月取締役常務執行役員 コーポレート部門ゼネラルマネージャー
兼 スペースプランニング部門担当兼 サイバーセキュリティ担当
2024年
4月代表取締役社長執行役員
2026年
4月代表取締役社長執行役員
兼海外事業部門ゼネラルマネージャー
現在に至る
所有する当社株式数 30,184(2026年3月末時点)
まつ お
ゆたか
松尾豊
社外取締役(監査等委員)
2005年
6月清水建設株式会社執行役員
2010年
6月同社常務執行役員
2013年
4月同社専務執行役員
2014年
6月同社代表取締役副社長
2020年
6月同社常任顧問
2021年
6月同社常任顧問退任
2021年
6月当社社外取締役(監査等委員) 現在に至る
おおがね
あ
き
大鐘亜樹
4月株式会社サンゲツ入社
2018年
4月北関東支社長
2020年
4月関西支社長
2023年
7月執行役員事業部門西日本ビジネスユニットマネージャー 兼関西支社長
2024年
4月執行役員 ロジスティクス部門ゼネラルマネージャー
2025年
4月執行役員事業部門ゼネラルマネージャー
兼 エクステリア事業担当兼空間総合事業担当
6月取締役執行役員事業部門ゼネラルマネージャー
兼 エクステリア事業担当兼空間総合事業担当
2026年
おさむ
取締役常務執行役員
1990年
2025年
てら だ
寺田修
4月取締役常務執行役員
事業部門ゼネラルマネージャー
社外取締役(監査等委員)
1987年
4月株式会社住友銀行入行
2010年
4月大和ネットバンク設立準備株式会社(出向)内部監査部長
2011年
4月株式会社大和ネクスト銀行取締役
2012年
3月同行取締役退任
2012年
3月株式会社三井住友銀行監査部上席考査役
2019年
3月同行退職
2021年
9月株式会社OMA取締役
2023年
6月同社取締役退任
2024年
6月当社社外取締役(監査等委員) 現在に至る
兼 エクステリア事業担当兼経営戦略担当現在に至る
所有する当社株式数 11,888(2026年3月末時点)
はま だ
みち よ
浜田道代
社外取締役(監査等委員)
み
ね
よう す け
美根陽介
取締役(常勤監査等委員)
1984年
4月株式会社サンゲツ入社
2014年
7月中国四国支社長
2016年
4月執行役員中国四国支社長
1985年
4月名古屋大学法学部教授
2017年
4月執行役員 ロジスティクス本部副本部長
1999年
4月名古屋大学大学院法学研究科教授
2019年
4月執行役員 ロジスティクス本部長
2008年
4月名古屋大学法科大学院長
2023年
7月常務執行役員 ロジスティクス部門ゼネラルマネージャー
2009年
4月名古屋大学名誉教授
2024年
4月常務執行役員 ロジスティクス部門担当
2024年
6月取締役常勤監査等委員
現在に至る
公正取引委員会委員
2015年
6月当社社外取締役(監査等委員) 現在に至る
現在に至る
所有する当社株式数 18,700(2026年3月末時点)
53
06 ガバナンス | コーポレートガバナンス
コーポレートガバナンス
スキルマトリックス
取締役および監査等委員に期待する経験・知見については、経営の基本スキルに加え、当社の事業に即した専門性および成長に必要なスキルをベースとして、スキルマトリックスを策定しています。
取締役
取締役に期待する経験・知見
参加会議体(●:議長)
性別
●男性
●女性
在任
年数
●
3年
●
1年
●
●
11年
●
●
7年
●
●
5年
●
●
●
2年
●
●
2年
●
社外
独立
氏名
代表取締役社長執行役員
近藤康正
取締役常務執行役員
松尾豊
社外取締役(監査等委員)
浜田道代
社外取締役(監査等委員)
宇田川憲一
社外取締役(監査等委員)
寺田修
社外取締役(監査等委員)
大鐘亜樹
取締役(常勤監査等委員)
美根陽介
取締役会
監査等
委員会
指名報酬
委員会
●
経営の基本となる経験・知見
企業経営
財務・会計
法務・
リスクマネジメント
●
●
●
●
●
●
人材戦略
●
DX・IT
営業・
マーケティング
サプライチェーン
マネジメント
グローバル
事業
ビジネスモデルの
革新・変革
業界知識
●
●
●
●
●
●
100%
(13/13回)
●
●
●
●
100%
(10/10回)
開発・品質
●
●
●
●
●
●
●
●
●
●
●
●
●
●
●
●
●
●
100%
(13/13回)
●
100%
(13/13回)
●
●
100%
(13/13回)
●
●
100%
(13/13回)
●
100%
(13/13回)
●
取締役に求められるスキルに関する考え方
スキル名
取締役会
出席状況
当社事業に即した専門性および成長に必要な経験・知見
サステナビリティ・
ESG
役員構成比率
必要性の理由
スキル名
必要性の理由
企業経営
持続的成長と中長期的な企業価値向上を実現するため、企業トップとしての経営に関
する豊富な知見・経験を持つ取締役が必要である。
業界知識
主力のインテリア事業の一段の基盤強化に加え、その強みをいかして事業領域・事業規
模の拡大を果たすために、素材、建設等を含めバリューチェーン全体に関する豊富な知
見・経験を持つ取締役が必要である。
財務・会計
財務戦略ならびに会計処理等について実効性高く監督し、各種財務判断の信頼性を向
上するため、財務および会計に関する豊富な知見・経験を持つ取締役が必要である。
開発・品質
イノベーティブな商品開発・デザイン、安全・安心を担保する品質の提供は、事業継続・拡
大の重要要素であり、開発・品質に関する豊富な知見・経験を持つ取締役が必要である。
社内・社外比率
2019年6月〜
社外取締役比率
57%
(4名/7名)
法務・
リスクマネジメント
企業活動の根幹となる誠実で透明性の高い法令遵守体制ならびにリスクマネジメント
体制を構築するためには、法務・コンプライアンスおよびリスク管理に関する豊富な知
見・経験を持つ取締役が必要である。
営業・
マーケティング
マーケットインの視点で質の高いソリューション提供を行うためには、国内外の市場環
境および顧客・取引先などのステークホルダーとの関係に精通し、営業戦略の策定や
実行に関する豊富な知見・経験を持つ取締役が必要である。
人材戦略
成長戦略推進の原動力は「人材」であり、人的資本の価値を最大化するための人材戦略
に関する豊富な知見・経験を持つ取締役が必要である。
サプライチェーン
マネジメント
多様な市場・顧客ニーズにきめ細かく対応し、多品種の商品を提供する事業モデルに
おいて、最適なサプライチェーンマネジメントが不可欠であり、その専門的な知見・経験
を持つ取締役が必要である。
DX・IT
事業環境の変化に適切に対応し、競争力の強化や新たな価値の創出を果たすために
は、デジタル技術の戦略的活用が必須であり、DXおよびITに関する豊富な知見・経験
を持つ取締役が必要である。
グローバル事業
市場規模の大きい海外市場において当社のビジネスモデルを展開し、成長を取り込む
ことは不可欠であり、グローバル事業に関する豊富な知見・経験を持つ取締役が必要で
ある。
サステナビリティ・
ESG
持続可能な循環型社会の実現に向けて、環境・社会課題に適切に対応し、企業として持
続的に成長するため、サステナビリティおよびESGに関する豊富な知見・経験を持つ取
締役が必要である。
ビジネスモデルの
革新・変革
インテリア事業をコアとして持続的な成長を果たすために、事業領域の拡大、新規事業
の創出を加速する必要がある。革新・変革に向けた多面的かつ広範な知見・経験ならび
にマインドを持つ取締役が必要である。
ダイバーシティの推進
2025年6月〜
女性取締役比率
29%
(2名/7名)
54
06 ガバナンス | コーポレートガバナンス
コーポレートガバナンスに関する考え方
コーポレートガバナンス体制
当社は、急速に変化する事業環境において長期的に企業価
これまで当社は、2021年6月に改訂されたコーポレートガ
取締役会の構成は、2019年度より執行役員を兼務する取
値の向上を図るため、多岐にわたるステークホルダーと良好
バナンス・コードの全原則をコンプライ
(実施)
しており、その状
締役を2名、監査等委員を兼務する取締役を5名とし、独立性・
な関係を築き、持続的に発展していくことを目指しています。そ
況をコーポレートガバナンス報告書にて開示しています。さら
客観性 の ある取締役会 の 監督をより強化するた め 、経営 の
の実現のため、経営の独立性・客観性・透明性を基盤とした、
ガ
に、2026年7月に改訂された同コードについても、現在その内
「監督」と
「執行」を分離したガバナンス体制・経営執行体制を
バナンス体制の整備や、さまざまな施策の実行により、コーポ
容および当社体制への適合状況を精査しており、各原則への
導入しています。これにより、業務執行に対する監査・監督機
レートガバナンスの強化を行っています。2015年には、社外取
対応方針を反映した最新のコーポレートガバナンス報告書を
能の強化に加えて、株主の皆さまの視点に立った議論の活発
締役の経営参加による取締役会の監査・監督機能を強化する
速やかに開示する予定です。
化を図っています。また、通常再任されることの多い会計監査
ことをねらいとして、監査等委員会設置会社へ移行しました。
人の在任期間を、より高い独立性と適正な外部監査の確保・
「コーポレートガバナンス報告書」は
継続を目的に、原則最長10年と定め、経営の透明性を強化す
こちらからご覧ください。
る体制を整えています。
https://www.sangetsu.co.jp/company/sustainability/
governance/corporate̲governance.html
ガバナンス体制強化の変遷
2015
2025
(年)
コーポレートガバナンス体制図
2015年
監査等委員会設置会社へ移行
監督と執行の分離
(
監督機能の強化、
機動的な業務遂行
)
株主総会
2016年
執行役員制度導入
選任・解任
選任・解任
2019年
経営の監督と執行を分離した
取締役会7名(社外取締役4名、社内取締役3名)
ESG委員会
コンプライアンス
委員会
指名報酬委員会へ名称変更
2021年
役員報酬制度の開示を開始
業務執行の監督
執行部門
代表取締役
社長執行役員
事業戦略会議
各部門・国内外
グループ会社
内部
監査
連携
執行役員
内部統制システム
内部監査部門
2022年
グループ会社管理支援体制として関係部門に
支援担当を配置
事業課題
検討会議
監査等委員会
(5名:社外4名、
社内1名)
経営
会議
2017年
グループ会社管理に主管部
責任制を導入
グループ
ガバナンスの強化
リスク管理委員会
指名報酬委員会
会計監査人
取締役の
指名・報酬に
関する仕組みの
整備
報告
監査等委員会監査
ガバナンス体制への移行
2018年
指名報酬諮問委員会から
選任・解任
監査等
委員会室
会計監査・内部統制監査
2025年
執行役員を連結経営担当に選任
55
06 ガバナンス | コーポレートガバナンス
取締役会
取締役会実効性評価
当社の取締役会では、法律上定められた案件および会社として重要
取締役会としての判断、監督、会議の運営などについて、
な意思決定が必要な案件に関する決議、経営戦略に関する議論等を
取締役会の実効性の担保に努めるべく、年1回、各取締役が
行っています。業務執行決定の全部または一部を代表取締役に一任し
取締役会に対する自己評価を行い、そのうえで取締役会全
ていますが、委任された事項についても、取締役会ではその実施状況
体の実効性の分析・評価を実施しています。評価項目は、取
をモニタリングしています。取締役会は、7名の取締役(独立社外取締
締役会の構成から議論内容の質やステークホルダーとの対
役:4名、社内取締役:3名)
で構成し、毎月1回以上開催しています。
話まで多岐にわたります。
この定期的な評価プロセスを通じ
プロセス
5月
上旬
前年度の
改善の取り組み
さらなる改善の取り組みへ
5月
下旬
6月
2025年度は個別案件の付議を絞り込む一方で、中期経営計画の
て現状の強みと課題を客観的に把握し、継続的な改善に向
策定に関わる経営戦略・事業戦略について集中的に討議を行い、中長
けたPDCAサイクルを回すことで、実効性の高いモニタリン
□ 取締役会報告
期的な企業価値向上に向けた議論を深めました。
グ体制の構築と監督機能のさらなる高度化に努めています。
□ 今後の課題や方策について共有
2025年度
実施要領
取締役会での主な審議テーマ・付議報告件数
テーマ
付議報告件数(件)
2024年度
2025年度
経営戦略・事業戦略
4
12
ガバナンス・リスクマネジメント・内部統制
19
18
決算・財務
16
16
組織・人事
11
14
連結経営
8
8
成長投資
9
10
個別案件
11
4
取締役会における主な審議内容
テーマ
①対象者に対するアンケートを実施
②アンケート結果を集約
③取締役会において課題を共有し、今後の方策を検討
評価
項目
● 取締役会の役割・責務
● 取締役会の運営
● 取締役会の構成
● 社外取締役の役割に関する評価
● 指名報酬委員会に関する評価
(指名報酬委員のみ)
2025年5月に実施した評価では、当社の取締役会は全体として実効性をもって機能していることが確認されました。
さらなる改善に向けて認識した課題に対しては、下記のとおり対応しました。
テーマ
取締役会の運営
会、
コンプライアンス委員会)の活動状況やコンプライアンスサーベイ結果、
課題
実施事項
中長期的な経営戦略および事業戦略に関する、継続的かつ
次期中期経営計画の検討にあたり、取締役会においても前
深掘りされた議論の充実
広に活発な意見交換を行う機会を拡充
個別議論にとどまらない、建設的かつ体系的な議論のさら
取締役会事務局による、資料の早期配信、資料の質と量の
なる活性化
改善、および議事録取りまとめの早期化
サイバーセキュリティに関する取り組み等について報告・議論し、当社グ
ループにおける内部統制活動の状況およびリスクマネジメントの運用状況
2026年5月に実施した評価では、当社の取締役会は全体として実効性をもって機能していることが確認されました。
の適切性および実効性について評価・監督を行いました。
さらなる改善に向けて認識した主な課題および対応計画は下記のとおりです。
次期中期経営計画の策定に先立ち、中期経営計画【BX 2025】の振り返り、
成長戦略の源泉となる強みと課題、当社が目指す企業像の再定義等につい
ての議論を行い、大きく変化する事業環境の下、執行部門が策定する計画の
妥当性や実効性について多角的な視点から検証・監督を行いました。
テーマ
中長期戦略・重要テーマに
関する議論の深化
成長戦略の実行に向けた組織改編、経営執行体制に関する議論とともに、
組織体制および
人事制度改革
実施
方法
□ アンケート結果を集約
評価結果および対応
実施事項
内部統制システムに関する基本方針や内部統制活動状況、当社が認識して
次期中期経営
計画の策定
全取締役(7名)
取締役会の役割・責務
いる個別リスクに対応することを目的とした各種委員会(リスク管理委員
内部統制と
リスク管理
対象者
□ 取締役へのアンケート
多様な人材が能力を最大限に発揮するためのエリア限定総合職の導入、
お
よび「変革と挑戦」
「イノベーションの創出」の実現に向けた人材育成の取り
ステークホルダー視点の
組み、評価制度の改定について、中長期的な企業価値向上の観点から妥当
さらなる取込み
性を審議しました。
課題
対応計画
中期経営計画の策定プロセスに一部課題を残した。また、
中期経営計画の定期進捗報告の実施、オフサイトミーティ
成長戦略や中長期的な会社のあるべき姿についての議論
ング等の開催を通じた自由闊達な議論の時間確保と風土
をさらに深める必要がある。
醸成に取り組む。
社外取締役による会社の業務理解は進んだ一方で、少数株
株主総会や説明会における質疑、メディア・SNS等の多様
主をはじめとするステークホルダーの意見や期待をより的
なチャネルを通じて、社外取締役による一層の情報収集と
確に把握することが求められている。
経営へのフィードバックに努める。
56
06 ガバナンス | コーポレートガバナンス
監査等委員会
指名報酬委員会
監査等委員会は、独立社外取締役4名に常勤の社内取締役
1名を加えた5名の監査等委員で構成しています。内部統制シ
監査等委員長メッセージ
指名報酬委員会は、監査等委員である独立社外取締役全
員と代表取締役社長執行役員で構成されています。
社外取締役(監査等委員)
宇田川憲一
ステムを活用した監査を中心としつつ、委員自ら国内外の拠点
当委員会は、最高経営責任者、取締役および執行役員の
往査も実施しています。
また、社長との定期的な意見交換会、執
選解任について、十分な時間と資源をかけて審議するととも
行役員や社員からの報告会、会計監査人からの報告会、関係会
に、後継者候補の育成計画の監督を行っています。客観性、
新たにスタートした「中期経営計画 2029」は、現状の課題解
社監査役連絡会等の実施により、有益な情報を入手・共有する
透明性および適時性を確保しながら、必要な資質を備えた
析から将来の計画に至るまで十分な網羅性があり、非常に説得
ことで、
監査等委員会としての監査の実効性を高めています。
候補者を選んで、取締役会に提案します。最高経営責任者が
力のある内容に仕上がっていると評価しています。一方で、戦略
その職務を十分に果たしていないと認められる場合には、
投資や新規事業の創出に向けた施策を、
より具体的に提示でき
適時に解任を取締役会に提案します。
2025年度の主な検討事項
● 監査等方針および計画策定
当委員会はまた、執行役員の業績評価、役員報酬制度の
● 監査等委員会監査報告の策定
● 会計監査人の評価
(相当性判断) ● 会計監査人の監査報酬額への同意
● 経営監査部の監査活動レビュー
● 監査等方針に基づく往査ヒアリングによるモニタリングレビュー
● グループ会社等の現況報告、課題抽出など
あり方および 報酬水準 の 妥当性等について審議していま
出席率
ており、その内容を透明性をもって取締役会に提案・説明し
資基準」
にこれまで以上に注目して審議・判断を行っていきます。
同時に、既に投資を実行した案件のなかで、計画どおりに収益
が上がっていないものに対する
「撤退基準」の適用と判断につい
テーマ
● 取締役会構成に関する検討
回数
サンゲツ執行役員
重要会議
への出席
往査の
実施
取締役会以外に 、事業
課題検討会議や経営会
議など執行の意思決定
に寄与する重要会議へ
参加し、必要な意見を述
べています。
各現場の生の情報を得
るため、現地往査を実施
しています。
おいては、従来どおり常勤監査等委員を中心とした現場往査等
● 取締役候補者の検討
を実施しますが、そこで得られた気づきや意見を業務執行側へ
● 成長戦略に基づく新組織体制と人事の検討
内容
経営執行
執行役員、部長、グルー
責任者との プ会社幹部との対話の
機会を設けています。
対話
ても、厳格に注視していく方針です。日々のモニタリング活動に
2025年度の主な審議事項
100%
監査等委員会の主な活動状況
サンゲツ部長
29回
グループ会社幹部
21回
事業課題検討
会議
33回
経営会議
11回
サンゲツ
52回
国内グループ会社
18回
海外グループ会社
8回
計58回
しっかりと報告し、今まで以上に議論を深めてまいります。
● 中長期的な執行役員および幹部社員候補の検討
● 執行役員の定年に関する検討
8回
こうした認識のもと、監査等委員会としては、今後提案される
であろう新規事業、特に投資案件については、その「定量的な投
2025年度の監査等委員会開催実績
14回
の成長ポテンシャルをさらに明確に訴求できたのではないかと
いう思いもあります。
す。役員報酬については、具体的な報酬額についても審議し
ています。
開催回数
れば、投資家をはじめステークホルダーの皆さまに対して、当社
● 執行役員の評価および規定の見直し
13回
出席率
いう、高い独立性を備えた構成となっています。
しかし、その恵ま
れた体制を活かし切り、社内外の役員が率直かつ活発な議論を
2025年度の指名報酬委員会開催実績
開催回数
当社の取締役会は、社内取締役3名に対し社外取締役4名と
100%
交わす真に実効性の高い場にしていくには、
まだ努力の余地が
残されていると客観的に評価しています。
近年のコーポレートガバナンス・コード改訂が示すとおり、企
計44回
業には従来の「守りのガバナンス」から
「攻めのガバナンス」への
転換が求められています。それは「しっかりと脇を固めながら、果
敢にリスクを取っていく」
という非常に難易度の高い経営です。
私は監査等委員長として、各案件の「リスクの定量化」に目を
光らせるとともに、社外取締役の立場からは「そのリスクと投資
計78回
効果のバランス」を冷静に見極め、サンゲツの持続的な企業価
値向上を力強く後押ししてまいります。
57
06 ガバナンス | コーポレートガバナンス
業績・株主価値と連動した透明性の高い報酬制度
当社の役員報酬は下記の3つの報酬で構成されており、業績・株主価値と連動した透明性の高い報酬制度を運用しています。
-
基本報酬※
-
譲渡制限付株式報酬
-
業績連動報酬
各人の当該年度の実績および事業への貢献に対する指名報酬委員会の評価結果に基づき、取締役会で決定
単年度ベースでの資本効率(ROE)の向上を目的に支給しており、
株主の皆さまと価値共有を進めること、
および企業価値の持続的な向上を図るインセンティブを
※ 取締役のうち執行役員を兼務しない者および監査等委員である取締役の報酬は、基本報酬のみとします。
連結当期純利益を連動指標として決定
明確にすることを目的に、現在の中期経営計画期間に適用される株式数を決定
【グラフ1】各役位別乗率(報酬別)
(算定式)基本報酬=標準基本報酬×貢献評価倍率×各役位別乗率
● 標準基本報酬=15,600
(千円)/年
基本報酬
(乗数)
● 貢献評価倍率=当該年度の貢献度評価に応じて0.85〜1.25で決定
4.5
● 各執行役員役位別乗率
(基本報酬)(グラフ1参照)
● 取締役
(監査等委員である取締役を除く。)のうち執行役員を兼務しない者および監査等委員である取締役においては、職責等に応じて個別
4.0
4.0
譲渡制限付株式報酬
に支給額を決定しています。
3.5
● 固定報酬は在任中に毎月支給しています。
(算定式)業績連動報酬=執行役員1人当たりのベース単価×各役位別乗率
業績連動報酬
● 執行役員1人当たりのベース単価 (表1参照) ● 各執行役員役位別乗率
(業績連動報酬)(グラフ1参照)
● 業績連動報酬は事業年度終了後の株主総会翌日に年1回支給しています。
● 連結当期純利益が一定の基準を下回った場合は不支給となります。
3.0
3.0
2.5
2.5
1.9
2.0
1.6
1.6
基本報酬
1.5
(算定式)譲渡制限付株式報酬(株数)=執行役員標準株数×各役位別乗率
0
30
50
等を条件として譲渡制限を解除するものとします。
● 付与数は役位に応じて決定するものとし、
在任中に付与しています。
0.0
【表1】 1人当たりのベース単価
1.36
社長執行役員
0.5
1.0
専務執行役員
● 譲渡制限期間は割当てを受けた日より30年間とし、
取締役または執行役員のいずれの地位からも任期満了もしくは正当な理由により退任
1.0
常務執行役員
株式報酬
● 各執行役員役位別乗率
(譲渡制限付株式報酬)(グラフ1参照)
執行役員
譲渡制限付
● 執行役員標準株数=1,600株
100(指数)
2025年度の当社取締役に対する報酬等の内容
連結当期純利益(ROE)※
ベース単価(X=連結当期純利益)
50億円以下(ROE5.0%以下)
0円
50億円超〜100億円以下(ROE5.0%超〜10.0%以下)
(X−50億円)×0.17%
100億円超〜140億円以下(ROE10.0%超〜14.0%以下) (100億円−50億円)×0.17%+(X−100億円)×0.14%
2.2
業績連動報酬
2.0
(百万円未満四捨五入)
報酬等の種類別の総額(百万円)
対象となる
役員の
譲渡制限付
員数(人)※2
株式報酬 ※1
役員区分
報酬等の
総額
(百万円)
固定報酬
業績連動
報酬
取締役
(監査等委員を除く。)
(社外取締役を除く。)
137
51
59
27
3
取締役(監査等委員)
(社外取締役を除く。)
23
23
ー
ー
1
社外取締役
47
47
ー
ー
4
140億円超〜180億円以下(ROE14.0%超〜18.0%以下) (100億円−50億円)×0.17%+(140億円−100億円)×0.14%+(X−140億円)×0.10%
※ 自己資本=1,000億円をベースに各ROEにて基準となる各連結当期純利益を計算
※1 譲渡制限付株式報酬の金額は当連結会計年度の費用計上額を記載しています。
※2 上記には、当事業年度中に退任した取締役(監査等委員を除く)1名を含んでいます。なお、当事業年度末現在の人
数は、取締役(監査等委員を除く)2名および取締役(監査等委員)5名です。
58
06 ガバナンス | コーポレートガバナンス
サクセッションプラン
執行役員制度の考え方
社外取締役メッセージ
当社では、取締役会が経営理念や具体的な経営戦略を踏
当社グループのさらなる成長とコーポレートガバナンス
まえ、最高経営責任者(CEO)等の後継者育成計画とその運
体制の強化に向け、執行役員制度を導入しています。経営の
用状況について監督するとともに、人格・人望、見識、業務遂
意思決定および監督機能と業務執行機能を分離することに
行能力、経営的視点、および経営参画意識等の基準に照ら
より、執行責任を明確化するとともに、業務遂行の迅速化を
し、議論を進めています。
図っています。
指名報酬委員会は取締役および執行役員の指名に関し、
CEOなどの後継者プラン(後継計画、要求される資質、候補
者選定などのステップを含む)やCEO後継者の選任に至っ
た経緯・背景、CEO解任の提案およびそれに至る経緯・背景
占める体制のもと、高い水準で実効性が確保されていると評
氏名
近藤康正
価しています。現場往査を通じて監査等委員と社員が直接対
役職
社長執行役員
兼海外事業部門ゼネラルマネージャー
させていることがその理由です。
さらなる実効性向上に向けた
常務執行役員事業部門ゼネラルマネージャー
松尾豊
育成に関しては、将来有望な人材プールとしてリーダー養成研修や上
級管理職(執行役員候補)研修といった社内の選抜制度等を活用して
牧繁伸
山下栄二
います。また、執行役員や幹部社員候補の検討においても、社外取締
役が取締役会以外の重要会議に参加したり、幹部社員を対象とした
兼 エクステリア事業担当
将来の経営に関する個別面談を実施したりすること等を通じて、後継
ける議論に役立てています。
● CEOに求められる要件・資質の適宜見直し
宇都和久
● 中長期的な執行役員や幹部社員候補の検討
● 一定の時間軸のなかで、
後継者の育成状況を確認する機会の多様化
る新体制のスタート時期であり、
この2年間で組織の意識は大
きく変化しました。特に2025年の中期経営計画の策定プロ
セスを通じて、経営陣だけでなく現場の社員からも、主体的に
組織のあり方を模索する姿勢を強く感じました。そうした「良
兼 サイバーセキュリティ担当
兼事業企画担当
兼次世代事業創生担当
● CEOの中長期サクセッションプランの検討
私が就任した2024年6月は、代表取締役社長の近藤によ
兼連結経営担当
執行役員事業部門東京支社長
作本明彦
課題についても、経営陣と率直に議論し合える関係性は、サン
ゲツのガバナンスにおける大きな強みであると考えています。
執行役員 コーポレート部門ゼネラルマネージャー
兼 サプライチェーンマネジメント担当
候補者の資質を直接把握する機会を多く設け、指名報酬委員会にお
後継者育成に関する重要事項
執行役員商品統括部門ゼネラルマネージャー
執行役員 DX部門ゼネラルマネージャー
柴垣香平
話する機会が豊富にあること、それらを踏まえて我々が提示す
る意見を業務執行側が真摯に受けとめ、建設的な議論に発展
兼経営戦略担当
後継者の育成について
大鐘亜樹
当社のコーポレートガバナンスは、社外取締役が過半数を
執行体制(2026年7月1日現在)
等について審議し、必要に応じ取締役会に説明・提案を行う
こととしています。
社外取締役(監査等委員)
執行役員 コーポレート部門財務経理部長
兼投融資担当
内藤孝二
執行役員 ロジスティクス部門ゼネラルマネージャー
上大迫一
執行役員空間総合事業担当
い意味での危機感」
を組織全体で共有できるようになったこと
は、当社にとって非常に前向きな変化だと捉えています。
サンゲツは、目指す姿として
「素材とデザインを起点に、
イン
テリアから文化をつくる企業」を掲げています。私は金融機関
に長年勤務した後、大学院で
「文化経営学」の学位を取得しま
した。金融機関で培った財務や監査、DX等の経験に加えて、
この「文化」に関する知見も当社の成長に活かしていく考えで
す。常に社会の動向や人々の関心にアンテナを張り、自身の
アップデートにも努めてまいります。株主の皆さまの信任を受
けた取締役および監査等委員として、
リスクの指摘や不適切
な事象の防止、改善状況のフォローといった役割を確実に果
たしていくことは言うまでもありません。
しかし、それは会社の
歩みに闇雲にブレーキをかける後ろ向きなものであってはな
りません。適切にリスクをコントロールしながら、進むべき方向
性をともに考え、
サンゲツのさらなる変革と挑戦、
イノベーショ
ンの創出に力強く貢献してまいります。
59
06 ガバナンス | コンプライアンス
コンプライアンス
コンプライアンスに関する考え方
当社は、
コンプライアンスを、企業としての絶対的命題と位
コンプライアンス教育
ヘルプラインの設置
年間のコンプライアンス計画に基づき、
「法令」
と
「実務」の
当社は、コンプライアンスに関する問題やリスクの早期発
置付け、重要な経営方針の一つとしてサンゲツグループ全体
両軸から教育プログラムを実施し、
サンゲツグループ全体での
見・是正を目的にヘルプラインを設置し、コンプライアンス体
での強化を図っています。当社では、
「サンゲツグループ企業倫
コンプライアンス意識と知識の向上を図っています。
また、取適
制の充実を図っています。当社のヘルプラインは、監査等委員
理憲章」
および「サンゲツグループコンプライアンス行動規範」
法をはじめとする、事業に大きく影響する法令改正への対応を
への通報を含めた社内の通報窓口だけでなく、外部弁護士に
を、
トップメッセージとともに
「Corporate Philosophy Hand-
テーマとした教育プログラムを「重要法令管理制度」
と連動さ
通報できる社外窓口も設置しており、電話やメールでの通報
book」
として配布し、全従業員が高い倫理観を持って誠実に行
せています。
これにより、習得した知識を実務に落とし込み、継
を受け付けています。いずれも匿名通報が選択でき、
プライバ
動するための指針としています。
また、従来から運用している重
続的な改善を図るPDCAサイクルを回すことで、
コンプライアン
シー保護の徹底と、通報者への差別的処遇等の報復行為を
要法令管理制度については、
四半期ごとの遵法状況の確認を行
スの実務・徹底につなげています。
禁止しています。サンゲツと国内グループ会社で勤務する全
うとともに、
コンプライアンスサーベイ実施後のフォローアップ
の充実と改善支援による、
体制のさらなる強化を図っています。
区分
コンプライアンス推進体制
対象
サンゲツ
単体
当社では、社長を最高責任者とするコンプライアンス委員
テーマ別
研修
会を設置しています。当委員会は、四半期に1回開催してお
り、年間のコンプライアンス・プログラム策定や、進捗確認、
見直し指示、その他コンプライアンス推進に関する重要課題
を審議しています。これらの活動状況は、半年に1回取締役
会で報告され、経営層はコンプライアンス状況を把握し、コ
社員(正社員、契約社員、嘱託社員、パート・アルバイト、派遣
教育プログラム
階層別
研修
テーマ・研修名称
景品表示法
対外発信内容に関する注意点などの解説
ハラスメント
管理職に求められるハラスメント防止の知識と対応
建設業法
業務に必要な法的要件などの解説
取適法/フリーランス法
サンゲツ
コンプライアンス研修
グループ
サンゲツ
単体
内容(学習項目・目的)
員が利用でき、社内イントラサイトや「Corporate Philosophy Handbook」
で周知をしています。ヘルプラインでは、法
法令改正に伴う実務上の留意点と対応の解説
令および社内規定等の違反を対象としており、通報があった
グループ全体におけるコンプライアンス意識の醸成
ものは全件調査し、その結果に応じて是正措置等を講じます。
知的財産権
特許権、意匠権、著作権等に関する基礎知識
キャリア研修
業務の前提となるコンプライアンスおよび知的財産の基礎
新入社員研修
業務の前提となるコンプライアンスおよび知的財産の基礎
新任管理職向け研修
管理職として必要なコンプライアンスおよび知的財産
グループ会社のコンプライアンス強化
ンプライアンス意識のさらなる向上につなげています。
コンプライアンス体制の強化に向け、国内・海外を問わず
体制図
社員およびこれら社員のなかで1年以内の退職者を含む)
・役
ヘルプライン窓口体制
ハラスメント
コンプライアンス
社内
人事部
社内
担当執行役員
法務部
社外
法律事務所
監査等委員
グループ会社と密接なコミュニケーションを図り、連携を強
取締役会
最高責任者
化しています。法務部などの関係部署が、各グループ会社へ
社長
の訪問やWEB会議を通じて、グループが抱えるリスクや課
コンプライアンス担当執行役員
コンプライアンス窓口
ハラスメント窓口
題を抽出し、その解決を支援しています。また、
「 サンゲツグ
2021年度
1件
4件
拡大コンプライアンス委員会
ループ企業倫理憲章」および「サンゲツグループコンプライ
2022年度
4件
2件
アンス行動規範」の浸透を図るため、教育研修の実施や、個
2023年度
2件
9件
2024年度
3件
11件
2025年度
2件
12件
全取締役
コンプライアンス委員会
ハラスメント対策委員会
● 社長
(委員長)● 常勤監査等委員
● 人事担当執行役員
(委員長)
別事案・相談を通じた協議・是正を推進しています。これに
● 部門ゼネラルマネージャー
● 人事部事務局
加え、グループ全体において、贈収賄や競争法をはじめとす
● コンプライアンス担当執行役員
● 経営監査部長 ● 人事部長 ● 法務部事務局
コンプライアンス推進責任者
● 職場代表者
る重要領域の対応体制を強化するなど、ルール遵守体制の
継続的な改善と是正体制の構築に努めています。
ヘルプラインの通報件数
● 2021年度から2025年度のヘルプライン通報において重大な法令違反は
ありませんでした。
● 通報があったものは全案件について調査します。
※匿名通報者からの通報で、詳細な情報提供がないものは除く
60
06 ガバナンス | リスクマネジメント
リスクマネジメント
リスクマネジメントに関する考え方
リスクマップ
当社は、多様なリスクに対し、適切かつスピード感のある対応を行うことで、企業価値の最大化と経営や業務への影響の最小化
を図っています。
大
重点リスク項目
品質・施工問題、サプライチェーンの寸断
情報セキュリティ・システム障害、
リスク管理体制
人材不足・生産性の低下
影響度
当社では、社長を最高責任者とするリスク管理委員会を設置
体制図
し、当社グループ全体の企業価値の維持・向上に努め、
リスク発
海外事業リスク
事業部門空間総合事業部
海外事業部門
事業部門
経営戦略室
商品統括部門
ロジスティクス部門
事業リスク︵空間総合事業︶
事業リスク
︵インテリア・エクステリア事業 ︶
サプライチェーンリスク
小
小
リスクアセスメントの実施
Action
● 効果検証を反映した
重点リスク
改善対策を実行
Check
継続的な
改善活動
Plan
安定供給が
産効率の高い設備導入によるサプライチェーンの強
靭化
● 仕入先に対する工場実査やCSRアンケートの継続的
な実施による、精緻な調達管理体制の構築
できないリスク
●「サイバーセキュリティ統括室」
および「CSIRT」
(セキュ
システム障害が
発生するリスク
リティ事故対応チーム)の設置を通じた、
グループ全
体のインシデント管理体制の構築
● SOC
(Security Operations Center)
との連携や重
要システムの二重化、
クラウド環境への移行によるIT
基盤の強化
● 全従業員に向けたセキュリティ教育および継続的な実
践訓練プログラムの実施による組織的対応力の向上
● 経営戦略と連動した人事施策に基づく、
経営人材・グ
対策計画の実行
ローバル人材・高度専門人材の着実な採用と育成
必要な人材を
確保・維持できない
リスク
Do
拡充を通じたバックアップ体制の整備
● グループ会社であるクレアネイトの新工場稼働や生
● 重点リスクへの対策を計画
● 重点リスクに対する対策活動を実施
● リスク管理委員会にて
対応方針
安定調達・
重点リスクを抽出
応じたリスクの見直し
大
● 主要商品の十分な在庫確保および代替生産体制の
● リスクの特定・分析および評価を行い
● 事業を取り巻く環境変化に
発生の可能性
2026年度に特定した重点リスクおよび対応方針(抜粋)
重大な情報漏洩や
改善活動の実施
対策状況の共有(四半期ごと)
● 重点リスク対策の効果検証
● 重点リスクのモニタリング
● 取締役会への活動状況報告
(半期毎)
リスク管理責任部署
各支社・グループ会社
リスク管理のPDCA
リスクの評価と検証
DX部門
クを明確にしています。
コーポレート部門法務部
グによる評価を行ったうえで、重点的に対策を推進していくリス
コーポレート部門
財務経理部
いた各リスク管理部会では、予測されるリスクを抽出し、マッピン
コーポレート部門人事部
視・対応すべきリスクの洗い出しを行っています。委員会に紐づ
主管部署
は顕在化していないものまで、さまざまな観点から、継続的に注
コーポレート部門総務部
体制を構築しています。既に一部顕在化しているリスクから、今
IT
・セキュリティリスク
層は存在するリスクを的確に把握したうえで、経営判断ができる
ガバナンス・法務
コン プライアンスリスク
財務リスク
人事リスク
災害・感染症
事故等リスク
機能を有します。活動状況を半年に1回取締役会に報告し、経営
主要なリスク項目
リスク管理事務局(総務部)
リスク管理部会
を定めるとともに、必要に応じてタスクフォースを編成する等の
リスク管理委員会
リスク管理委員会
イクルを通じたマネジメントを行っています。当委員会は四半期
に1回開催しており、
リスク管理全体の基本方針および体制等
等
取締役会
生時の影響を最小化するとともに、当社の活動や社員に対して
影響をおよぼす可能性があるさまざまなリスクに対し、PDCAサ
自然災害
● DE&Iの深化、
多様な働き方の拡充、健康経営の推進
による
「能力を最大限発揮し挑戦し続けられる職場環
境」の整備
● 各組織への人事担当配置やエンゲージメントサーベ
イの活用、各種人的資本KPIのモニタリングを通じた
組織課題の改善
61
07
データセクション
10年間の連結財務サマリー
(単位:百万円、年度)
経営成績
2016
2017
2018
2019
2020
2021
135,640
156,390
160,422
161,265
145,316
135,703
139,528
139,856
142,336
131,659
‐
17,151
20,920
19,804
売上総利益
40,104
47,572
50,720
販売費及び一般管理費
32,532
42,538
営業利益
7,572
親会社株主に帰属する当期純利益
売上高
国内 ※2
海外
キャッシュフローの
状況
フリー・キャッシュ・フロー
1株当たり情報 ※3
経営指標
2023
2024
2025
149,481
176,022
189,859
200,378
206,441
135,444
155,988
165,619
170,597
171,416
15,034
15,930
21,670
24,292
29,794
35,029
52,925
47,640
39,962
56,374
58,959
62,373
64,729
44,824
43,656
40,938
32,002
36,094
39,856
44,232
45,321
5,033
5,895
9,268
6,701
7,959
20,280
19,103
18,140
19,408
6,570
4,514
3,579
1,432
4,780
276
14,005
14,291
12,550
14,642
▲12,320
1,463
14,019
8,788
7,095
4,890
16,964
10,971
12,387
9,695
営業活動によるキャッシュ・フロー
10,072
7,196
10,370
13,804
9,694
5,718
17,373
12,818
19,260
14,320
投資活動によるキャッシュ・フロー
▲22,392
▲5,732
3,649
▲5,016
▲2,599
▲827
▲408
▲1,846
▲6,873
▲4,625
財務活動によるキャッシュ・フロー
7,533
▲4,831
▲7,196
▲5,476
▲11,836
▲13,341
▲9,355
▲11,249
▲3,980
▲8,261
23,199
19,856
26,613
29,922
25,124
16,886
24,765
24,717
33,445
35,010
総資産額
169,344
171,419
170,875
164,101
158,665
147,943
164,454
170,750
183,923
188,907
純資産額
110,458
106,360
100,143
94,217
93,749
88,326
95,825
106,709
113,810
122,259
有利子負債
14,188
18,761
20,915
20,803
16,145
10,097
10,455
7,484
12,785
14,532
97.53
68.97
57.28
23.56
78.97
4.66
238.71
243.44
213.60
249.08
1株当たり純資産(円)
1,646.42
1,648.71
1,612.59
1,539.56
1,547.92
1,497.21
1,631.57
1,816.16
1,922.98
2,067.46
1株当たり配当金(円)
52.50
55.50
56.50
57.50
58.00
70.00
105.00
140.00
150.00
155.00
売上高営業利益率(%)
5.6
3.2
3.7
5.7
4.6
5.3
11.5
10.1
9.1
9.4
総資産経常利益率(ROA)
( %)
5.4
3.3
3.9
5.9
4.4
5.4
13.2
11.8
10.5
10.8
自己資本当期純利益率(ROE)
( %)
6.0
4.2
3.5
1.5
5.1
0.3
15.3
14.1
11.4
12.5
投下資本利益率(ROIC)
( %)※4
5.5
3.6
4.5
7.9
5.6
7.1
16.5
14.8
13.6
13.7
自己資本比率(%)
65.2
61.4
58.0
56.8
58.8
59.4
58.2
62.5
61.4
64.3
連結配当性向(%)
53.6
79.5
97.9
243.4
73.3
1,494.0
44.0
57.5
70.2
62.2
3.2
3.4
3.5
3.6
3.8
4.6
6.7
8.1
8.0
7.8
88.3
83.8
76.0
72.4
68.9
76.5
77.1
71.5
72.0
79.4
売上債権回転期間(日)
125.1
113.8
114.9
106.5
110.9
115.2
110.4
108.6
102.3
99.4
棚卸資産回転期間(日)
44.0
45.7
49.9
52.4
52.5
49.6
57.9
53.9
53.5
50.6
仕入債務回転期間(日)
80.8
75.7
88.8
86.5
94.5
88.3
91.2
91.0
83.8
70.6
現金及び現金同等物
財務状態
2022
※1
1株当たり当期純利益(円)
連結純資産配当率(%)
キャッシュ・コンバージョン・サイクル(日)
※1 2021年度期首より、
「収益認識に関する会計基準」等を適用しており、
これ以降の各数値については、当該会計基準等を適用した後の数値となっています。 ※2 国内:国内インテリア、国内エクステリアセグメントの単純合算・消去前数値(2022年度以前においては照明器具セグメント、
スペースクリエーションセグメントも含む)
※3 2015年4月1日付で普通株式1株につき2株の割合で株式分割を行っています。1株当たり指標は、現在の基準に調整し記載しています。 ※4 ROIC=税引後営業利益÷(運転資本+有形固定資産+無形固定資産)
62
07 データセクション | ESGデータ集
05 データセクション
ESGデータ集
指
環
境
標
2020年度
2021年度
2022年度
2023年度
2025年度目標
2025年度
30,477
29,679
26,836
23,629
21,634
21,943(2029年度 13,714)
GHG排出量(Scope1&2)
t-CO2e
6,233
5,992
5,668
4,871
4,060
2,706
3,247(2029年度カーボンニュートラル)
エネルギー使用量※連結
GJ
495,641
532,410
588,235
580,869
559,768
557,636
511,114
エネルギー使用量
GJ
141,259
133,264
129,067
121,626
117,339
114,931
139,262
再生可能エネルギー使用比率※連結
%
0
0
0
21.2
39.0
62.5
60%
再生可能エネルギー使用比率
%
0
0
0
25.1
45.1
72.3
60%
リサイクル率※連結
%
64.5
65.7
64.6
63.1
64.1
63.1
70%
見本帳リサイクル冊数
冊
15,344
62,915
77,262
119,604
54,844
102,591
100,000
持続可能な森林からの調達率
%
21.5%
8%
社員数(各年3月31日時点)※連結
人
2,359
2,453
2,547
2,645
3,001
3,299
社員数(各年3月31日時点)
人
1,185
1,194
1,197
1,238
1,298
1,345
人
733/452
742/452
744/453
775/463
805/493
820/525
男性/女性
歳
37.0
36.8
37.1
37.3
37.6
37.6
歳
39.2/33.3
38.7/33.8
38.7/34.4
38.9/34.7
39.0/35.1
39.1/35.3
年
15.8
15.6
15.7
15.3
15.1
15.0
男性/女性
年
18.1/11.8
17.6/12.2
17.5/12.8
16.9/12.8
16.5/12.8
16.3/12.9
新規採用者
人
79
74
70
102
102
79
男性/女性
人
47/32
44/30
46/24
64/38
62/40
44/35
平均勤続年数(各年3月31日時点)
%
15.7
23.0
9.1
14.0
1.6
1.7
%
9.5/25.0
21.1/26.1
5.9/14.3
7.7/20.8
2.9/0.0
3.6/0.0
中途社員採用比率
%
12.7
18.9
25.7
48.0
38.2
27.8
女性管理職比率※2
%
17.2
17.9
18.3
21.3
22.6
24.2
男女別賃金格差
%
76.4
79.5
80.9
81.6
82.5
82.1
入社3年未満離職率※1
男性/女性
25%
100
100
100
100%
19.0
11.9
20.1
50.5
89.7
62.2
100千円
30.3
25.6
30時間
2,003
1,980
男性育児休業2週間以上取得率※3
%
正社員一人当たりの教育研修にかかる費用
千円
正社員一人当たりの教育研修にかかる時間
時間
25.0
8.3
10.0
11.2
平均総労働時間
時間
1,999
2,054
2,030
2,048
有給休暇平均取得日数(前年度10月〜当年度9月末)
日
12.5
10.9
11.9
12.7
13.5
12.7
障がい者雇用率(各年3月31日時点)
%
3.2
3.4
3.9
3.5
3.2
3.7
4.0%
53.7
57.7
59.4
58.0
0
0.77
1.8
エンゲージメントスコア
労働災害度数率※4
%
0.84
0
1.63
労働災害強度率※5
%
0.003
0.002
0
0.02
0.004
2.269
社会貢献活動費※連結
千円
5,033
6,187
24,192
43,985
32,234
40,246
年間経常利益の0.3〜0.5%を目途とし、
寄付は特定の団体に継続的に実施する
児童養護施設等のリフォーム支援件数※連結
件
20
33
55
59
55
47
50件
人
7
7
7
7
7
7/
2026年度
うち社外取締役
人
4
4
4
4
4
4/
2026年度
うち女性取締役
人
1
1
1
1
3
2/
2026年度
社外取締役比率
%
57
57
57
57
57
57/
2026年度
重要法令違反件数
件
0
0
0
0
0
取締役(各年6月30日時点)
ガバナンス
2024年度
28,071
平均年齢(各年3月31日時点)
会
位
t-CO2e
男性/女性
社
単
GHG排出量(Scope1&2)※連結
※1 入社3年未満離職率は、2024年度は2024、2025年度の2年間、2025年度は1年間の入社社員離職率になります。 ※2 2025年度の数値は2026年4月1日時点。過去データも同様に算出
パートタイマー等の直接雇用労働者を含む)」に拡大・変更しています。
7
4
2
57
0
※3 子が1歳になるまでの取得予定を含む。※4、5 2025年度より、集計対象を「常用労働者(正社員に加えて、契約社員、
63
07 データセクション | 会社概要・株式情報
会社概要・株式情報
● 会社概要(2026年3月31日現在)
● 事業所(2026年3月31日現在)
● 株式情報(2026年3月31日現在)
社
名株式会社サンゲツ(Sangetsu Corporation)
本
社名古屋
発行可能株式総数 290,000,000株
設
立 1953年4月21日(創業嘉永2年※1849年)
支
社北海道、東北、北関東、東京、西関東、中部、関西、中国四国、
九州
発行済株式の総数 59,200,000株
代表者名代表取締役社長執行役員近藤康正
本社所在地 〒451-8575
資
本
年
社
愛知県名古屋市西区幅下1-4-1
金 136億1,610万円
商 2,064億円(連結)
員
数 3,299名(連結)
事業内容 インテリアの企画・開発・製造・販売・施工
エクステリアの販売・施工
各種施設・オフィス空間等の企画・設計・工事監理・施工
上場証券取引所東京証券取引所 プライム市場、
名古屋証券取引所 プレミア市場(証券コード:8130)
支店 / 北東北、福島、群馬、栃木、新潟、茨城、長野、東関東、多摩、
営業所厚木、岐阜、岡崎、静岡、北陸、京都、神戸、東大阪、南大阪、
岡山、四国、北九州、熊本、南九州
主
要株式会社サングリーン、
フェアトーン株式会社、
グループ会社株式会社サンゲツヴォーヌ、株式会社サンゲツ沖縄、
クレアネイト株式会社、株式会社クロス企画、
株式会社SDS、
KOROSEAL INTERIOR PRODUCTS HOLDINGS, INC.、
Goodrich Global Holdings Pte. Ltd.、
GOODRICH GLOBAL LIMITED、
D'Perception Pte Ltd
200
150
サンゲツ
主
数 67,792名(うち単元株主数 30,895名)
● 株主構成比率(2026年3月31日現在)
金融商品取引業者
自己株式
1.84%
0.70%
その他の法人
個人・その他
10.53%
42.87%
金融機関
外国法人等
● 株価・出来高の推移 ※2021年4月1日の終値データを100とした配当込みの株価指数の推移
250
株
14.56%
29.50%
TOPIX
1年
3年累計
5年累計
サンゲツ
株主総利回り
110.0%
154.0%
221.2%
TOPIX(配当込み)
134.6%
187.4%
202.2%
● 大株主の状況 (2026年3月31日現在)
株主名
持株数(株)
持株比率(%)
日本マスタートラスト
信託銀行株式会社(信託口)
8,785,300
14.94
株式会社日本カストディ銀行(信託口)
3,113,500
5.29
日比喜雄
1,708,588
2.90
三輪雅恵
1,699,228
2.89
サンゲツ共栄会
1,682,180
2.86
日比東三
1,659,492
2.82
株式会社大垣共立銀行
1,438,372
2.44
150
株式会社日本カストディ銀行
(金銭信託課税口)
1,170,000
1.99
100
日比麻友美
1,160,734
1.97
50
STATE STREET BANK AND TRUST
COMPANY 505001
1,009,518
1.71
100
50
0
2021/4
2022/4
2023/4
2024/4
2025/4
2026/4
● 売買代金
(月次)
(億円)
200
0
2021/4
2022/4
2023/4
2024/4
2025/4
2026/4
(注)当社は、
自己株式を408,298株保有しており、持株比率は自己株式を控除して
算出しております。
64
07 データセクション | 株主・投資家との対話、外部評価
株主・投資家との対話、外部評価
株主・投資家との対話
外部評価
当社は、中長期的な企業価値向上を目指し、株主や機関投資家、アナリストの皆さまとの対話
ESGインデックスなどへの組み入れ状況
による信頼関係の構築を目指しています。
こうした対話を通じて得たご意見は、経営へのフィード
バックを通じて、情報開示の拡充および企業価値向上に向けた経営戦略につなげています。なお、
● FTSE JPX Blossom Japan Index
株主・投資家との対話の主なテーマや経営へのフィードバック状況の詳細は以下をご覧ください。
● FTSE JPX Blossom Japan Sector Relative Index
有価証券報告書(P.69)|https://ssl4.eir-parts.net/doc/8130/yuho̲pdf/S100YA8B/00.pdf
● MSCI日本株ESGセレクト・リーダーズ指数
2025年度
● S&P/JPX カーボン・エフィシェント指数
対話状況
内容
対応者
参加者
回数
代表取締役社長執行役員、
取締役、社外取締役(監査等
株主総会
株主
1回
委員)、執行役員
取締役、社外取締役(監査等
株主(主に個人株主)
1回
委員)、執行役員
決算・経営戦略説明会
スモールミーティング
代表取締役社長執行役員、
執行役員ほか
代表取締役社長執行役員
執行役員ほか
アナリスト・機関投資家
2回
アナリスト・機関投資家
1回
アナリスト・機関投資家・株主
93回
株主構成の推移
2022
2023
2024
2025
株主数(人)
金融機関
所有株式数(単元)
(銀行、生保、損保等)
所有割合(%)
34
180,200
30.46%
30
160,120
27.09%
30
171,182
29.08%
29
173,106
29.50%
株主数(人)
所有株式数(単元)
所有割合(%)
29
16,796
2.83%
27
13,131
2.22%
26
14,734
2.50%
29
10,806
1.84%
その他の法人
株主数(人)
所有株式数(単元)
所有割合(%)
216
74,203
12.54%
257
76,774
12.99%
341
72,097
12.24%
397
61,743
10.53%
外国法人等
株主数(人)
所有株式数(単元)
所有割合(%)
201
106,432
17.99%
204
117,271
19.84%
214
99,262
16.86%
226
85,409
14.56%
株主数(人)
所有株式数(単元)
所有割合(%)
4,736
213,818
36.15%
9,710
223,555
37.83%
19,734
231,310
39.29%
30,214
255,533
43.57%
株主数(人)
5,216
591,449
100%
10,228
590,851
100%
20,345
588,585
100%
30,895
586,597
100%
金融商品取引業者
個人、その他
(自己株式含む)
合計
当社のMSCIインデックスへの組み入れ、およびMSCIロゴ、商標、サービスマーク、またはインデックス名を使
用することは、MSCIまたはその関連会社による当社の後援、推奨、またはプロモーションではありません。MSCI
会社の商標またはサービスマークです。
DE&I、従業員の健康管理への評価
※各年度3月末時点
所有者別状況
(証券会社等)
● JPX日経インデックス400
インデックスは、MSCIの独占的財産です。MSCIおよびMSCIインデックスの名前とロゴは、MSCIまたはその関連
代表取締役社長執行役員、
IR・SR面談
● Morningstar Japan ex-REIT Gender Diversity Tilt Index
● JPX日経中小型株指数
代表取締役社長執行役員、
会社説明会
● MSCI日本株女性活躍指数
(WIN)
発行株式残高(単元)
割合(%)
健康経営優良法人2026(大規模法人部門)
2025年度 work with Pride PRIDE指標 ゴールド認定
IR活動への評価
2025年度全上場企業ホームページ
充実度ランキング最優秀賞
GomezIR
サイトランキング2025銀賞
“共感!”IR賞
※2024年度受賞
65
〒451-8575
愛知県名古屋市西区幅下1-4-1
������������������
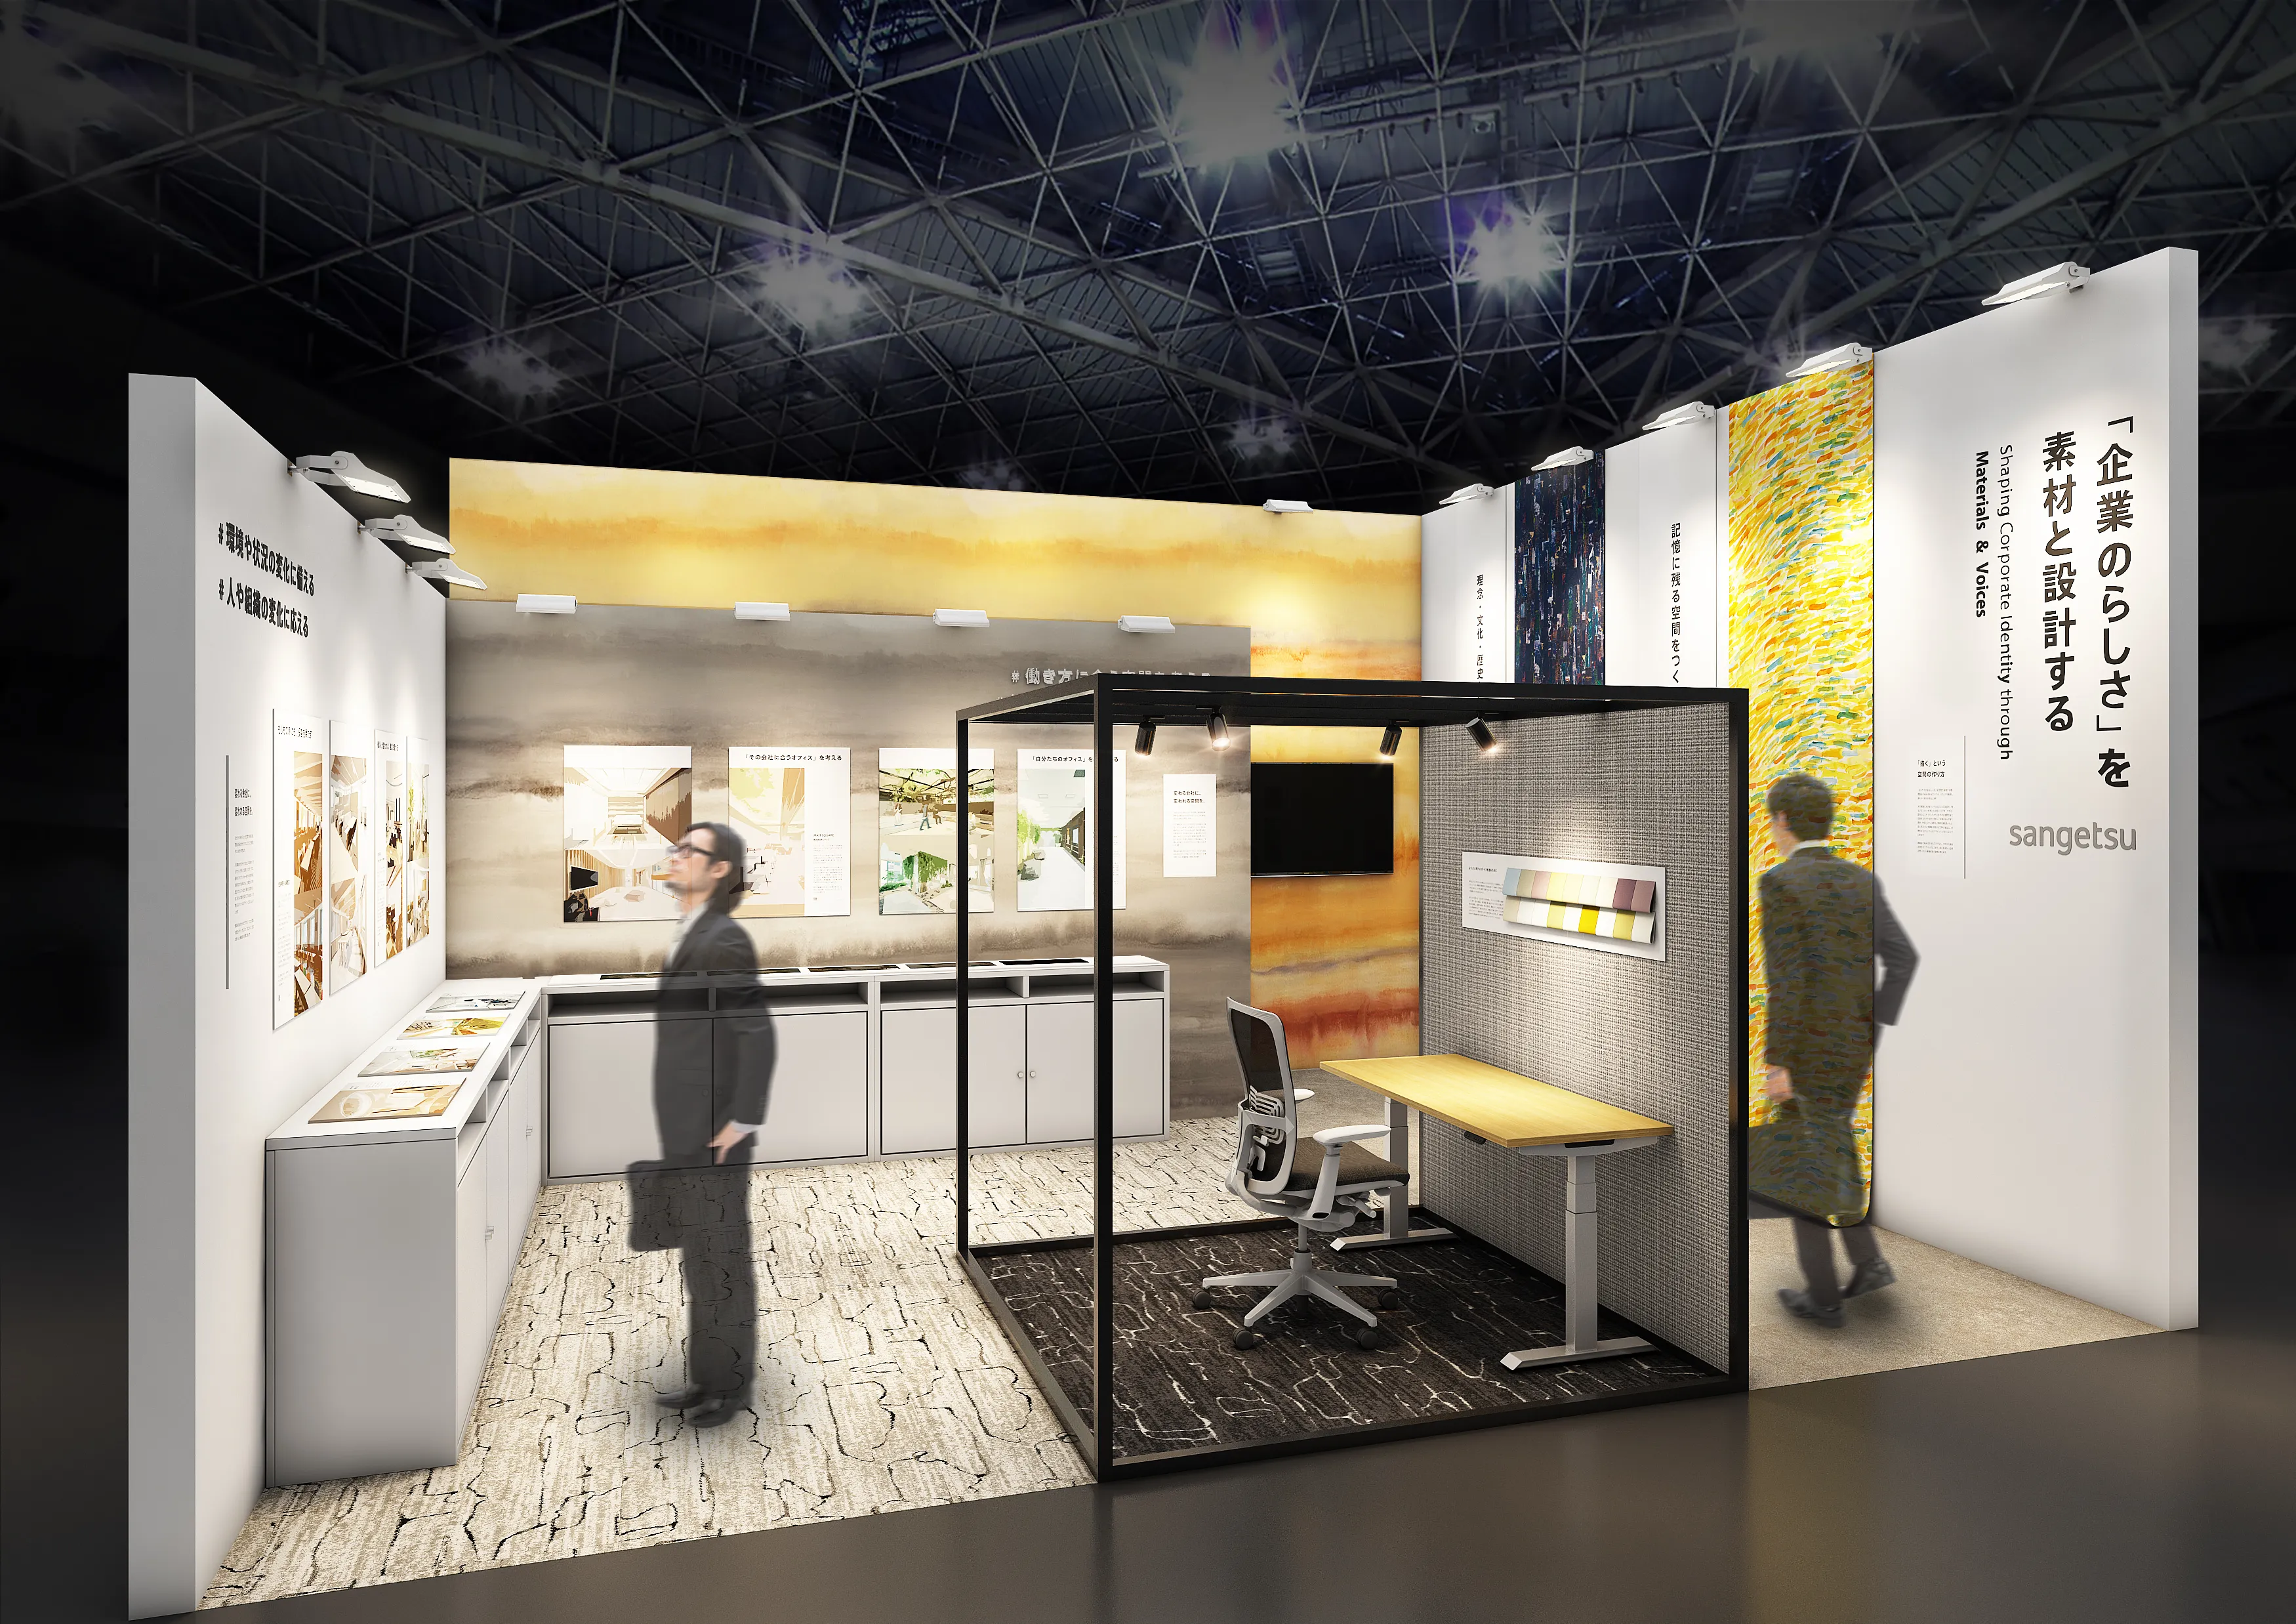
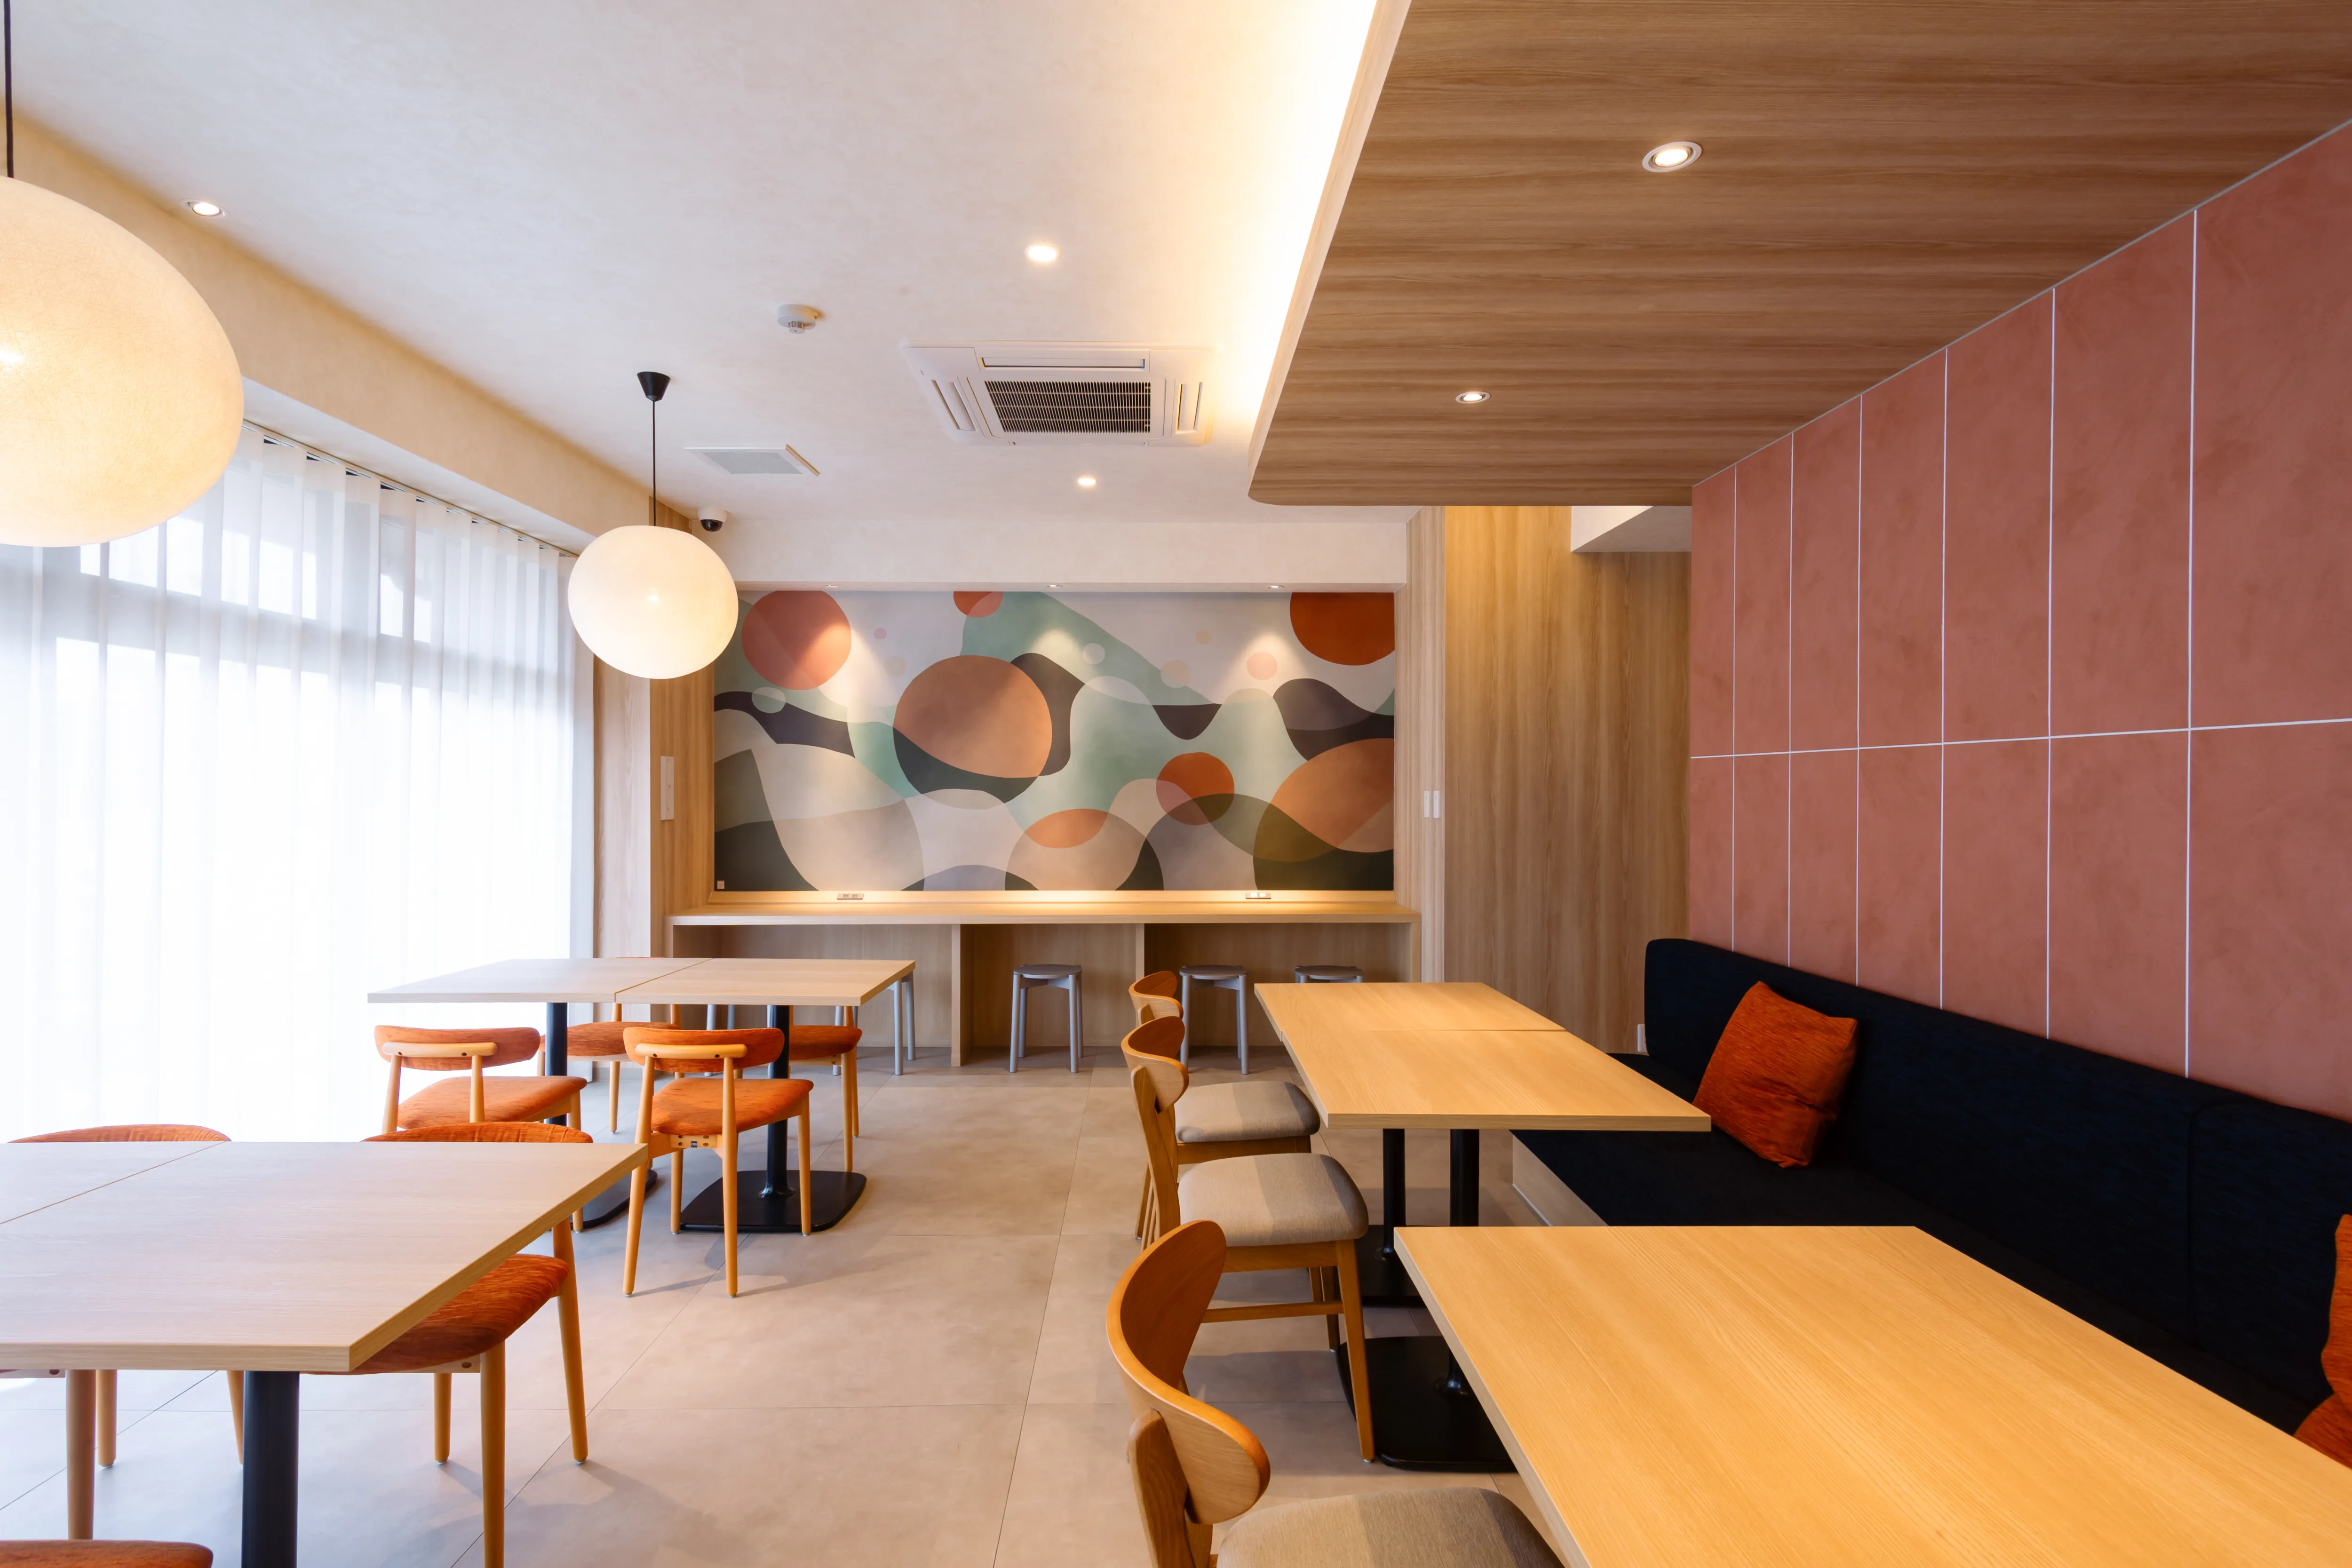
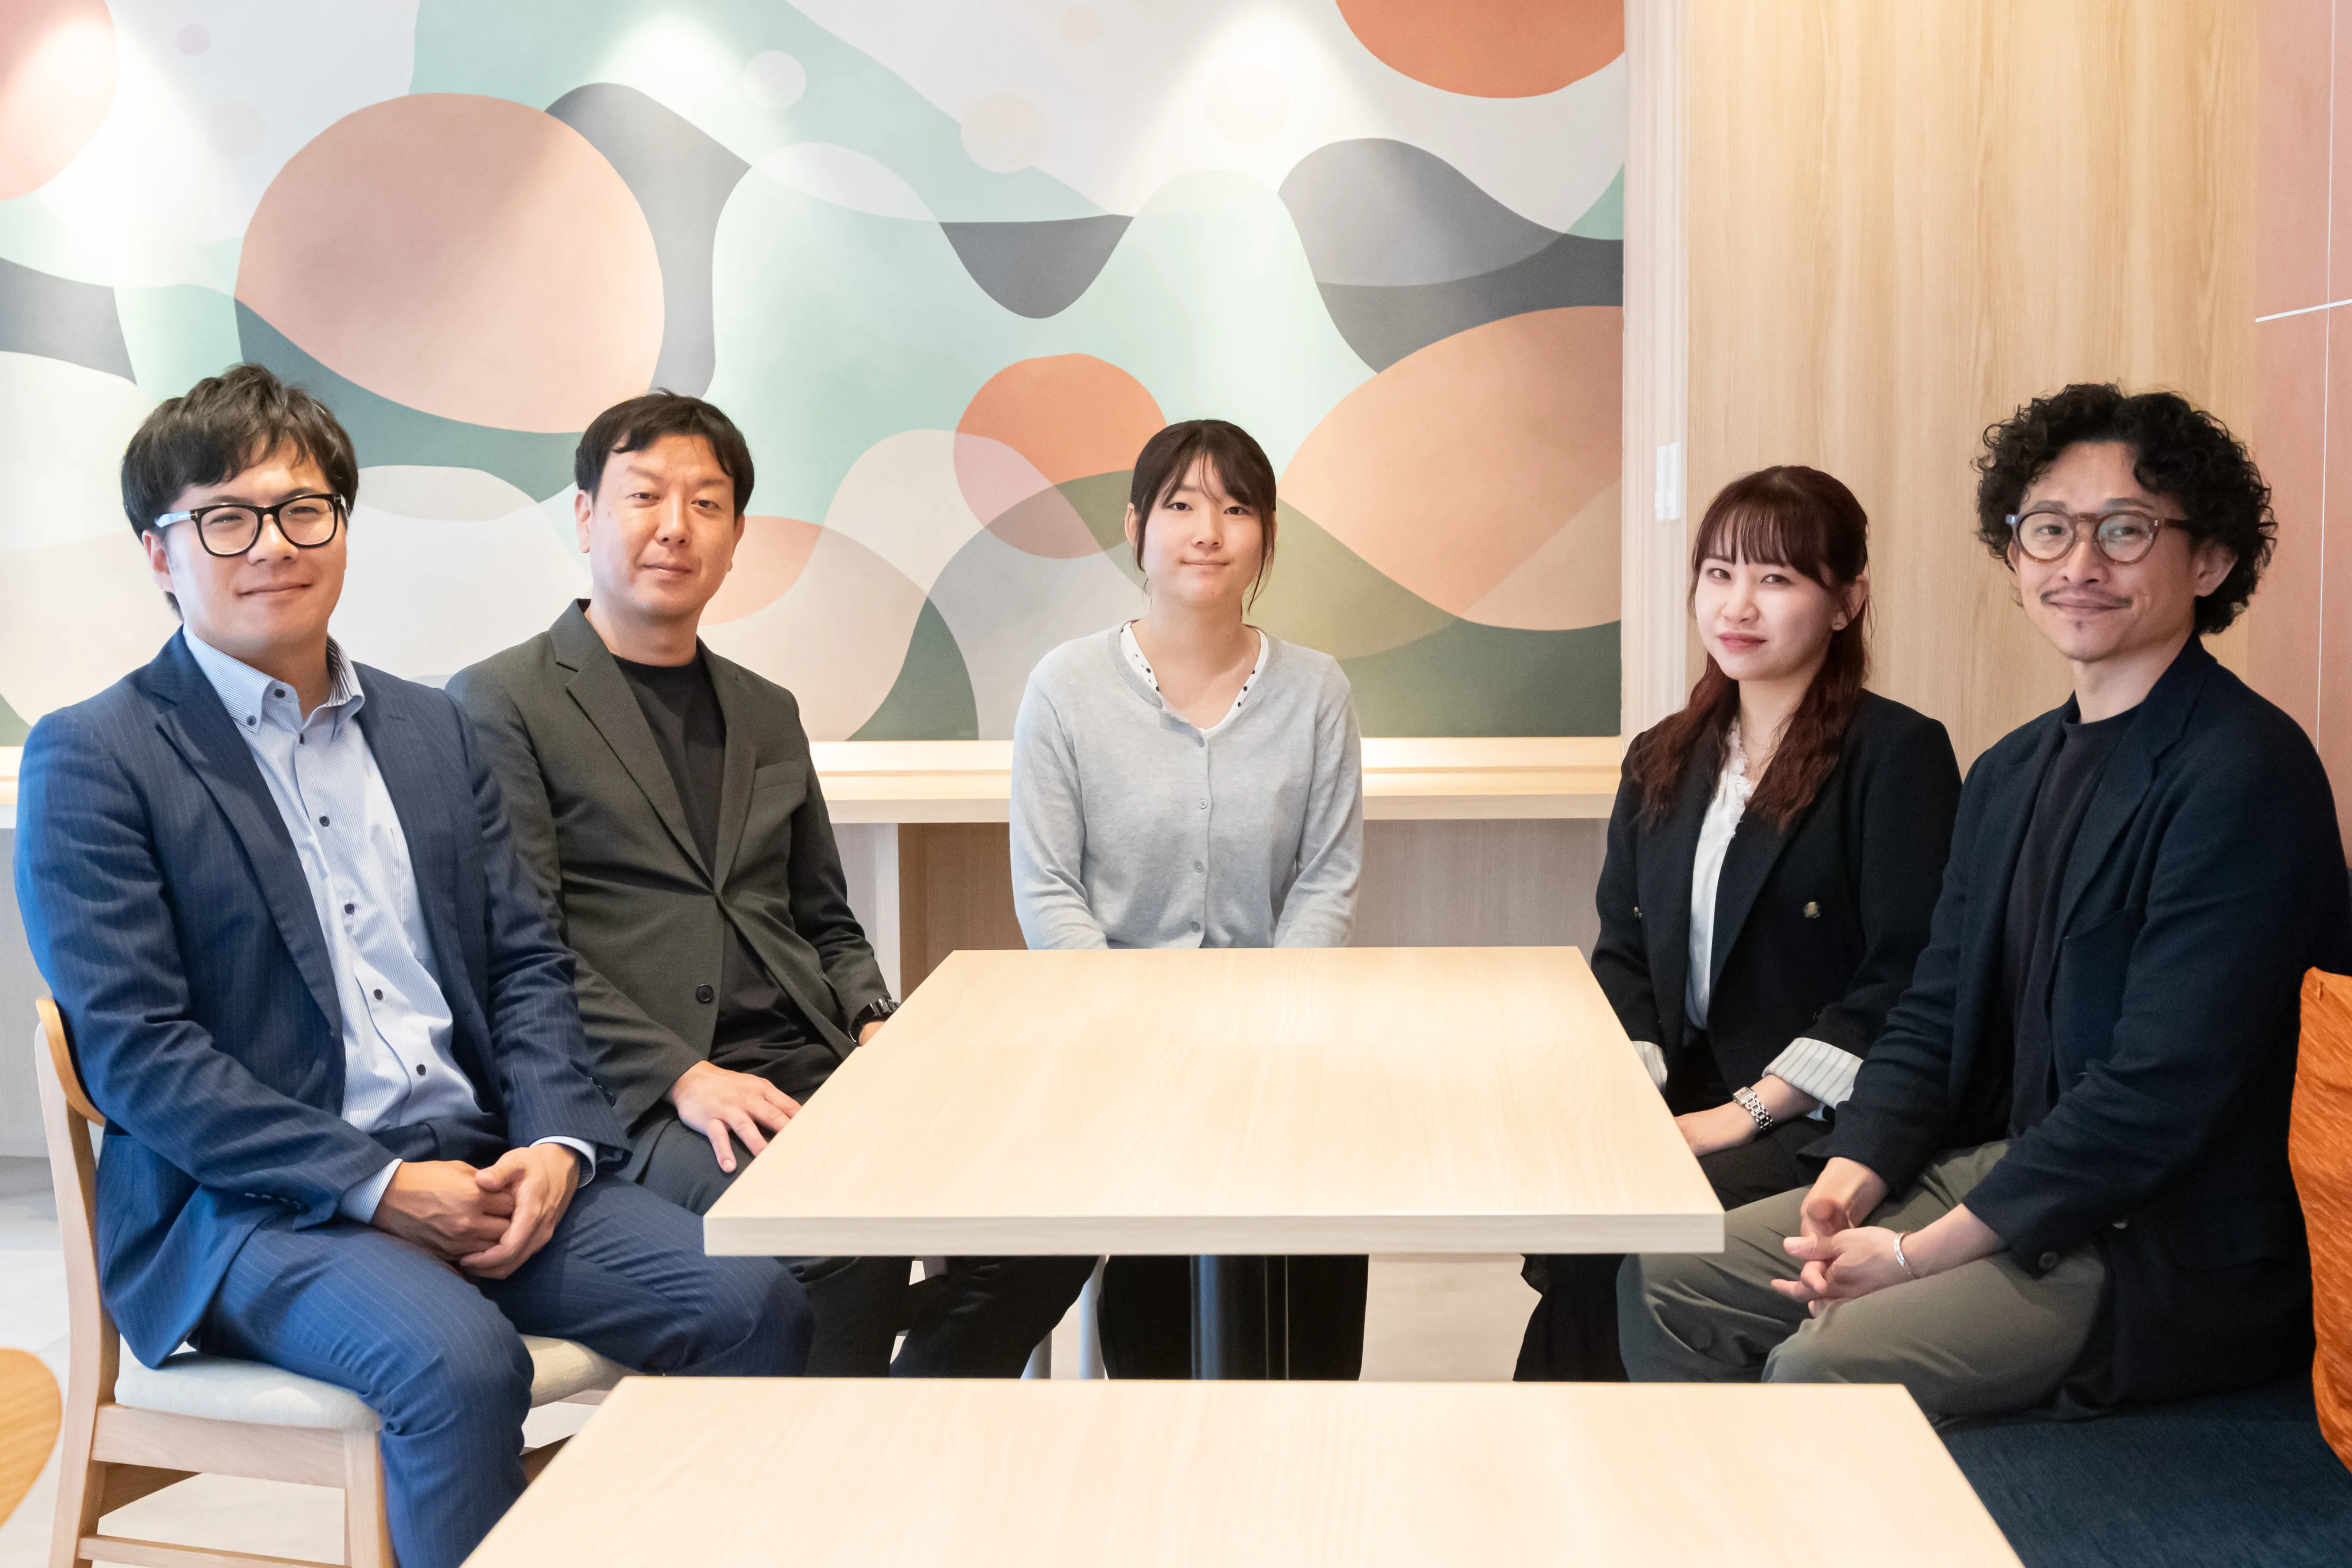
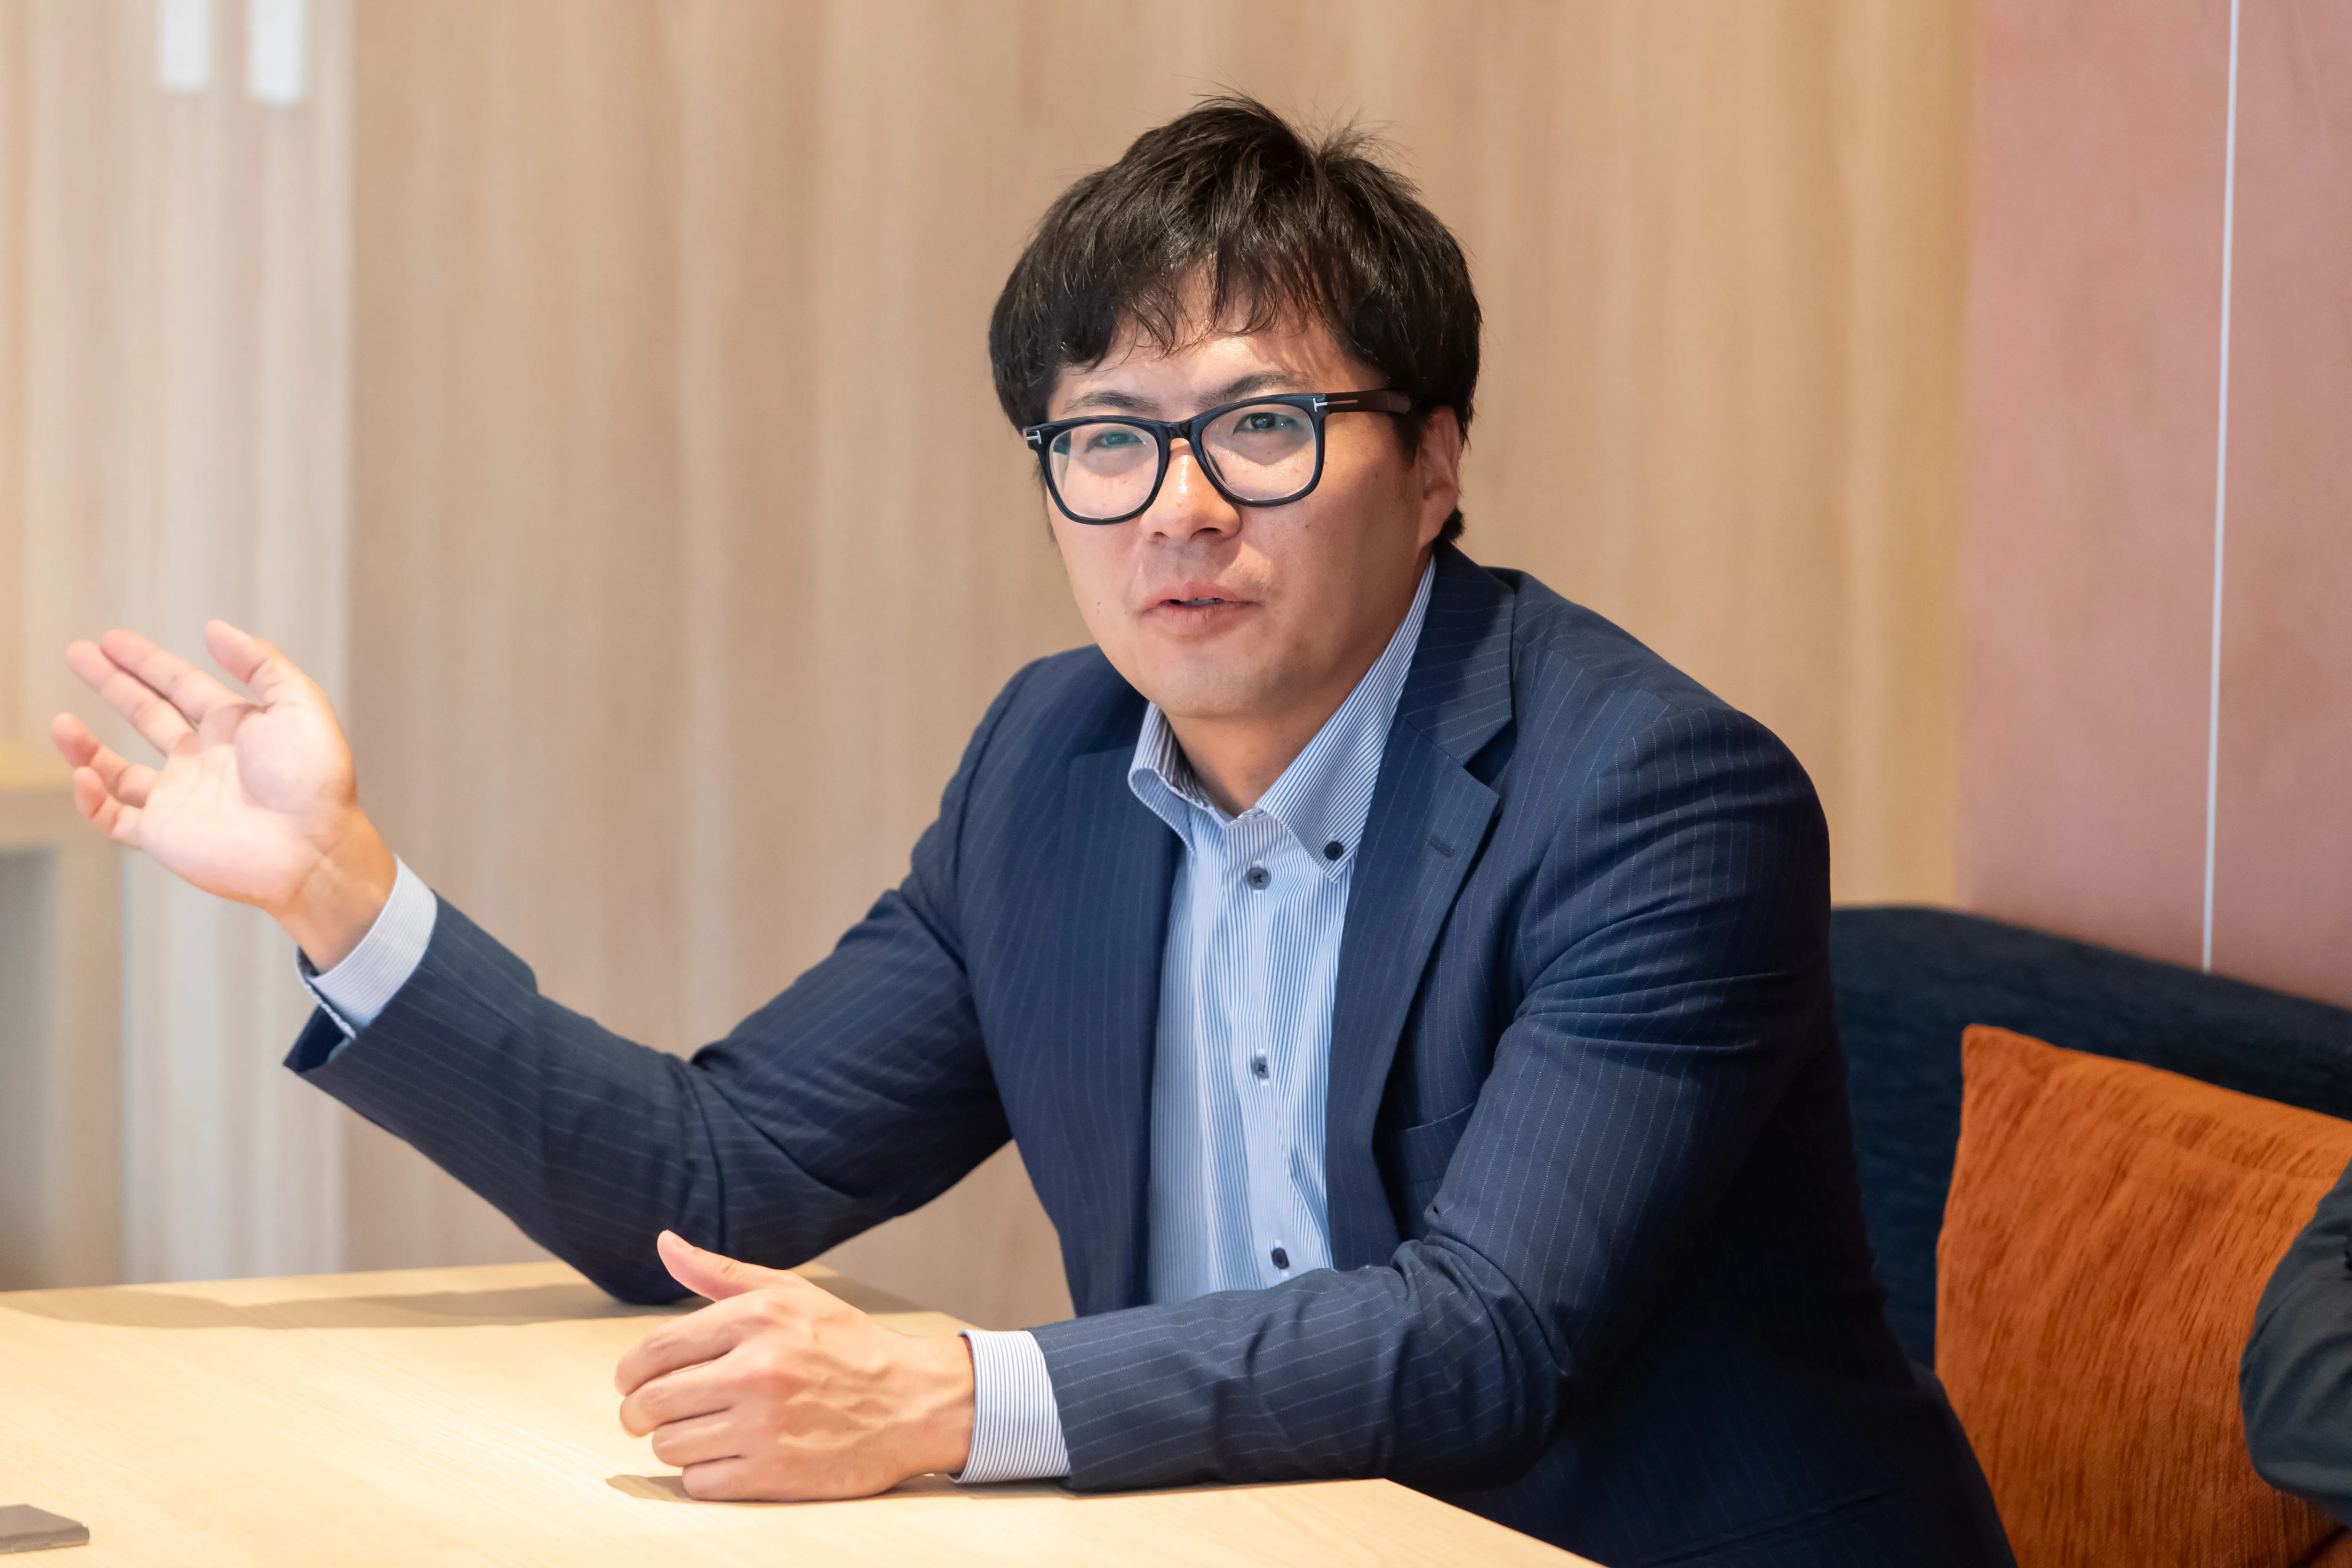
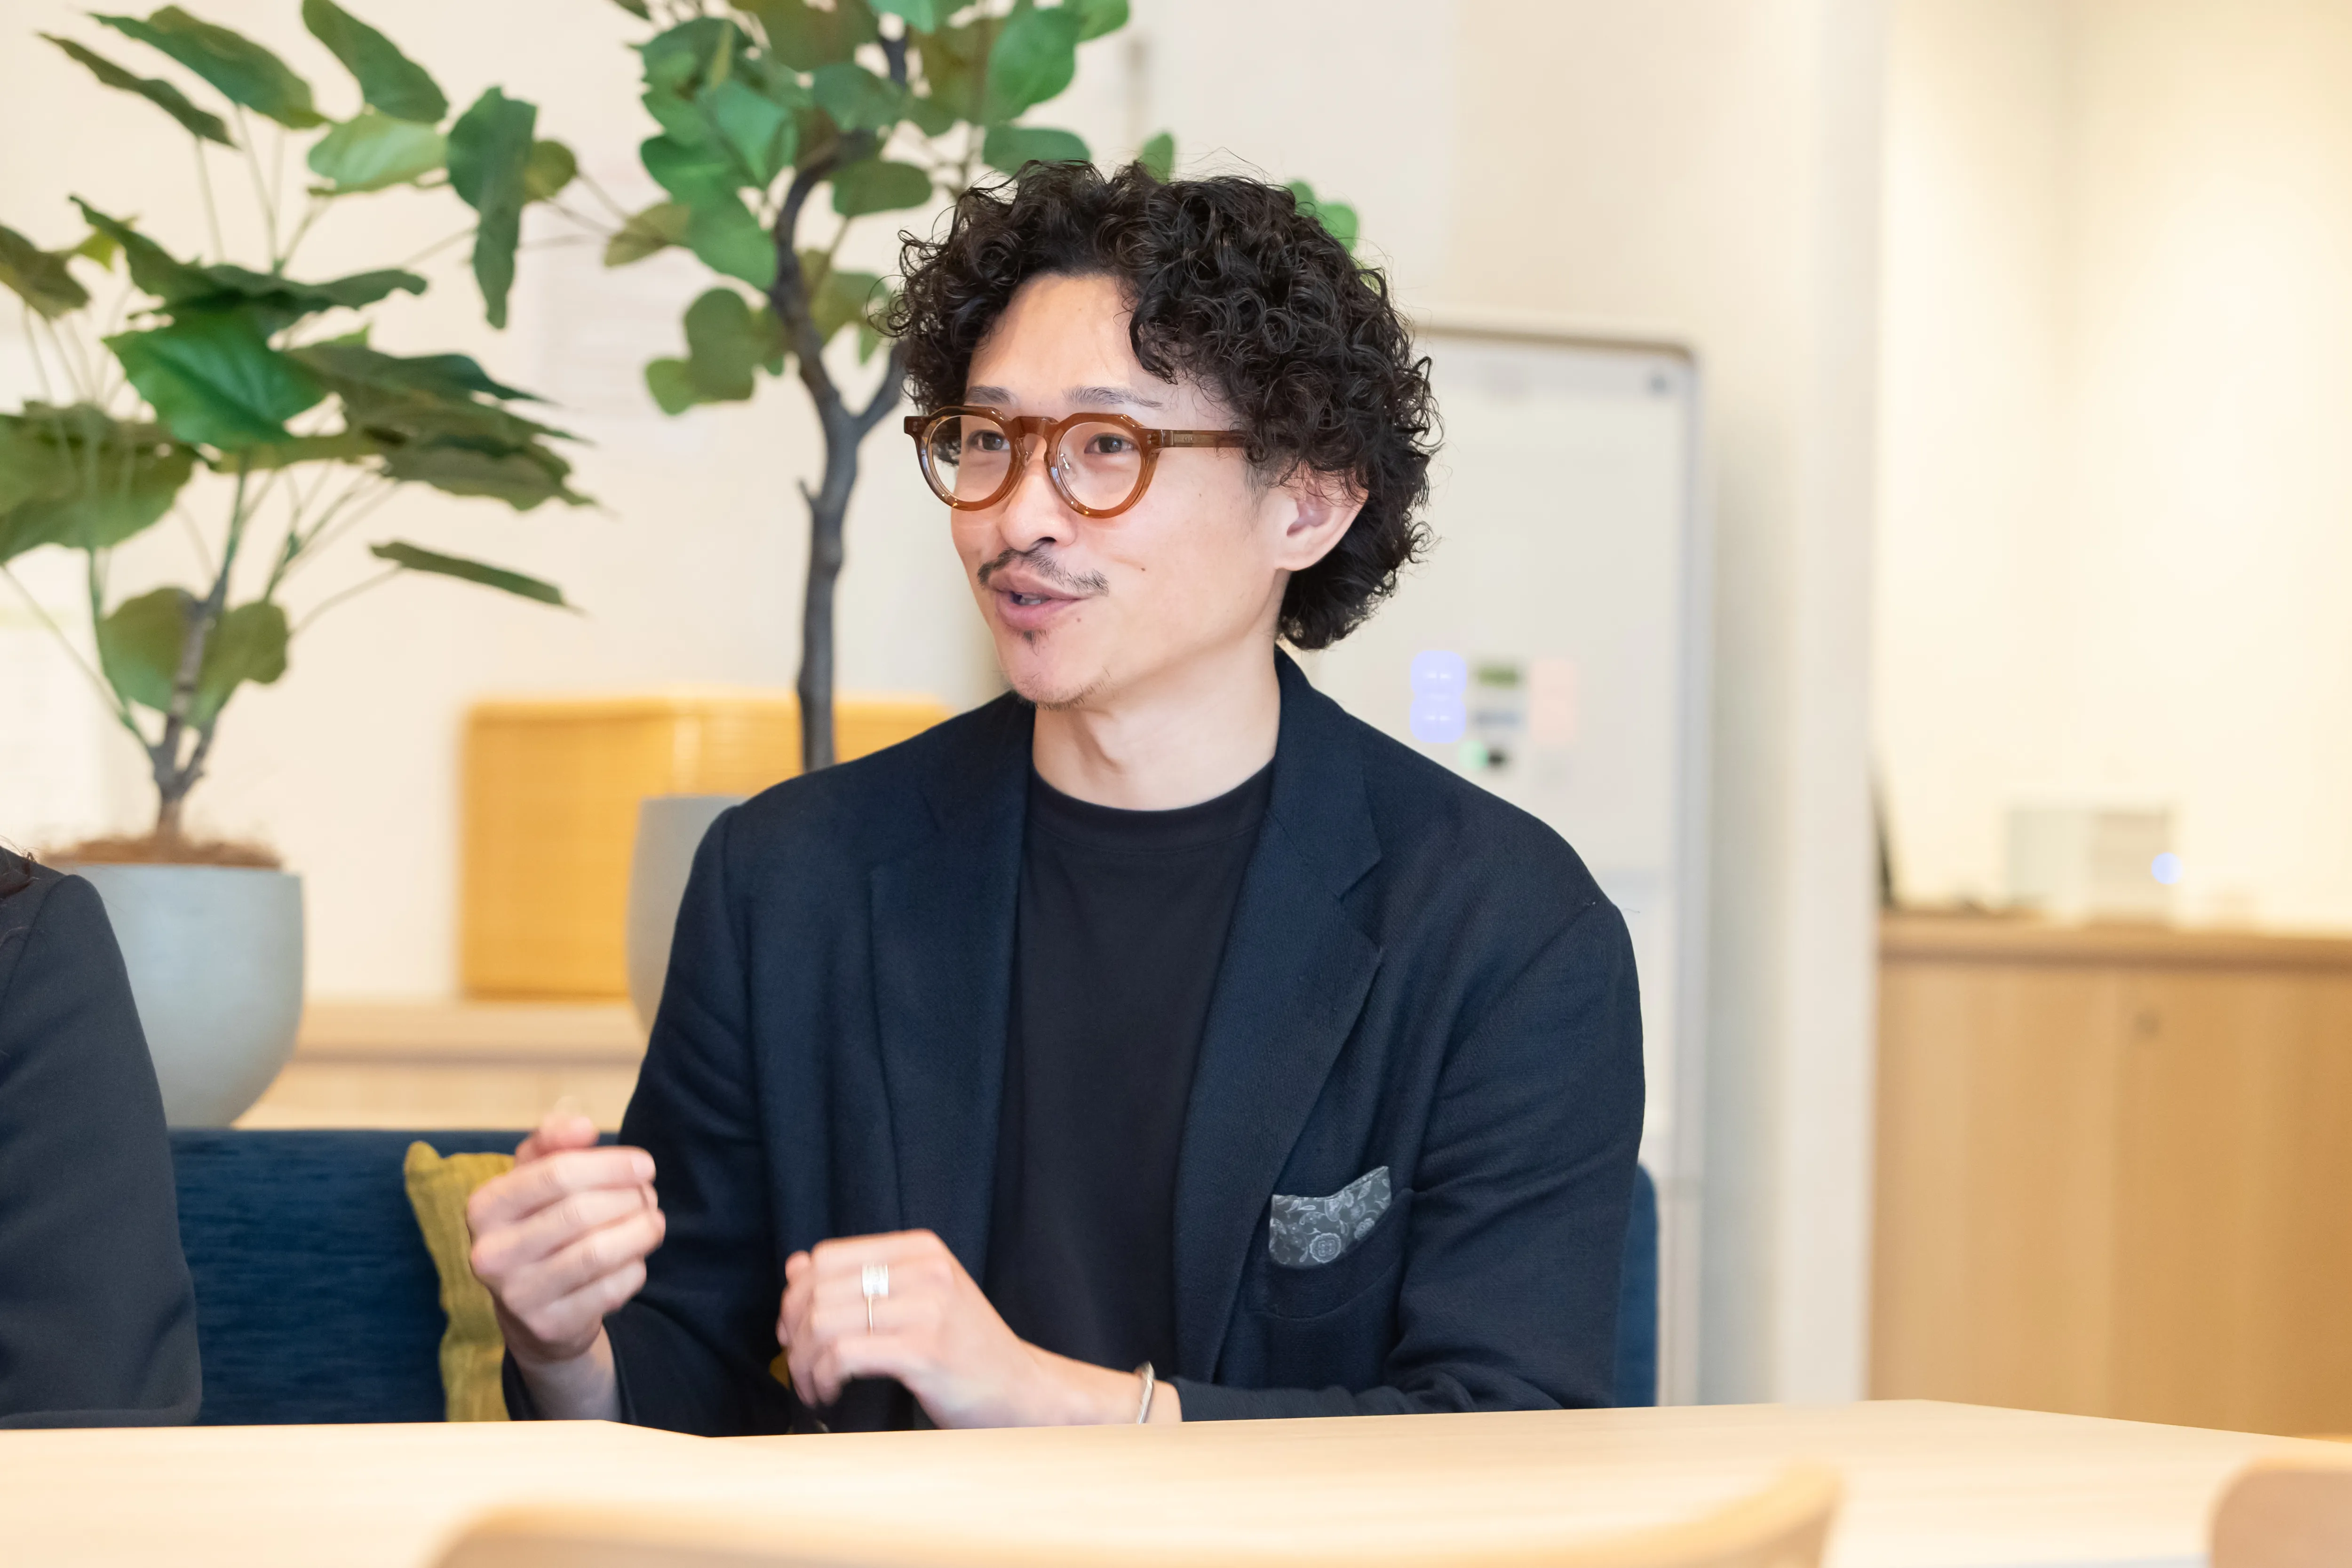
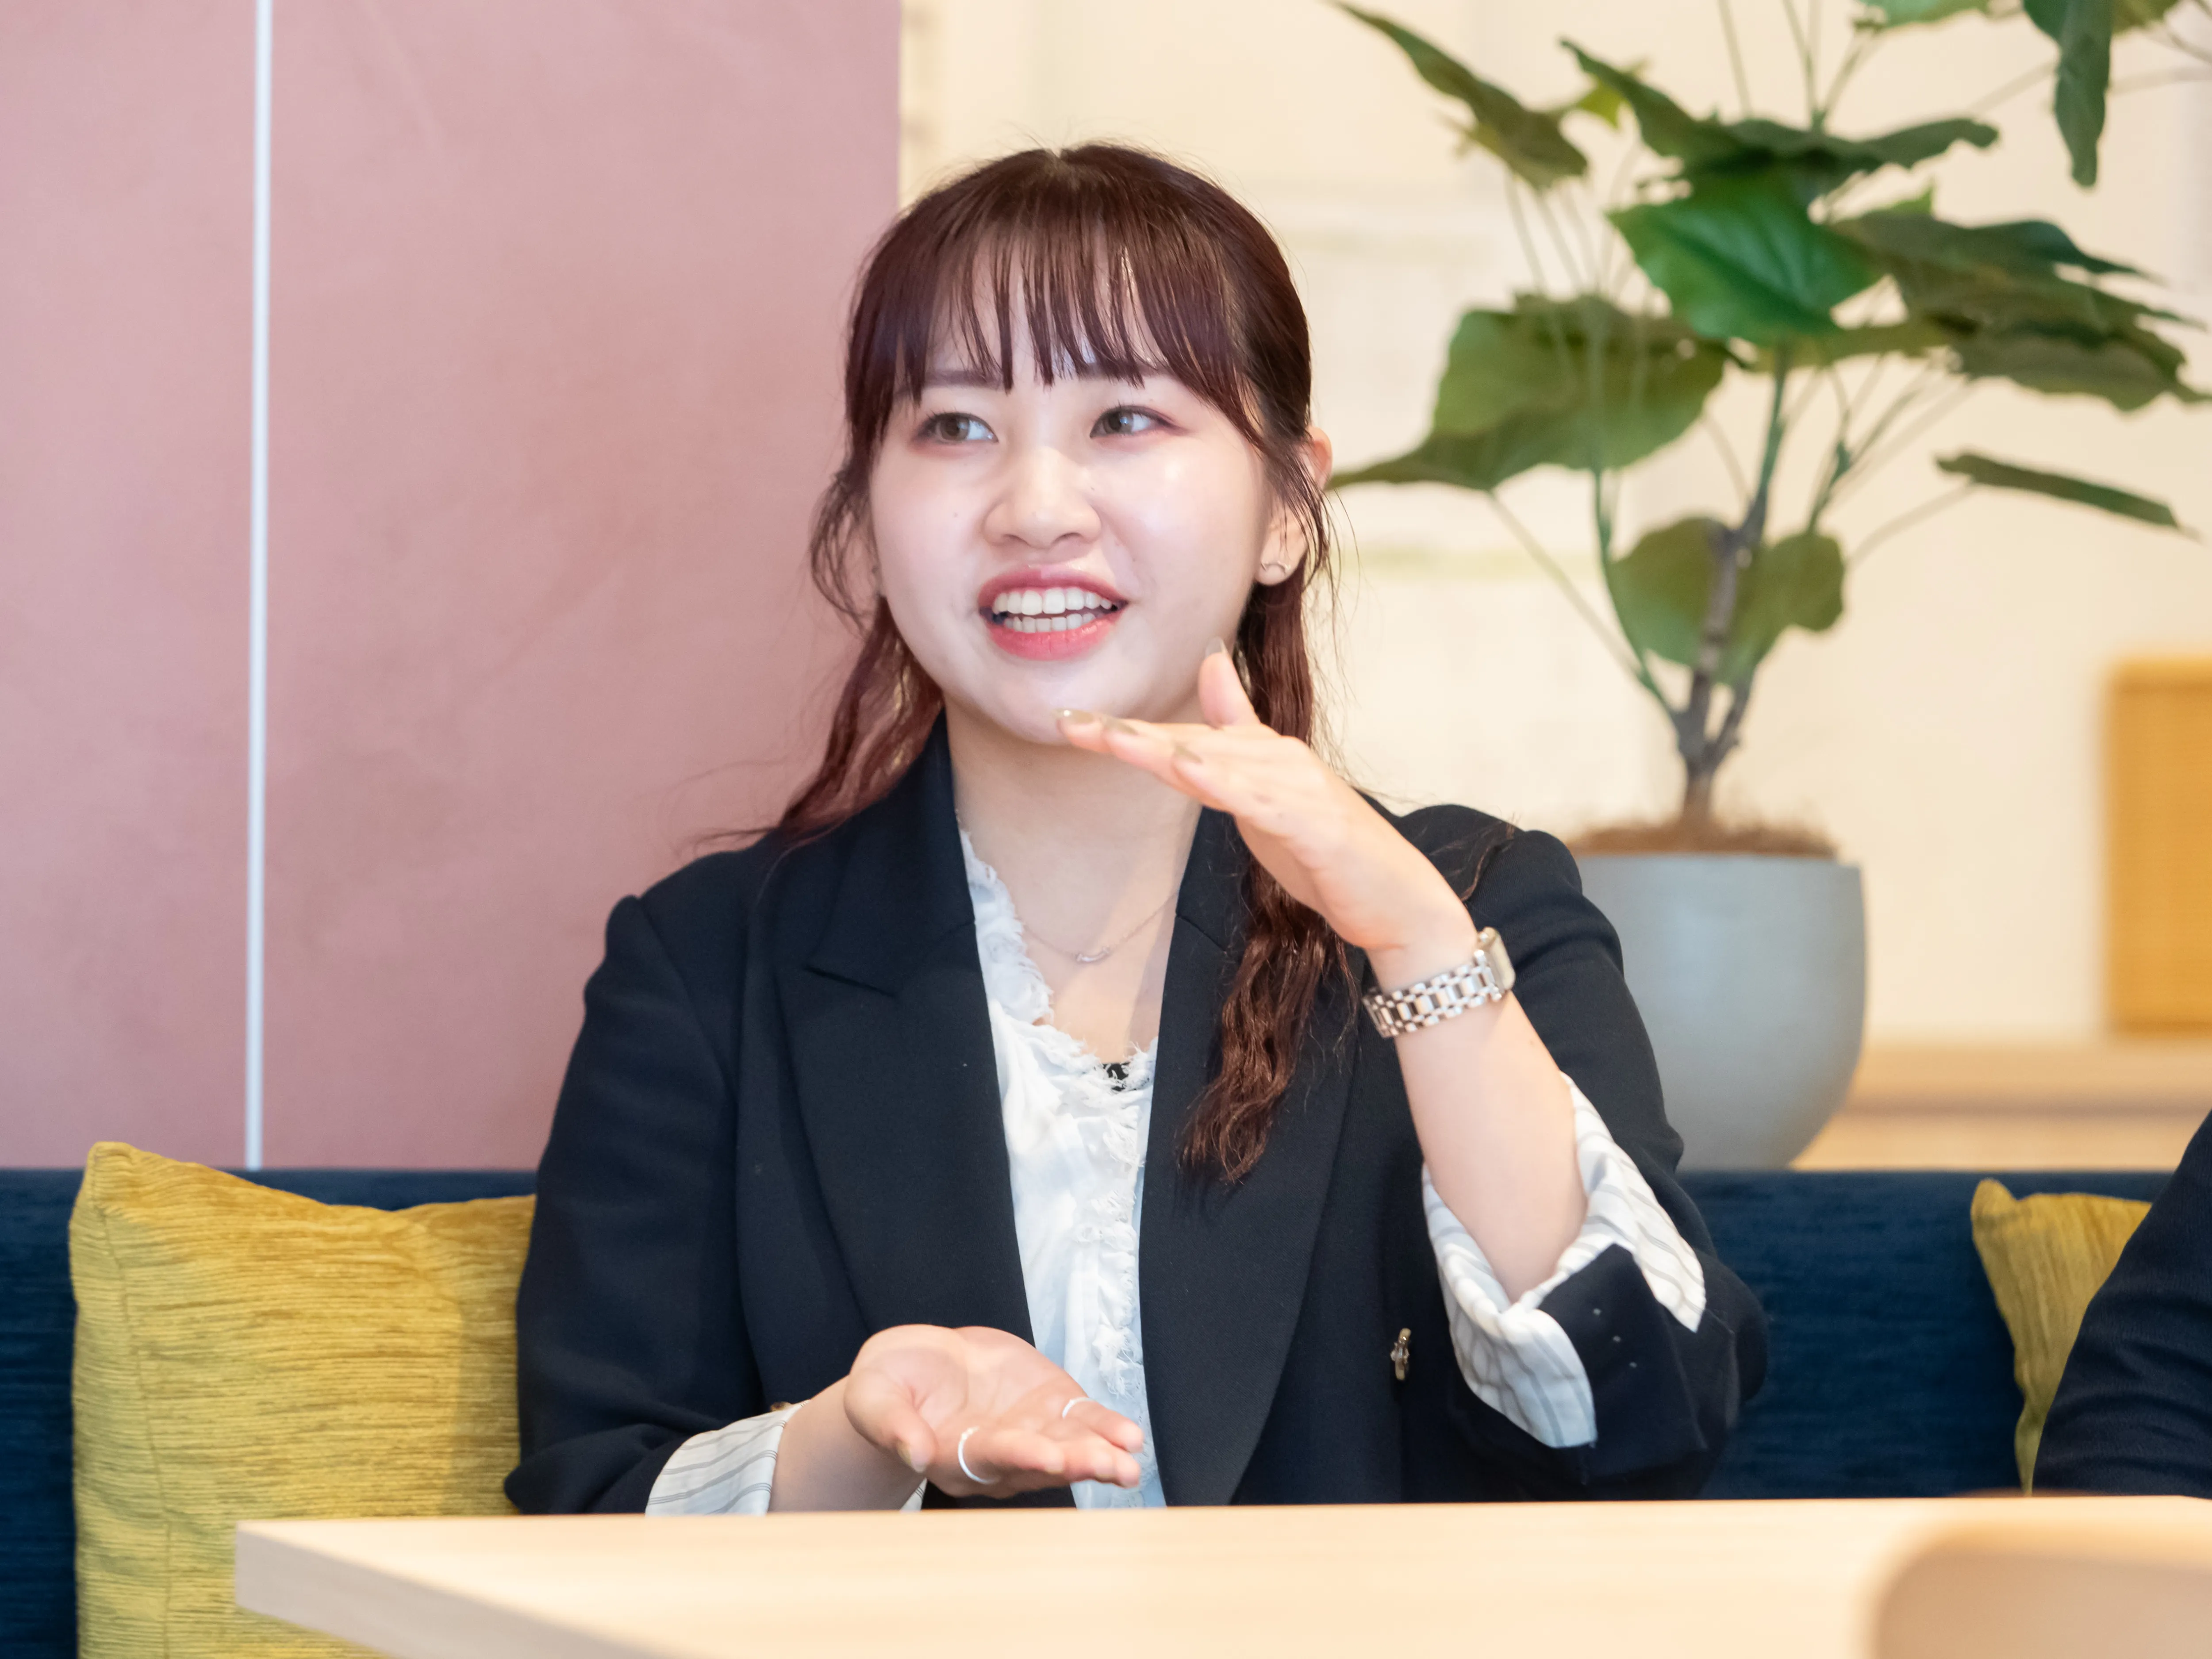
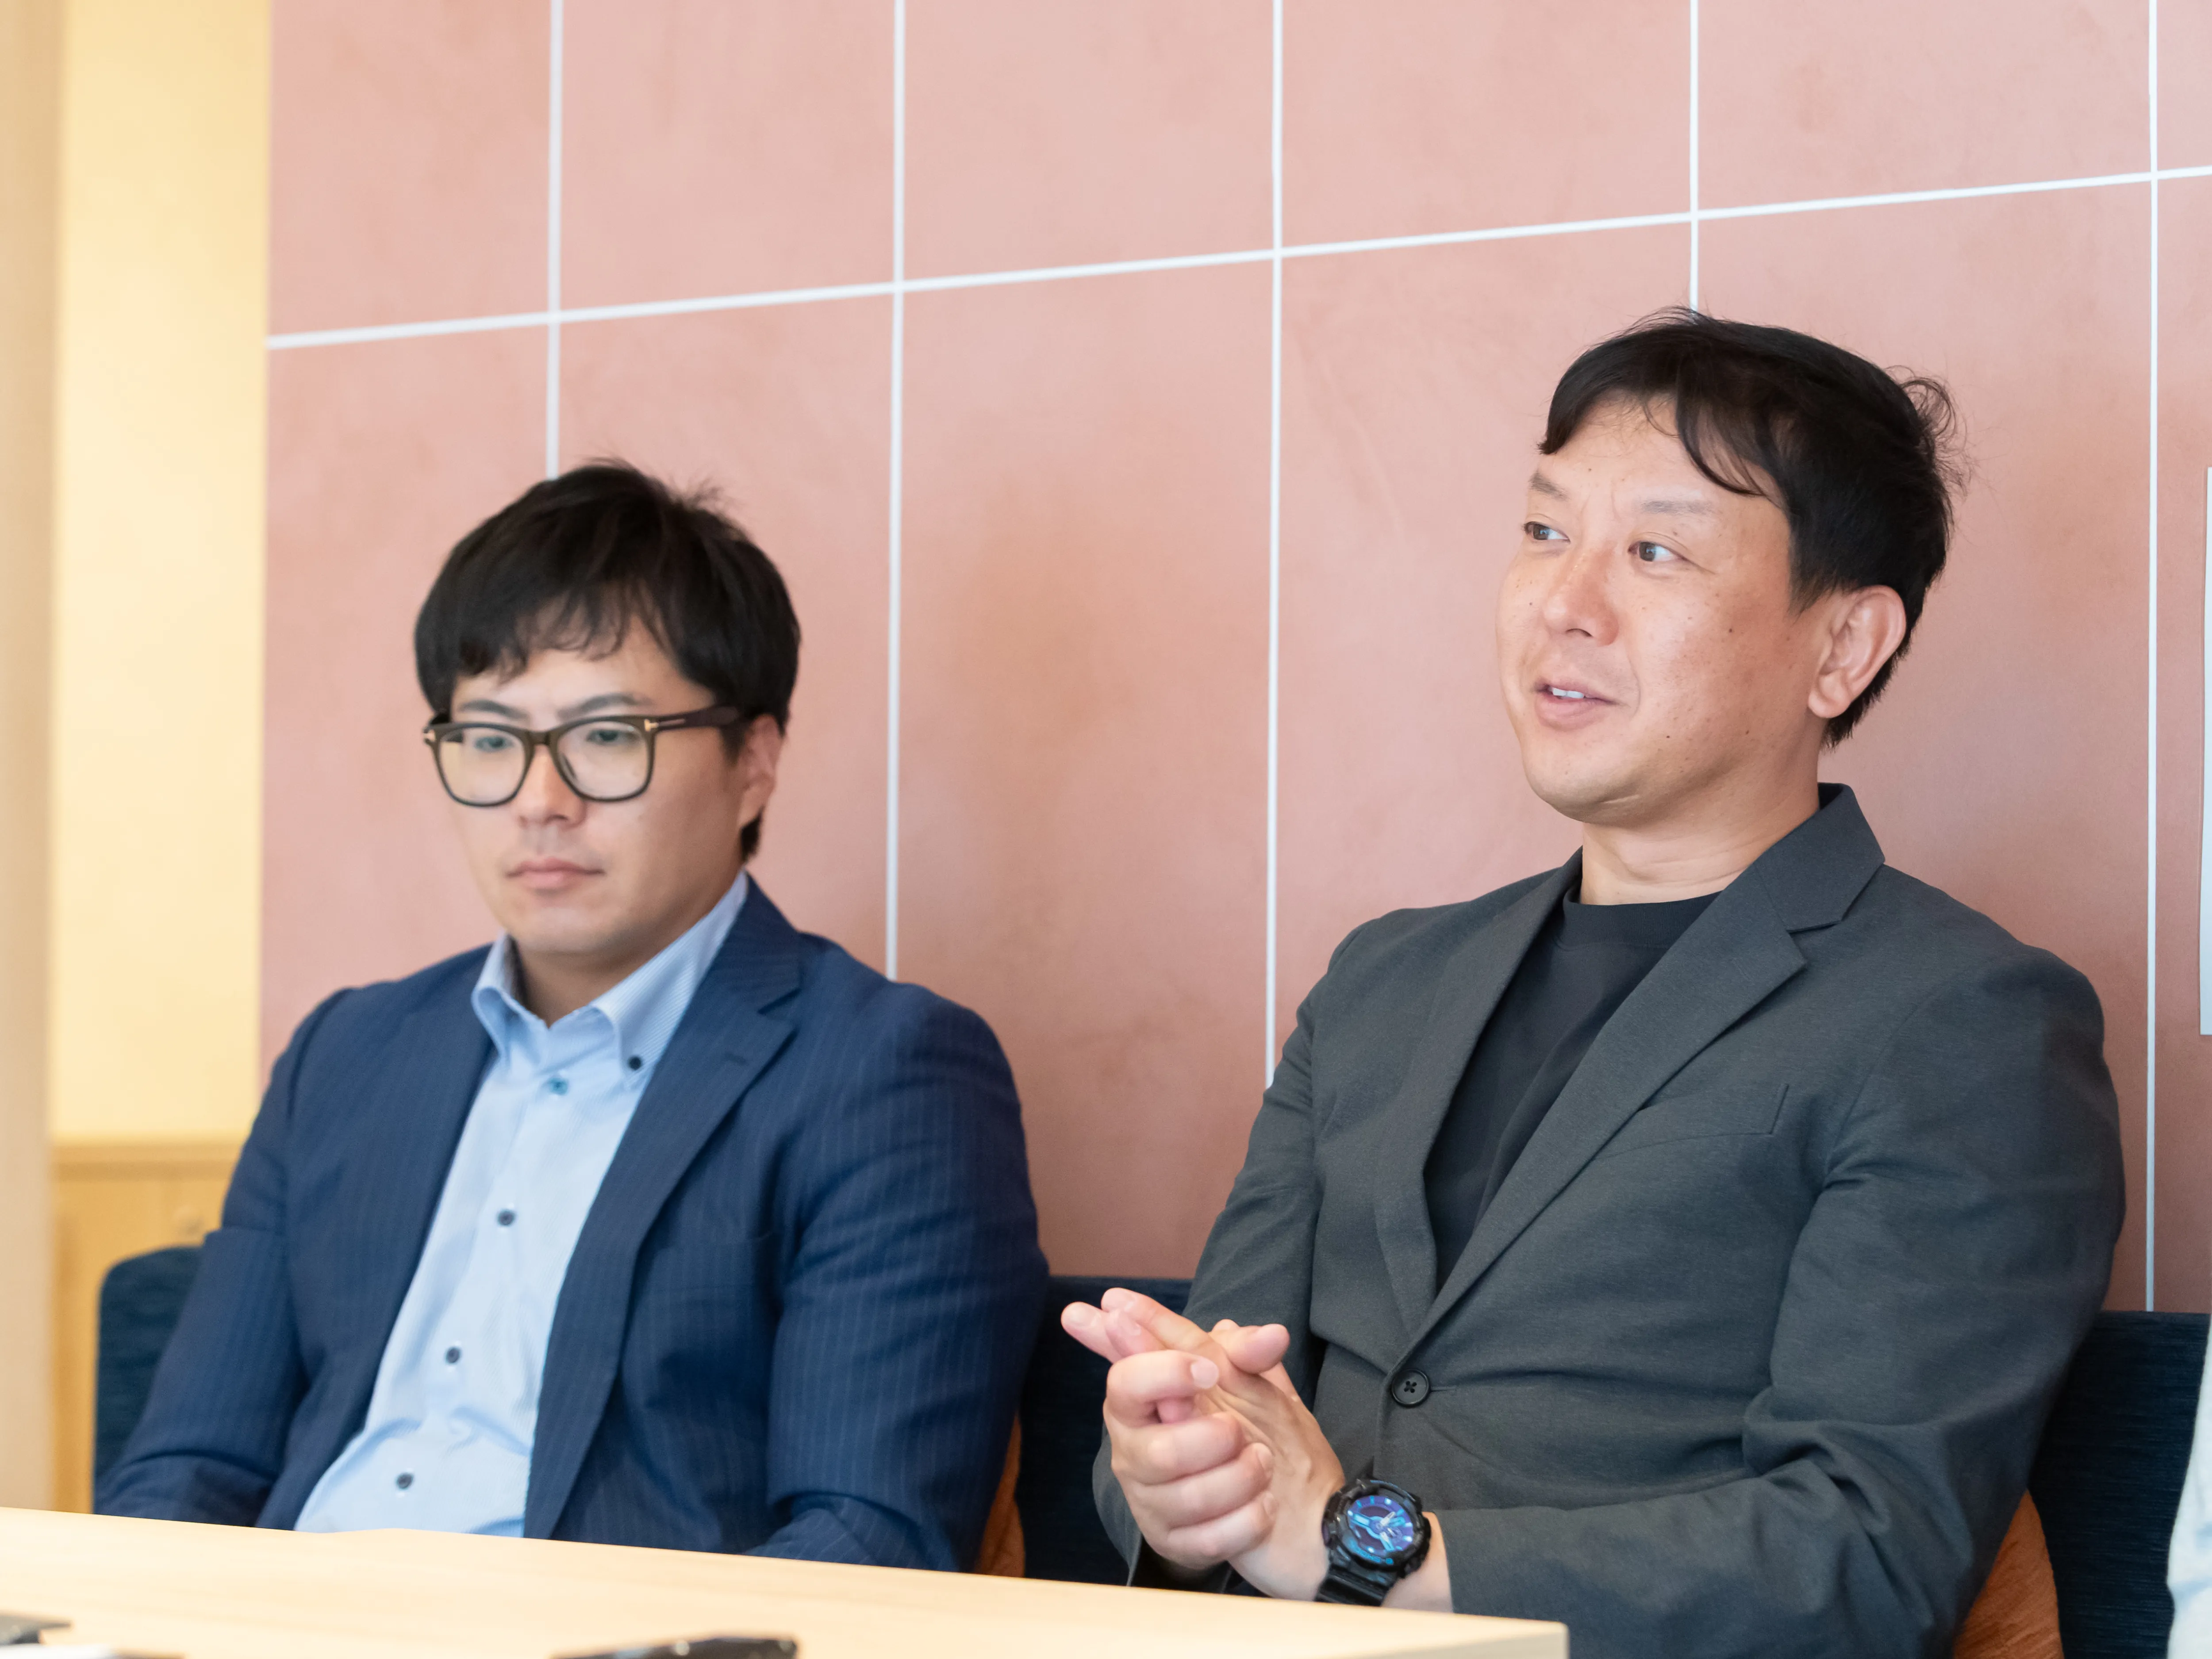
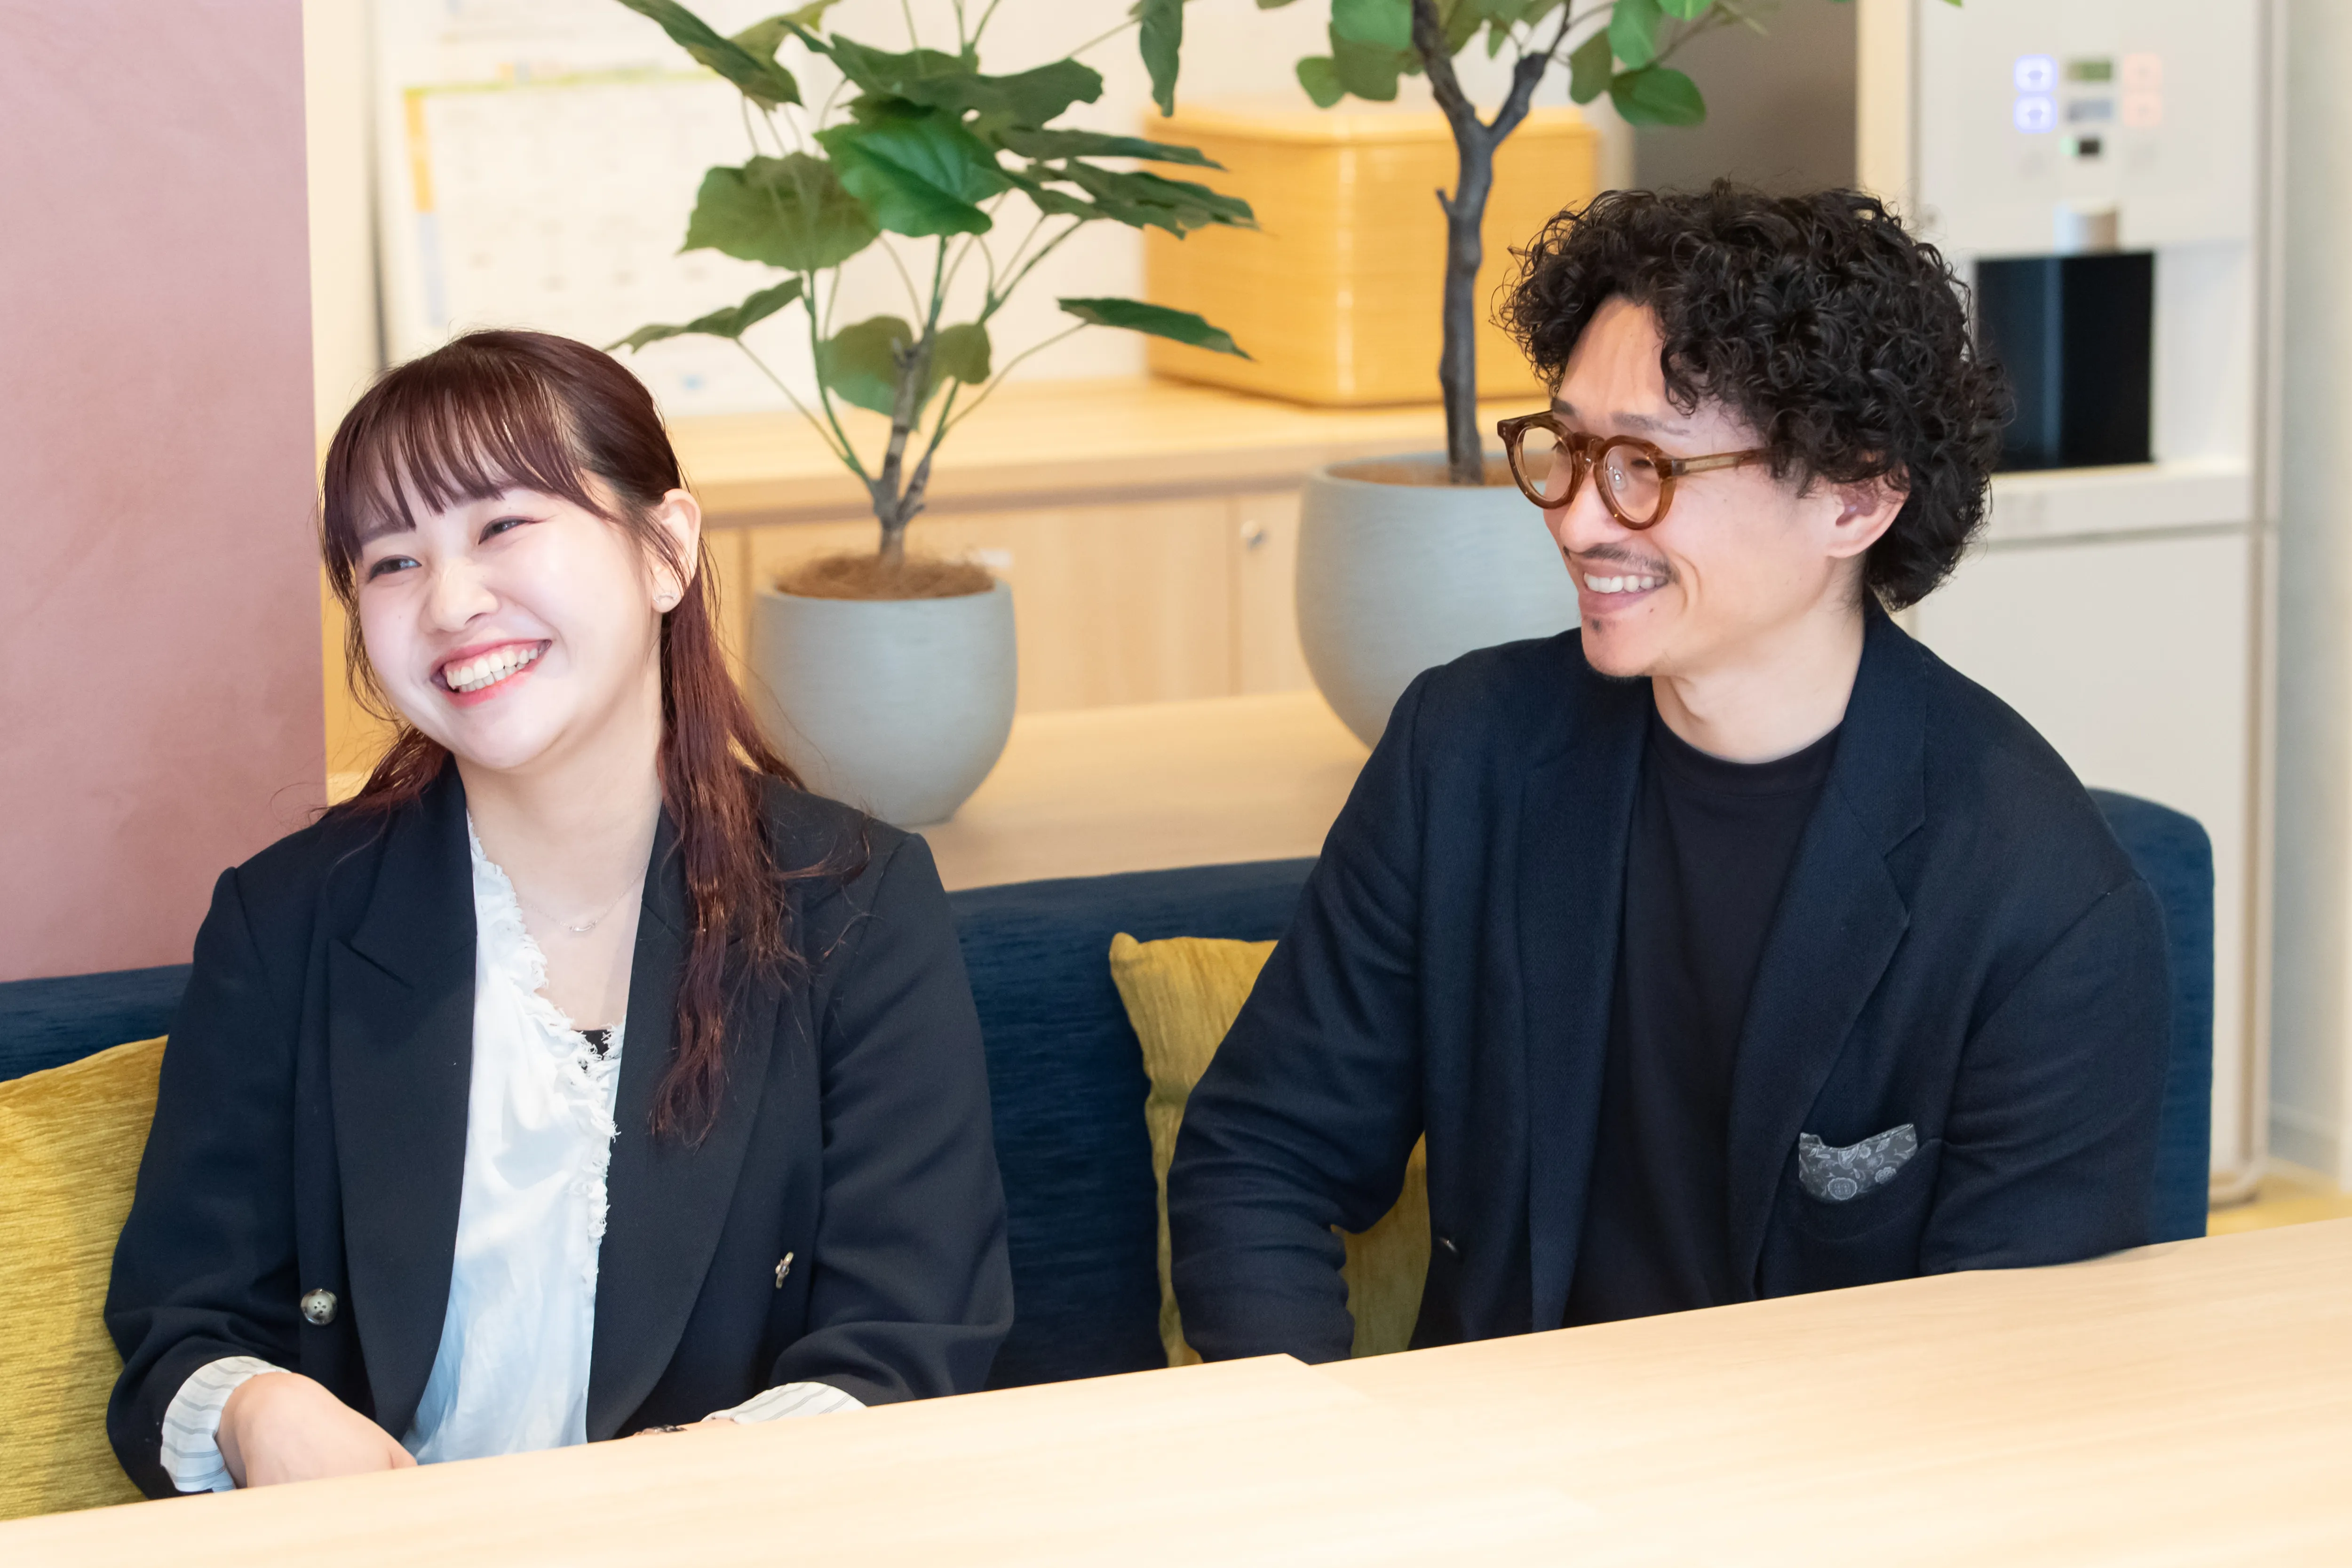
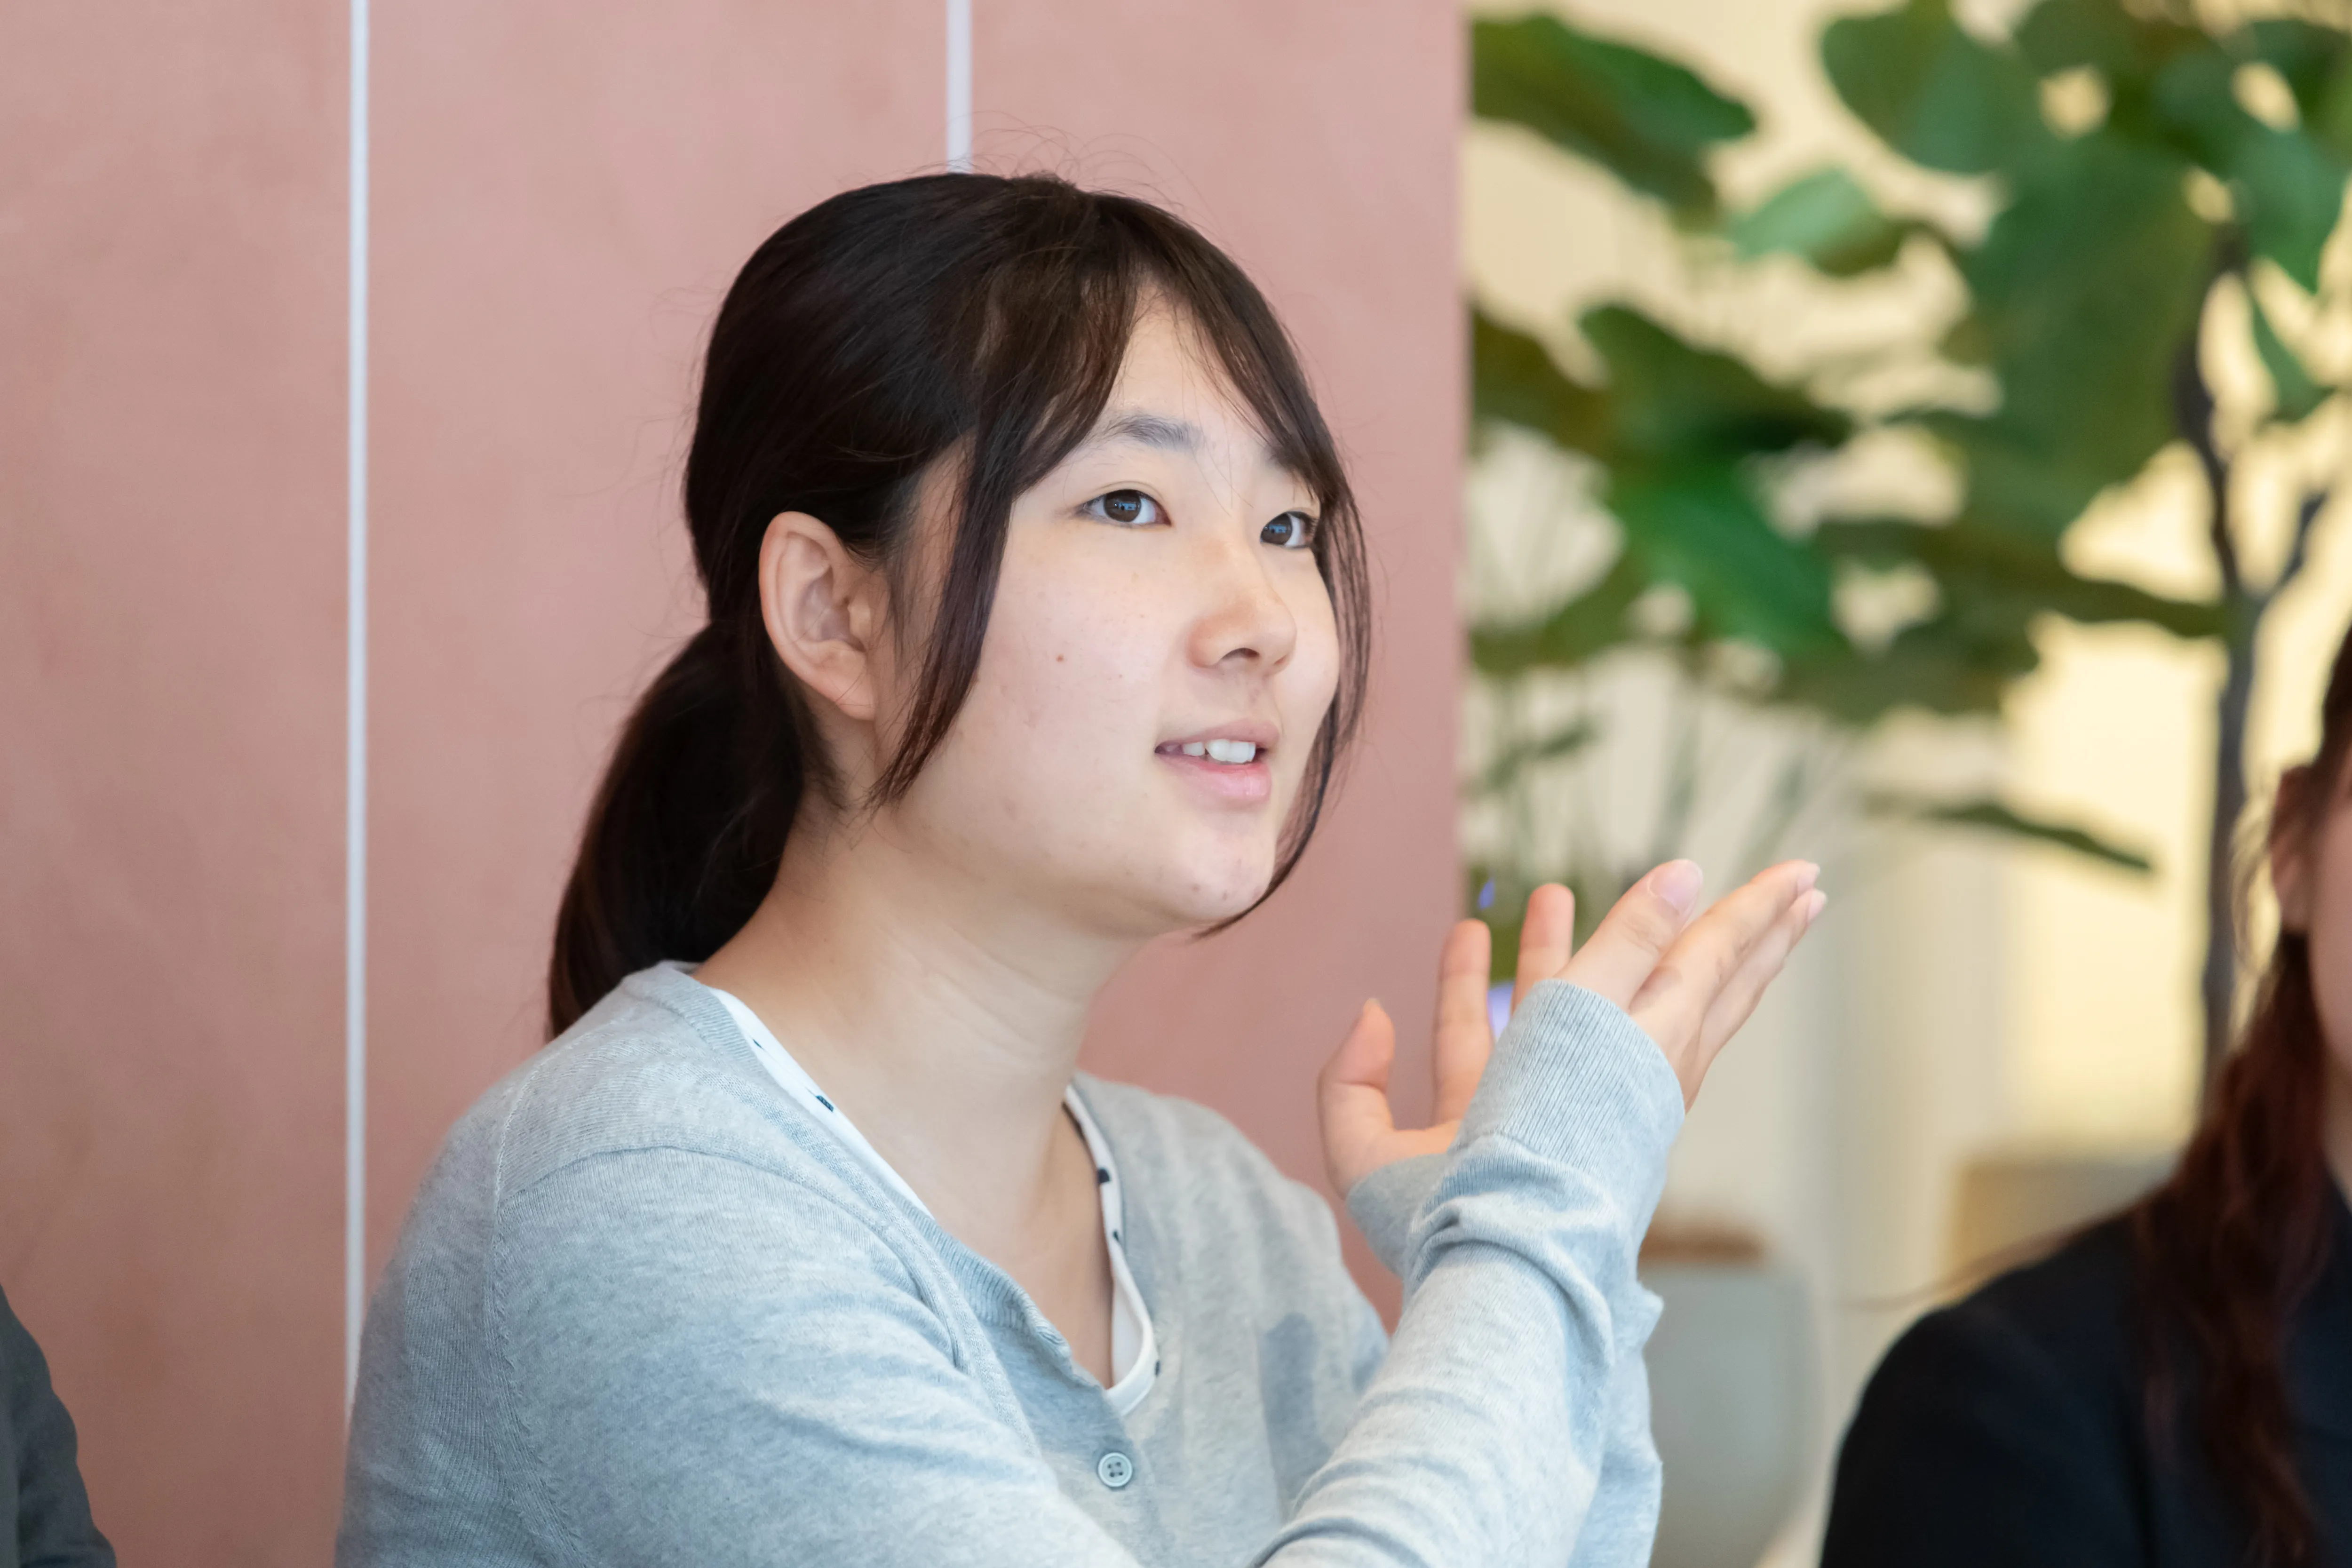
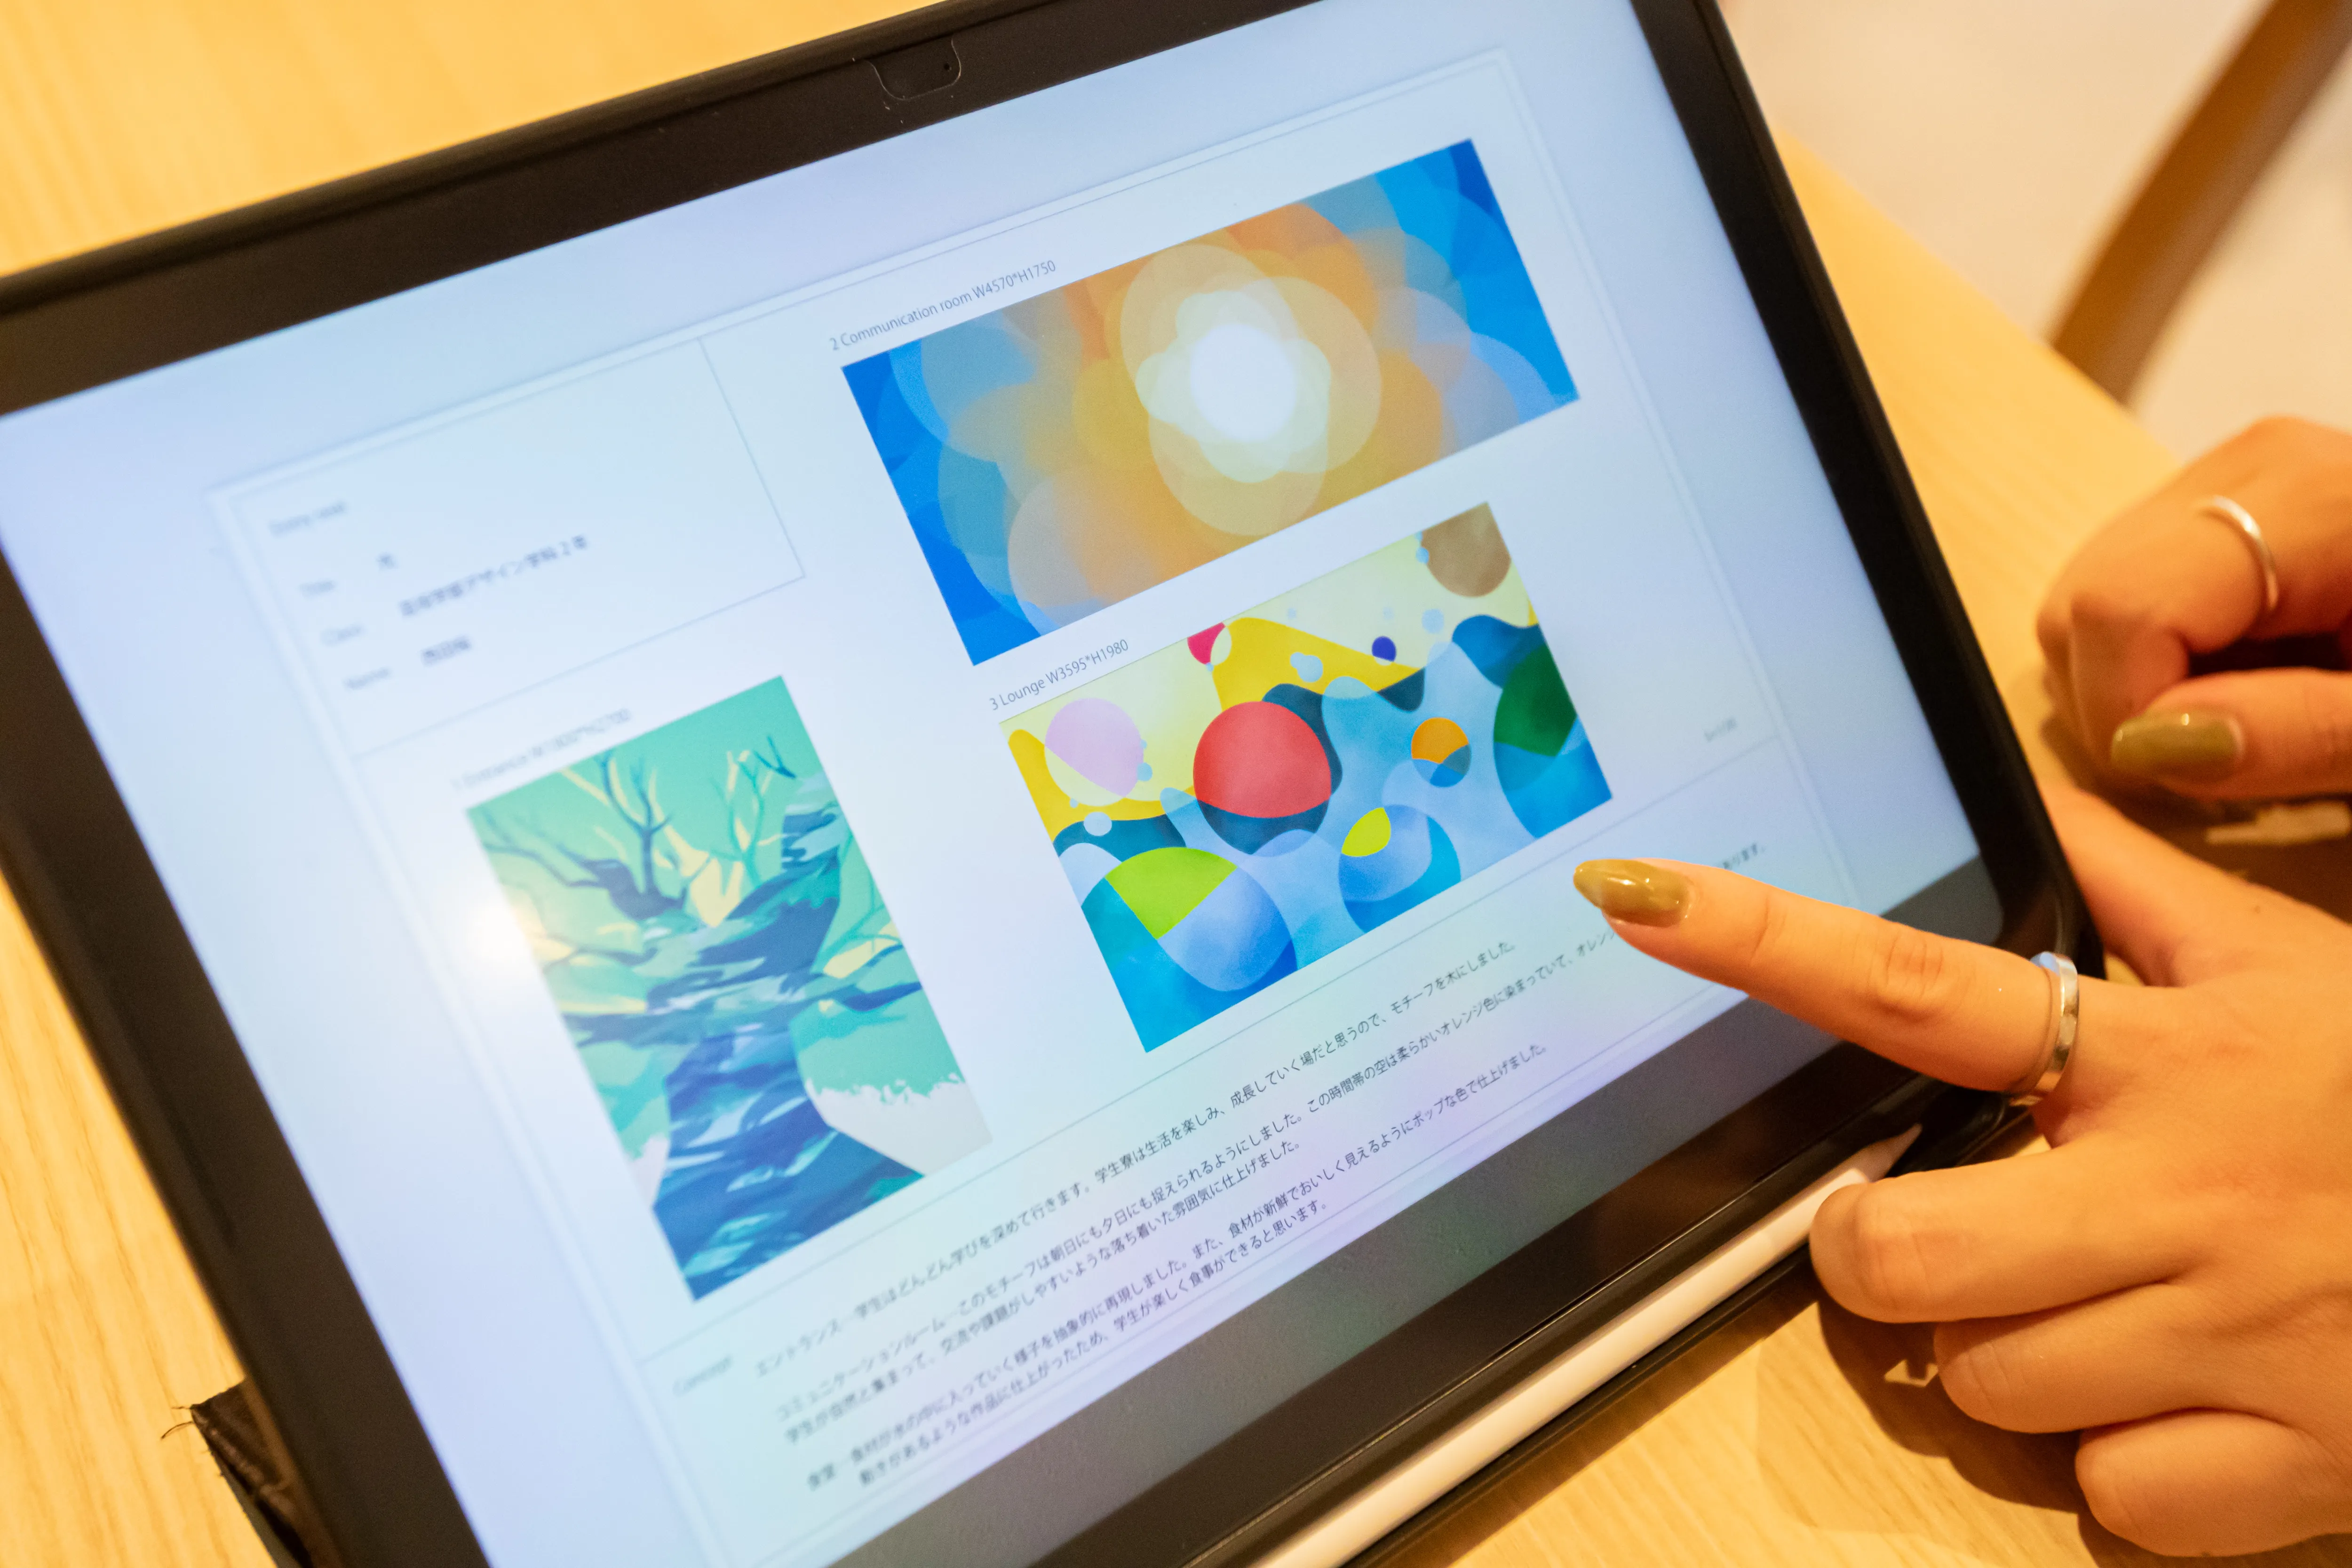

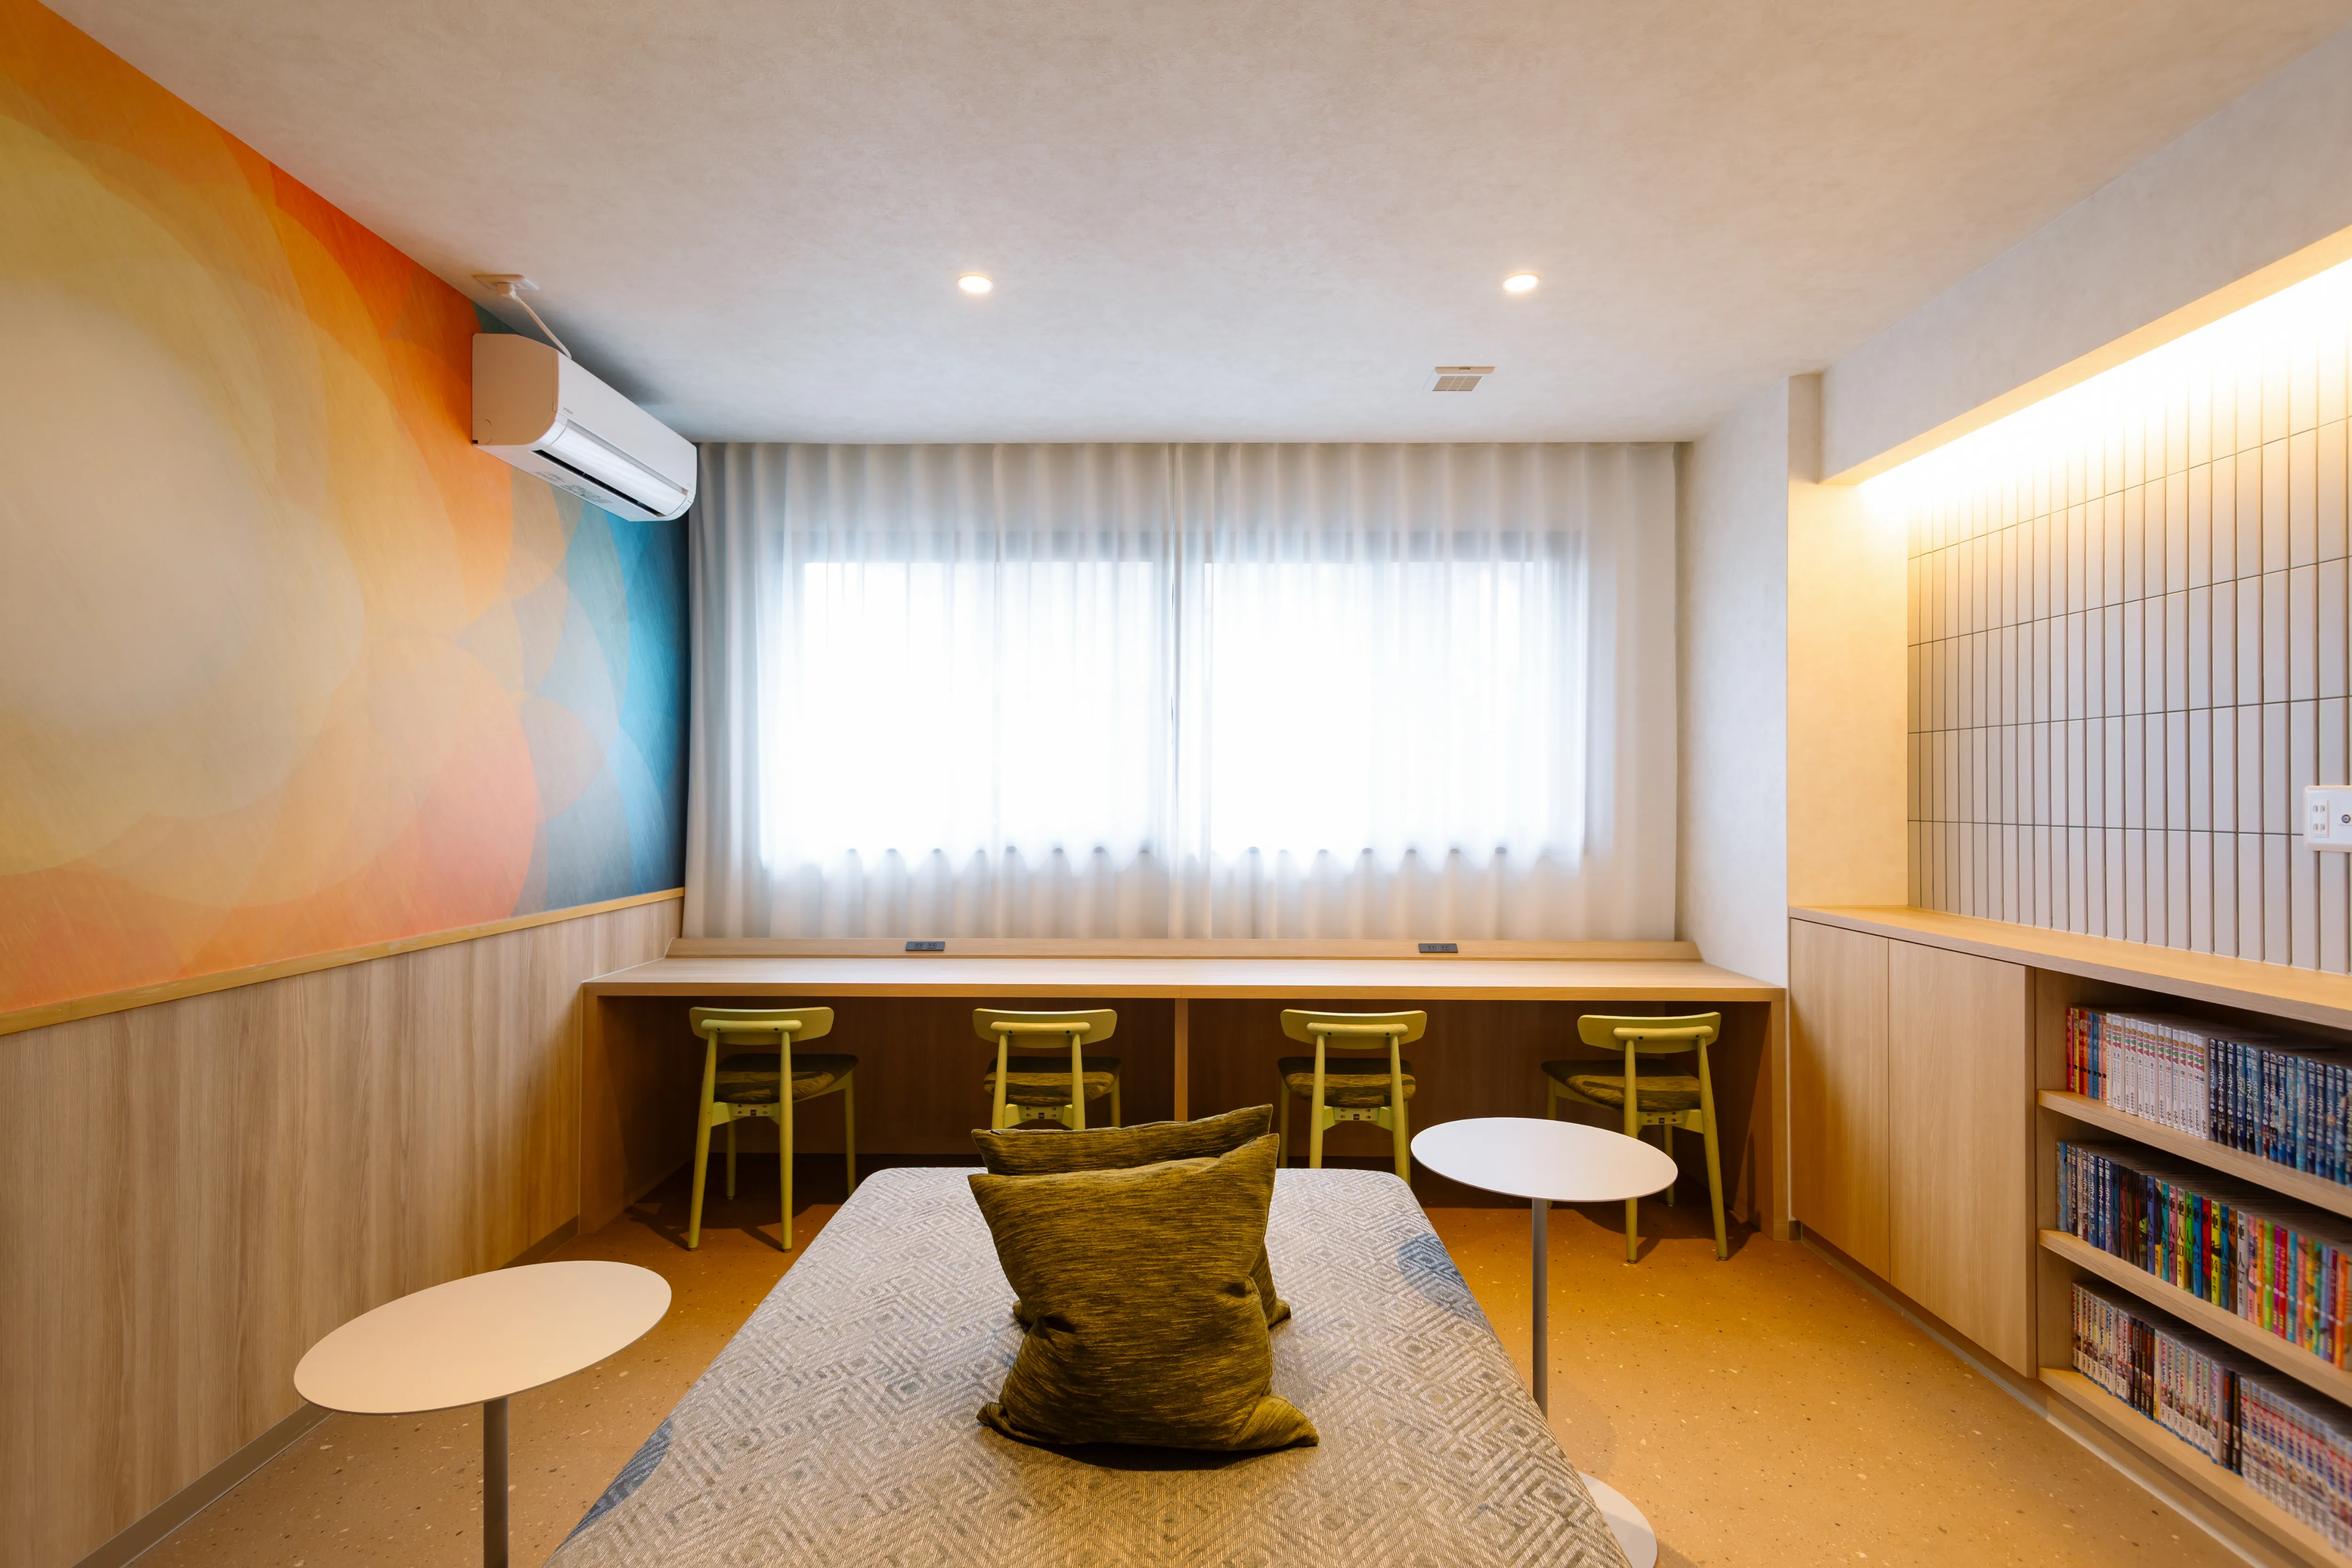

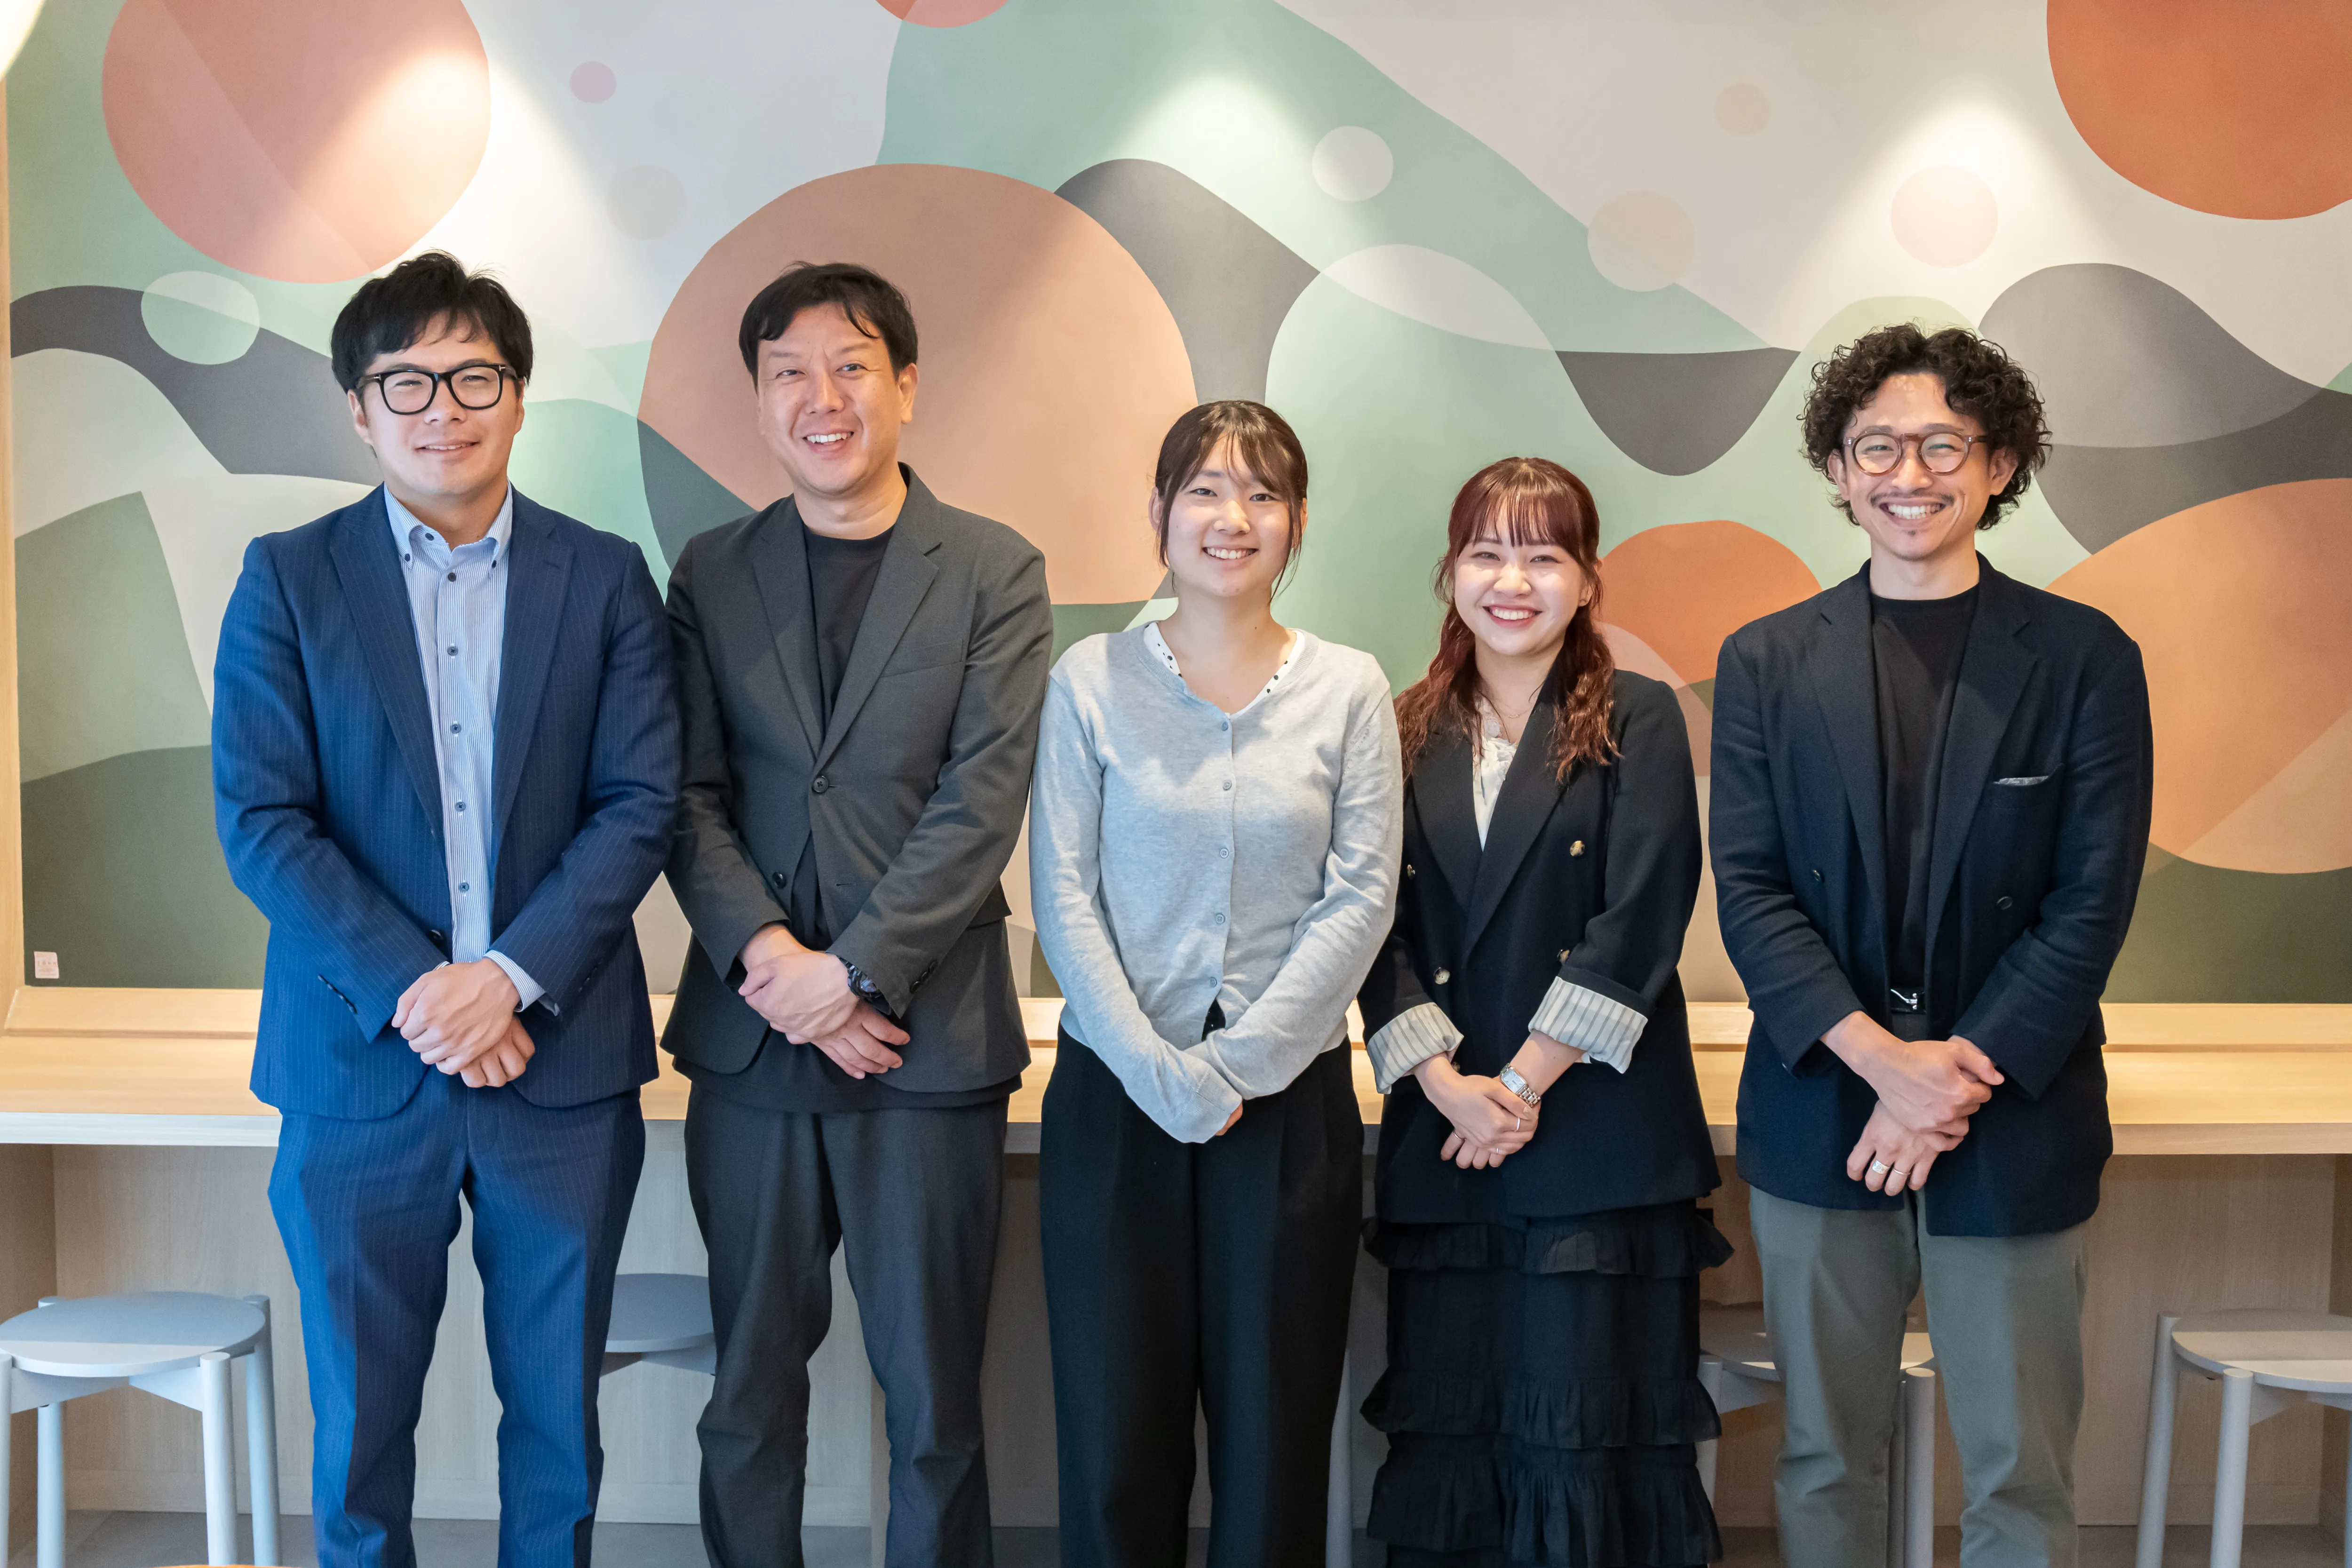







 2026年度グッドデザイン賞を受賞した床材「Kotehada®」
 施⼯イメージ
 TERRAZZO F DT91401・91402(流し貼り)
 【TIMELESS】 時とともに育つ豊かさ DT90202
光や自然の移ろいを感じる有機的なデザイン。時を経ても色褪せない価値と物語を刻み、オフィスエントランスからラウンジまで幅広く調和。
 【DIVERSITY】 混ざり合う豊かさ DT91601
多種多様な人々が行き交い、違いを尊重し楽しむ空間をイメージ。異文化を感じさせ、遊び心ある色柄が個性を引き立て、学びと気づき、そして特別な居心地を感じられる空間を演出。
 【INNOVATION】 創造性を刺激する豊かさ DT91804・91805
人が行き交い、発見や探究のワクワクに満ちあふれる共創エリアを彩る独自のデザインが、イノベーションを後押しする。
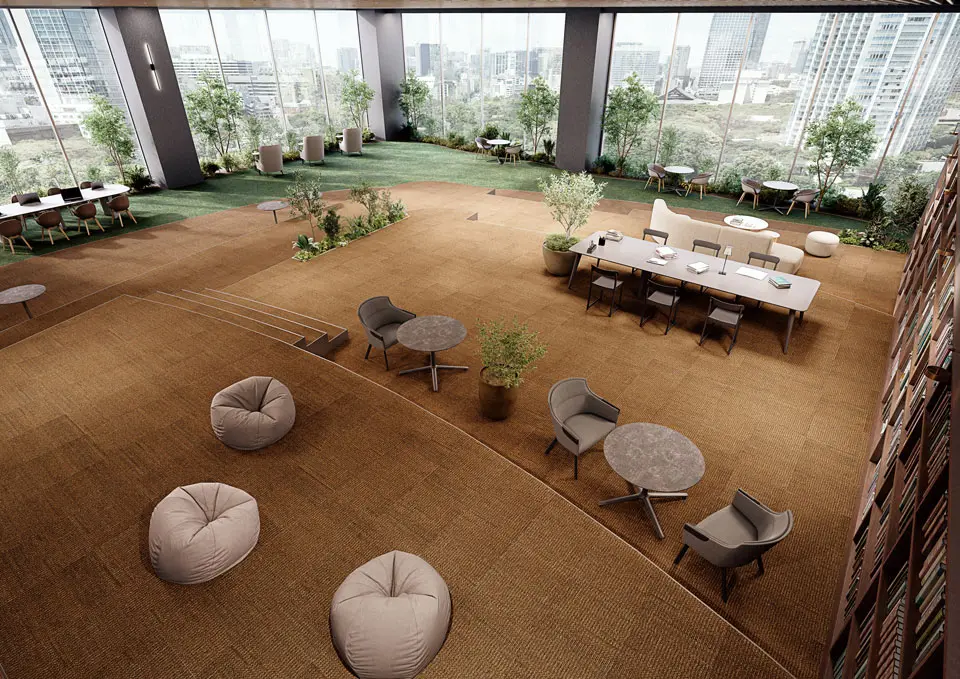 【SENSORY】 五感を満たす豊かさ DT92302・92601
見て触れて実感する豊かな質感。風合いや触り心地を追求し、五感を満たすワンランク上の空間を演出。
 施工例写真1 オフィス DT92302(右)・OT5474(左)
(写真2と同一品番)スタイリッシュかつ落ち着きのあるワークスペースを演出
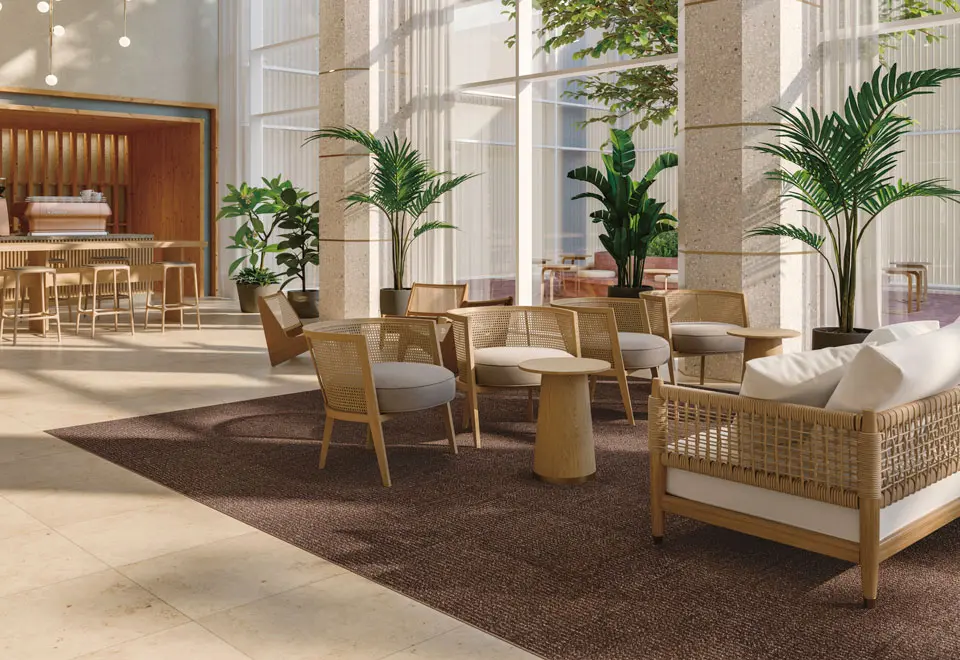 施工例写真2 ホテル DT92302(右)
(写真1と同一品番)上質かつリラックスできる、温もりのあるおもてなし空間へ
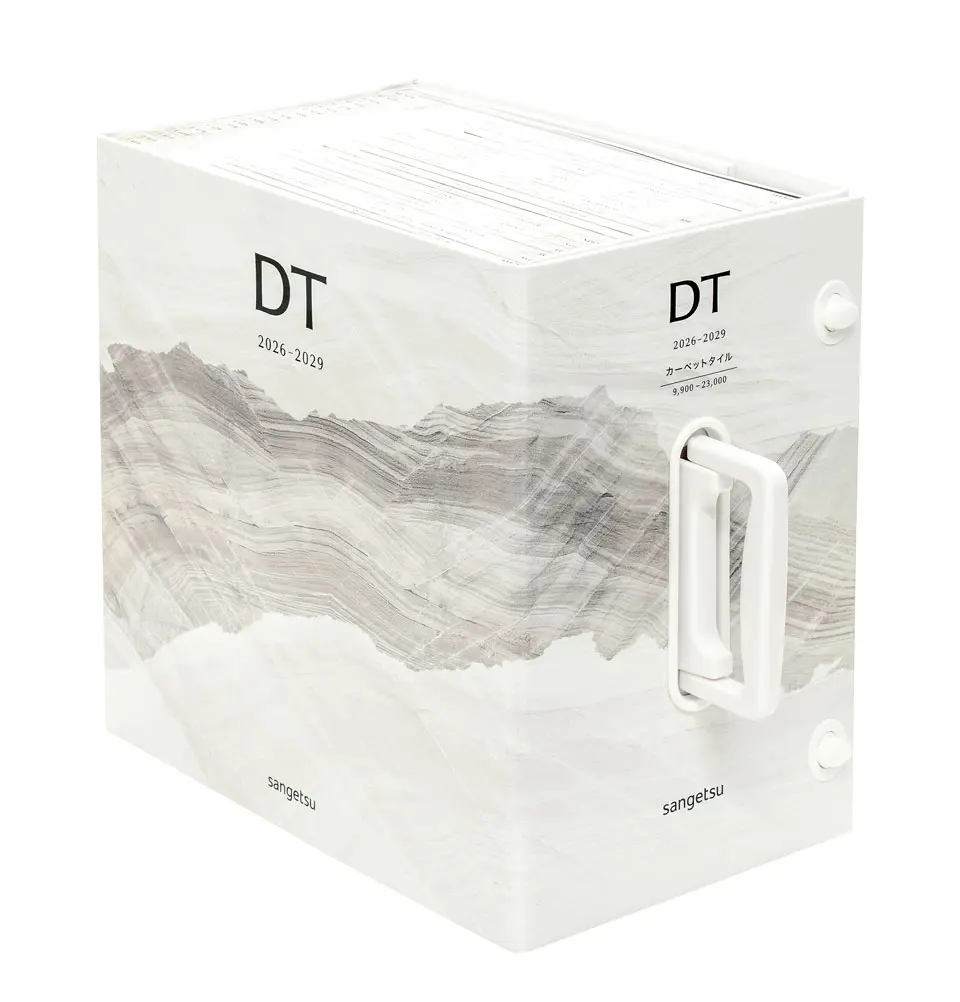 カーペットタイル見本帳「2026-2029 DT」
発刊日:2026年10月29日(木)
収録点数:58柄209点(前作55柄201点)
デジタルカタログ(10月29日より公開)
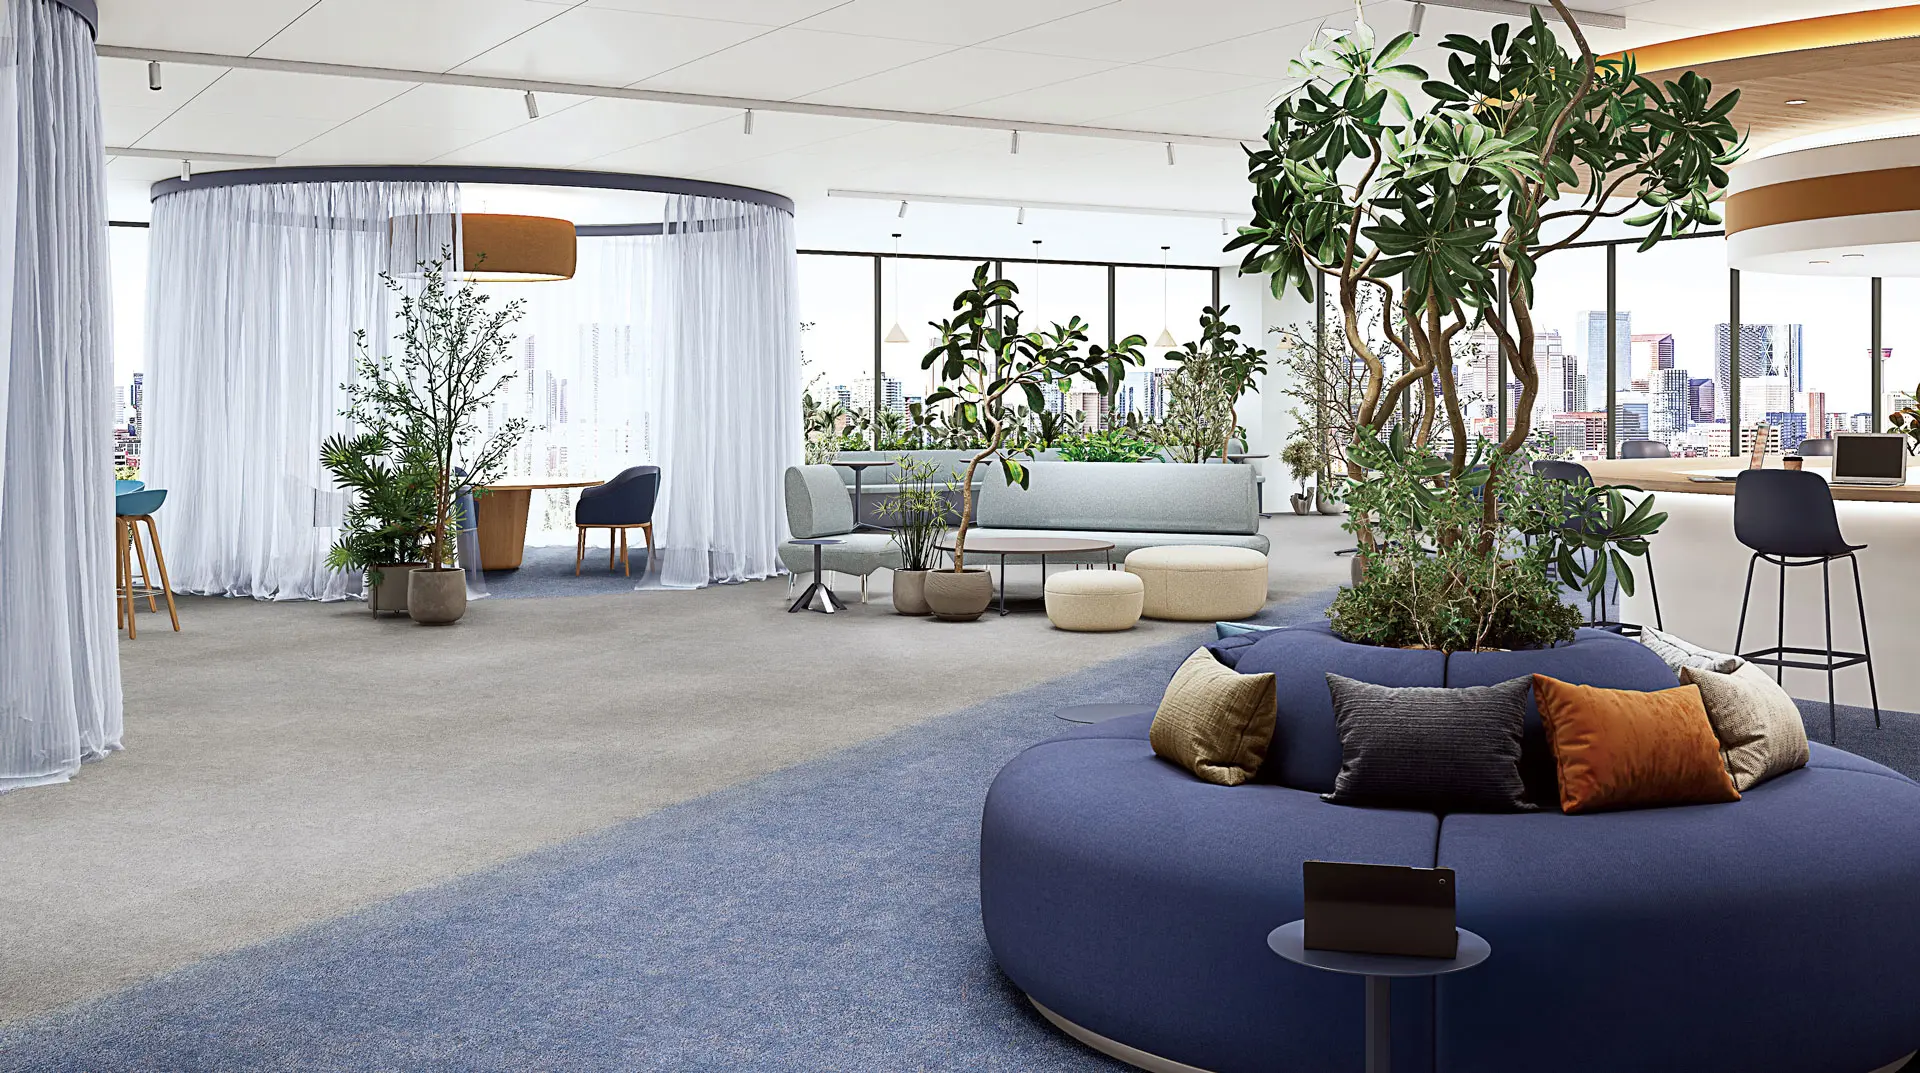 ARCHWAY NTH72501・72604・72704
 「BLEND」の代表シリーズ「ARCHWAY」
架け橋をモチーフに街並みの輪郭を織り込んだデザイン。各エリアを足元からゆるやかにつなぎ、心豊かなウェルビーイングな空間を演出
NTH72501・72605・72705
 グラデーションの貼り分けで空間としての統一感を保ちながら、エリアによる機能の違いをゆるやかに表現
NTH72501・72601・72701
 新シリーズ「ALTUS」のパイル糸には、ISCCマスバランス方式に基づき、36%のバイオサーキュラー・プラスチックが使用されている
NT32201・32203
 プランクタイプの新商品「BLANCVEIL」NT32301・32303
 カーペットタイル見本帳「2026-2029 NT700」
発刊日:2026年10月29日(木)
収録点数:32柄176点(前作34柄199点)
デジタルカタログ(10月29日より公開)
 カーペットタイル見本帳「2026-2029 NT350」
発刊日:2026年10月29日(木)
収録点数:16柄116点(前作16柄116点)
デジタルカタログ(10月29日より公開)
 「サンゲツデザインアワード2026」メインビジュアル
 サンゲツオフィス内で過去の受賞作品のプロトタイプを展⽰
 「アートパラ深川⼤賞 2026 全国公募展」サンゲツ賞
作家名:Kazue、作品タイトル:太陽がいっぱい
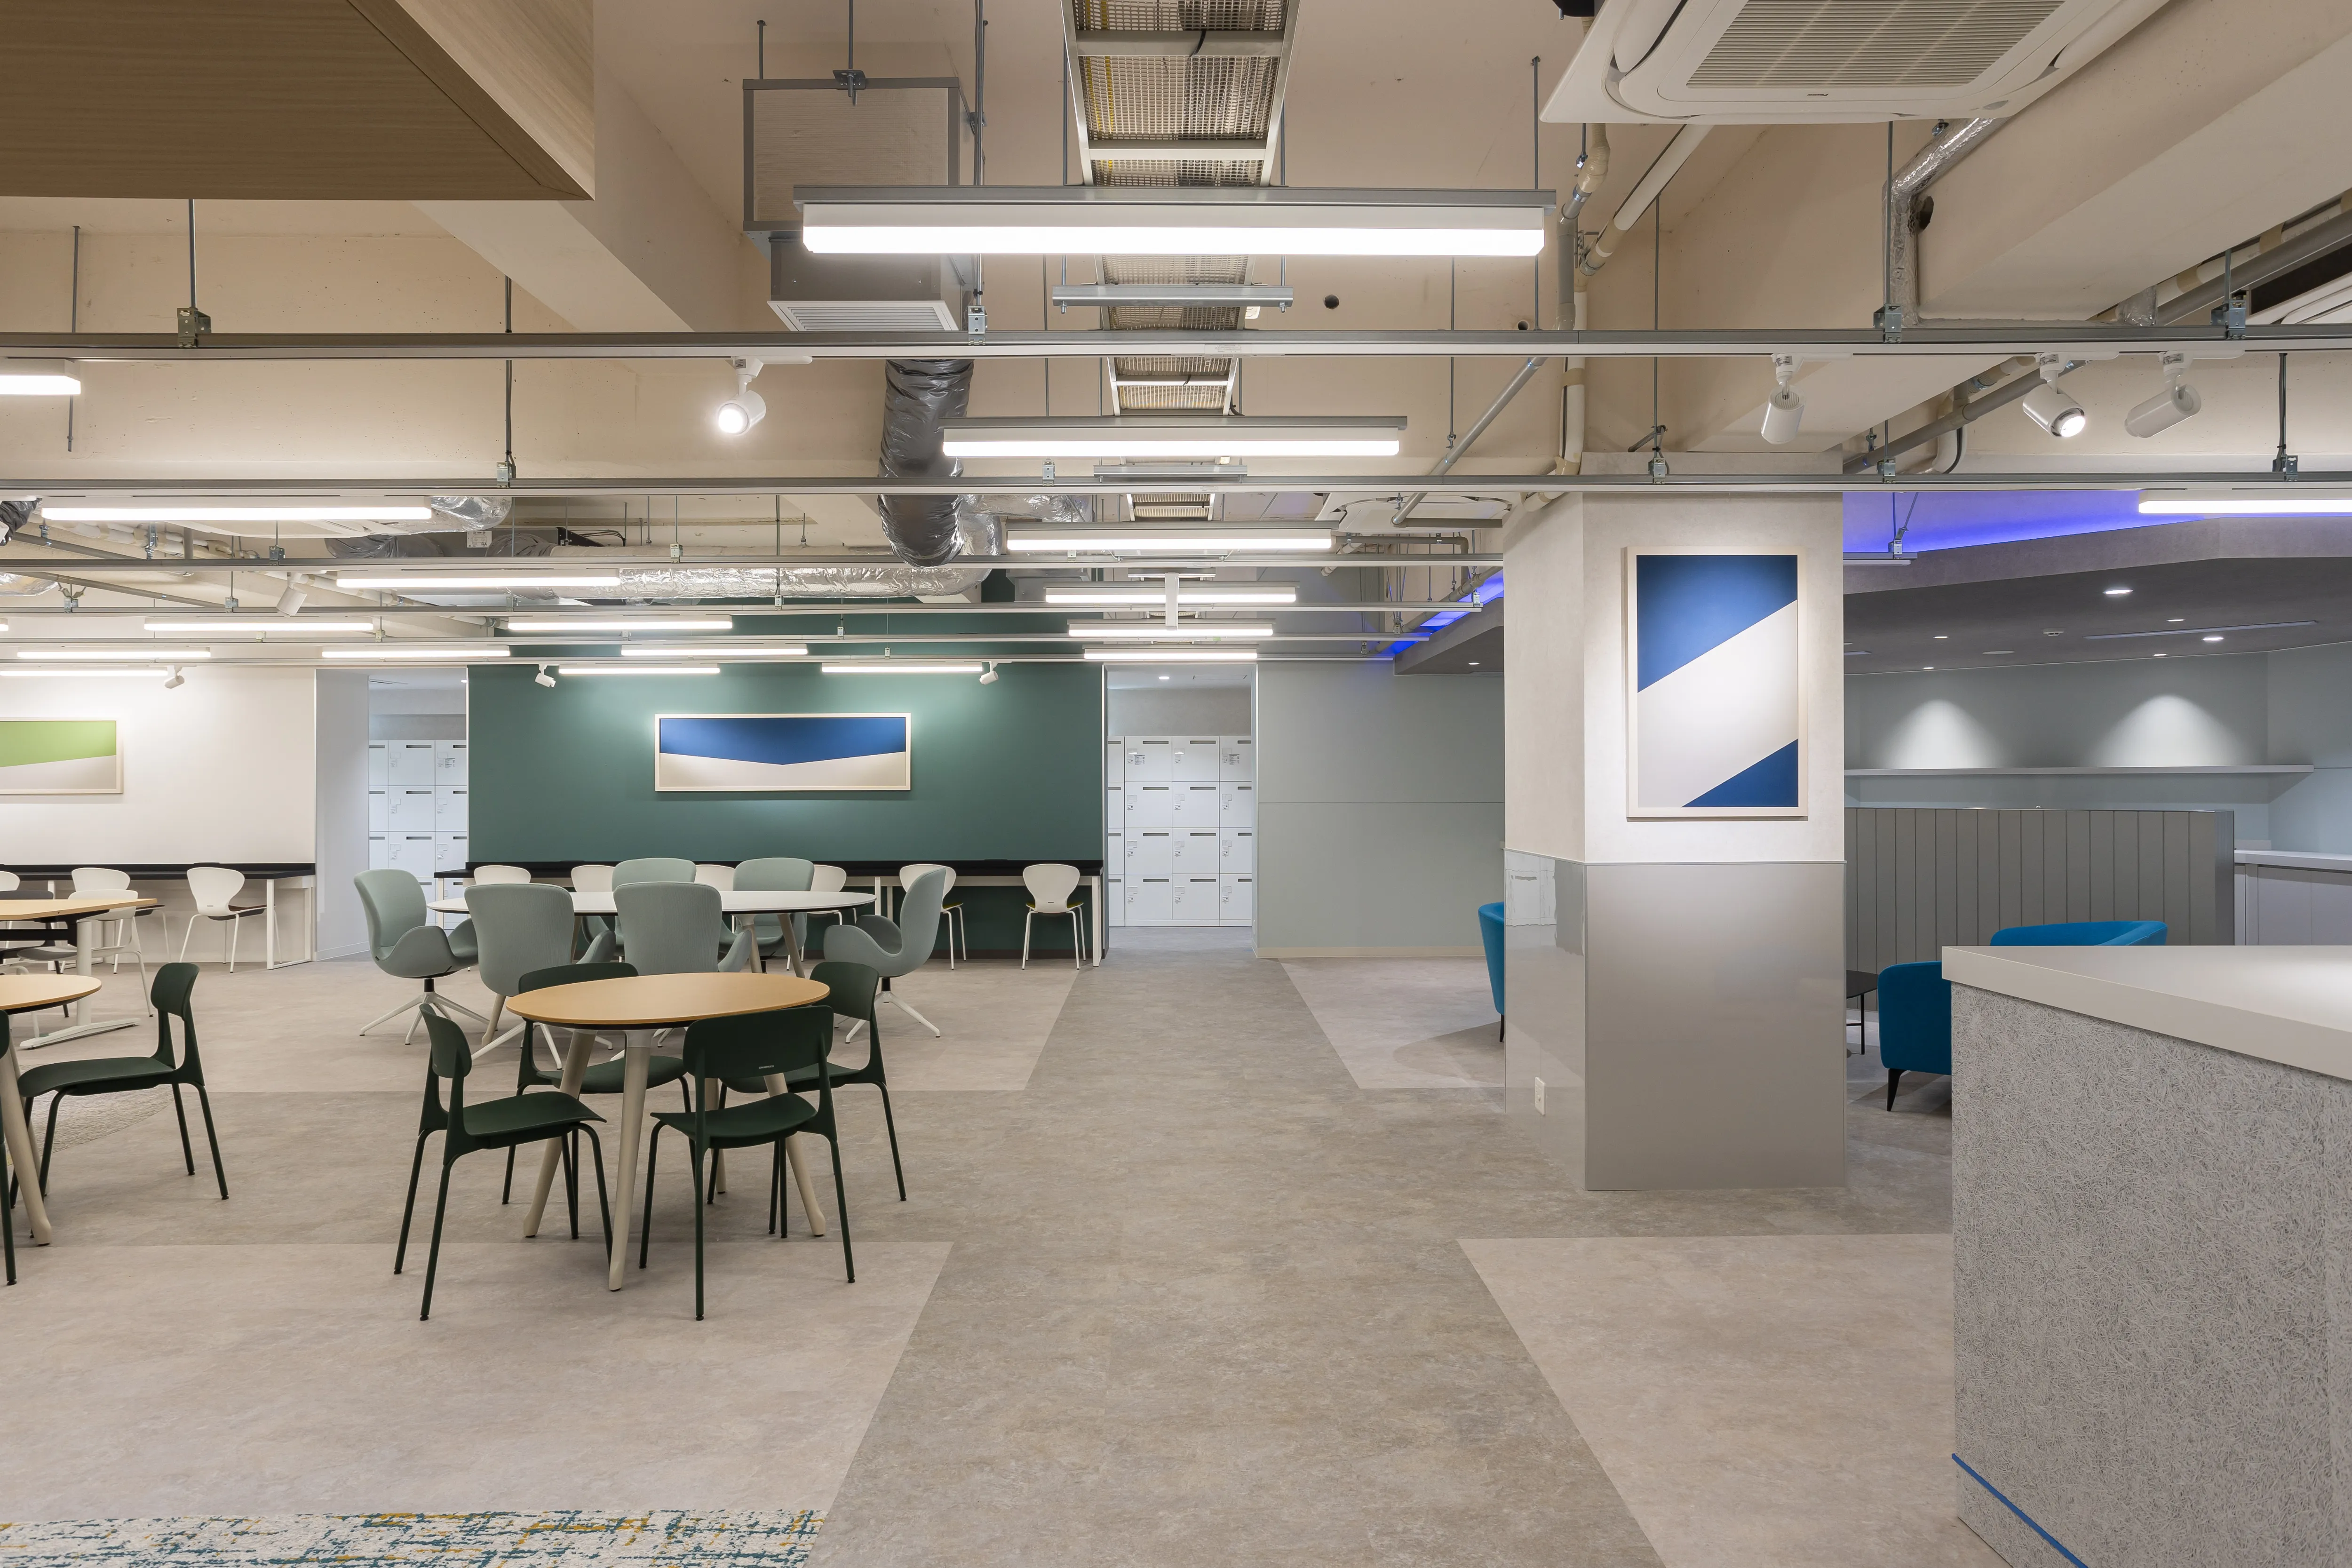
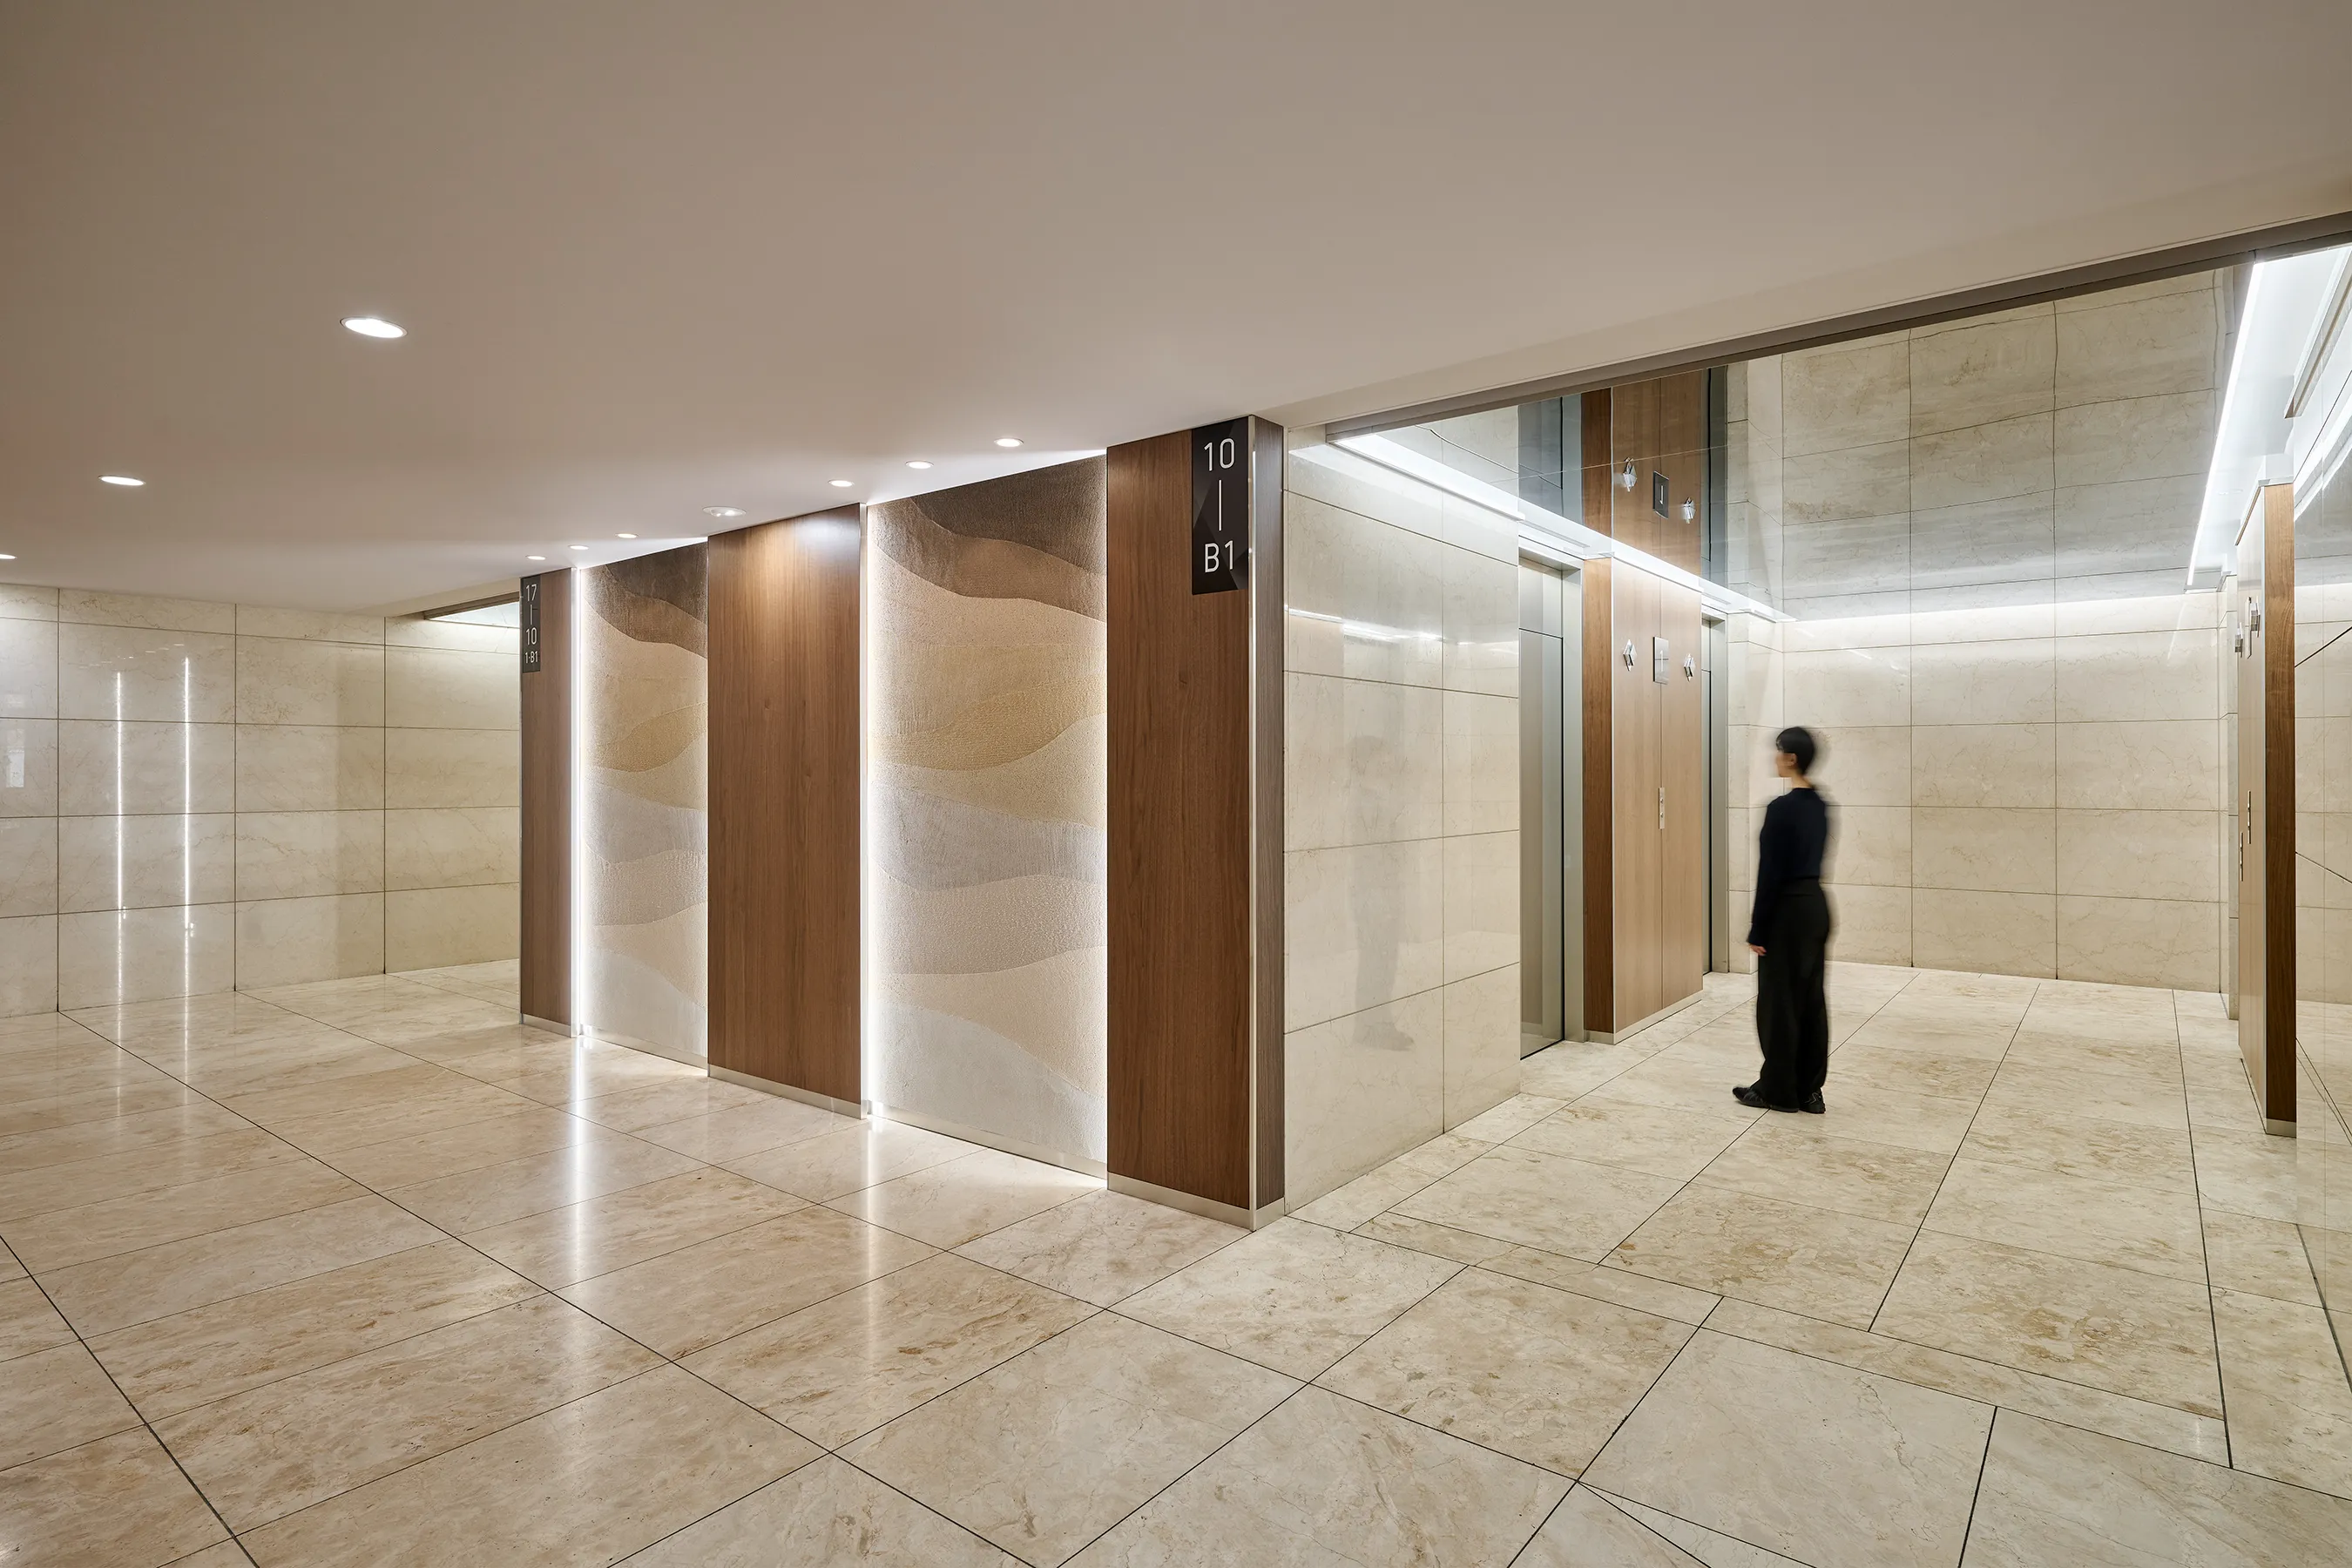
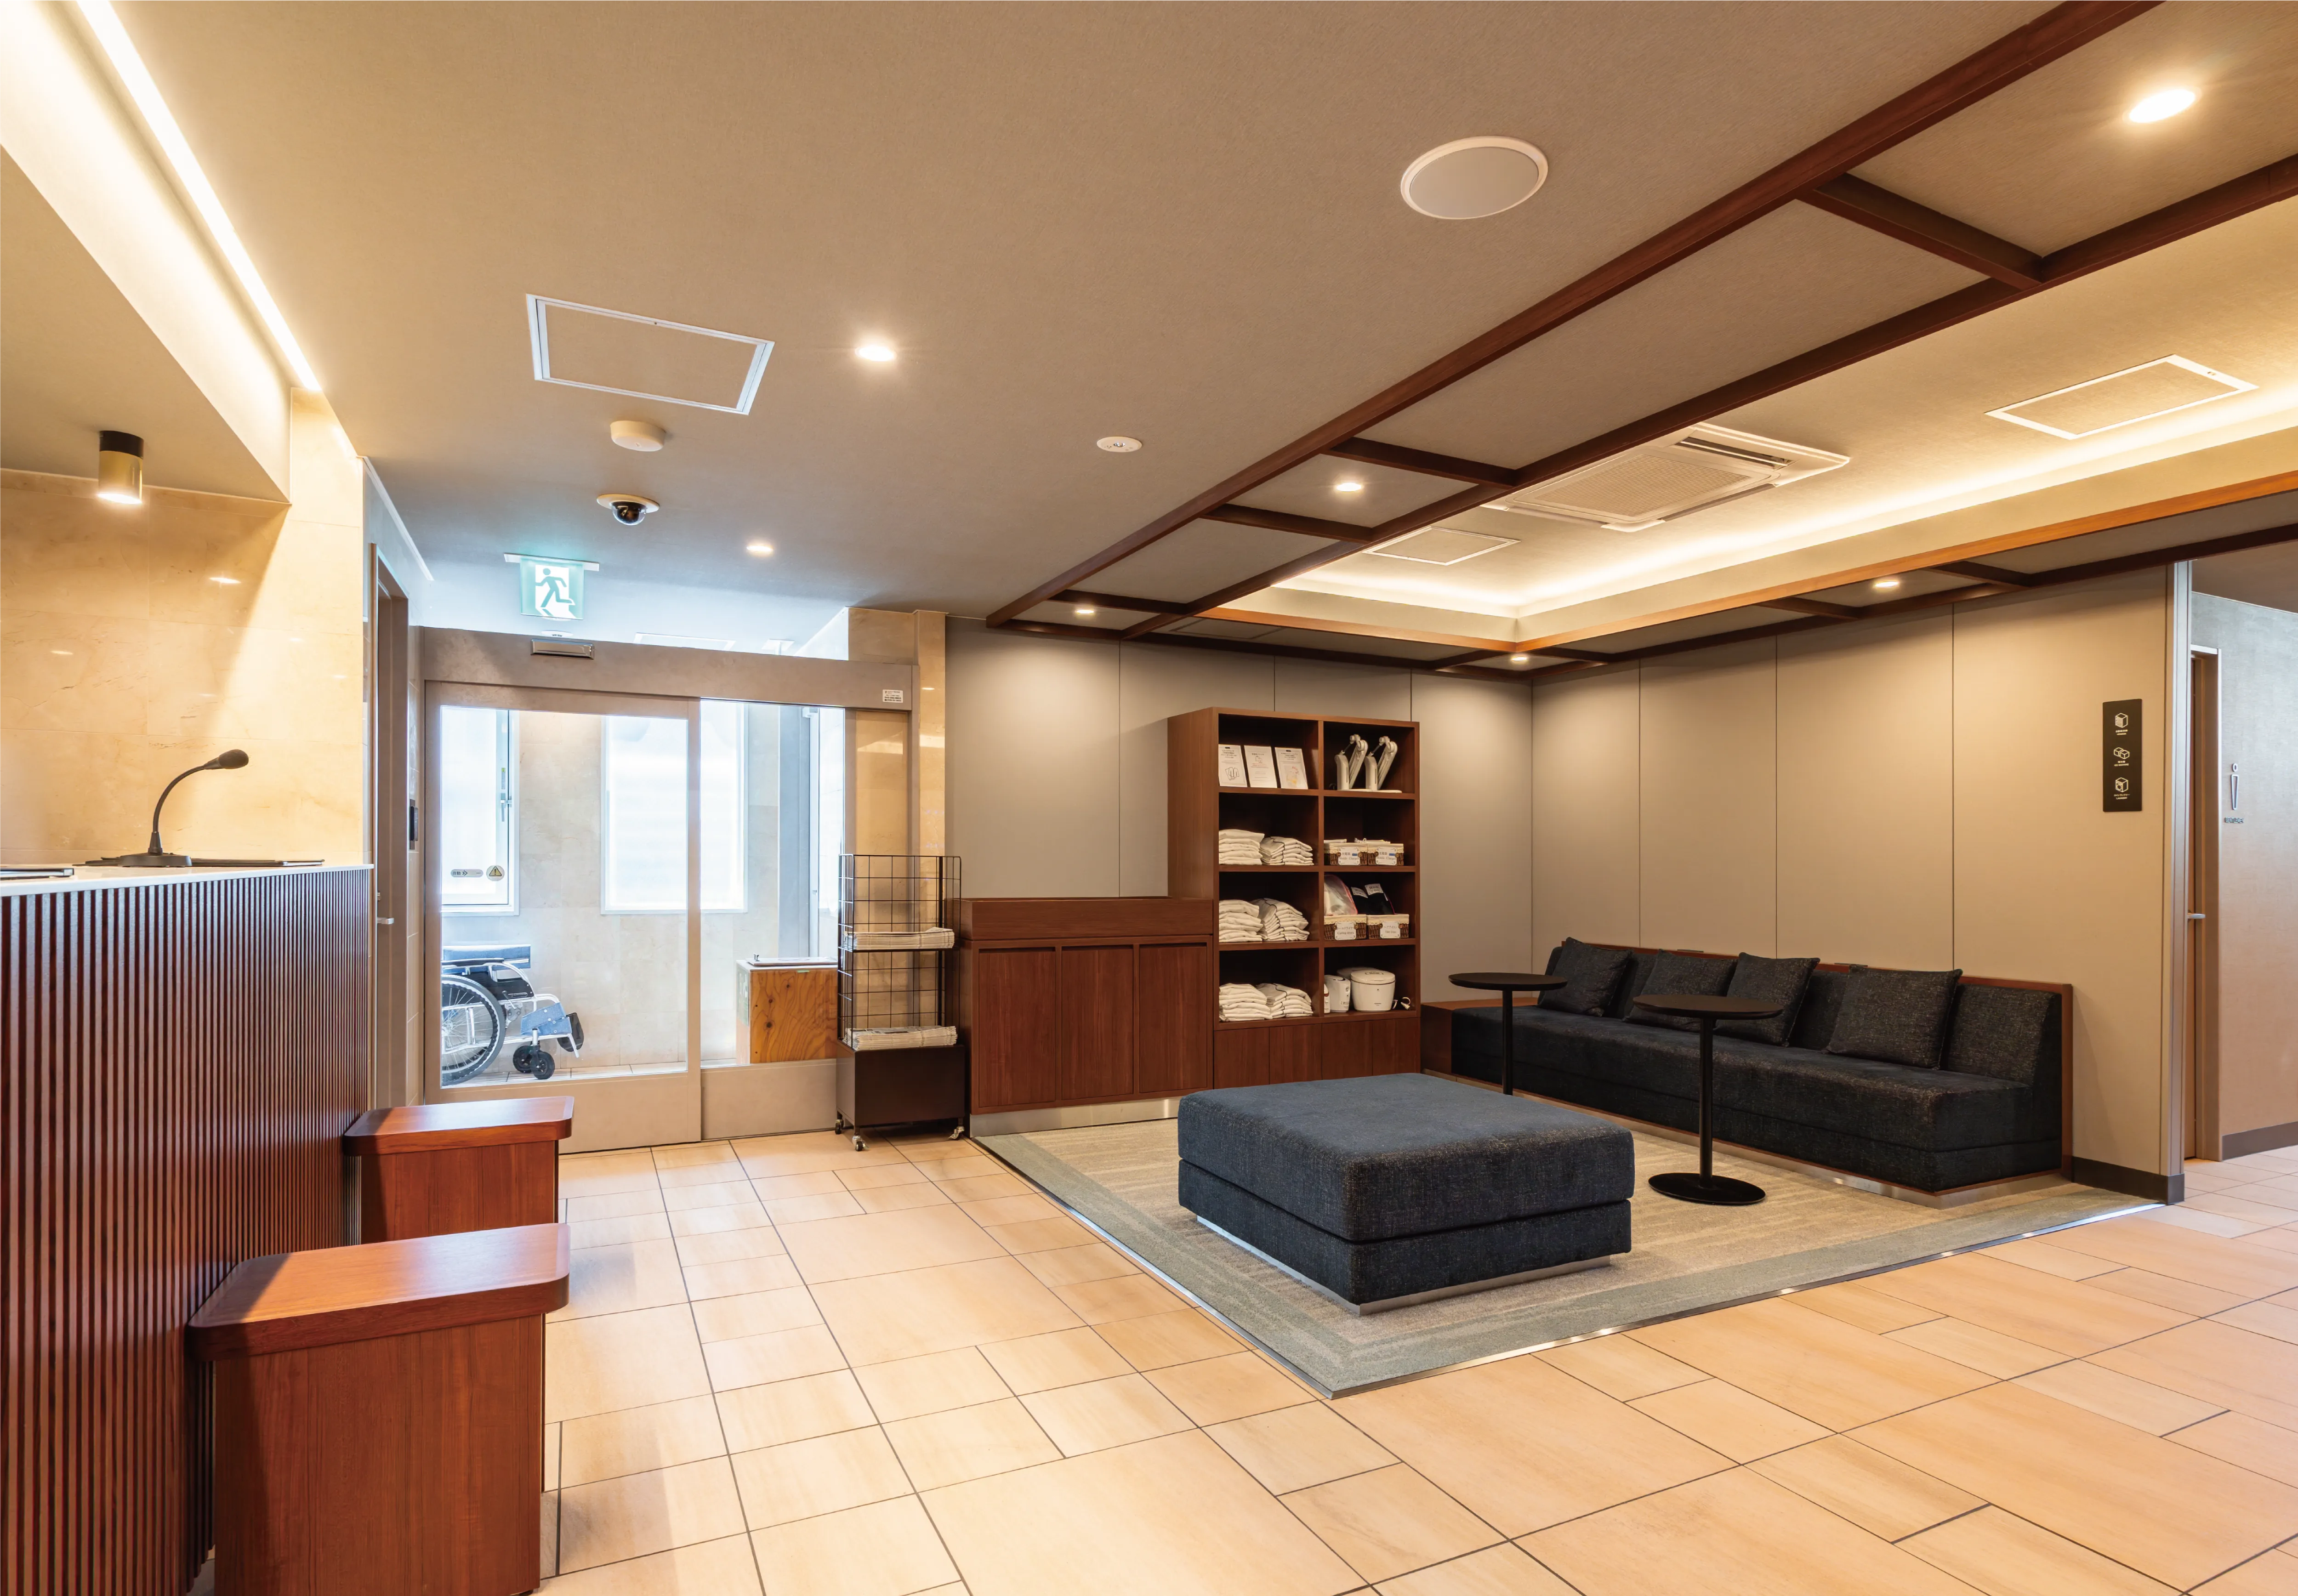
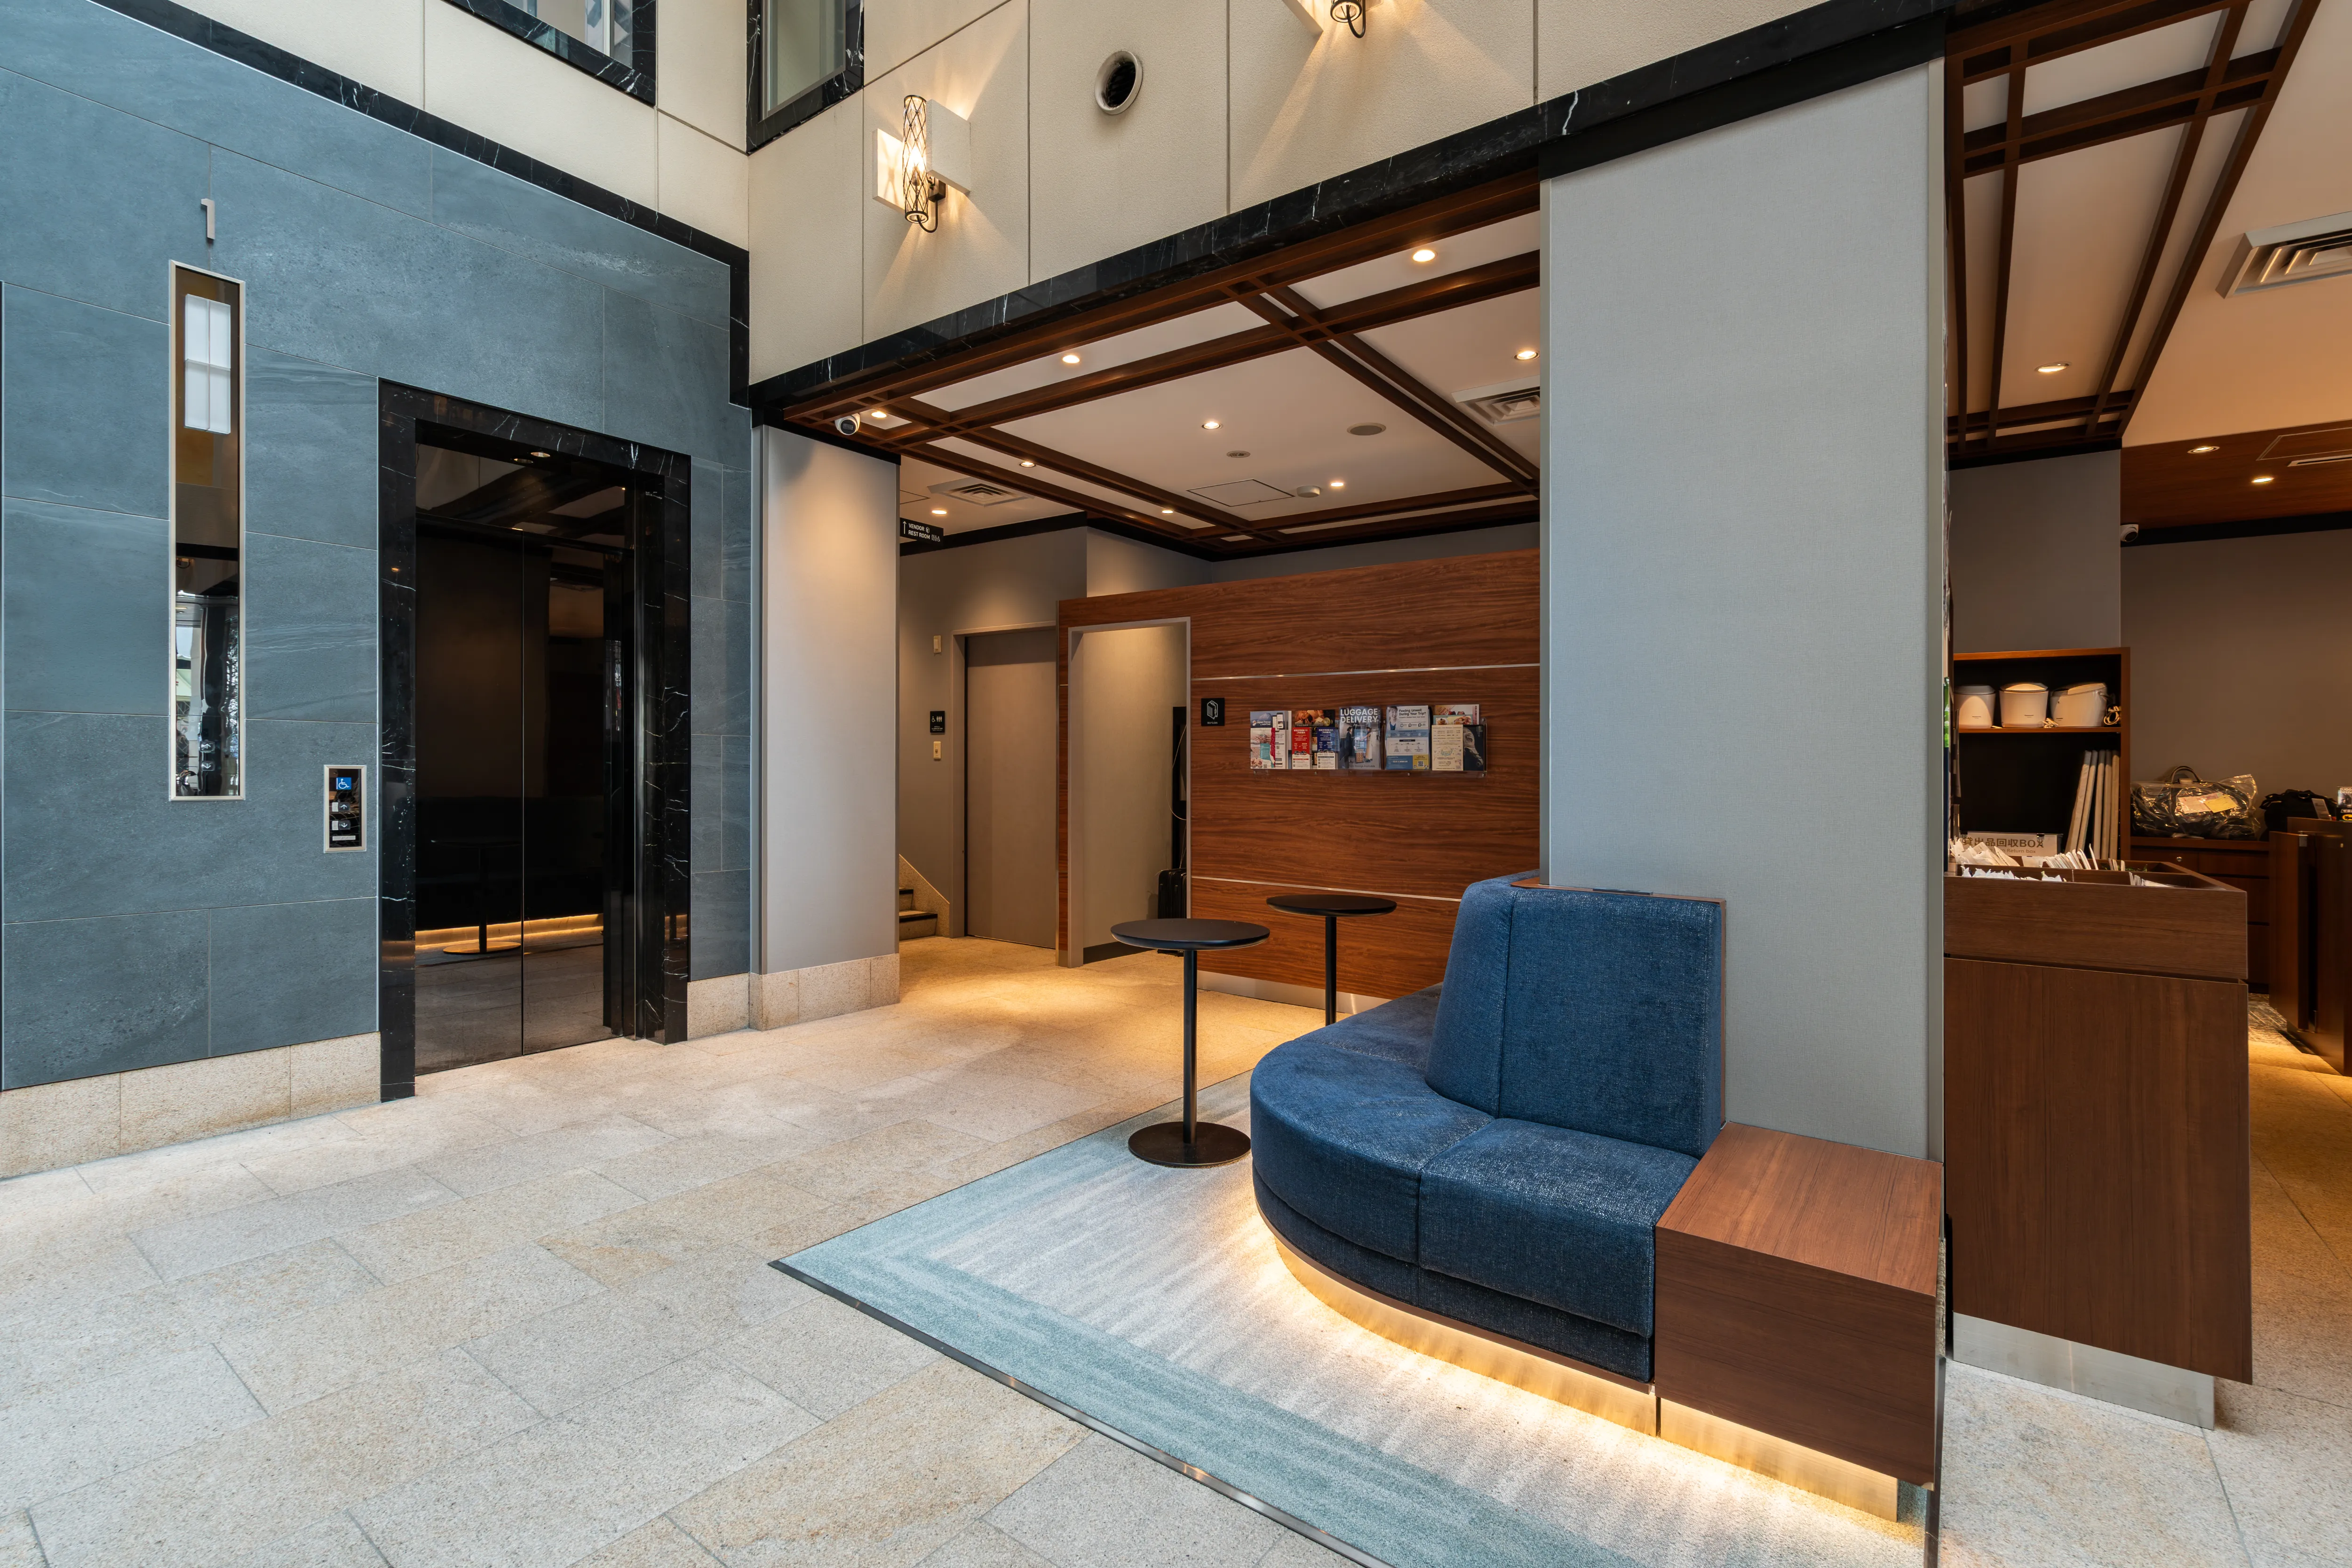


 Made in India Collection:ING105(ホワイトダリア)
 ING104(ワイルドパス)
価格:99,000円(税込)
サイズ:約140cm×約200cm(約1.8帖)
素材:レーヨン 63%、ポリエステル 37%
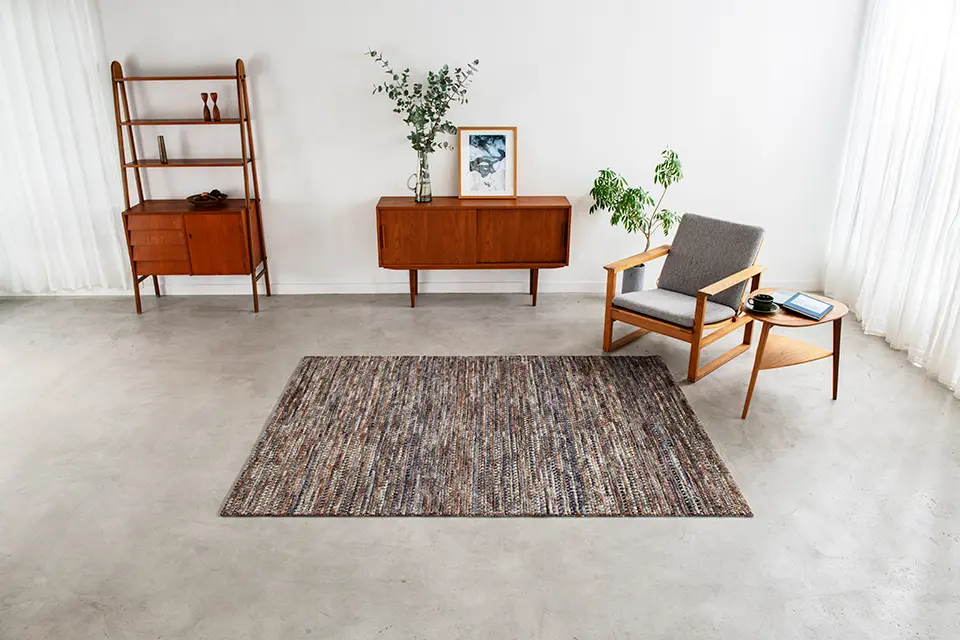 ING106(ディープコーブ)
価格:198,000円(税込)
サイズ:約140cm×約200cm(約1.8帖)
素材:ウール 100%
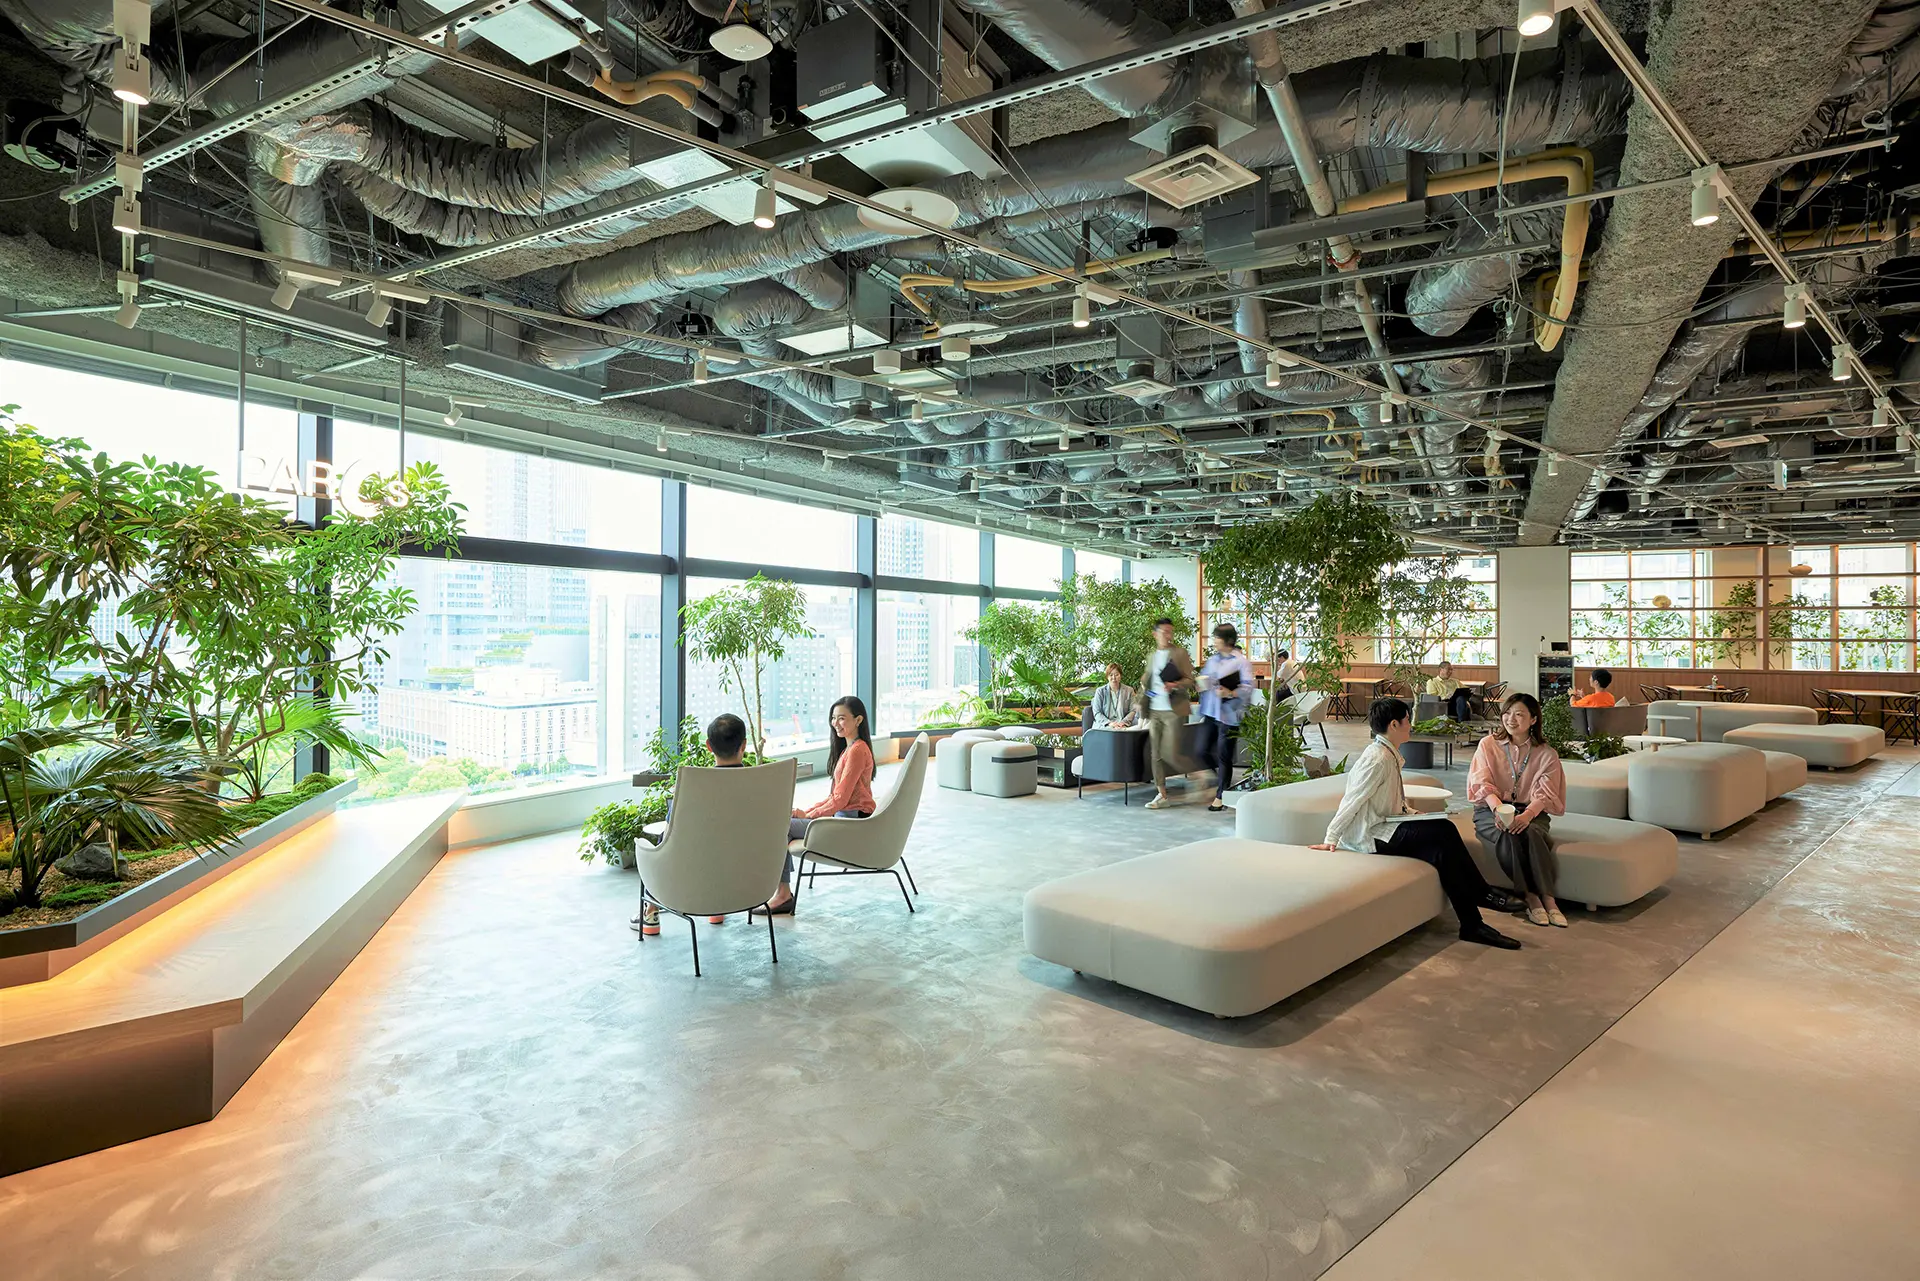 サンゲツ「PARCs Sangetsu Group Creative Hub」
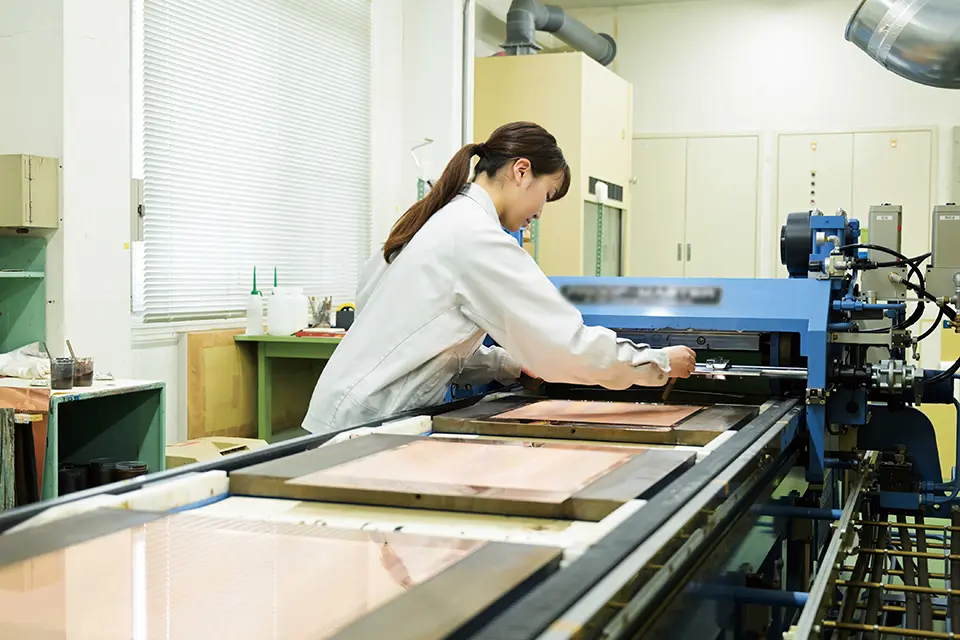 クレアネイト成田事業所
デザイン開発作業(グラビア印刷)の様子
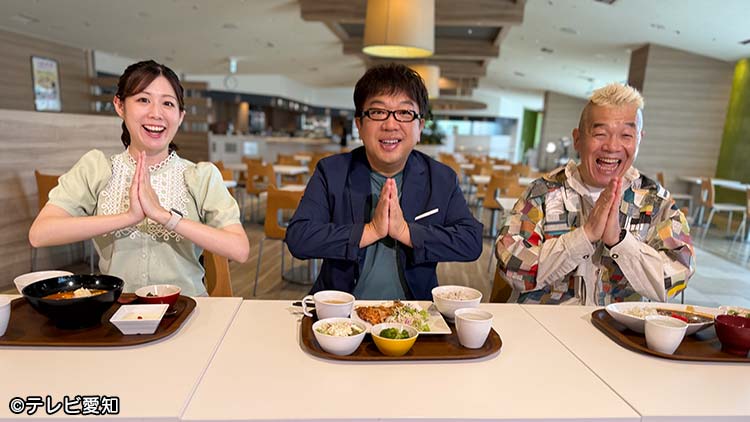
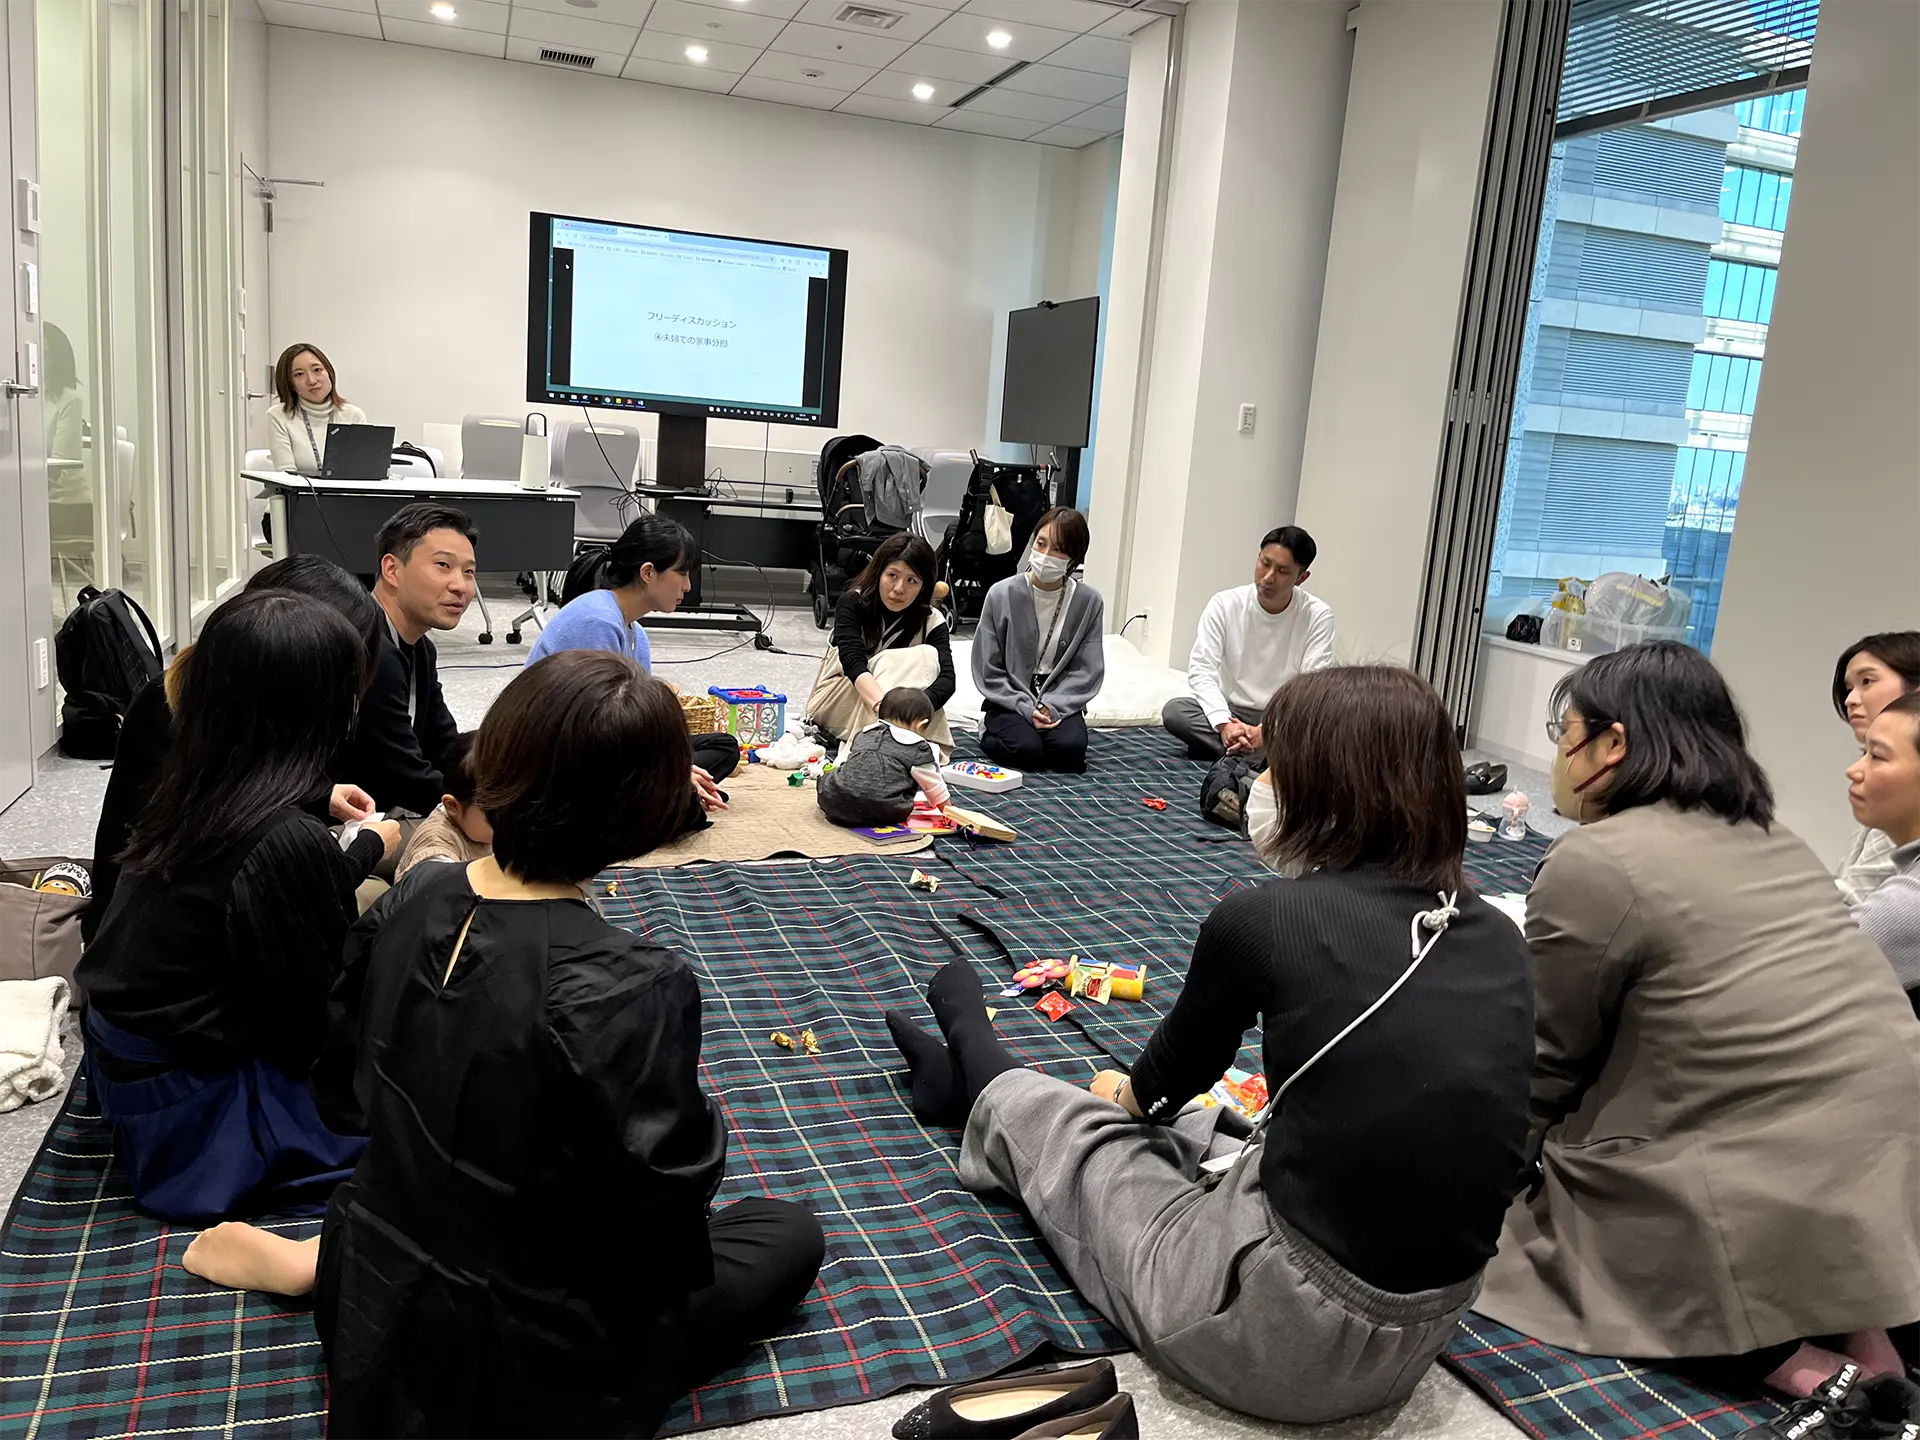 共育ての⾵⼟を育む、パパママ座談会の様⼦
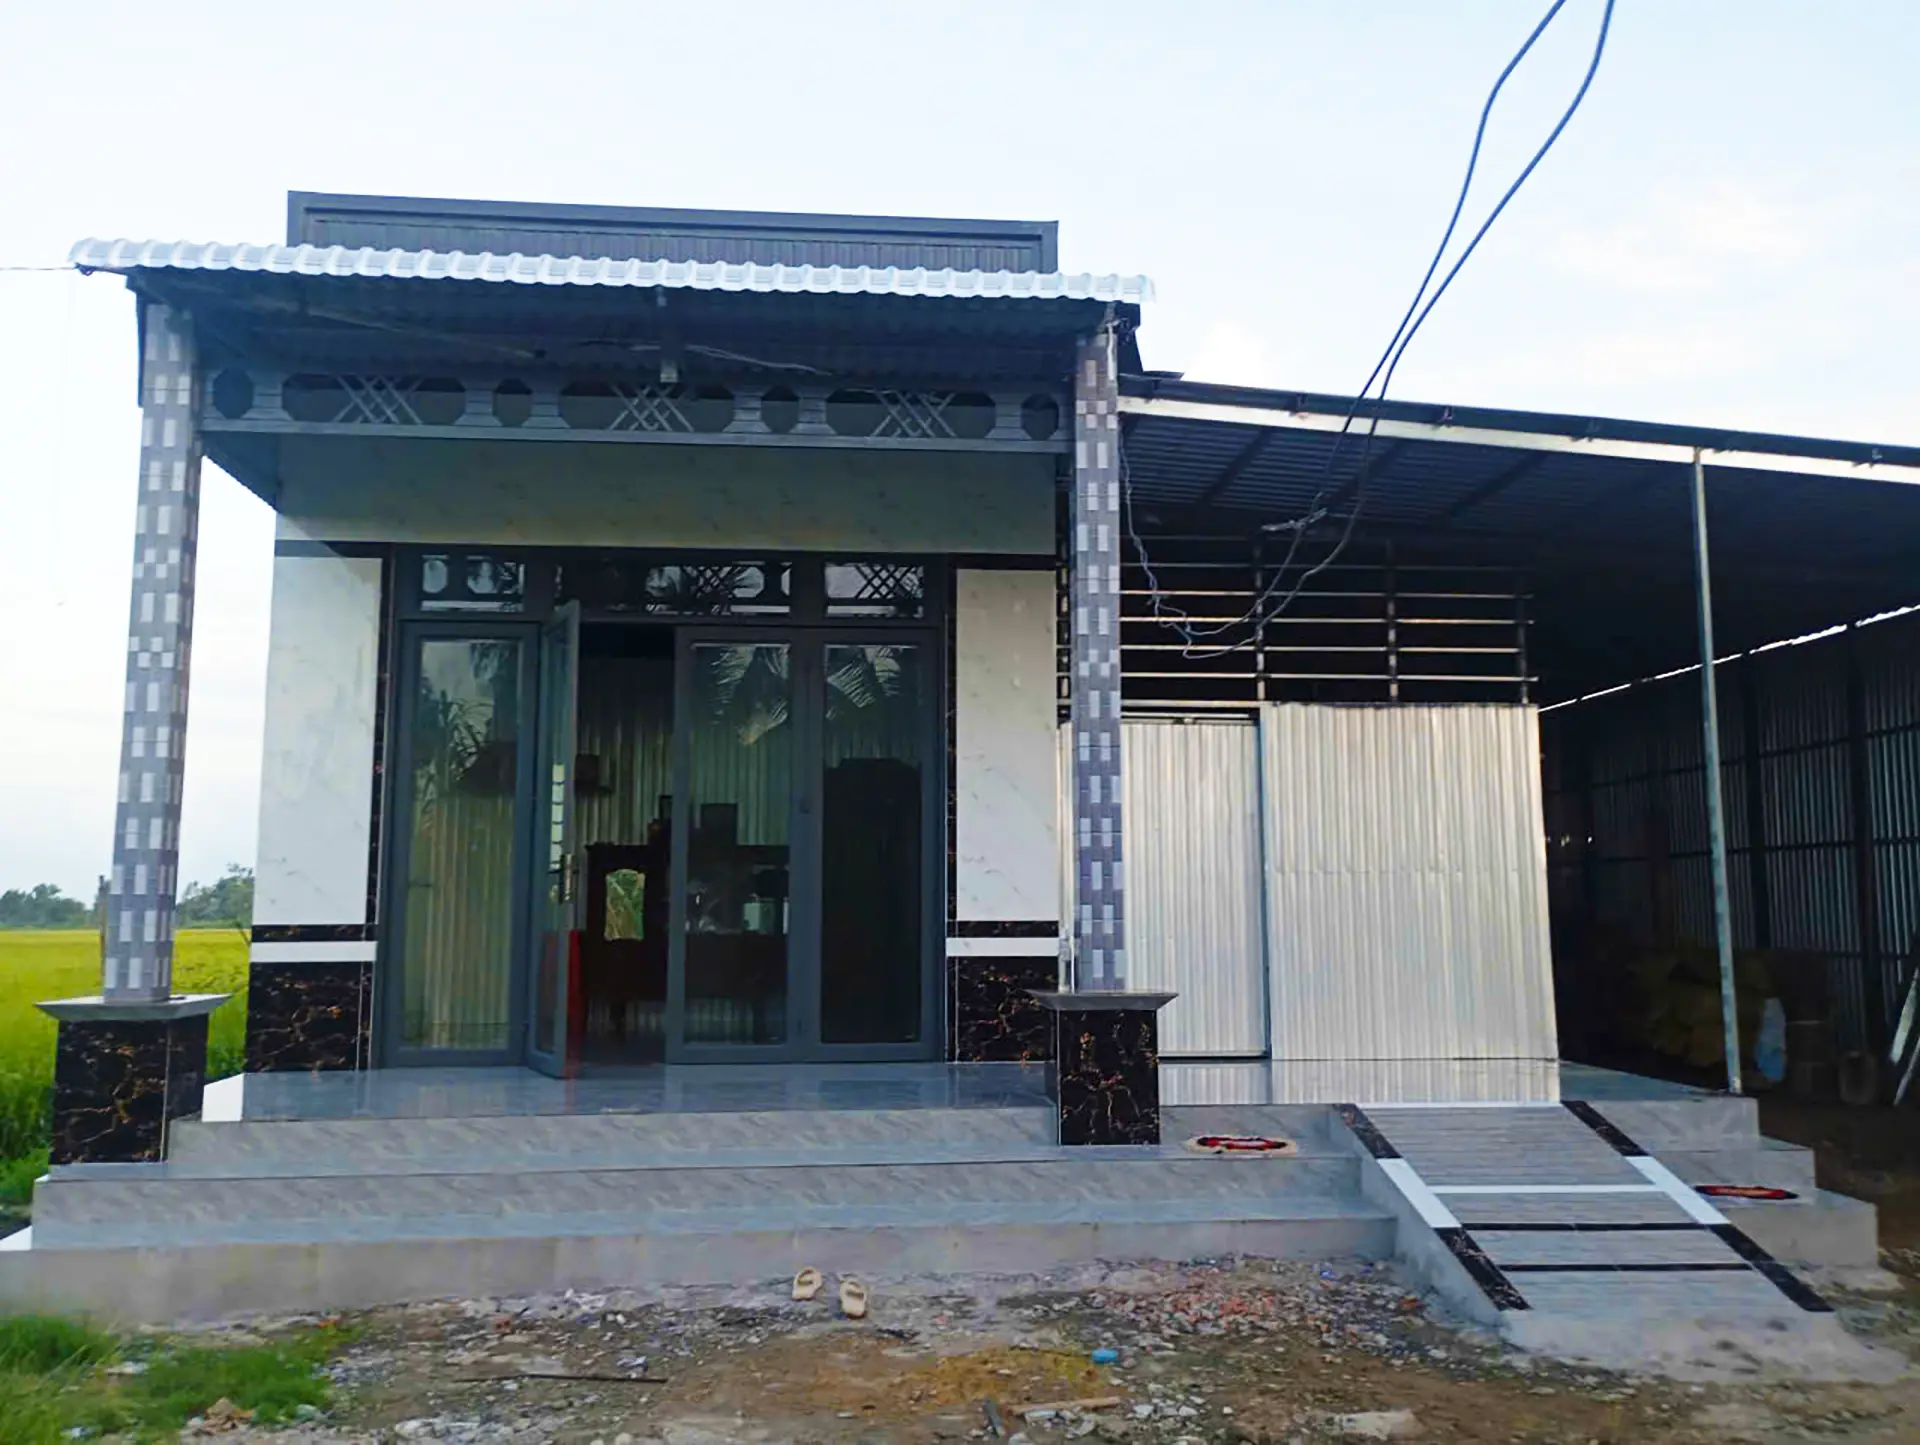 サンゲツが支援したベトナム・アンザン省ホアフン村 住宅建設プロジェクト
 雨季・台風の影響で浸水してしまった工事前の支援世帯住宅
 建設中の様子。地域住民の協力もあり建築技術の伝承にもつながった