変更報告書(特例対象株券等)(SMBC日興証券株式会社)
Bull 0
Bear 0
Routine
8125
Fiscal year ends February
Quarters are offset from the calendar — Q1 is Mar–May
|
Wakita & Co., LTD. operates in three main business segments: construction machinery, commercial equipment, and real estate. In the construction machinery segment, the company and its subsidiaries Chiba Lease Kogyo and Tohikou San engage in the sales and leasing of civil engineering, construction, and cargo handling machinery. The commercial equipment segment, supported by subsidiaries San Network Liv and Wakita Carenet, involves the sales and leasing of commercial facilities, audio-visual equipment, and care products. The real estate segment, managed by the company and subsidiary Cordia, includes the leasing and sale of commercial buildings and condominiums, as well as hotel operations. The group consists of the parent company and 16 consolidated subsidiaries. Summarised from the annual report, fiscal year ended Feb 2026 |
Industry Industrial Distribution | Homepage wakita.co.jp |
| Sector Industrials | IR page wakita.co.jp | |
|
Tags
construction machinery, cargo handling machinery, audio-visual equipment, care products, commercial real estate, hotel operations, equipment leasing, Chiba Lease Kogyo, Tohikou San, San Network Liv, Wakita Carenet, Cordia
|
Press page wakita.co.jp/ir/news |
Metrics
| Valuation | |
|---|---|
| Market cap | ¥ 100.089B |
| Market cap (USD) | $ 625.563M |
| P/E | 28.69 |
| PEG | — |
| P/BV | 1.01 |
| P/S | 1.03 |
| P/OCF | 8.65 |
| P/FCF | 10.62 |
| Dividend yield | 5.2% |
| Turnover / mcap | — |
| Returns | |
|---|---|
| ROE | 3.4% |
| ROI | 3.3% |
| ROIC | 3.2% |
| Profit margin | 3.7% |
| Growth | |
|---|---|
| Revenue growing | Yes |
| Profits growing | No |
| Revenue up 3y | Yes |
| Revenue up 5y | Yes |
| Earnings growth 3y (net profit CAGR) | -4.0% |
| Quality | |
|---|---|
| Profitable | Yes |
| Margin expanding | No |
| Buying back stock | No |
| Diluting (TTM) | No |
| Debt/Equity | — |
| Podcast bulls (TTM) | Sign up |
| Podcast bears (TTM) | Sign up |
| Podcast sentiment (TTM) | Sign up |
| Podcast sentiment % (TTM) | Sign up |
| News sentiment (TTM) | 20 |
| Quality score | 0% |
| Insiders | |
|---|---|
| Buys, 1w | Sign up |
| Buys, 1m | Sign up |
| Buys, 1y | Sign up |
| Sells, 1w | Sign up |
| Sells, 1m | Sign up |
| Sells, 1y | Sign up |
Sign up to see this company's insider trades
| Figure | FY 2026 | FY 2025 | FY 2024 | FY 2023 | FY 2022 | FY 2021 | FY 2020 | FY 2019 | FY 2018 | FY 2017 | FY 2016 | FY 2015 | FY 2014 | FY 2013 |
|---|---|---|---|---|---|---|---|---|---|---|---|---|---|---|
| Revenue | 93.222B | 92.321B | 88.654B | 78.87B | 74.989B | 74.015B | 82.275B | 70.479B | 63.739B | 61.886B | 57.617B | 57.634B | 53.82B | 48.084B |
| Net profit | 3.451B | 3.912B | 3.158B | 3.901B | 3.573B | 3.191B | 3.607B | 4.184B | 3.914B | 3.718B | 4.539B | 5.394B | 5.177B | 2.719B |
| Free cash flow | 11.793B | 15.095B | 11.292B | -1.77B | 11.423B | 8.15B | 6.889B | 5.806B | 8.959B | 9.757B | — | — | — | — |
| Figure | FY 2026 | FY 2025 | FY 2024 | FY 2023 | FY 2022 | FY 2021 | FY 2020 | FY 2019 | FY 2018 | FY 2017 | FY 2016 | FY 2015 | FY 2014 | FY 2013 |
|---|---|---|---|---|---|---|---|---|---|---|---|---|---|---|
| Share price | 2.048K | 1.687K | 1.535K | 1.126K | 996.58 | 935.26 | 875.14 | 1.184K | 1.294K | 1.029K | 820.46 | 1.16K | 1.136K | 790.39 |
| Price performance 12m | 0.21 | 0.1 | 0.36 | 0.13 | 0.07 | 0.07 | -0.26 | -0.09 | 0.26 | 0.25 | -0.29 | 0.02 | 0.44 | — |
Filed figures
Lines the statements and their notes report beside the headline figures, read from the filings' XBRL as filed (no restatement applied), with figures computed from one filing's own lines. Cash-flow lines carry their cash direction: an outflow is negative. Each period links to its filing; a figure's period, report date and tag are in its tooltip.
| Figure | Feb 2019 | Mar 2019 | Feb 2020 | Feb 2021 | Feb 2022 | Feb 2023 | Mar 2023 | Feb 2024 | Feb 2025 | Feb 2026 |
|---|---|---|---|---|---|---|---|---|---|---|
| Balance sheet detail | ||||||||||
| Trade receivables (JPY) | 26.8B | 26.8B | 30.4B | 25B | 22.4B | 20.2B | 20.2B | 20.3B | 19.1B | 19.6B |
| ↳ YoY growth | +9.0% | +9.0% | +13.2% | -17.8% | -10.1% | -10.0% | -10.0% | +0.4% | -5.7% | +2.6% |
| ↳ 5y CAGR | +1.9% | -1.3% | -3.9% | -3.9% | -5.5% | -8.9% | -4.7% | |||
| Borrowings, current (JPY) | 2.56B | 2.56B | 2.19B | 1.54B | 1.18B | 1.04B | 1.04B | 659M | 320M | 198M |
| Borrowings, non-current (JPY) | 434M | 434M | 6M | 3M | 172M | 543M | 543M | 424M | 403M | 226M |
| Lease liabilities (JPY) | 46M | 46M | 25M | 25M | 20M | 42M | 42M | 107M | 107M | 1.09B |
| Cash and deposits (JPY) | 23.2B | 23.2B | 17.5B | 21.1B | 27.8B | 20.2B | 20.2B | 18.3B | 21.2B | 16.3B |
| Intangible assets (JPY) | 5.84B | 5.84B | 9.37B | 8.39B | 7.8B | 6.71B | 6.71B | 12B | 10.7B | 13.6B |
| Net debt (borrowings + leases - cash) (JPY) | -20.1B | -20.1B | -15.3B | -19.6B | -26.4B | -18.6B | -18.6B | -17.1B | -20.4B | -14.8B |
| Cash flow detail | ||||||||||
| Operating cash flow (JPY) | 10.6B | 10.6B | 9.37B | 13.2B | 15.5B | 4.17B | 4.17B | 12.8B | 15.6B | 12.5B |
| Purchases of property, plant and equipment (JPY) | -4.79B | -4.79B | -2.49B | -5.08B | -4.08B | -5.94B | -5.94B | -1.48B | -516M | -689M |
| Change in receivables (cash effect) (JPY) | 195M | 195M | -2.93B | 5.41B | 2.74B | 2.34B | 2.34B | 772M | 1.27B | 241M |
| Change in inventories (cash effect) (JPY) | -73M | -73M | 533M | 62M | 200M | -1.23B | -1.23B | 1.11B | 1.59B | -283M |
| Change in payables (cash effect) (JPY) | 905M | 905M | 2.02B | -2.15B | 3.31B | -8B | -8B | -1.07B | -51M | 544M |
| Dividends paid (cash effect) (JPY) | -1.56B | -1.56B | -1.56B | -1.72B | -1.56B | -1.72B | -1.72B | -1.91B | -3.07B | -4.95B |
| Share buybacks (cash effect) (JPY) | -91M | -91M | 0.00 | 0.00 | -60M | -2B | -2B | -1.14B | -65M | 0.00 |
| Interest paid (cash effect) (JPY) | -92M | -92M | -98M | -101M | -105M | -144M | -144M | -190M | -203M | -222M |
| Income taxes paid (cash effect) (JPY) | -2.36B | -2.36B | -2.28B | -2.43B | -2.38B | -2.74B | -2.74B | -2.57B | -2.26B | -2.52B |
| Operating cash flow before change in receivables (JPY) | 10.4B | 10.4B | 12.3B | 7.82B | 12.8B | 1.83B | 1.83B | 12B | 14.3B | 12.2B |
| Free cash flow (OCF - PPE - intangibles) (JPY) | 5.81B | 5.81B | 6.89B | 8.15B | 11.4B | -1.77B | -1.77B | 11.3B | 15.1B | 11.8B |
| Income detail | ||||||||||
| Research and development expense (JPY) | — | — | — | — | — | — | — | 21M | 17M | 26M |
| Total comprehensive income (JPY) | 3.65B | 3.65B | 3.52B | 3.75B | 3.91B | 3.97B | 3.97B | 4.26B | 3.9B | 5.24B |
| Comprehensive income to owners (JPY) | 3.57B | 3.57B | 3.43B | 3.64B | 3.75B | 3.82B | 3.82B | 4.15B | 3.82B | 5.16B |
| Provision for credit losses (JPY) | 80M | 80M | 203M | -62M | 40M | 72M | 72M | 83M | 80M | 100M |
| Credit cost ratio (credit losses / average receivables) (%) | 0.3% | 0.3% | 0.7% | 0.2% | 0.2% | 0.3% | 0.3% | 0.4% | 0.4% | 0.5% |
| Reported | May 24, 2019 | May 29, 2020 | May 28, 2021 | May 28, 2021 | May 30, 2022 | May 29, 2023 | May 27, 2024 | May 26, 2025 | May 26, 2025 | May 25, 2026 |
Sign up to see institutional holdings
Sign UpPodcast Mentions
Sign up to see podcast mentions and sentiment
Sign UpFilings with EDINET (periodic reports, extraordinary reports, offerings, holding and buy-back reports), newest first, titles as filed in Japanese. The link opens the filing on EDINET. Press releases from the company's own website, newest first.
Wave Forum・北海道幸友会 合同見学会を実施
Bull 0
Bear 0
Routine
2026-10-28
このたび、当社が事務局を務める「お客様のための会」である『Wave Forum』と、仕入先様との共通の共存共栄を目的に活動する『北海道幸友会』との合同見学会を実施いたしましたので、その内容をご報告いたします。
■Wave Forum・北海道幸友会 活動実績
●『Wave Forum・北海道幸友会 合同見学会レポート』(PDF)
**<Wave Forum・北海道幸友会 合同見学会>
**
・開催日/2026年9月17日(木)9:30~10:30(1時間)
・場 所/北海道新幹線 札幌車両基高架橋工事現場
・参加者/18名( WaveForum会員8社8名、北海道幸友会会員8社8名、ワキタ社員2名)
・内 容/札幌車両基地の概要説明、土木工事、建築工事内容説明並びに各現場箇所見学
WaveForum北海道地区での初企画として、北海道幸友会の会員様にもご参加いただき、初めての合同見学会を開催しました。本見学会は、 WaveForum会員様及び北海道幸友会会員様との関係強化を図るとともに、注目事業である北海道新幹線の札幌車両基高架橋工事現場を見学し、業界に関する知見を深めることを目的に企画しました。
■Wave Forumについて
「Wave Forum」は、「Wakita」「Ascending(上昇する)」「Vision(ヴィジョン)」「Energy(エナジー)」の頭文字から名付けられた、お客様のための新しいカタチの会です。

■幸友会・浪華会について
幸友会、浪華会は当社と仕入先様との共通の目的を達成するために、会員相互の親睦を深め、共存共栄の実を上げることを目的として活動しています。

当社は本会を通じて、お客様のお役に立つ情報発信、情報共有、ご提案に継続的に努めてまいります。また、他社にはない総合力を有する商社として、仕入先様の皆様とともに、変化の激しい経済環境を乗り越え、さらなる発展を目指してまいります。
【本件に関するお問い合わせ】
株式会社ワキタ
社長室 TEL:06-6449-1900
SNS公式アカウント
 新しいウィンドウで開きます
 新しいウィンドウで開きます
 新しいウィンドウで開きます

Copyright (c) 2026 WAKITA Corporation, All Rights Reserved.
訂正報告書(大量保有報告書・変更報告書)(株式会社ストラテジックキャピタル)
Bull 0
Bear 0
Routine

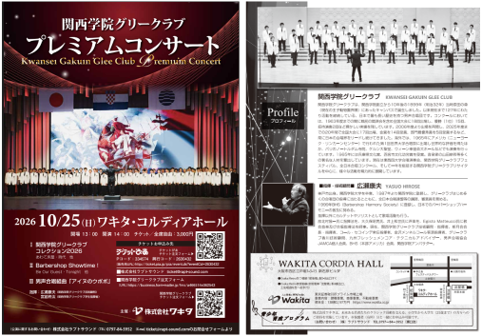
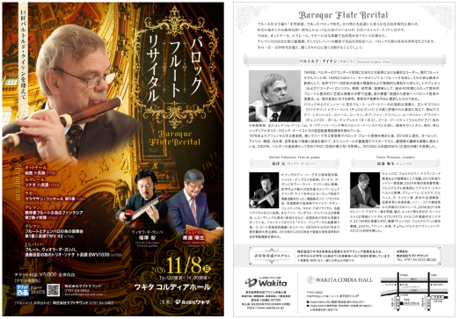
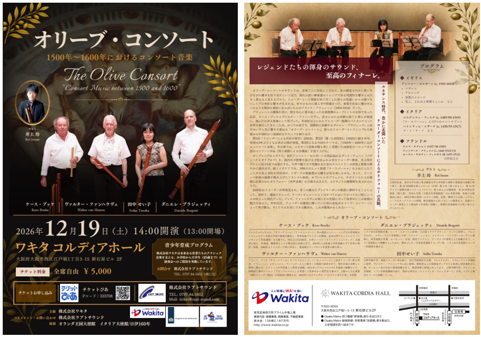
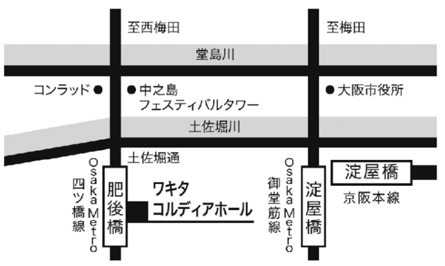




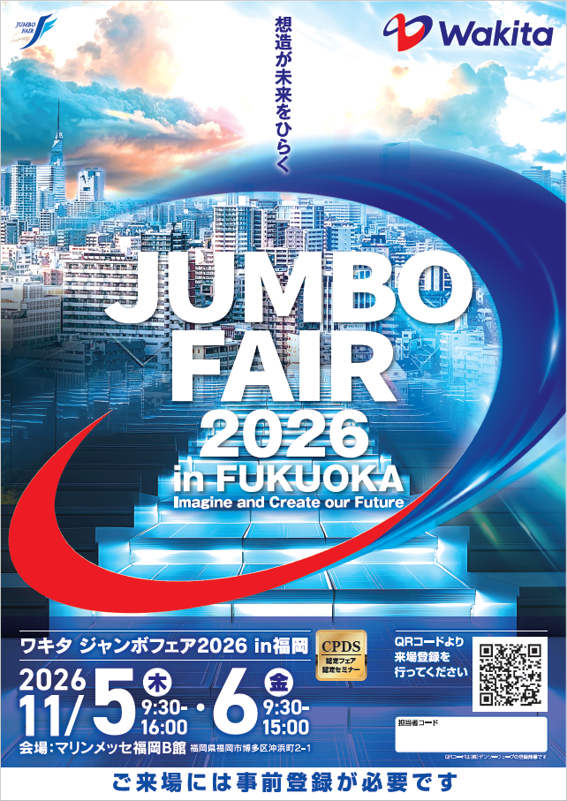








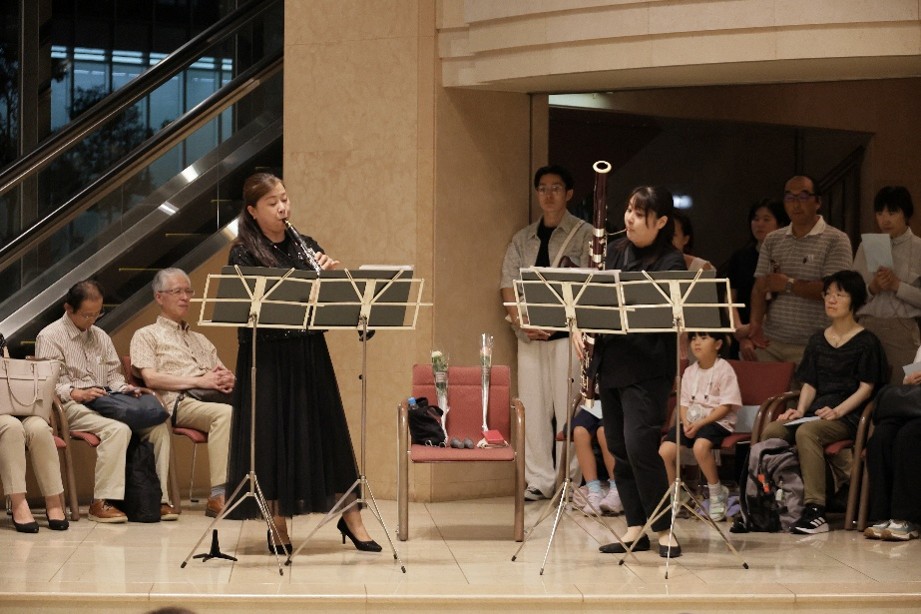 2025年の開催時の様子

Prompts
Click prompts to add them under the company line, click again to take one out, then copy the result into your AI chat. Shared by Asian Century Stocks and Uncovered Thai Stocks. Thank you.
Wakita & Co., LTD. (ticker 8125), listed in Japan.
Copied
ETFs Holding Wakita & Co., LTD.
Exchange-traded funds whose newest published daily portfolio holds one of the company's listings, largest weight first.
| ETF | Weight in ETF | Shares | Market value | As of |
|---|---|---|---|---|
| DISV | 0.05% | 213,000 | $ 2.546M | Nov 12, 2026 |
| DFIS | 0.01% | 69,800 | $ 834.195K | Nov 12, 2026 |
| AVDV | 0.01% | 134,700 | $ 1.635M | Nov 16, 2026 |
| AVDS | 0.01% | 3,800 | $ 46.119K | Nov 16, 2026 |
| DXIV | 0.00% | 1,000 | $ 11.951K | Nov 12, 2026 |
| DFIC | 0.00% | 62,000 | $ 740.976K | Nov 12, 2026 |
| DFSI | 0.00% | 4,700 | $ 56.171K | Nov 12, 2026 |
| DFAX | 0.00% | 27,900 | $ 333.439K | Nov 12, 2026 |
| DFAI | 0.00% | 27,400 | $ 327.463K | Nov 12, 2026 |
| AVDE | 0.00% | 49,300 | $ 598.334K | Nov 16, 2026 |
| AVSD | 0.00% | 1,100 | $ 13.35K | Nov 16, 2026 |