株主優待制度における優待区分判定方法の変更に関するお知らせ
Bull 0
Bear 0
Routine
Fiscal year ends November
Quarters are offset from the calendar — Q1 is Dec–Feb
|
Astena Holdings Co., Ltd. is a diversified group operating in fine chemicals, health and beauty care, pharmaceuticals, and industrial chemicals. The fine chemicals segment focuses on contract research, development, and manufacturing for pharmaceuticals, including peptide synthesis and process development, through subsidiaries such as Spela Pharma and Spela Nexus. The health and beauty care and food segment involves the manufacturing and sale of cosmetics, functional food ingredients, and supplements, with key brands including Torriden and Pureal, and subsidiaries like Iwaki and Maruman H&B. The pharmaceuticals segment covers the production and distribution of medical and general pharmaceuticals via Iwaki Pharmaceutical. The chemicals segment provides electronic industrial chemicals, surface treatment agents, and printed circuit boards through Meltex and Tokyo Kakoki. The group also engages in social impact initiatives and regional development projects. Founded in 1914, the company serves markets in Japan, North America, and Asia. Summarised from the annual report, fiscal year ended Nov 2025 |
Industry Specialty Chemicals | Homepage astena-hd.com |
| Sector Basic Materials | IR page astena-hd.com/ir | |
|
Tags
fine chemicals, pharmaceutical cmc, peptide synthesis, cosmetics manufacturing, functional food ingredients, surface treatment chemicals, printed circuit boards, health supplements, contract manufacturing, Spela Pharma, Spela Nexus, JITSUBO, Iwaki Pharmaceutical Sakura Plant, Iwaki, Aplus, Maruman H&B, Ains Lab, Ikeda Sangyo, Ikeda Bussan, Innovation, Ikeda Corporation of America, Boen Chemical, Iwaki Pharmaceutical, Meltex, Tokai Meltex, Tokyo Kakoki, Meltex Hong Kong, Taiwan Meltex, Meltex Asia Thailand, Meiluda Technology (Tianjin), Meltex Korea, Hongsu Electronic Equipment (Shanghai), Tokyo Kakoki Co. Ltd. (Cayman), Astena Minerva, NAIA, Astena Heartful, Okunoto SDGs Investment Fund, Torriden, Pureal, NeoGuard+ NS30
|
Press page astena-hd.com/media/news |
Metrics
| Valuation | |
|---|---|
| Market cap | ¥ 21.497B |
| Market cap (USD) | $ 134.359M |
| P/E | 8.24 |
| PEG | 0.15 |
| P/BV | 0.74 |
| P/S | 0.31 |
| P/OCF | 6.34 |
| P/FCF | 98.61 |
| Dividend yield | 3.4% |
| Turnover / mcap | — |
| Returns | |
|---|---|
| ROE | 8.3% |
| ROI | 4.4% |
| ROIC | 4.6% |
| Profit margin | 3.5% |
| Growth | |
|---|---|
| Revenue growing | Yes |
| Profits growing | Yes |
| Revenue up 3y | Yes |
| Revenue up 5y | No |
| Earnings growth 3y (net profit CAGR) | 55.7% |
| Quality | |
|---|---|
| Profitable | Yes |
| Margin expanding | No |
| Buying back stock | No |
| Diluting (TTM) | No |
| Debt/Equity | — |
| Podcast bulls (TTM) | Sign up |
| Podcast bears (TTM) | Sign up |
| Podcast sentiment (TTM) | Sign up |
| Podcast sentiment % (TTM) | Sign up |
| News sentiment (TTM) | 0 |
| Quality score | 22.2% |
| Insiders | |
|---|---|
| Buys, 1w | Sign up |
| Buys, 1m | Sign up |
| Buys, 1y | Sign up |
| Sells, 1w | Sign up |
| Sells, 1m | Sign up |
| Sells, 1y | Sign up |
Sign up to see this company's insider trades
| Figure | FY 2025 | FY 2024 | FY 2023 | FY 2022 | FY 2021 | FY 2020 | FY 2019 | FY 2018 | FY 2017 | FY 2016 | FY 2015 | FY 2014 | FY 2013 | FY 2012 |
|---|---|---|---|---|---|---|---|---|---|---|---|---|---|---|
| Revenue | 62.744B | 57.993B | 51.984B | 49.636B | 72.322B | 65.341B | 61.648B | 60.084B | 57.388B | 55.122B | 55.423B | 54.145B | 52.465B | 51.954B |
| Net profit | 2.187B | -2.525B | 1.163B | 579.604M | 1.737B | 1.984B | 1.533B | 1.415B | 1.242B | 8.36M | -143.787M | 496.275M | 744.74M | 728.415M |
| Free cash flow | 218M | 1.65B | -2.521B | -3.513B | -2.145B | 2.39B | 108.722M | 839.366M | 1.099B | 369.429M | 1.893B | — | — | — |
| Figure | FY 2025 | FY 2024 | FY 2023 | FY 2022 | FY 2021 | FY 2020 | FY 2019 | FY 2018 | FY 2017 | FY 2016 | FY 2015 | FY 2014 | FY 2013 | FY 2012 |
|---|---|---|---|---|---|---|---|---|---|---|---|---|---|---|
| Share price | 477 | 483.02 | 497.19 | 417.01 | 486.15 | 525.55 | 473.69 | 528.55 | 489.22 | 207.31 | 222.17 | 227.73 | 214.03 | 166.17 |
| Price performance 12m | -0.01 | -0.03 | 0.19 | -0.14 | -0.07 | 0.11 | -0.1 | 0.08 | 1.36 | -0.07 | -0.02 | 0.06 | 0.29 | — |
Filed figures
Lines the statements and their notes report beside the headline figures, read from the filings' XBRL as filed (no restatement applied), with figures computed from one filing's own lines. Cash-flow lines carry their cash direction: an outflow is negative. Each period links to its filing; a figure's period, report date and tag are in its tooltip.
| Figure | Nov 2016 | Nov 2017 | Nov 2018 | Nov 2019 | Nov 2020 | Nov 2021 | Nov 2022 | Nov 2023 | Nov 2024 | Nov 2025 |
|---|---|---|---|---|---|---|---|---|---|---|
| Balance sheet detail | ||||||||||
| Trade receivables (JPY) | 15.6B | 16B | 16.7B | 18.1B | 15B | 16.7B | 17.7B | 17.3B | 19.5B | 22.9B |
| ↳ YoY growth | +5.3% | +2.7% | +4.4% | +8.5% | -17.1% | +11.2% | +6.0% | -2.3% | +12.8% | +17.5% |
| ↳ 5y CAGR | +0.3% | +1.4% | +2.1% | +0.7% | +1.5% | +8.8% | ||||
| Other receivables (JPY) | 276M | 388M | 391M | 337M | 569M | 692M | 697M | 358M | 595M | — |
| Borrowings, current (JPY) | 2.06B | 2.6B | 3.3B | 3.8B | 5.97B | 9.05B | 10B | 12.3B | 11.4B | 16.2B |
| Borrowings, non-current (JPY) | 980M | 549M | 452M | 805M | 5.97B | 5.81B | 4.78B | 4.49B | 3.45B | 6.25B |
| Lease liabilities (JPY) | 288M | 228M | 237M | 217M | 206M | 187M | 137M | 146M | 86.2M | 141M |
| Cash and deposits (JPY) | 4.18B | 4.93B | 4.75B | 4.92B | 7.57B | 10.9B | 6.93B | 6.88B | 6.1B | 10.2B |
| Intangible assets (JPY) | 79.3M | 78.3M | 1.13B | 1.46B | 7.47B | 8.41B | 8.29B | 7.46B | 6.89B | 7.64B |
| Net debt (borrowings + leases - cash) (JPY) | -848M | -1.56B | -760M | -97.2M | 4.58B | 4.13B | 8.02B | 10B | 8.82B | 12.4B |
| Cash flow detail | ||||||||||
| Operating cash flow (JPY) | 954M | 1.52B | 1.66B | 1.6B | 4.14B | 1.35B | -742M | 1.64B | 4.85B | 3.39B |
| Purchases of property, plant and equipment (JPY) | -584M | -403M | -681M | -1.09B | -1.31B | -2.94B | -2.77B | -3.82B | -2.84B | -2.89B |
| Purchases of intangible assets (JPY) | -24.8M | -21.2M | -135M | -401M | -445M | -559M | -259M | -344M | -357M | -282M |
| Change in receivables (cash effect) (JPY) | -787M | -561M | -730M | -979M | 3.85B | -1.06B | -95.3M | 338M | -2.13B | 487M |
| Change in inventories (cash effect) (JPY) | 582M | -469M | -649M | -1.24B | -381M | -575M | -961M | -1.29B | 383M | -826M |
| Change in payables (cash effect) (JPY) | -551M | 1.1B | 307M | 1.05B | -1.99B | -173M | -14.6M | -298M | 1.52B | -140M |
| Dividends paid (cash effect) (JPY) | -200M | -199M | -317M | -385M | -471M | -651M | -729M | -719M | -727M | -735M |
| Share buybacks (cash effect) (JPY) | -107M | -447M | -1.25M | -102,000 | -88,000 | -4.41M | -310M | -58,000 | -6.66M | 0.00 |
| Interest paid (cash effect) (JPY) | -35.1M | -25.3M | -22.6M | -21.3M | -41.1M | -61.4M | -53.6M | -60.1M | -74M | -157M |
| Income taxes paid (cash effect) (JPY) | -481M | -608M | -487M | -714M | -1.19B | -1.02B | -1.26B | -1.44B | -894M | -1.07B |
| Share-based compensation (JPY) | — | 105M | 119M | 55.9M | 48.4M | 43.8M | 50.5M | 86.4M | 48.1M | 68M |
| Operating cash flow before change in receivables (JPY) | 1.74B | 2.08B | 2.39B | 2.58B | 297M | 2.41B | -647M | 1.31B | 6.98B | 2.91B |
| Free cash flow (OCF - PPE - intangibles) (JPY) | 345M | 1.1B | 839M | 109M | 2.39B | -2.14B | -3.77B | -2.52B | 1.65B | 218M |
| Income detail | ||||||||||
| Research and development expense (JPY) | 833M | 731M | 810M | 735M | 768M | 964M | 825M | 895M | 1.05B | 971M |
| ↳ 5y CAGR | -4.9% | +3.0% | +2.4% | +2.0% | +7.5% | +4.8% | ||||
| Total comprehensive income (JPY) | -869M | 1.66B | 1.51B | 1.49B | 1.59B | 1.75B | 783M | 2.09B | -2.6B | 2.61B |
| Comprehensive income to owners (JPY) | -873M | 1.64B | 1.51B | 1.48B | 1.59B | 1.75B | 788M | 2.1B | -2.59B | 2.62B |
| Provision for credit losses (JPY) | 16M | 18.6M | 32.4M | 11.4M | 10.6M | 12M | 1.36M | -2.27M | 791,000 | 0.00 |
| Credit cost ratio (credit losses / average receivables) (%) | 0.1% | 0.1% | 0.2% | 0.1% | 0.1% | 0.1% | 0.0% | 0.0% | 0.0% | 0.0% |
| Reported | Feb 23, 2018 | Feb 23, 2018 | Feb 22, 2019 | Feb 26, 2020 | Feb 24, 2021 | Feb 25, 2022 | Feb 22, 2023 | Feb 28, 2024 | Feb 27, 2025 | Feb 25, 2026 |
Sign up to see institutional holdings
Sign UpPodcast Mentions
Sign up to see podcast mentions and sentiment
Sign UpTimely disclosures published on TDnet, newest first, titles as filed in Japanese. The link opens the disclosure on TDnet. Filings with EDINET (periodic reports, extraordinary reports, offerings, holding and buy-back reports), newest first, titles as filed in Japanese. The link opens the filing on EDINET. Press releases from the company's own website, newest first.
NAIA、「Biople FES OSAKA 2026」に初出店!
Bull 1
Bear 0
Product/operations
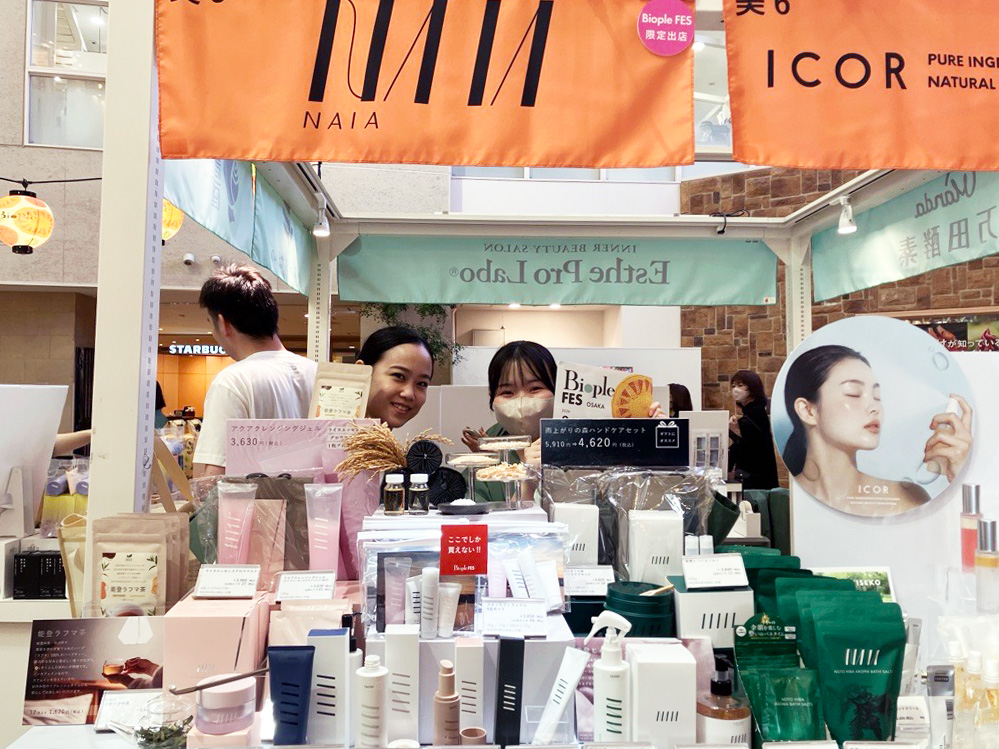
2026年9月16日(水)~20日(日)、阪急うめだ本店9階 祝祭広場で開催された「Biople FES OSAKA 2026」に、NAIAとして初めて出展しました。今回の出展は、ナチュラル&オーガニックへの関心が高いBiopleのお客様に、能登の自然素材と科学的知見を融合したNAIAの商品を実際に手に取っていただき、ブランド認知の拡大と新たなお客様との接点づくりを目的に参加したものです。
会場は連日多くのお客様で賑わい、NAIAブースにも幅広い年代の方にお立ち寄りいただきました。特にラフマ茶の試飲には、約1,000名の方にご体験いただき、味わいや素材について直接ご紹介することができました。試飲をきっかけに商品について質問をいただいたり、能登の素材やNAIAのものづくりに興味を持っていただいたりするなど、多くのお客様と直接コミュニケーションを取る貴重な機会となりました。
NAIAブースでは、能登の素材を生かしたスキンケアやボディケア商品をはじめ、ラフマ茶や能登ヒバを使用した商品などを展開しました。なかでもラフマ茶と能登ヒバ バスソルトは想定を上回る反響をいただき、ほぼ完売となりました。また、FES限定のスキンケアトライアルセットやハンドケアセットもご用意し、商品を試していただくだけでなく、素材の背景や能登でのものづくりについて直接お伝えすることで、NAIAならではのブランドストーリーに触れていただく機会となりました。
今回初めてBiople FESに出展し、実際にお客様とお話しすることで、どの商品やストーリーに興味を持っていただけるのかを直接知ることができました。特にラフマ茶や能登ヒバ バスソルトへの反応が想定以上に高く、Biopleのお客様とNAIAとの高い親和性を実感しました。今回得られた声や手応えを、今後の商品開発や販売活動につなげていきたいと思います。
当社連結子会社による子会社(孫会社)設立に関するお知らせ
Bull 2
Bear 0
Product/operations


Prompts
Click prompts to add them under the company line, click again to take one out, then copy the result into your AI chat. Shared by Asian Century Stocks and Uncovered Thai Stocks. Thank you.
Astena Holdings Co., Ltd. (ticker 8095), listed in Japan.
Copied
ETFs Holding Astena Holdings Co., Ltd.
Exchange-traded funds whose newest published daily portfolio holds one of the company's listings, largest weight first.
| ETF | Weight in ETF | Shares | Market value | As of |
|---|---|---|---|---|
| DISV | 0.01% | 158,600 | $ 550.488K | Nov 12, 2026 |
| DFIS | 0.00% | 72,900 | $ 253.03K | Nov 12, 2026 |
| DFIC | 0.00% | 52,200 | $ 181.182K | Nov 12, 2026 |
| DFAX | 0.00% | 30,400 | $ 105.516K | Nov 12, 2026 |
| DFSI | 0.00% | 2,600 | $ 9,024.39 | Nov 12, 2026 |
| DXIV | 0.00% | 300 | $ 1,041.28 | Nov 12, 2026 |
| DFAI | 0.00% | 15,400 | $ 53.452K | Nov 12, 2026 |
| AVDE | 0.00% | 4,500 | $ 15.358K | Nov 16, 2026 |
| AVDV | 0.00% | 28,800 | $ 98.289K | Nov 16, 2026 |
| AVSD | 0.00% | 3,000 | $ 10.238K | Nov 16, 2026 |
| AVDS | 0.00% | 2,400 | $ 8,190.74 | Nov 16, 2026 |