「統合報告書2026」発行のお知らせ https://www.hanwa.co.jp/news/ir/202609305460/ Wed, 30 Sep 2026 06:00:06 +0000 https://www.hanwa.co.jp/?post\_type=ir\_post&p=5460 …
<item>
<title>「統合報告書2026」発行のお知らせ</title>
<link>https://www.hanwa.co.jp/news/ir/202609305460/</link>
<pubDate>Wed, 30 Sep 2026 06:00:06 +0000</pubDate>
<dc:creator><!\[CDATA\[hksecret\]\]></dc:creator>
<guid isPermaLink="false">https://www.hanwa.co.jp/?post\_type=ir\_post&p=5460</guid>
<description><!\[CDATA\[阪和興業株式会社(以下、当社)は、このたび「統合報告書2026」を発行いたしました。 当社では、ステークホルダーの皆様に中長期的な価値創造に向けた取り組みについてご理解いただくことを目的として、2019年度より統合報告書 \[…\]\]\]></description>
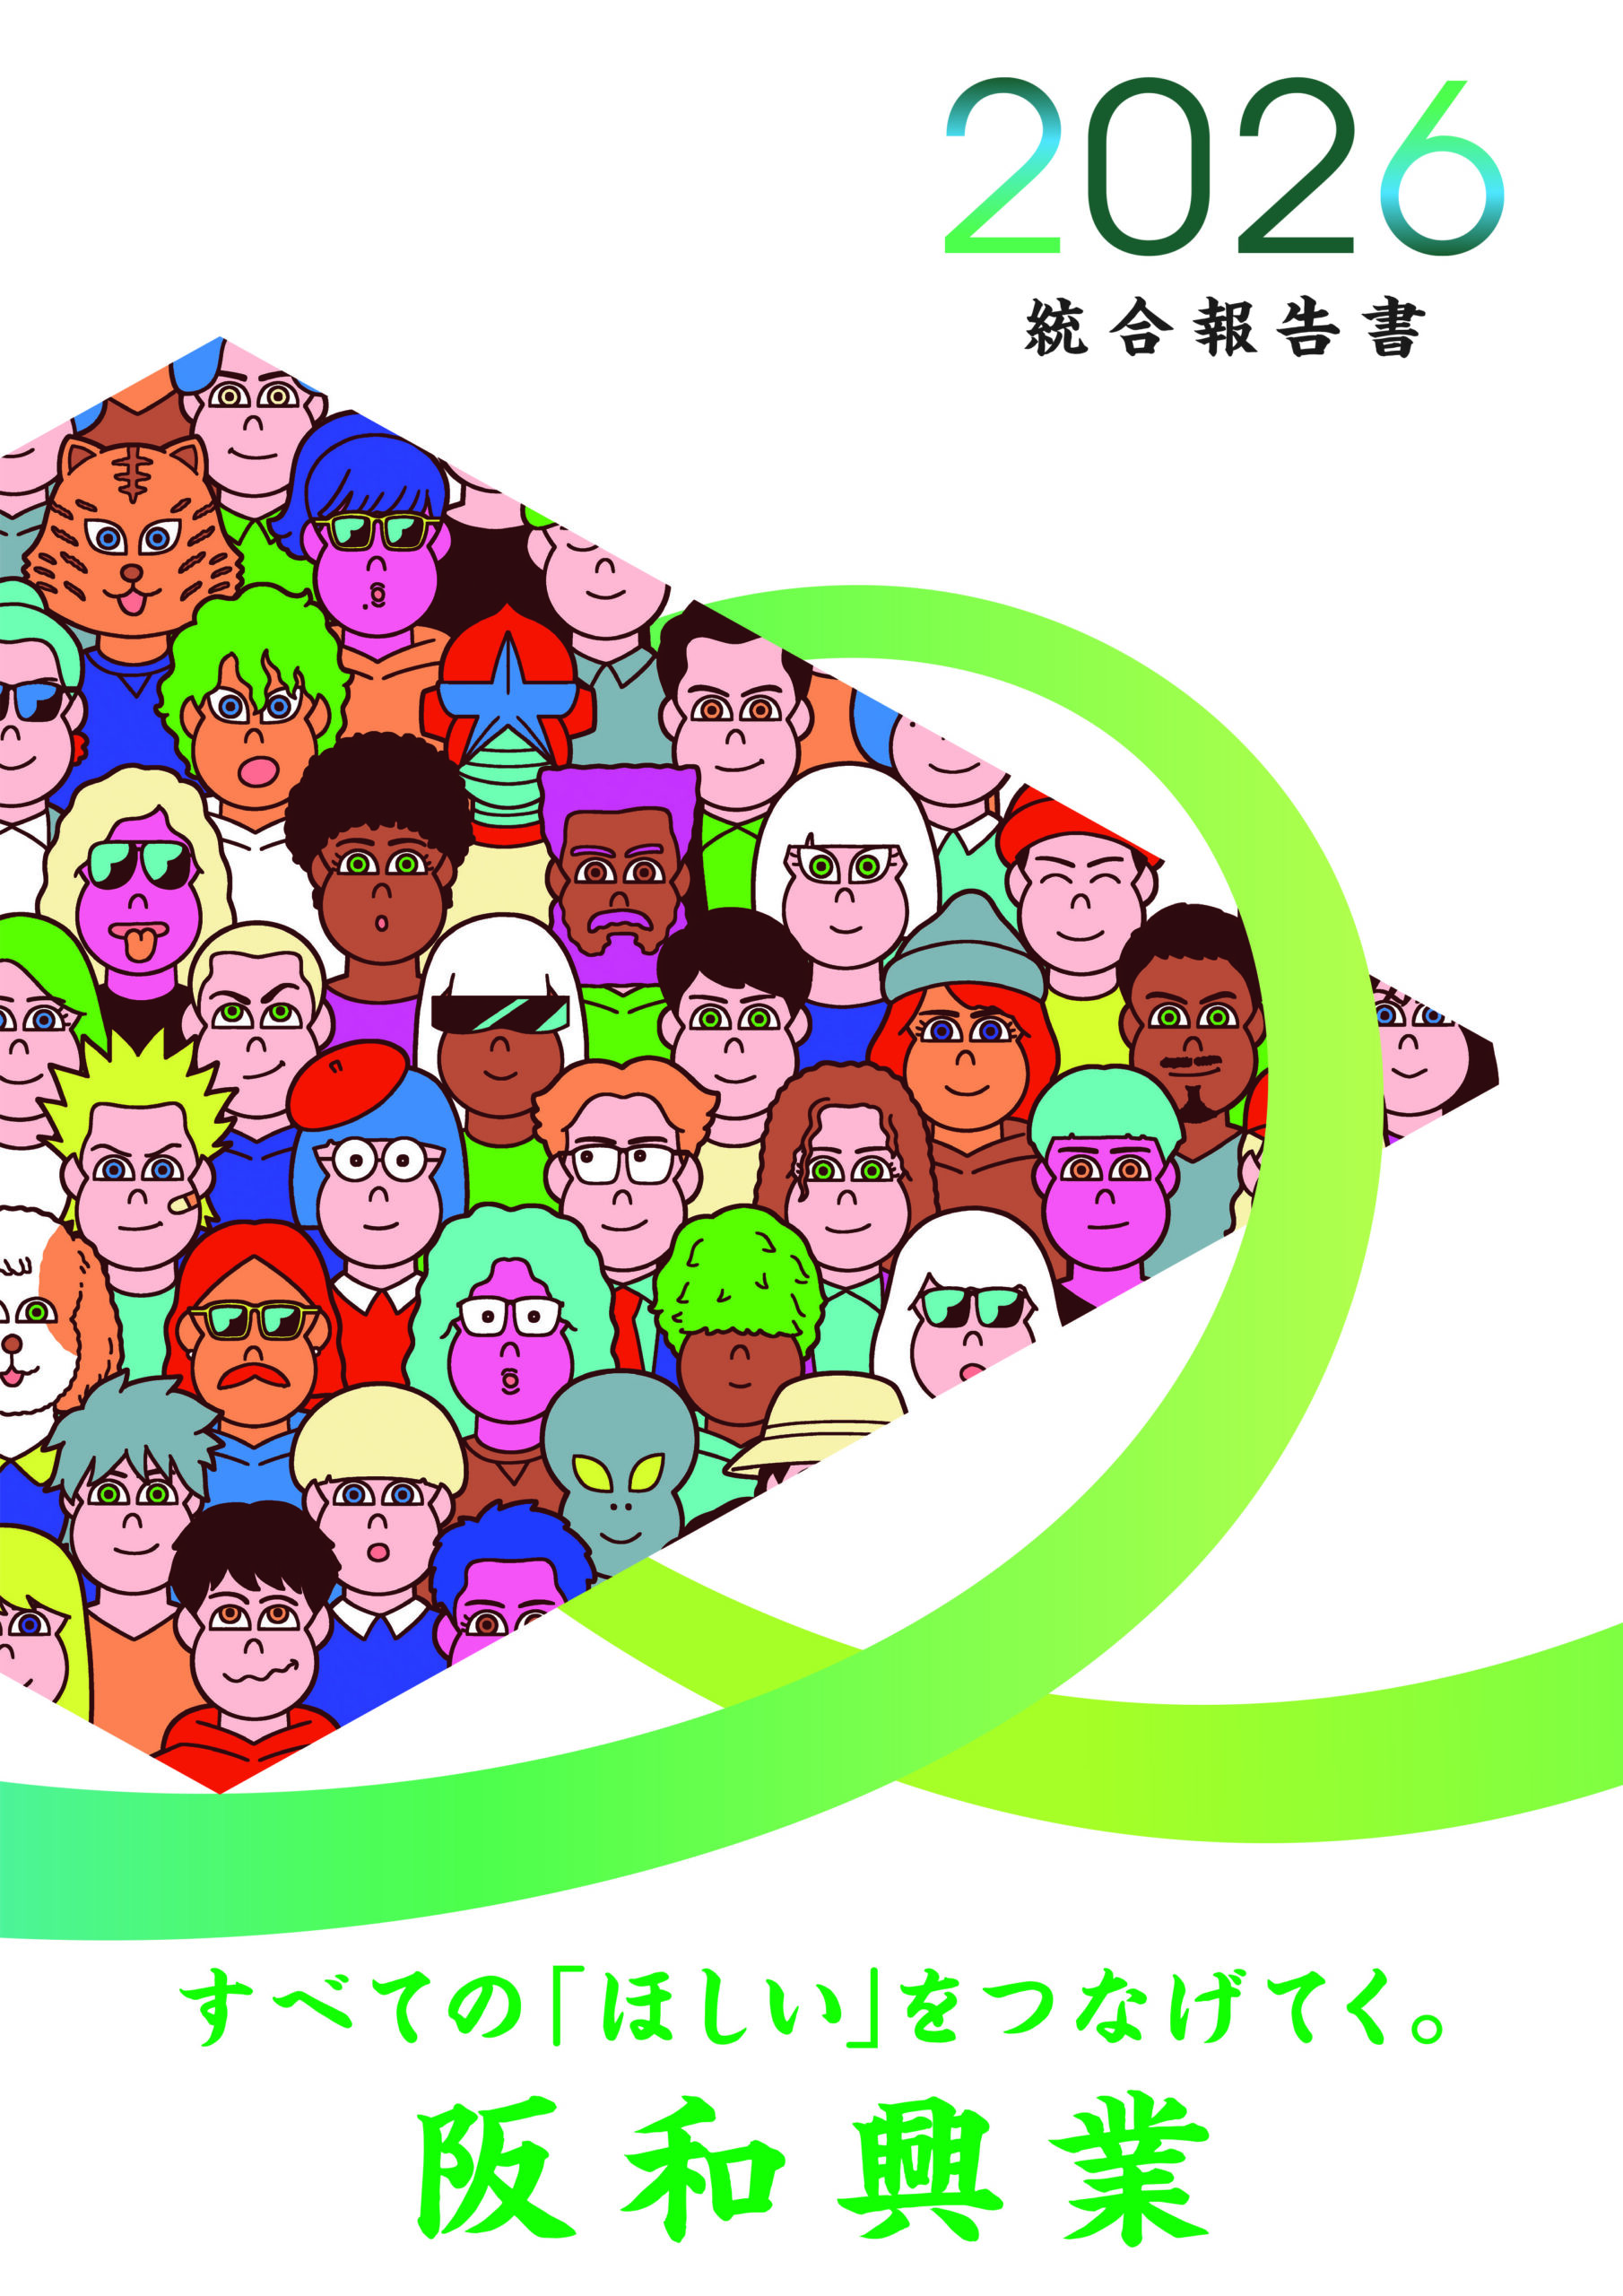
<content:encoded><!\[CDATA\[<p>阪和興業株式会社(以下、当社)は、このたび「<a href="http://www.hanwa.co.jp/ms/data/pdf/ir/統合報告書2026.pdf"><strong>統合報告書2026</strong></a>」を発行いたしました。<br />\
当社では、ステークホルダーの皆様に中長期的な価値創造に向けた取り組みについてご理解いただくことを目的として、2019年度より統合報告書を継続的に発行しています。
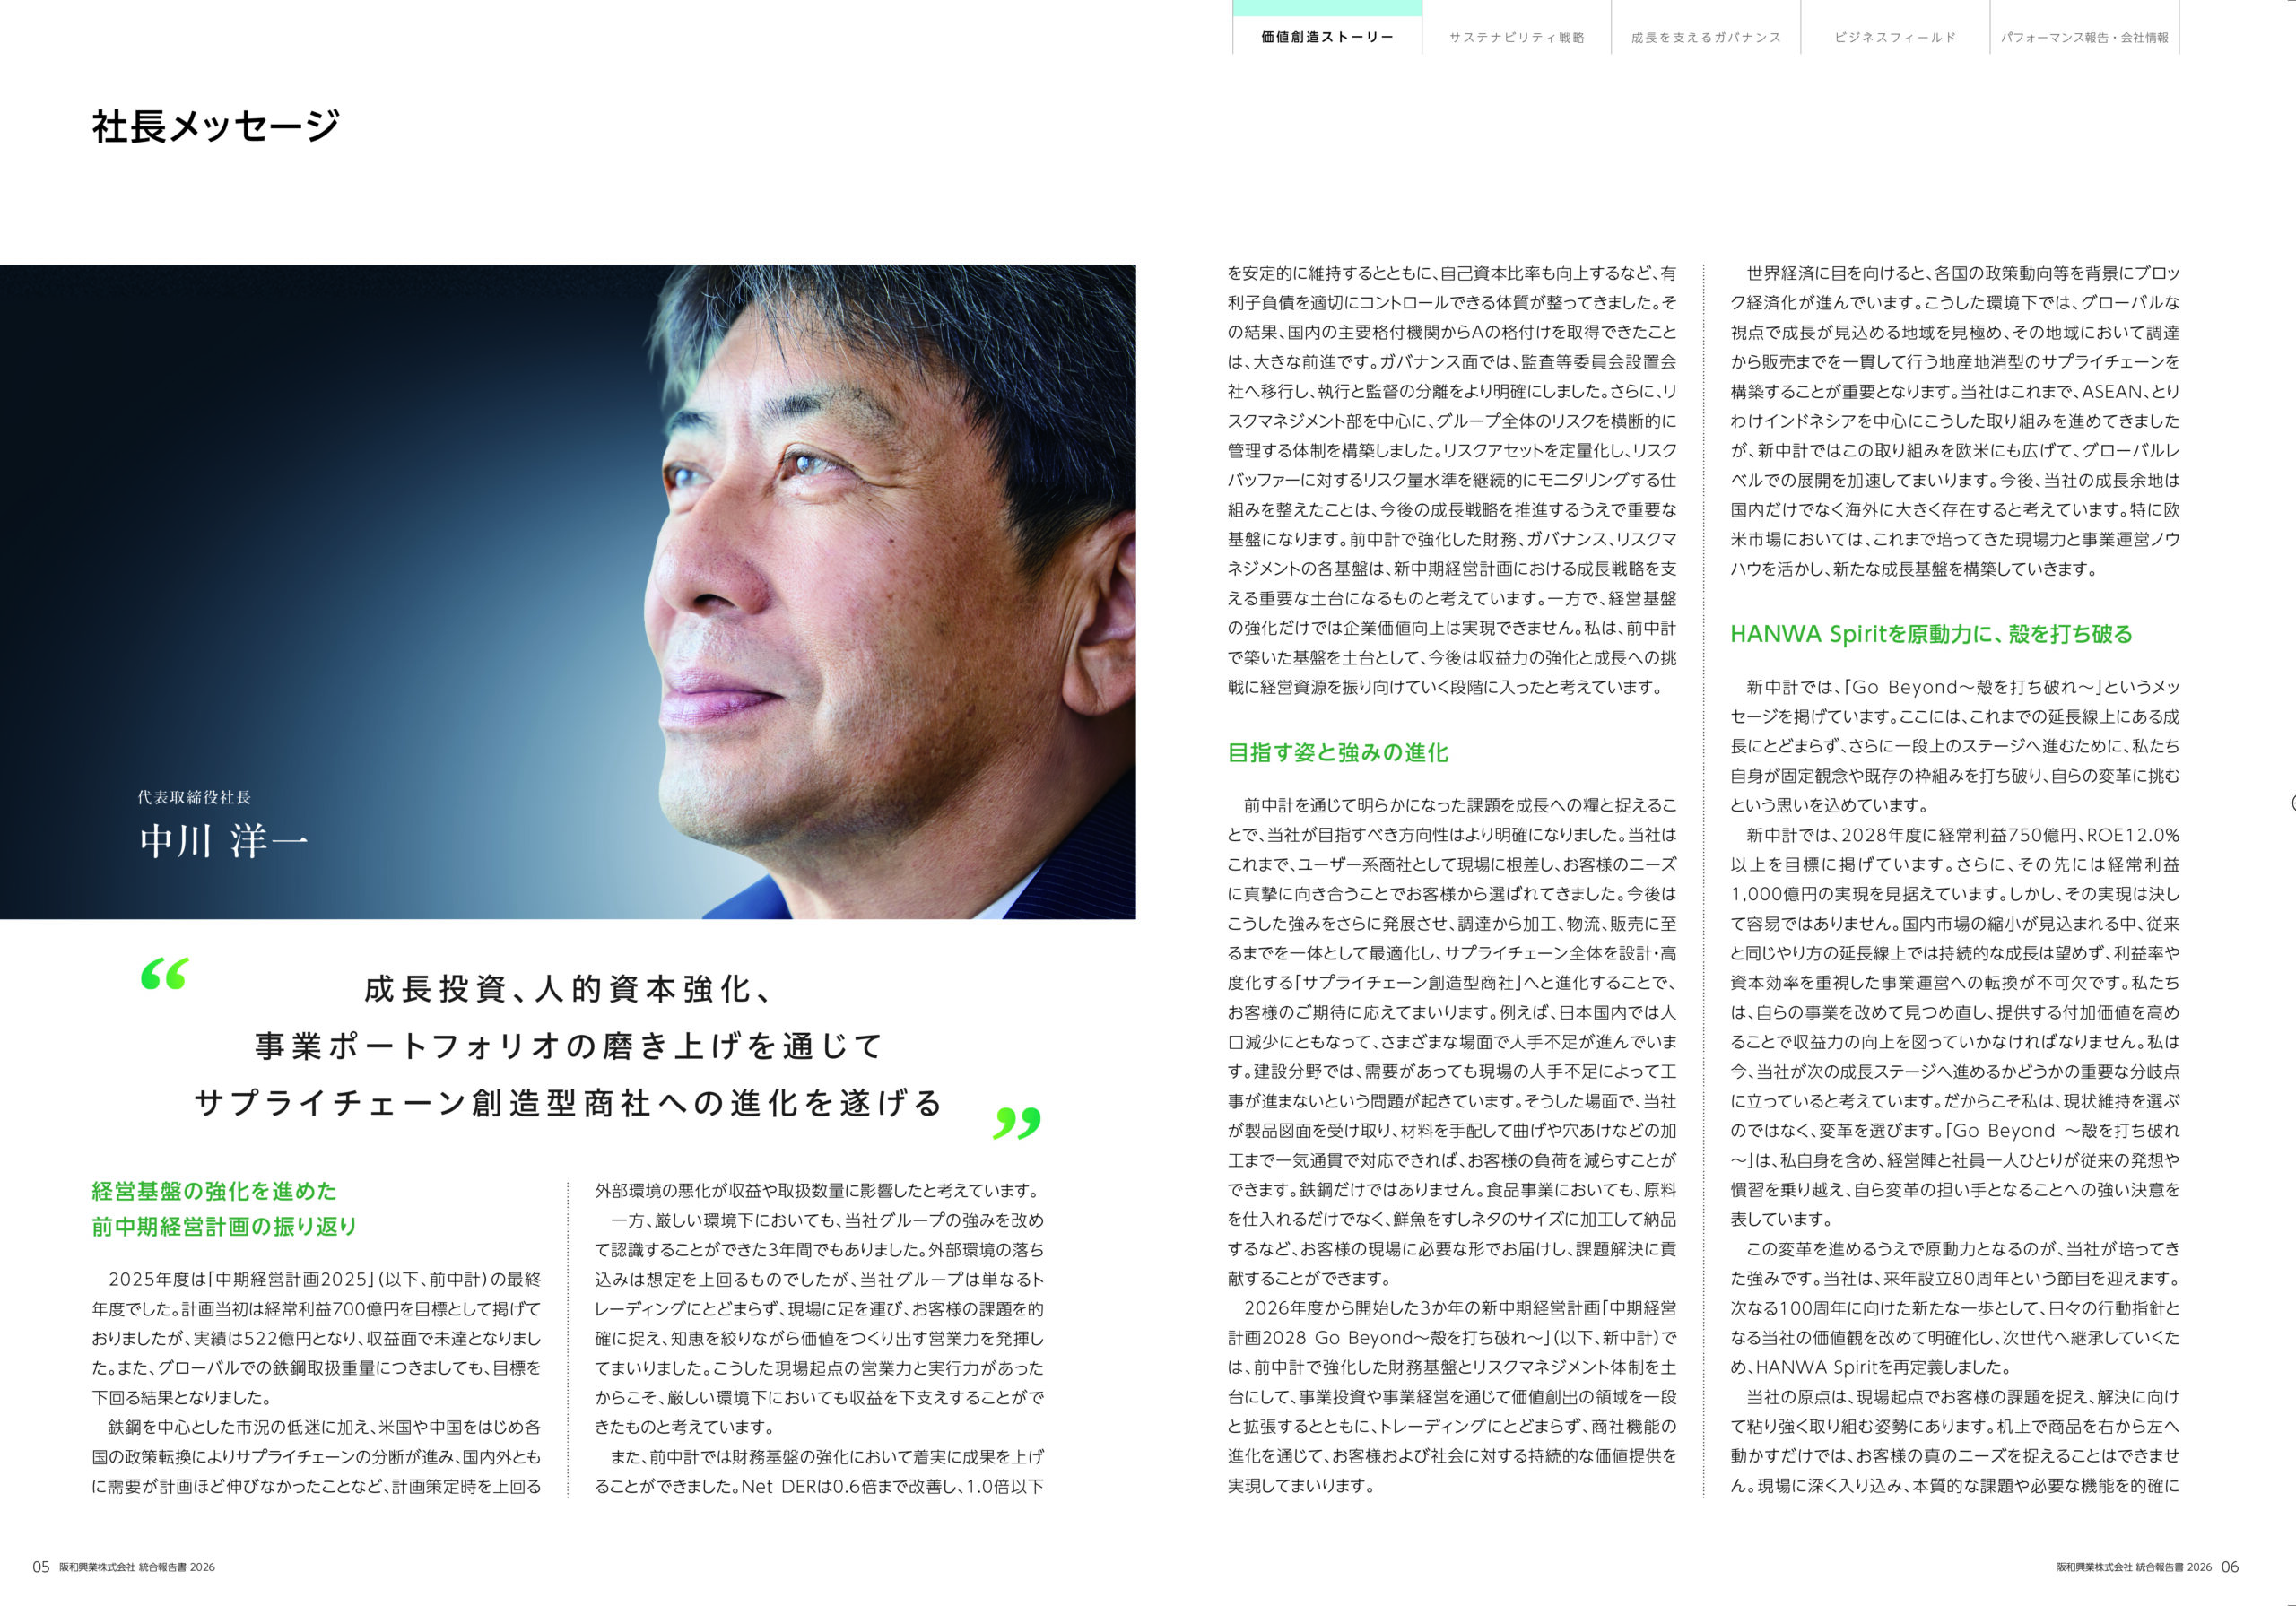
本報告書では、社長メッセージをはじめ、当社が長期的に目指す姿とその実現に向けた成長戦略や価値創造の取り組みを紹介しています。
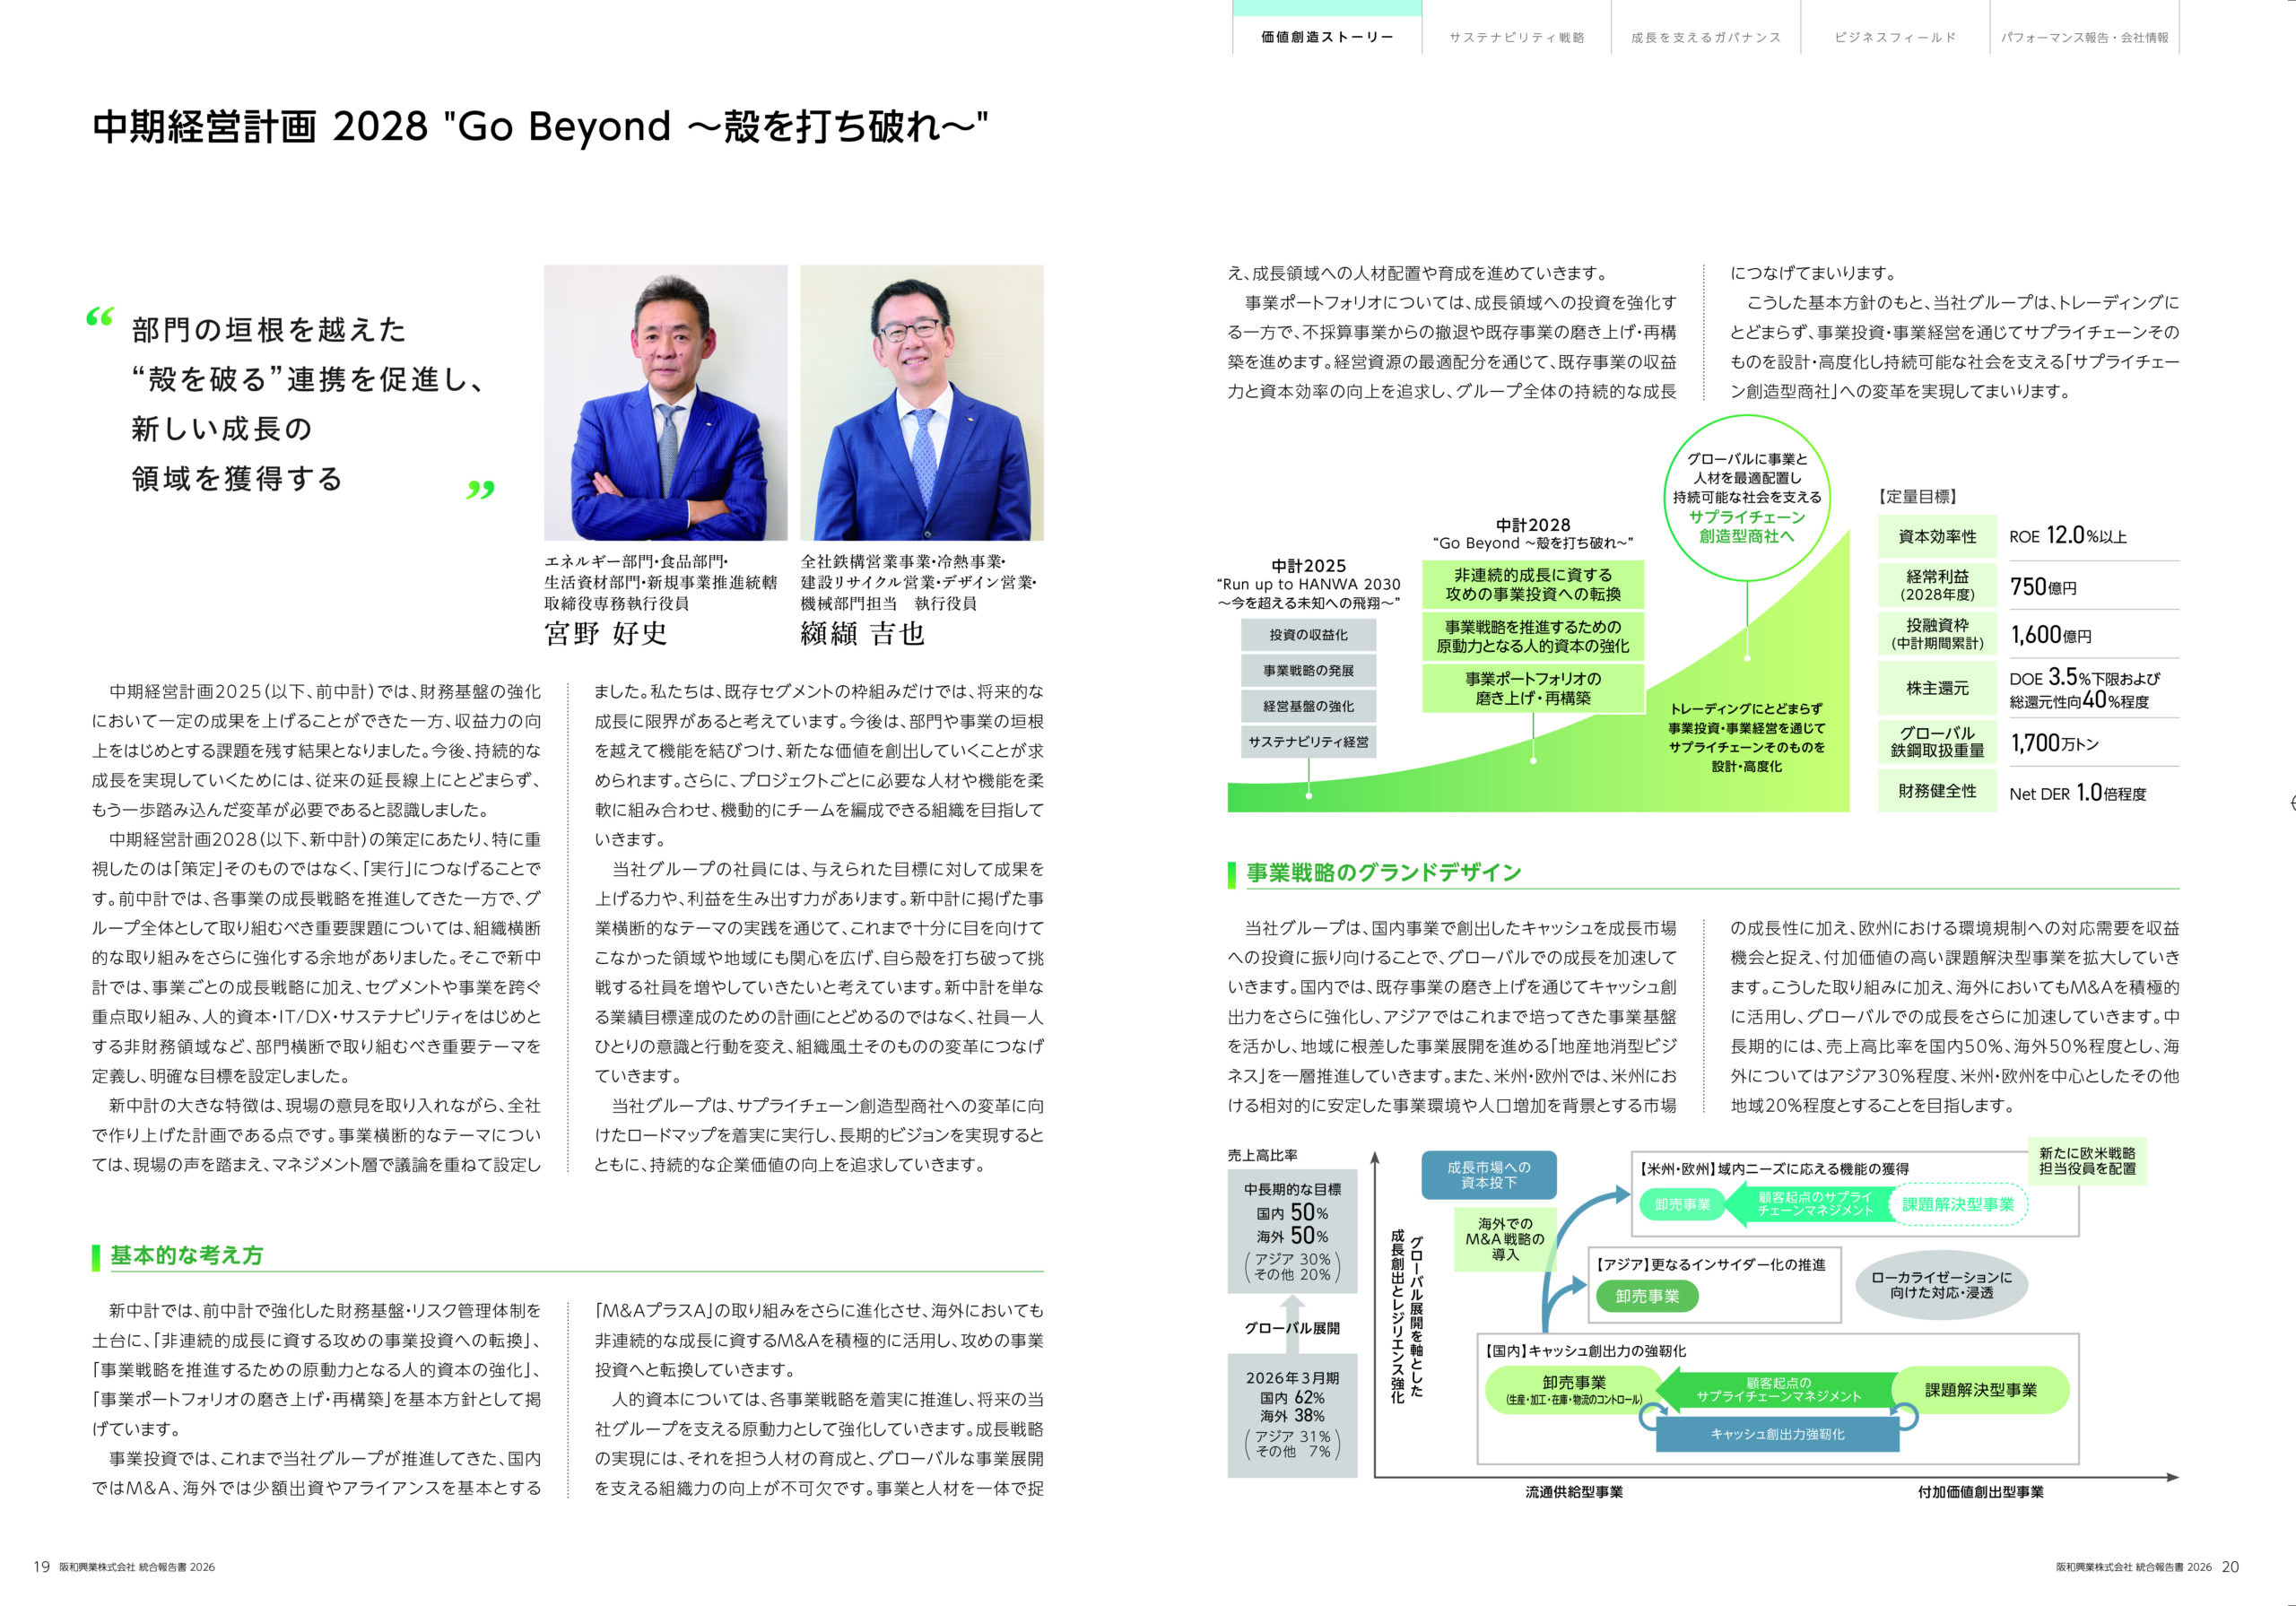
また、2026年5月に公表した「中期経営計画2028 Go Beyond ~殻を打ち破れ~」をさらなる成長に向けた重要なステップと位置付け、その重点施策について説明しています。\
<item>
<title>輸入鋼材 岸壁在庫推移表</title>
<link>https://www.hanwa.co.jp/news/202609185456/</link>
<pubDate>Fri, 18 Sep 2026 01:20:57 +0000</pubDate>
<dc:creator><!\[CDATA\[hksecret\]\]></dc:creator>
<guid isPermaLink="false">https://www.hanwa.co.jp/?post\_type=news\_post&p=5456</guid>
<description><!\[CDATA\[\]\]></description>
<content:encoded><!\[CDATA\[\]\]></content:encoded>
</item>
<item>
<title>自己株式の取得状況及び取得終了並びに自己株式の消却に関するお知らせ</title>
<link>https://www.hanwa.co.jp/news/ir/202609145451/</link>
<pubDate>Mon, 14 Sep 2026 06:00:36 +0000</pubDate>
<dc:creator><!\[CDATA\[hksecret\]\]></dc:creator>
<guid isPermaLink="false">https://www.hanwa.co.jp/?post\_type=ir\_post&p=5451</guid>
<description><!\[CDATA\[\]\]></description>
<content:encoded><!\[CDATA\[\]\]></content:encoded>
</item>
<item>
<title>連結子会社間の吸収合併及び連結子会社の社名変更に関するお知らせ ~ダイサン・ダイサン物流・三栄金属の統合及び新倉庫の建設~</title>
<link>https://www.hanwa.co.jp/news/202609045448/</link>
<pubDate>Fri, 04 Sep 2026 08:00:08 +0000</pubDate>
<dc:creator><!\[CDATA\[hksecret\]\]></dc:creator>
<guid isPermaLink="false">https://www.hanwa.co.jp/?post\_type=news\_post&p=5448</guid>
<description><!\[CDATA\[\]\]></description>
<content:encoded><!\[CDATA\[\]\]></content:encoded>
</item>
<item>
<title>(開示事項の経過)米国Associated Steel Group, LLCの持分取得(連結子会社化)の完了及び連結子会社の増資に関するお知らせ</title>
<link>https://www.hanwa.co.jp/news/ir/202609025444/</link>
<pubDate>Wed, 02 Sep 2026 06:30:24 +0000</pubDate>
<dc:creator><!\[CDATA\[hksecret\]\]></dc:creator>
<guid isPermaLink="false">https://www.hanwa.co.jp/?post\_type=ir\_post&p=5444</guid>
<description><!\[CDATA\[\]\]></description>
<content:encoded><!\[CDATA\[\]\]></content:encoded>
</item>
<item>
<title>自己株式の取得状況に関するお知らせ</title>
<link>https://www.hanwa.co.jp/news/ir/202609015441/</link>
<pubDate>Tue, 01 Sep 2026 04:01:17 +0000</pubDate>
<dc:creator><!\[CDATA\[hksecret\]\]></dc:creator>
<guid isPermaLink="false">https://www.hanwa.co.jp/?post\_type=ir\_post&p=5441</guid>
<description><!\[CDATA\[\]\]></description>
<content:encoded><!\[CDATA\[\]\]></content:encoded>
</item>
<item>
<title>2026年10月 組織変更・部課長人事の件</title>
<link>https://www.hanwa.co.jp/news/202608195434/</link>
<pubDate>Wed, 19 Aug 2026 04:30:07 +0000</pubDate>
<dc:creator><!\[CDATA\[hksecret\]\]></dc:creator>
<guid isPermaLink="false">https://www.hanwa.co.jp/?post\_type=news\_post&p=5434</guid>
<description><!\[CDATA\[\]\]></description>
<content:encoded><!\[CDATA\[\]\]></content:encoded>
</item>
<item>
<title>令和8年熊本地震被害に対する支援について</title>
<link>https://www.hanwa.co.jp/news/csr/202608135432/</link>
<pubDate>Thu, 13 Aug 2026 02:00:13 +0000</pubDate>
<dc:creator><!\[CDATA\[hksecret\]\]></dc:creator>
<guid isPermaLink="false">https://www.hanwa.co.jp/?post\_type=csr\_post&p=5432</guid>
<description><!\[CDATA\[このたびの熊本県で発生した地震により、お亡くなりになられた方々に謹んでお悔やみ申し上げますとともに、ご遺族の皆様に心より哀悼の意を表します。 阪和興業株式会社は、令和8年熊本地震で被災された方々への支援と復興のため、熊本 \[…\]\]\]></description>
<content:encoded><!\[CDATA\[<p>このたびの熊本県で発生した地震により、お亡くなりになられた方々に謹んでお悔やみ申し上げますとともに、ご遺族の皆様に心より哀悼の意を表します。</p>\
<item>
<title>株式会社中山製鋼所との資本業務提携及び第三者割当増資の引受けに関するお知らせ</title>
<link>https://www.hanwa.co.jp/news/202608075430/</link>
<pubDate>Fri, 07 Aug 2026 06:38:15 +0000</pubDate>
<dc:creator><!\[CDATA\[hksecret\]\]></dc:creator>
<guid isPermaLink="false">https://www.hanwa.co.jp/?post\_type=news\_post&p=5430</guid>
<description><!\[CDATA\[\]\]></description>
<content:encoded><!\[CDATA\[\]\]></content:encoded>
</item>
<item>
<title>2027年3月期 第1四半期決算短信</title>
<link>https://www.hanwa.co.jp/news/ir/202608075415/</link>
<pubDate>Fri, 07 Aug 2026 04:00:51 +0000</pubDate>
<dc:creator><!\[CDATA\[hksecret\]\]></dc:creator>
<guid isPermaLink="false">https://www.hanwa.co.jp/?post\_type=ir\_post&p=5415</guid>
<description><!\[CDATA\[\]\]></description>
<content:encoded><!\[CDATA\[\]\]></content:encoded>
</item>
<item>
<title>2027年3月期 第1四半期決算説明資料</title>
<link>https://www.hanwa.co.jp/news/ir/202608075420/</link>
<pubDate>Fri, 07 Aug 2026 04:00:36 +0000</pubDate>
<dc:creator><!\[CDATA\[hksecret\]\]></dc:creator>
<guid isPermaLink="false">https://www.hanwa.co.jp/?post\_type=ir\_post&p=5420</guid>
<description><!\[CDATA\[\]\]></description>
<content:encoded><!\[CDATA\[\]\]></content:encoded>
</item>
<item>
<title>メキシコにコイルセンターを新設~最適調達ソリューションの提供によりユーザー課題解決を推進~</title>
<link>https://www.hanwa.co.jp/news/202608035406/</link>
<pubDate>Mon, 03 Aug 2026 05:00:25 +0000</pubDate>
<dc:creator><!\[CDATA\[hksecret\]\]></dc:creator>
<guid isPermaLink="false">https://www.hanwa.co.jp/?post\_type=news\_post&p=5406</guid>
<description><!\[CDATA\[\]\]></description>
<content:encoded><!\[CDATA\[\]\]></content:encoded>
</item>
<item>
<title>自己株式の取得状況に関するお知らせ</title>
<link>https://www.hanwa.co.jp/news/ir/202608035408/</link>
<pubDate>Mon, 03 Aug 2026 04:00:29 +0000</pubDate>
<dc:creator><!\[CDATA\[hksecret\]\]></dc:creator>
<guid isPermaLink="false">https://www.hanwa.co.jp/?post\_type=ir\_post&p=5408</guid>
<description><!\[CDATA\[\]\]></description>
<content:encoded><!\[CDATA\[\]\]></content:encoded>
</item>
<item>
<title>コーポレートガバナンスに関する報告書</title>
<link>https://www.hanwa.co.jp/news/ir/202607295400/</link>
<pubDate>Wed, 29 Jul 2026 06:32:46 +0000</pubDate>
<dc:creator><!\[CDATA\[hksecret\]\]></dc:creator>
<guid isPermaLink="false">https://www.hanwa.co.jp/?post\_type=ir\_post&p=5400</guid>
<description><!\[CDATA\[\]\]></description>
<content:encoded><!\[CDATA\[\]\]></content:encoded>
</item>
<item>
<title>コーポレートガバナンス・コードへの対応方針について</title>
<link>https://www.hanwa.co.jp/news/ir/202607295398/</link>
<pubDate>Wed, 29 Jul 2026 06:32:35 +0000</pubDate>
<dc:creator><!\[CDATA\[hksecret\]\]></dc:creator>
<guid isPermaLink="false">https://www.hanwa.co.jp/?post\_type=ir\_post&p=5398</guid>
<description><!\[CDATA\[\]\]></description>
<content:encoded><!\[CDATA\[\]\]></content:encoded>
</item>
<item>
<title>取締役及び執行役員に対する譲渡制限付株式報酬としての自己株式の処分の払込完了に関するお知らせ</title>
<link>https://www.hanwa.co.jp/news/ir/202607225383/</link>
<pubDate>Wed, 22 Jul 2026 06:01:08 +0000</pubDate>
<dc:creator><!\[CDATA\[hksecret\]\]></dc:creator>
<guid isPermaLink="false">https://www.hanwa.co.jp/?post\_type=ir\_post&p=5383</guid>
<description><!\[CDATA\[\]\]></description>
<content:encoded><!\[CDATA\[\]\]></content:encoded>
</item>
<item>
<title>ESG投資の代表的指数「FTSE JPX Blossom Japan Index」および「FTSE JPX Blossom Japan Sector Relative Index」の構成銘柄に初選定</title>
<link>https://www.hanwa.co.jp/news/csr/202607155377/</link>
<pubDate>Wed, 15 Jul 2026 05:00:42 +0000</pubDate>
<dc:creator><!\[CDATA\[hksecret\]\]></dc:creator>
<guid isPermaLink="false">https://www.hanwa.co.jp/?post\_type=csr\_post&p=5377</guid>
<description><!\[CDATA\[\]\]></description>
<content:encoded><!\[CDATA\[\]\]></content:encoded>
</item>
<item>
<title>南九州地域における再造林支援に関する感謝状を受領 </title>
<link>https://www.hanwa.co.jp/news/csr/202607095369/</link>
<pubDate>Thu, 09 Jul 2026 04:00:05 +0000</pubDate>
<dc:creator><!\[CDATA\[hksecret\]\]></dc:creator>
<guid isPermaLink="false">https://www.hanwa.co.jp/?post\_type=csr\_post&p=5369</guid>
<description><!\[CDATA\[ ―森林資源の持続的な活用と循環の促進に貢献- 阪和興業株式会社(以下、当社)は、宮崎県および鹿児島県の森林組合4団体で構成される 木材輸出戦略協議会(以下、同協議会)が設立した再造林基金への協賛に対し、 \[…\]\]\]></description>
<content:encoded><!\[CDATA\[<p style="text-align: left;"><strong><span style="font-size: 19pt;"> ―森林資源の持続的な活用と循環の促進に貢献-</span></strong></p>\
<item>
<title>自己株式の取得状況に関するお知らせ</title>
<link>https://www.hanwa.co.jp/news/ir/202607015359/</link>
<pubDate>Wed, 01 Jul 2026 04:00:28 +0000</pubDate>
<dc:creator><!\[CDATA\[hksecret\]\]></dc:creator>
<guid isPermaLink="false">https://www.hanwa.co.jp/?post\_type=ir\_post&p=5359</guid>
<description><!\[CDATA\[\]\]></description>
<content:encoded><!\[CDATA\[\]\]></content:encoded>
</item>
<item>
<title>米国Associated Steel Group, LLCの持分取得(連結子会社化)及び連結子会社の増資に関するお知らせ</title>
<link>https://www.hanwa.co.jp/news/ir/202606305355/</link>
<pubDate>Tue, 30 Jun 2026 06:30:37 +0000</pubDate>
<dc:creator><!\[CDATA\[hksecret\]\]></dc:creator>
<guid isPermaLink="false">https://www.hanwa.co.jp/?post\_type=ir\_post&p=5355</guid>
<description><!\[CDATA\[\]\]></description>
<content:encoded><!\[CDATA\[\]\]></content:encoded>
</item>
<item>
<title>コーポレートガバナンスに関する報告書</title>
<link>https://www.hanwa.co.jp/news/ir/202606295349/</link>
<pubDate>Mon, 29 Jun 2026 07:40:28 +0000</pubDate>
<dc:creator><!\[CDATA\[hksecret\]\]></dc:creator>
<guid isPermaLink="false">https://www.hanwa.co.jp/?post\_type=ir\_post&p=5349</guid>
<description><!\[CDATA\[\]\]></description>
<content:encoded><!\[CDATA\[\]\]></content:encoded>
</item>
<item>
<title>コーポレートガバナンス・コードへの対応方針について</title>
<link>https://www.hanwa.co.jp/news/ir/202606295347/</link>
<pubDate>Mon, 29 Jun 2026 07:40:12 +0000</pubDate>
<dc:creator><!\[CDATA\[hksecret\]\]></dc:creator>
<guid isPermaLink="false">https://www.hanwa.co.jp/?post\_type=ir\_post&p=5347</guid>
<description><!\[CDATA\[\]\]></description>
<content:encoded><!\[CDATA\[\]\]></content:encoded>
</item>
<item>
<title>取締役及び執行役員に対する譲渡制限付株式報酬としての自己株式処分に関するお知らせ</title>
<link>https://www.hanwa.co.jp/news/ir/202606265343/</link>
<pubDate>Fri, 26 Jun 2026 06:00:33 +0000</pubDate>
<dc:creator><!\[CDATA\[hksecret\]\]></dc:creator>
<guid isPermaLink="false">https://www.hanwa.co.jp/?post\_type=ir\_post&p=5343</guid>
<description><!\[CDATA\[\]\]></description>
<content:encoded><!\[CDATA\[\]\]></content:encoded>
</item>
<item>
<title>第79回定時株主総会決議ご通知</title>
<link>https://www.hanwa.co.jp/news/ir/202606265339/</link>
<pubDate>Fri, 26 Jun 2026 04:00:06 +0000</pubDate>
<dc:creator><!\[CDATA\[hksecret\]\]></dc:creator>
<guid isPermaLink="false">https://www.hanwa.co.jp/?post\_type=ir\_post&p=5339</guid>
<description><!\[CDATA\[\]\]></description>
<content:encoded><!\[CDATA\[\]\]></content:encoded>
</item>
<item>
<title>阪和興業、自社電源活用の再エネ供給スキームを提供開始~FIT 特定卸供給を活用し自産自消モデルを構築~</title>
<link>https://www.hanwa.co.jp/news/202606255335/</link>
<pubDate>Thu, 25 Jun 2026 02:00:29 +0000</pubDate>
<dc:creator><!\[CDATA\[hksecret\]\]></dc:creator>
<guid isPermaLink="false">https://www.hanwa.co.jp/?post\_type=news\_post&p=5335</guid>
<description><!\[CDATA\[\]\]></description>
<content:encoded><!\[CDATA\[\]\]></content:encoded>
</item>
<item>
<title>インドネシアにおけるニッケル・コバルト材料(MHP)製造事業への参画および供給体制強化に関するお知らせ</title>
<link>https://www.hanwa.co.jp/news/202606245330/</link>
<pubDate>Wed, 24 Jun 2026 01:00:00 +0000</pubDate>
<dc:creator><!\[CDATA\[hksecret\]\]></dc:creator>
<guid isPermaLink="false">https://www.hanwa.co.jp/?post\_type=news\_post&p=5330</guid>
<description><!\[CDATA\[\]\]></description>
<content:encoded><!\[CDATA\[\]\]></content:encoded>
</item>
<item>
<title>有価証券報告書 2025年4月1日-2026年3月31日</title>
<link>https://www.hanwa.co.jp/news/ir/202606195327/</link>
<pubDate>Fri, 19 Jun 2026 02:46:53 +0000</pubDate>
<dc:creator><!\[CDATA\[hksecret\]\]></dc:creator>
<guid isPermaLink="false">https://www.hanwa.co.jp/?post\_type=ir\_post&p=5327</guid>
<description><!\[CDATA\[\]\]></description>
<content:encoded><!\[CDATA\[\]\]></content:encoded>
</item>
<item>
<title>(訂正・数値データ訂正) 「2026年3月期 決算短信〔日本基準〕(連結)」の一部訂正のお知らせ</title>
<link>https://www.hanwa.co.jp/news/ir/202606185319/</link>
<pubDate>Thu, 18 Jun 2026 04:00:17 +0000</pubDate>
<dc:creator><!\[CDATA\[hksecret\]\]></dc:creator>
<guid isPermaLink="false">https://www.hanwa.co.jp/?post\_type=ir\_post&p=5319</guid>
<description><!\[CDATA\[\]\]></description>
<content:encoded><!\[CDATA\[\]\]></content:encoded>
</item>
<item>
<title>機械設備のユニット製作において再生材率100%アルミニウム材を活用 施工段階のCO₂排出量を10.8%削減(第三者保証取得)</title>
<link>https://www.hanwa.co.jp/news/202606055316/</link>
<pubDate>Fri, 05 Jun 2026 02:00:46 +0000</pubDate>
<dc:creator><!\[CDATA\[hksecret\]\]></dc:creator>
<guid isPermaLink="false">https://www.hanwa.co.jp/?post\_type=news\_post&p=5316</guid>
<description><!\[CDATA\[\]\]></description>
<content:encoded><!\[CDATA\[\]\]></content:encoded>
</item>
<item>
<title>阪和興業、ミッション訴求CM動画を制作</title>
<link>https://www.hanwa.co.jp/news/202606035304/</link>
<pubDate>Wed, 03 Jun 2026 04:00:22 +0000</pubDate>
<dc:creator><!\[CDATA\[hksecret\]\]></dc:creator>
<guid isPermaLink="false">https://www.hanwa.co.jp/?post\_type=news\_post&p=5304</guid>
<description><!\[CDATA\[~「すべての『ほしい』をつなげてく。」をテーマに放映開始(BSフジほか・YouTube) 阪和興業株式会社(以下、当社)は、このたびCM動画を制作し、2026年6月4日(木)から6月7日(日)に開催される「BMW 日本 \[…\]\]\]></description>
<content:encoded><!\[CDATA\[<p><strong><span style="font-size: 19pt;">~「すべての『ほしい』をつなげてく。」をテーマに放映開始(BSフジほか・YouTube)</span></strong></p>\
<item>
<title>自己株式の取得状況に関するお知らせ</title>
<link>https://www.hanwa.co.jp/news/ir/202606015301/</link>
<pubDate>Mon, 01 Jun 2026 04:00:11 +0000</pubDate>
<dc:creator><!\[CDATA\[hksecret\]\]></dc:creator>
<guid isPermaLink="false">https://www.hanwa.co.jp/?post\_type=ir\_post&p=5301</guid>
<description><!\[CDATA\[\]\]></description>
<content:encoded><!\[CDATA\[\]\]></content:encoded>
</item>
<item>
<title>第79回定時株主総会招集ご通知</title>
<link>https://www.hanwa.co.jp/news/ir/202605285290/</link>
<pubDate>Thu, 28 May 2026 00:07:35 +0000</pubDate>
<dc:creator><!\[CDATA\[hksecret\]\]></dc:creator>
<guid isPermaLink="false">https://www.hanwa.co.jp/?post\_type=ir\_post&p=5290</guid>
<description><!\[CDATA\[\]\]></description>
<content:encoded><!\[CDATA\[\]\]></content:encoded>
</item>
<item>
<title>第79回定時株主総会その他の電子提供措置事項(交付書面省略事項)</title>
<link>https://www.hanwa.co.jp/news/ir/202605285288/</link>
<pubDate>Thu, 28 May 2026 00:07:24 +0000</pubDate>
<dc:creator><!\[CDATA\[hksecret\]\]></dc:creator>
<guid isPermaLink="false">https://www.hanwa.co.jp/?post\_type=ir\_post&p=5288</guid>
<description><!\[CDATA\[\]\]></description>
<content:encoded><!\[CDATA\[\]\]></content:encoded>
</item>
<item>
<title>リン・レアアース鉱石生産者KAP MINERALSと戦略的協業に関する基本合意書締結のお知らせ</title>
<link>https://www.hanwa.co.jp/news/202605135272/</link>
<pubDate>Wed, 13 May 2026 01:00:51 +0000</pubDate>
<dc:creator><!\[CDATA\[hksecret\]\]></dc:creator>
<guid isPermaLink="false">https://www.hanwa.co.jp/?post\_type=news\_post&p=5272</guid>
<description><!\[CDATA\[\]\]></description>
<content:encoded><!\[CDATA\[\]\]></content:encoded>
</item>
<item>
<title>2026年3月期 決算短信(修正版)</title>
<link>https://www.hanwa.co.jp/news/ir/202605125251/</link>
<pubDate>Tue, 12 May 2026 04:01:06 +0000</pubDate>
<dc:creator><!\[CDATA\[hksecret\]\]></dc:creator>
<guid isPermaLink="false">https://www.hanwa.co.jp/?post\_type=ir\_post&p=5251</guid>
<description><!\[CDATA\[\]\]></description>
<content:encoded><!\[CDATA\[\]\]></content:encoded>
</item>
<item>
<title>剰余金の配当(増配)に関するお知らせ</title>
<link>https://www.hanwa.co.jp/news/ir/202605125253/</link>
<pubDate>Tue, 12 May 2026 04:00:57 +0000</pubDate>
<dc:creator><!\[CDATA\[hksecret\]\]></dc:creator>
<guid isPermaLink="false">https://www.hanwa.co.jp/?post\_type=ir\_post&p=5253</guid>
<description><!\[CDATA\[\]\]></description>
<content:encoded><!\[CDATA\[\]\]></content:encoded>
</item>
<item>
<title>自己株式取得に係る事項の決定および自己株式消却に係る事項の決定に関するお知らせ</title>
<link>https://www.hanwa.co.jp/news/ir/202605125255/</link>
<pubDate>Tue, 12 May 2026 04:00:48 +0000</pubDate>
<dc:creator><!\[CDATA\[hksecret\]\]></dc:creator>
<guid isPermaLink="false">https://www.hanwa.co.jp/?post\_type=ir\_post&p=5255</guid>
<description><!\[CDATA\[\]\]></description>
<content:encoded><!\[CDATA\[\]\]></content:encoded>
</item>
<item>
<title>阪和興業 中期経営計画(2026 年度-2028 年度)に関するお知らせ</title>
<link>https://www.hanwa.co.jp/news/ir/202605125256/</link>
<pubDate>Tue, 12 May 2026 04:00:36 +0000</pubDate>
<dc:creator><!\[CDATA\[hksecret\]\]></dc:creator>
<guid isPermaLink="false">https://www.hanwa.co.jp/?post\_type=ir\_post&p=5256</guid>
<description><!\[CDATA\[\]\]></description>
<content:encoded><!\[CDATA\[\]\]></content:encoded>
</item>
<item>
<title>2026年3月期 決算説明資料</title>
<link>https://www.hanwa.co.jp/news/ir/202605125257/</link>
<pubDate>Tue, 12 May 2026 04:00:23 +0000</pubDate>
<dc:creator><!\[CDATA\[hksecret\]\]></dc:creator>
<guid isPermaLink="false">https://www.hanwa.co.jp/?post\_type=ir\_post&p=5257</guid>
<description><!\[CDATA\[\]\]></description>
<content:encoded><!\[CDATA\[\]\]></content:encoded>
</item>
<item>
<title>当社および完全子会社間における会社分割(簡易吸収分割)に関するお知らせ</title>
<link>https://www.hanwa.co.jp/news/ir/202604245244/</link>
<pubDate>Fri, 24 Apr 2026 04:01:18 +0000</pubDate>
<dc:creator><!\[CDATA\[hksecret\]\]></dc:creator>
<guid isPermaLink="false">https://www.hanwa.co.jp/?post\_type=ir\_post&p=5244</guid>
<description><!\[CDATA\[\]\]></description>
<content:encoded><!\[CDATA\[\]\]></content:encoded>
</item>
<item>
<title>インドネシアで炭鉱跡地を活用したバイオ燃料原料植物ポンガミア試験栽培プロジェクトを開始 ~バイオ燃料原料の供給可能性とカーボンクレジット創出を検証~</title>
<link>https://www.hanwa.co.jp/news/202604145236/</link>
<pubDate>Tue, 14 Apr 2026 02:00:44 +0000</pubDate>
<dc:creator><!\[CDATA\[hksecret\]\]></dc:creator>
<guid isPermaLink="false">https://www.hanwa.co.jp/?post\_type=news\_post&p=5236</guid>
<description><!\[CDATA\[\]\]></description>
<content:encoded><!\[CDATA\[\]\]></content:encoded>
</item>
<item>
<title>インドネシア林業省と阪和興業が公式会合を実施 </title>
<link>https://www.hanwa.co.jp/news/csr/202604075234/</link>
<pubDate>Tue, 07 Apr 2026 04:06:52 +0000</pubDate>
<dc:creator><!\[CDATA\[hksecret\]\]></dc:creator>
<guid isPermaLink="false">https://www.hanwa.co.jp/?post\_type=csr\_post&p=5234</guid>
<description><!\[CDATA\[―持続可能な森林ガバナンスおよび透明性の高いサプライチェーン構築に向けて― 阪和興業株式会社(以下、当社)は、2026年3月4日、日本のエンドユーザーとともに、インドネシア共和国林業省(以下、インドネシア林業省) をジャ \[…\]\]\]></description>
<content:encoded><!\[CDATA\[<p><strong><span style="font-size: 19pt;">―持続可能な森林ガバナンスおよび透明性の高いサプライチェーン構築に向けて―</span></strong></p>\
<item>
<title>第79回定時株主総会開催のお知らせ</title>
<link>https://www.hanwa.co.jp/news/ir/202604015277/</link>
<pubDate>Wed, 01 Apr 2026 06:39:56 +0000</pubDate>
<dc:creator><!\[CDATA\[hksecret\]\]></dc:creator>
<guid isPermaLink="false">https://www.hanwa.co.jp/?post\_type=ir\_post&p=5277</guid>
<description><!\[CDATA\[第79回(2025年度) 定時株主総会を6月26日(金)10時に開催いたします。 開催日時 2026年6月26日(金) 午前10時 開催場所 大阪市中央区伏見町四丁目3番9号 HK淀屋橋ガーデンアベニュー 阪和興業株式会 \[…\]\]\]></description>
<content:encoded><!\[CDATA\[<p>第79回(2025年度) 定時株主総会を6月26日(金)10時に開催いたします。</p>\
<item>
<title>特定子会社の異動に関するお知らせ</title>
<link>https://www.hanwa.co.jp/news/ir/202603255221/</link>
<pubDate>Wed, 25 Mar 2026 04:01:14 +0000</pubDate>
<dc:creator><!\[CDATA\[hksecret\]\]></dc:creator>
<guid isPermaLink="false">https://www.hanwa.co.jp/?post\_type=ir\_post&p=5221</guid>
<description><!\[CDATA\[\]\]></description>
<content:encoded><!\[CDATA\[\]\]></content:encoded>
</item>
<item>
<title>「パートナーシップ構築宣言」更新のお知らせ</title>
<link>https://www.hanwa.co.jp/news/csr/202603245214/</link>
<pubDate>Tue, 24 Mar 2026 04:01:15 +0000</pubDate>
<dc:creator><!\[CDATA\[hksecret\]\]></dc:creator>
<guid isPermaLink="false">https://www.hanwa.co.jp/?post\_type=csr\_post&p=5214</guid>
<description><!\[CDATA\[当社は、2026年1月1日に施行された「受託中小企業振興法」に基づく振興基準の改正に伴い、 2022年に賛同し公表した「パートナーシップ構築宣言」を更新いたしました。 引き続き、サプライチェーンの取引先や価値創造を図る事 \[…\]\]\]></description>
<content:encoded><!\[CDATA\[<p>当社は、2026年1月1日に施行された「受託中小企業振興法」に基づく振興基準の改正に伴い、<br />\
2022年に賛同し公表した「パートナーシップ構築宣言」を更新いたしました。\
<item>
<title>「マルチステークホルダー方針」更新のお知らせ</title>
<link>https://www.hanwa.co.jp/news/csr/202603245211/</link>
<pubDate>Tue, 24 Mar 2026 04:01:06 +0000</pubDate>
<dc:creator><!\[CDATA\[hksecret\]\]></dc:creator>
<guid isPermaLink="false">https://www.hanwa.co.jp/?post\_type=csr\_post&p=5211</guid>
<description><!\[CDATA\[当社は、2023年4月に「マルチステークホルダー方針」を策定し公表しておりますが、「1. 従業員への還元」における取組状況 および「パートナーシップ構築宣言」の更新に伴い、「マルチステークホルダー方針」を改定いたしました \[…\]\]\]></description>
<content:encoded><!\[CDATA\[<p>当社は、2023年4月に「マルチステークホルダー方針」を策定し公表しておりますが、「1. 従業員への還元」における取組状況<br />\
および「パートナーシップ構築宣言」の更新に伴い、「マルチステークホルダー方針」を改定いたしました。\
<item>
<title>西部サービスが「エコアクション21オブザイヤー2025」で金賞(環境大臣賞)を受賞</title>
<link>https://www.hanwa.co.jp/news/csr/202603235202/</link>
<pubDate>Mon, 23 Mar 2026 02:00:45 +0000</pubDate>
<dc:creator><!\[CDATA\[hksecret\]\]></dc:creator>
<guid isPermaLink="false">https://www.hanwa.co.jp/?post\_type=csr\_post&p=5202</guid>
<description><!\[CDATA\[阪和興業株式会社の子会社である西部サービス株式会社グループ(本社:兵庫県神戸市、社長:片境邦喜)は、このたび「エコアクション21オブザイヤー2025」において環境経営レポート部門で最高位の【金賞(環境大臣賞)】を、またソ \[…\]\]\]></description>
<content:encoded><!\[CDATA\[<p>阪和興業株式会社の子会社である西部サービス株式会社グループ(本社:兵庫県神戸市、社長:片境邦喜)は、このたび「エコアクション21オブザイヤー2025」において環境経営レポート部門で最高位の【金賞(環境大臣賞)】を、またソーシャル部門でも【優良賞】を受賞いたしました。</p>\
<item>
<title>健康経営優良法人 2026 認定について</title>
<link>https://www.hanwa.co.jp/news/csr/202603125199/</link>
<pubDate>Thu, 12 Mar 2026 01:00:56 +0000</pubDate>
<dc:creator><!\[CDATA\[hksecret\]\]></dc:creator>
<guid isPermaLink="false">https://www.hanwa.co.jp/?post\_type=csr\_post&p=5199</guid>
<description><!\[CDATA\[\]\]></description>
<content:encoded><!\[CDATA\[\]\]></content:encoded>
</item>
<item>
<title>「SMART GRID EXPO スマートグリッド展」に共同出展します</title>
<link>https://www.hanwa.co.jp/news/202603095184/</link>
<pubDate>Mon, 09 Mar 2026 01:05:32 +0000</pubDate>
<dc:creator><!\[CDATA\[hksecret\]\]></dc:creator>
<guid isPermaLink="false">https://www.hanwa.co.jp/?post\_type=news\_post&p=5184</guid>
<description><!\[CDATA\[阪和興業株式会社(以下、当社)は、2026年3月17日(火)~19日(木)に東京ビッグサイトで開催される『SMART ENERGY WEEK』内の『SMART GRID EXPO スマートグリッド展』に、REPT BAT \[…\]\]\]></description>
<content:encoded><!\[CDATA\[<p>阪和興業株式会社(以下、当社)は、2026年3月17日(火)~19日(木)に東京ビッグサイトで開催される『SMART ENERGY WEEK』内の『<a href="https://www.wsew.jp/hub/ja-jp/about/sg.html">SMART GRID EXPO スマートグリッド展</a>』に、REPT BATTERO Energy Co., Ltd.(以下、REPT)と共同でブースを出展します。</p>\
<item>
<title>REPT BATTEROと販売代理店契約を締結 ~日本市場における定置型蓄電池分野へ本格参入~</title>
<link>https://www.hanwa.co.jp/news/202603095185/</link>
<pubDate>Mon, 09 Mar 2026 01:00:47 +0000</pubDate>
<dc:creator><!\[CDATA\[hksecret\]\]></dc:creator>
<guid isPermaLink="false">https://www.hanwa.co.jp/?post\_type=news\_post&p=5185</guid>
<description><!\[CDATA\[\]\]></description>
<content:encoded><!\[CDATA\[\]\]></content:encoded>
</item>
<item>
<title>不要となった卓球ラバーが“新たな資源”に Tリーグ×阪和興業 社会貢献プログラム開催のお知らせ</title>
<link>https://www.hanwa.co.jp/news/202603065191/</link>
<pubDate>Fri, 06 Mar 2026 02:00:16 +0000</pubDate>
<dc:creator><!\[CDATA\[hksecret\]\]></dc:creator>
<guid isPermaLink="false">https://www.hanwa.co.jp/?post\_type=news\_post&p=5191</guid>
<description><!\[CDATA\[\]\]></description>
<content:encoded><!\[CDATA\[\]\]></content:encoded>
</item>
<item>
<title>シンガポールに物流会社を新設 ~アジアを起点にグローバルサプライチェーンを強化~</title>
<link>https://www.hanwa.co.jp/news/202603025182/</link>
<pubDate>Mon, 02 Mar 2026 01:00:43 +0000</pubDate>
<dc:creator><!\[CDATA\[hksecret\]\]></dc:creator>
<guid isPermaLink="false">https://www.hanwa.co.jp/?post\_type=news\_post&p=5182</guid>
<description><!\[CDATA\[\]\]></description>
<content:encoded><!\[CDATA\[\]\]></content:encoded>
</item>
<item>
<title>株式会社富士昭サンマテックへの一部出資のお知らせ</title>
<link>https://www.hanwa.co.jp/news/202602275177/</link>
<pubDate>Fri, 27 Feb 2026 05:00:28 +0000</pubDate>
<dc:creator><!\[CDATA\[hksecret\]\]></dc:creator>
<guid isPermaLink="false">https://www.hanwa.co.jp/?post\_type=news\_post&p=5177</guid>
<description><!\[CDATA\[\]\]></description>
<content:encoded><!\[CDATA\[\]\]></content:encoded>
</item>
<item>
<title>「CSIのCoC認証」取得のお知らせ</title>
<link>https://www.hanwa.co.jp/news/202602275175/</link>
<pubDate>Fri, 27 Feb 2026 02:00:03 +0000</pubDate>
<dc:creator><!\[CDATA\[hksecret\]\]></dc:creator>
<guid isPermaLink="false">https://www.hanwa.co.jp/?post\_type=news\_post&p=5175</guid>
<description><!\[CDATA\[\]\]></description>
<content:encoded><!\[CDATA\[\]\]></content:encoded>
</item>
<item>
<title>自己株式の取得状況及び取得終了に関するお知らせ</title>
<link>https://www.hanwa.co.jp/news/ir/202602255168/</link>
<pubDate>Wed, 25 Feb 2026 04:00:17 +0000</pubDate>
<dc:creator><!\[CDATA\[hksecret\]\]></dc:creator>
<guid isPermaLink="false">https://www.hanwa.co.jp/?post\_type=ir\_post&p=5168</guid>
<description><!\[CDATA\[\]\]></description>
<content:encoded><!\[CDATA\[\]\]></content:encoded>
</item>
<item>
<title>株式会社丸イホールディングスならびに株式会社丸イ佐藤海産のグループ会社化のお知らせ</title>
<link>https://www.hanwa.co.jp/news/202602195163/</link>
<pubDate>Thu, 19 Feb 2026 00:30:57 +0000</pubDate>
<dc:creator><!\[CDATA\[hksecret\]\]></dc:creator>
<guid isPermaLink="false">https://www.hanwa.co.jp/?post\_type=news\_post&p=5163</guid>
<description><!\[CDATA\[\]\]></description>
<content:encoded><!\[CDATA\[\]\]></content:encoded>
</item>
<item>
<title>2026年4月 組織変更・部課長人事の件</title>
<link>https://www.hanwa.co.jp/news/202602185161/</link>
<pubDate>Wed, 18 Feb 2026 04:30:38 +0000</pubDate>
<dc:creator><!\[CDATA\[hksecret\]\]></dc:creator>
<guid isPermaLink="false">https://www.hanwa.co.jp/?post\_type=news\_post&p=5161</guid>
<description><!\[CDATA\[\]\]></description>
<content:encoded><!\[CDATA\[\]\]></content:encoded>
</item>
<item>
<title>鉄建工業株式会社の「ユースエール認定」取得について</title>
<link>https://www.hanwa.co.jp/news/csr/202602095150/</link>
<pubDate>Mon, 09 Feb 2026 01:00:28 +0000</pubDate>
<dc:creator><!\[CDATA\[hksecret\]\]></dc:creator>
<guid isPermaLink="false">https://www.hanwa.co.jp/?post\_type=csr\_post&p=5150</guid>
<description><!\[CDATA\[阪和興業株式会社の子会社である鉄建工業株式会社(本社:福井県坂井市、社長:柿本 哲平)が、厚生労働大臣より「ユースエール認定」を取得しました(認定日:2025年12月8日)。 【鉄建工業の取り組み】 鉄建工業では、休暇を \[…\]\]\]></description>
<content:encoded><!\[CDATA\[<p>阪和興業株式会社の子会社である鉄建工業株式会社(本社:福井県坂井市、社長:柿本 哲平)が、厚生労働大臣より「ユースエール認定」を取得しました(認定日:2025年12月8日)。</p>\
<item>
<title>2026年3月期 第3四半期決算短信</title>
<link>https://www.hanwa.co.jp/news/ir/202602065151/</link>
<pubDate>Fri, 06 Feb 2026 04:00:29 +0000</pubDate>
<dc:creator><!\[CDATA\[hksecret\]\]></dc:creator>
<guid isPermaLink="false">https://www.hanwa.co.jp/?post\_type=ir\_post&p=5151</guid>
<description><!\[CDATA\[\]\]></description>
<content:encoded><!\[CDATA\[\]\]></content:encoded>
</item>
<item>
<title>2026年3月期 第3四半期決算説明資料</title>
<link>https://www.hanwa.co.jp/news/ir/202602065153/</link>
<pubDate>Fri, 06 Feb 2026 04:00:07 +0000</pubDate>
<dc:creator><!\[CDATA\[hksecret\]\]></dc:creator>
<guid isPermaLink="false">https://www.hanwa.co.jp/?post\_type=ir\_post&p=5153</guid>
<description><!\[CDATA\[\]\]></description>
<content:encoded><!\[CDATA\[\]\]></content:encoded>
</item>
<item>
<title>阪和興業、UAE での天然黒鉛精製事業への参画に向けた意向表明書を締結</title>
<link>https://www.hanwa.co.jp/news/202602035147/</link>
<pubDate>Tue, 03 Feb 2026 04:00:19 +0000</pubDate>
<dc:creator><!\[CDATA\[hksecret\]\]></dc:creator>
<guid isPermaLink="false">https://www.hanwa.co.jp/?post\_type=news\_post&p=5147</guid>
<description><!\[CDATA\[\]\]></description>
<content:encoded><!\[CDATA\[\]\]></content:encoded>
</item>
<item>
<title>自己株式の取得状況に関するお知らせ</title>
<link>https://www.hanwa.co.jp/news/ir/202602025143/</link>
<pubDate>Mon, 02 Feb 2026 04:00:22 +0000</pubDate>
<dc:creator><!\[CDATA\[hksecret\]\]></dc:creator>
<guid isPermaLink="false">https://www.hanwa.co.jp/?post\_type=ir\_post&p=5143</guid>
<description><!\[CDATA\[\]\]></description>
<content:encoded><!\[CDATA\[\]\]></content:encoded>
</item>
<item>
<title>2026年度役員人事等の件</title>
<link>https://www.hanwa.co.jp/news/202601285140/</link>
<pubDate>Wed, 28 Jan 2026 05:00:16 +0000</pubDate>
<dc:creator><!\[CDATA\[hksecret\]\]></dc:creator>
<guid isPermaLink="false">https://www.hanwa.co.jp/?post\_type=news\_post&p=5140</guid>
<description><!\[CDATA\[\]\]></description>
<content:encoded><!\[CDATA\[\]\]></content:encoded>
</item>
<item>
<title>代表取締役の異動に関するお知らせ</title>
<link>https://www.hanwa.co.jp/news/202601275137/</link>
<pubDate>Tue, 27 Jan 2026 06:00:18 +0000</pubDate>
<dc:creator><!\[CDATA\[hksecret\]\]></dc:creator>
<guid isPermaLink="false">https://www.hanwa.co.jp/?post\_type=news\_post&p=5137</guid>
<description><!\[CDATA\[\]\]></description>
<content:encoded><!\[CDATA\[\]\]></content:encoded>
</item>
<item>
<title>阪和興業、第 22 回 LCA 日本フォーラム表彰で「奨励賞」を受賞</title>
<link>https://www.hanwa.co.jp/news/202601215129/</link>
<pubDate>Wed, 21 Jan 2026 06:00:19 +0000</pubDate>
<dc:creator><!\[CDATA\[hksecret\]\]></dc:creator>
<guid isPermaLink="false">https://www.hanwa.co.jp/?post\_type=news\_post&p=5129</guid>
<description><!\[CDATA\[\]\]></description>
<content:encoded><!\[CDATA\[\]\]></content:encoded>
</item>
<item>
<title>自己株式の取得状況に関するお知らせ</title>
<link>https://www.hanwa.co.jp/news/ir/202601055123/</link>
<pubDate>Mon, 05 Jan 2026 04:01:12 +0000</pubDate>
<dc:creator><!\[CDATA\[hksecret\]\]></dc:creator>
<guid isPermaLink="false">https://www.hanwa.co.jp/?post\_type=ir\_post&p=5123</guid>
<description><!\[CDATA\[\]\]></description>
<content:encoded><!\[CDATA\[\]\]></content:encoded>
</item>