世界のモノづくりに、創造の翼を。 統合報告書 2026 世界のモノづくりに、 創造の翼を。 現場を見る。課題に耳を澄ます。 最適な機械と、より良い生産の仕組みを考える。 これらはすべて、わたしたち第一実業のしごとです。 人と人をつなぐ。技術と技術をつなぐ。…
世界のモノづくりに、創造の翼を。
統合報告書
2026
世界のモノづくりに、
創造の翼を。
現場を見る。課題に耳を澄ます。
最適な機械と、より良い生産の仕組みを考える。
これらはすべて、わたしたち第一実業のしごとです。
人と人をつなぐ。技術と技術をつなぐ。
ユーザーのモノづくり企業と、産業機械のメーカーをつなぐ。
わたしたちは、単なる機械商社ではなく、
独自のエンジニアリングを通じて、
日本の、そして世界のモノづくりを支えてきました。
時代が変われば、世の中のニーズも変わります。
国内と海外ではなく、国境のない事業環境へ。
実体のある製品から、サービスやソリューションへ。
顧客課題だけでなく、社会課題も考えるビジネスへ。
サステナブルな社会の実現にむけて、
既存技術と新たなテクノロジーの融合が期待されています。
001
あらゆる製造現場を支え、新たな付加価値を提供する。
お客様とともに成長し、豊かな社会に貢献する。
世界のモノづくりに、創造の翼を。
第一実業はこれからも、
世界中のお客様とともに未来へと羽ばたきます。
002
経営理念
ミッション
Mission
果たすべき使命
ビジョン
Vision
あるべき姿
人をつなぎ、技術をつなぎ、世界を豊かに
「次世代型エンジニアリング商社」
時代の一歩先を行くモノづくりパートナーを目指し、
当社のエンジニアリング機能を核として継続的な価値の提供により
グローバルにお客様事業の成長と持続可能な社会の実現に貢献します。
信頼
バリュー
Value
価値基準
成長
貢献
社内外の関係者と協調し、ステークホル
独自のエンジニアリング機能によるモノ
経営の透明性と会社の継続的な品質の
ダーからの期待や社会的責任と当社目標
づくりへの貢献とともに、積極的な成長
向上を通じて、重要な社会課題に積極的
を一致させながら、やりがいに溢れ、個
市場への投資・事業領域の拡大により
に取り組むことで持続可能な社会の実現
人が尊重され、成長を実感できる会社を
継続的な成長を目指します。
に貢献します。
目指します。
003
サステナビリティ戦略
支える社員の姿を多面的に紹介しています。漫画で紐解く「次世代型エンジ
006 第一実業とは
007 漫画で知る
065 サステナビリティ推進責任者メッセージ
067 マテリアリティへの取り組み
068 マテリアリティ 1
社員座談会を通じて、事業を支える人材のリアルな姿と価値創造への取り組
071 マテリアリティ 2
国際統合報告評議会(IIRC)
「国際統合フレームワーク」、経済産業省「価値
モノづくり現場における新たな価値の創造
エンジニアリング機能強化による
ソリューションの高付加価値化
073 マテリアリティ 3
働く環境の整備と多様な人材の確保・育成
気候変動への取り組みとサプライチェーンマネジメント
一助となれば幸いです。
参考としたガイドライン
協創のための統合的開示・対話ガイダンス」など
対象期間
2025年4月1日〜2026年3月31日(一部に対象外の情報も含む)
対象組織
第一実業株式会社および国内・海外グループ会社
事業戦略
080 社外取締役座談会
084 マテリアリティ 4
みをお伝えしています。本報告書が、皆様に当社への理解を深めていただく
価値創造
0 1 1 成長を支える資本
0 1 2 価値創造プロセス
0 1 3 価値創造のあゆみ
01 6 事業ポートフォリオ
0 1 7 競争優位性を支える4つの強み
019 CEOメッセージ
023 社員座談会
ニアリング商社」や、当社の強みや課題、これからの組織づくりについて語る
09 1 マテリアリティ 5
事業戦略
産業機械事業
エレクトロニクス事業
特集
AIデータセンター需要に応える4つの注力領域
任意開示
データ
1 05 財務・非財務ハイライト
1 07 11ヵ年連結財務サマリー
1 09 グループ会社一覧
1 1 0 会社概要/株式情報
IR WEBサイト・サステナビリティWEBサイト
株主通信
会社案内
決算説明会資料
統合報告書
決算短信※
サステナビリティ戦略
エナジーソリューションズ 事業
ツールマップ
非財務情報
プラント・エネルギー事業
1 0 2 地域社会に向けた取り組み
財務情報
029 COOメッセージ
033 CFOメッセージ
036 成長戦略と中期経営計画
038 事業別戦略
ガバナンスの拡充
DAIICHI JITSUGYO CO., LTD.
編集方針
本年度は、当社の競争優位性の源泉である「人」に焦点を当て、価値創造を
価値創造
「次世代型エンジニアリング商社」
Integrated Report 2026
目次
コーポレート・ガバナンス報告書※
有価証券報告書 ※
自動車事業
法定開示
※法定開示
航空・インフラ事業
060 海外戦略
見通しに関する注意事項
データ
ヘルスケア事業
本資料に記載されている当社の業績見通し、経営目標、その他歴史的事実でない
ものは、現時点での入手可能な情報に基づき、将来の業績に関する見通しを示し
たものです。実際の業績は、さまざまな要因によりこれらの業績見通しとは大き
く異なる結果となり得ることをご承知おきください。
004
DAIICHI JITSUGYO CO., LTD.
Integrated Report 2026
価値創造
006 第一実業とは
007 漫画で知る
「次世代型エンジニアリング商社」
サステナビリティ戦略
Value
Creation
事業戦略
価値創造
0 1 1 成長を支える資本
0 1 2 価値創造プロセス
01 6 事業ポートフォリオ
データ
0 1 3 価値創造のあゆみ
0 1 7 競争優位性を支える4つの強み
019 CEOメッセージ
023 社員座談会
005
私たちは、メーカーとユーザーを技術力と提案力でつなぎ
世界を豊かにする次世代型エンジニアリング商社です。
価値創造
第一実業は、サプライヤーである「産業機械 メーカー」と
DAIICHI JITSUGYO CO., LTD.
Integrated Report 2026
第一実業とは
ユーザーである「モノづくり企業」をつなぐ総合機械専門商社として、
創業 から約 8 0 年にわたり、産業機械を売るだけでなく、
エンジニアリングを通じて社会と経済 の 発展に貢献してきました。
製造・販売・サービスの 一体型ソリューションにより、
世界 の産業における価値あるパートナーとして、
事業戦略
新 たな未来 の創造を支援しています。
産業機械
メーカー
製品
お客様のニーズ
第一実業
製品/サービス
相談
モノづくり
企業
約 3,600社
データ
約 5,600社
お客様
サステナビリティ戦略
仕入先様
006
次世代型エンジニアリング 商社って? 普通の商社と何が 違うの?
DAIICHI JITSUGYO CO., LTD.
Integrated Report 2026
漫画で知る「次世代型エンジニアリング商社」
そん な疑問にお 答えすべく、第一実業 の 仕事を 分 かりやすく紹介します!
設備投資は決まったの
ですが…
A社生産技術部
人手不足で、
プラント設計も
プロジェクト
マネジメントも、
量産開始日は
決まっている
けど、本当に
各メーカーに
問い合わせる
仕様書作りも
間に合う
大変だ
のか…?
A社
にて現場ヒアリング
確保できない…
私たちは、お客様の
汎用性があり、
グローバル展開
できる設備が
良いのですが…
コスト競争力の
ある韓国のB社は
どうでしょう?
ご要望に合わせて、
工場や生産設備の
設計・調達・建設を
ここはやはり
納入実績が豊富な
日本のC社がいいと思う。
オペレーターさんの
要望にぴったりだ
データ
コーディネートする
エンジニアリング
商社です
この設備を
使用しているの
でしたら、
おすすめは
サステナビリティ戦略
新規プロジェクト
推進でお困りでしたら
おまかせください
新製品の
製造ラインを
新設ですね
事業戦略
十分な人材が
はい!
おまかせ
ください
工程設計、設備調達、
プロジェクト管理なども
ご相談できますか?
価値創造
新製品の製造ラインへの
第一実業
営業
パンチング工程は
ドイツのD社が
耐久性と速度で
優れていますね
でもE社なら、
短納期の対応が
可能です
007
工程ごとに
メーカーが
違うんですね!
てっきりC社で
統一する
のかと思いました
なので特定メーカー
に縛られません。
お客様にとって
最適な設備を、
世界中から
選定できます
価値創造
では拡張性を優先した
設計にしましょう
総合機械商社
A社へ
仕様書の提案
DAIICHI JITSUGYO CO., LTD.
ヒアリング完了後
第一実業社内打ち合わせ
私たちより
詳しい…
私たちは独立系の
Integrated Report 2026
こちらで一旦
社内に持ち帰り
仕様書作成に
進みます
事業戦略
必要に応じて
オーダーメイド品で
アレンジいたします
エンジニア
なるほど……
このメーカー、
初めて知りましたが
同様のプラントで
納入実績が多いんですね
データ
社内の営業とエンジニアが
一体となり、構想を
形にしていきます
グローバルネットワークを活用し、
国内外のメーカーからお客様に
最適な設備を提案します
サステナビリティ戦略
営業
お客様がおっしゃるには、
新製品なので、
他拠点への展開も
あり得るとのことです
008
安全管理、輸出入、
各社との調整――
解消し、ご要望に
すぐお応えできる
体制を整えています
しかし…
データ
工期2年。
国内外50社が関わる
大規模プロジェクトです
状況を確認し、
工程の影響を
最小限に
おさえます
サステナビリティ戦略
出荷までは順調に
きたところで、
国際情勢の影響で
船がキャンセル
され輸送に支障
がでています
設備の納期
が遅れる!?
試運転に
間に合うの
でしょうか?
事業戦略
ついに
プロジェクト
始動!
価値創造
お客様の不安を
これらを第一実業が
一括管理します。
経験豊富なスペシャリストチーム
により、大型プロジェクトでも
スムーズに
進めることが可能です
DAIICHI JITSUGYO CO., LTD.
設備手配、工程管理、
アフターサービス
専門の弊社
グループ会社や、
必要に応じて
メーカーの
エンジニアを
弊社が責任
をもって
アレンジ
します
Integrated Report 2026
海外の設備を
導入したら、
メンテナンスは
どうするんですか?
だ、大丈夫
でしょうか?
009
ネットワークが
輸送ルートの確保
支援を受け、別の
世界18ヵ国36拠点に
をしています
あります
現状と対応策
のご説明に
まいりました!
2年半後
インド拠点と
連携します。
すぐ動けますよ
もう動き
出してるん
ですか!?
メインの機械は
日本から持って
いきましょう!
現地規格適合も
対応します。
日本から現地へ
出張するご担当者の
生活サポートも
おまかせください!
そのほかの機械は、
コストダウンのため
現地で調達しましょう
ホテルやレンタカー
日本食材の手配、
就労ビザの申請や
更新の管理も
行いますよ!
さ、さすが
第一実業さん。
話が早いですね!
第一実業による
モノづくりの
支援は続く
データ
これが第一実業の現場力です
サステナビリティ戦略
現地メンバーも
お客様ファーストで貢献する
承知
しました
今回の立ち上げが
成功したので、次は
インドに工場を建設する
ことが決まりました!
事業戦略
なのでお客様、
ご安心ください
価値創造
国際物流チームの
ありがとう
ございます
DAIICHI JITSUGYO CO., LTD.
第一実業は
その節は、
途中でトラブルも
ありましたが、
滞りなく進めて
いただき
助かりました
Integrated Report 2026
無事納入
製造ライン完成
010
私 たちが 掲げるビジョン(あるべき姿)である「次世代型エンジニアリング 商社」の実現には、経営資本を活用した 継続的な価値の 提供 が欠 か せません。
DAIICHI JITSUGYO CO., LTD.
Integrated Report 2026
成長を支える資本
創業以来積み上げ てきた 実績と信頼を基盤に、各資本をより一層強化していきます。
従業員数
1,564 495
名
約
名
強固なパートナーシップ
得意先
仕入先
3,600
社
約
5,600
社
事業戦略
連結
技術職
長年培ってきた信頼
価値創造
成長戦略を支える多様な人材
※
海外従業員数
名
人的
・知的資本
組織資本
エンジニアリング機能を強化するための専門組織
海外拠点数
18ヵ国
36
拠点
製造・サービス子会社
製造子会社
サービス子会社
2
2
社
総資産
1,756
自己資本
905
億円
億円
データ
豊富なネットワーク
安定した財務基盤 ※
財務資本
サステナビリティ戦略
442
社会関係資本
自己資本比率
51.5
%
社
※ 2 0 26 年3月31日時点
011
人をつなぎ、技術をつなぎ、世界を豊かに
「V2030」の実現に向けた
価値創造プロセス
成長戦略「V2030」への目指す姿
マテリアリティ 2
マテリアリティ 3
マテリアリティ 4
マテリアリティ 5
徹底した現場主義によ
誰もが安心して働ける環
地球温暖化をはじめと
事業環境の 変化に機
当社は、
「次世代型エンジニアリング 商社」という目指 す姿 のも
当社のミッションである、
り顧客ニーズを発掘し、
人と技術をつなぐインテ
境と、多様性・包摂性を
するさまざまな社会課
敏に対応するグループ
と、商社機能とエンジニアリング 機能を掛け 合 わ せ、お 客様 の
社会課題の解決につな
グレーション機能を発展
尊重する企業風土の中で
題の解決に向けた取り
経営体制を構築し、効
がる新たな価値を提供
させ、モノづくりを中心
育まれた社員一人ひとり
組みを、
サプライチェー
率的かつ健全で透明性
している。
としたお客様の現場で、
の強みが、組織全体の強
ン全体との協業により
のある、ゆるぎないガ
圧倒的な存在価値が認
みにつながり、創造的進
推進している。
バナンス体制を維持・
められている。
化を続けている。
現場課題と社会課題 の 解決 を 通じて、持続的 な 価値 の 創造 に
取り組 んでいます。
インプット
人的・知的資本
モノづくり現場における
新たな価値の創造
●
仕入先様
脱炭素社会への貢献
自動車事業
社会関係資本
長年培ってきた信頼
●
強固なパートナーシップ
競争優位性を支える4つの強み
現場力
多様な人材の確保・育成
組織資本
●
エンジニアリング機能を
強化するための専門組織
●
豊富なネットワーク
●
製造・サービス子会社
モノづくり現場に
精通した営業が
最適設備を提案
技術力
多様な知見と経験で
複合的なエンジニアリング
機能を提供
財務資本
●
安定稼働
●
生産性向上
●
品質改善
●
省人化・自動化
●
海外展開支援
物流専門部署による
国際物流の効率化と
高度なリスク管理
054ページ
社会への価値
健康社会への貢献
国際物流機能
●
航空・インフラ事業
057ページ
交通インフラの高度化
の競争力向上
脱炭素社会への貢献
●
医療・インフラ
の高度化
エレクトロニクス事業
047ページ
●
産業機械事業
044ページ
経済への価値
生産設備の最適化
プラント・
エネルギー事業
036ページ
サプライチェーン
の強靭化
先端モノづくり支援
18ヵ国36拠点の
海外ネットワークで
顧客をサポート
モノづくり産業
●
基盤領域
グローバルネットワーク
中期経営計画「MT2027」
安定した財務基盤
ヘルスケア事業
017ページ
「V2030」の 達成 に
●
038ページ
基幹産業の安定支援
よる企業価値の向上
データ
ガバナンスの拡充
051ページ
●
車社会の革新支援
●
働く環境の整備と
顧客への価値
エナジーソリューションズ
事業 041ページ
モノづくり
企業
第一実業
アウトカム
016ページ
重点領域
お客様
産業機械
メーカー
ソリューションの高付加価値化
サプライチェーンマネジメント
アウトプット
006ページ
商社機能×エンジニアリング機能
成長戦略を支える
多様な人材
エンジニアリング機能強化による
気候変動への取り組みと
ビジネス
011ページ
サステナビリティ戦略
1
2
3
4
5
067ページ
強化している。
事業戦略
マテリアリティ
価値創造
マテリアリティ 1
DAIICHI JITSUGYO CO., LTD.
Integrated Report 2026
Mission 果たすべき使命
売上高:3,000億円
営業利益:180億円
外部環境
●
気候変動・脱炭素
●
人口構造の変化
●
労働力不足
●
サプライチェーンの複雑化
●
取引のグローバル化
●
デジタル化
●
情報セキュリティリスク
●
モノづくり現場の高度化ニーズ
012
1948 年
創業
お客様 や 仕入先様とのつな がりを大切に、
第一実業はビジネスの 幅を広げ てきました。
盤を築いていきました。
瓶の栓(王冠)のプレス機を飲料会
社に納入。この実績が大手食品・薬
品企業との取引につながりました。
1957年
営業手法の拡大
顧客の要望に応じて商品を調達する
営業に加え、有力な設備・技術を自
創業者・倉持の先見性と、石油関連分野で培った豊富な知
ら発掘し、幅広い顧客へ提案する営
見を生かし、同分野を足がかりに、事業領域を広げていきま
業手法を取り入れることで、取扱商
サステナビリティ戦略
しかし、
「これからは石油エネルギーの時代になる」という
した。
清涼飲料水ブームを背景に、ガラス
事業戦略
創業当時の営業活動は、まさにゼロからの出発でした。
1950 年
王冠プレス機を納入
材と顧客基盤の拡大を進めました。
1952年に石油製品に関する統制が撤廃されると、石油精
へとつながりました。さらに、石油化学から生まれるプラス
チックにも着目し、家電や食品包装材など幅広い分野に成
1960年代にはモータリゼーションの本格化を背景に、生
産ラインの自動化を進める自動車メーカーへ海外製機械を
多数納入しました。
創業以来培ってきた信頼関係を基盤に、時代の要請を捉
えながら、当社は事業領域を着実に広げていきました。
複数の機器・設備を含む石油精製
設備を一括受注。
1965年
自動車メーカーとの取引拡大
国内自動車メーカーへ海外製の自
データ
形加工機を拡販しました。
1961年
初の大型プラント向け設備を
受注
自動車
製会社向け機械の販売も拡大し、大型プラント案件の受注
価値創造
に応える取引を積み重ね、事業基
信頼を基盤に事業領域を拡大
商社として7名で歩みを始めました。
プラスチック成形加工
創業から3ヵ月後、冷蔵庫用サーモ
スタットを受注。以降、顧客ニーズ
1948〜1970年代
機関との信頼関係を築き、堅実で誠意ある運営を重んじる機械専門
1948 年
初の大型商談
石油・石油精製・製紙
堅実な創業 の精神は、今 なお 受け継 がれています。
戦後、新たな産業創出への機運が高まる中、当社は創業しました。
「協力一致・積極活動・堅実運営」を社是に掲げ、顧客・仕入先・金融
DAIICHI JITSUGYO CO., LTD.
価値創造のあゆみ
創業の精神を掲げ、信頼関係を築き事業機会を拡大
Integrated Report 2026
信頼を重視する
機械専門商社として
動溶接ラインを納入。自動車業界
の扉をひらきました。
013
メーカーによる自動組立機の発売
に際し、当社が販売を受託。これ
技術力とグローバル対応力を構築
を契機に、現在の主力製品である
電子部品実装機の取り扱いへとつ
ながりました。
錠剤ビデオ検査システムの総代理
権 を取得し、医薬品製造分野 へ
本格進出。その後、検査設備から
1980年代には家電製品やOA・通信機器の普及を背景に
包装設備へと取扱領域を広げ、現
在のヘルスケア事業へと発展しま
した。こうした動きに伴い、当社は1982年に専任部署を設
した。
置し、実装機の販売を本格化しました。1980年代の収益を
ズに応える技術・サービスの提供と、それを担う社員の専門
性向上が求められていました。そこで1986年、埼玉県川口
市にD.S.T.※センターを設立し、最新機器のショールーム機
1980年代後半以降、円高の進行や貿易摩擦への対応を背
景に、日系製造業各社は生産・販売拠点のグローバル化を
加速させました。当社もこうした動きに対応し、中国・アジア・
欧州・米州で事業エリアを広げ、現在では18ヵ国36拠点の
1991年
デアイサーの第一号機を納入
航空会社向けに海外製 の デ アイ
サー(防除氷車)を納入。特殊車両・
空港地上支援機材を扱う航空分野
の事業基盤を築きました。
サステナビリティ戦略
しました。
防除氷車
能を備えるとともに、提案力と対応力の強化を支える拠点と
事業戦略
また、産業機械の技術革新が進む中、多様化する顧客ニー
電子部品向け表面実装機
支える柱へと成長し、現在も当社事業の基盤を支えています。
地熱発電
電子機器市場は拡大し、製品の高性能化・小型化が進展しま
価値創造
1970年代後半〜2000年代
1979 年
医薬品分野での展開
DAIICHI JITSUGYO CO., LTD.
工作機械分野で取引のあった国内
錠剤検査機
自動組立機
1978 年
エレクトロニクス事業の開始
Integrated Report 2026
価値創造のあゆみ
ネットワークを構築しています。海外展開を進める顧客に寄
※ Demonstration, Service & Training
データ
り添い、現地で迅速に支援できる体制を整えてきました。
014
焼成炉をはじめ、電池製造に関連
する取扱製品のラインナップを拡
充していきました。
DAIICHI JITSUGYO CO., LTD.
Integrated Report 2026
2006 年
二次電池分野への進出
価値創造
リチウムイオン二次電池
価値創造のあゆみ
2000年代〜現在
次世代型エンジニアリング商社へ
とどまらず、現地工場の立ち上げから設備の据え付け、生産
トータルソリューションのニーズを
支援、アフターサービスまでを一貫して担うノウハウを蓄積
捉え、工場の立ち上げから生産支
してきました。2000年代以降は、海外拠点の拡充によりグ
ローバル対応力を高めるとともに、二次電池やヘルスケアな
援までを提供する新たなビジネス
モデルを確立しました。
2013年
後発医薬品の新工場案件に参画
ヘルスケア需要の拡大に応じ、ジェ
ネリック医薬品の新工場や、高度
管理医療機器の製造ラインなど、
ライン全体を支援するエンジニア
実績を基盤に、商社として培った調達力・提案力に、独自の
2021年
「LOGITO」の提供を開始
エンジニアリング機能を掛け合わせ、顧客の課題解決を総
合的に支援する「次世代型エンジニアリング商社」へと進化
製造現場における自動化・省人化
リュー ション「LOGITO」を 開始。
設備単体の提供にとどまらず、機器
とシステムを組み合わせたソリュー
ションへと事業領域を広げています。
データ
航空・イ ン フ ラ 事業
ヘルスケア事業
自動車事業
エレクトロニクス事業
産業機械事業
プ ラ ン ト・エ ネ ル ギ ー 事業
エナジーソリューションズ事業
ニーズに対応し、構内物流自動化ソ
サステナビリティ戦略
リングへと提供価値を広げました。
どの成長分野にも事業領域を拡大してきました。これらの
を続けています。
事業戦略
日系企業の海外進出を支援する中で、設備単体の納入に
2008 年ごろ
設備仕様から
ライン全体の設置まで
一貫したビジネスを請負
再生可能エネルギー
時代の一歩先を行く
015
政府による「日本成長戦略」の戦略17分野中12分野をカバー
第一実業 はこれ まで、日本企業 の 国内 で の成長 や グローバ ル 展開とともに、新 たな 時
プラント・
エネルギー
代 の ニーズ に合った 事業分野 へ の 参入 にチャレンジしてきました。世 の 中 の 変化や 社
ンを求 めるお 客様企業 の成長 を支援しています。時代 の 潮流 が 変わっても、新 たな 技
術革新 の 波 は 確実に訪 れ ます。常に複数の 事業分野 をもつことで、事業継続 のリスク
も抑えられています。
産業機械
AI・
半導体
合成生物学・
バイオ
自動車
ヘルスケア
航空・
インフラ
航空・宇宙
プラント・
エネルギー 事業
事業
フードテック
資源・GX
エネルギー
安全保障
自動車
事業
産業機械
基盤領域
事業
ヘルスケア
防災・
国土強靭化
創薬・
先端医療
事業
マテリアル
(重要鉱物)
エレクトロニクス 事業
当社の7つのセグメントを「売上高成長率」と、収益性・安定性・成長性を踏まえた当社独自の指標である「事業評価平均値」で分
防衛産業
情報通信
海洋
データ
事業ポートフォリオの考え方
サステナビリティ戦略
重点領域
事業戦略
エナジー
ソリューションズ
航空・インフラ 事業
エレクトロ
ニクス
価値創造
会課題をいち早くキャッチし、7つの 事業分野で常に未来を見据え、高度なソリューショ
エナジー
ソリュー
ションズ
DAIICHI JITSUGYO CO., LTD.
時代の潮流を捉えて7つの事業を展開
Integrated Report 2026
事業ポートフォリオ
類しています。自動車事業、ヘルスケア事業、エナジーソリューションズ事業、航空・インフラ事業を重点領域とし、プラント・エ
ネルギー事業、産業機械事業、エレクトロニクス事業を基盤領域という位置付けにしています。当社を取り巻く環境は、時代や事
造船※
業分野により変化していきますが、当社は7つのセグメントが相互補完関係にあると考えており、これが強みとなっています。今後
もこの7つのセグメントを維持・発展させることを前提として、経営資源の最適配分の検討を行っていきます。
※ 造船分野は株式会社第一メカテックがカバー
016
専門的なスキルをもつ営業人材と技術者 が 連携し、モノづくり現場をトータルサポート。
DAIICHI JITSUGYO CO., LTD.
Integrated Report 2026
競争優位性を支える4つの強み
グローバ ルな経営基盤を通じて、高度な付加価値の 提供 を世界へと広げ ています。
価値創造
事業戦略
国際物流機能
グローバル
ネットワーク
第一実業の営業人材は、一人ひ
製造工程全体のエンジニアリン
物流専門部署 を 設置し、国際
18ヵ 国36拠点 の ネットワ ー ク
とりが 機械 やモノづくり現場に
グ を 請 け 負 い、設備投資 の 構
物流の効率化と高度なリスク管
を生かして、お客様の課題や要
精通しています。その豊富な知
想段階 か ら 完成後 の 引き 渡し
理を実現します。貿易ルールや
望 に 応じ た 最適 な 設備 を 世界
見 は、何度も 現場 に 足 を 運 び、
まで、一貫した 技術 サポートを
各国の 規制の 最新情報を常に
中から探し、納入先の国や地域
お 客様 の 要求 や 課題 に 深く向
提供します。多様な分野のエン
把握 するとともに、独自の サプ
の 規制 に仕様 を 適合 させ て 提
き合うことで蓄積されてきた当
ジニアを 有 する体制により、複
ライチェーンを 生 かして世界情
供 しま す。言語 や 商習慣 が 異
社独自 の 財産 で す。お 客様 と
合的 な 要求 に も 対応 し、複数
勢の変化にも対応し、複雑な国
なる海外で の 製造拠点新設と
メーカー の 架け 橋となり、最適
メーカ ー の 設備 を 組 み 合 わ せ
際輸送 を 円滑 に 管理 し ま す。
いった難度の高い案件も、現地
な設備の提案 からプロジェクト
た生産ラインの構築など、お客
これ により、プ ロジェクトの 完
で の 商談、調達、据付、立 ち上
完遂 まで、エンジニアと一体と
様ごとの 最適 なソリューション
遂だけでなく、お客様の納期短
げ、アフターサービスまで 一貫
なって寄り添います。
を実現しています。
縮やコスト抑制に貢献します。
して支援します。
データ
技術力
サステナビリティ戦略
現場力
017
実現する価値提供
第一実業 は、モ ノづくりに
現場力
P ICK UP!
技術力
お客様の製品や生産プロセスに合わせ、納入する設備を最適な
運びます。お客様の製品や生産ライン、搬送工程を実際に目で
形にカスタマイズします。仕入先ネットワークから、プロジェクト
見て理解することで、お客様自身も気づいていない潜在的なニー
に適したパートナーを選定し、複数メーカーの設備や技術を組み
ズや課題を捉え、それらに対応するソリューションを提案します。
合わせた提案が可能です。
援 して い ま す。4つ の 強 み
を 生 かし、顧客課題 の 把握
か らア フター サ ー ビ ス ま
で、お 客様 の 多様 かつ 複雑
な 課題に応えています。
01
市場・
技術動向の把握
02
顧客課題の
把握・提案
03
サプライヤー
開拓・調達
04
設計・仕様調整・
カスタマイズ
お客様それぞれのモノづくり現
グローバ ルネットワークを活用
要求される仕様や各国の規制に
設備投資の変化を継続的に把
場における実態を捉え、最適なソ
し、世界中から最適な調達先を
対応するべくメーカーと打ち合わ
握。各事業や海外拠点が収集し
リューションを提案。パートナー
選定。お客様の要望に応じた設
せを実施。エンジニアが 設計段
た情報を社内に共有し、新 たな
と連携して新しい設備を開発す
備の組み合わせと調達方法を提
階から関与し、お客様ごとのカス
ニーズや将来の課題を捉えます。
る場合もあります。
案します。
タムメイドを実現します。
事業戦略
国内外 の市場動向や 先端技術、
価値創造
関 わる一連 のプロセスを支
DAIICHI JITSUGYO CO., LTD.
P ICK UP!
設備に関する豊富な知識を有した営業人材が、現場へ直接足を
Integrated Report 2026
4つの強みが
継続的なアフターサービスを通じてお客様との信頼関係を深め、設備の運用段階で把握
した新たな課題やニーズを、次の提案や価値創出につなげます。
試運転・
立上げ・検収
納入・据付・
工事管理
国際物流・
貿易実務管理
納期・
プロジェクト管理
設備の引き渡し後も保守・メンテナ
試運転時に追加調整や確認事項
海外製の設備を導入する際も各
近年複雑化している国際輸送に
複数メーカーの設備の納期から
ンス、部品供給、設備改善などを継
が 生じた場合も、要件通りに設
協力会社と連携し、工事会社の
対応し、長年の 経験を有 する専
輸送・現地工事・技術者派遣ま
続して支援します。グローバルネッ
備が稼働するまで現場を支援し
選定、作業工程の調整、安全・品
門部署が通関・保険・リスクを緻
でスケジュールも含めて一括管理
トワークを活用し、安定稼働に必
ます。担当営業が責任をもって、
質管理などを実施し、円滑な納
密に管理。設備の納期内輸送を
し、お客様のプロジェクトを遅延
要なサポートを迅速に提供します。
検収まで必ず立ち会います。
入・据付を支援します。
支援します。
なく支援します。
08
P ICK UP!
07
06
05
データ
09
サステナビリティ戦略
アフターサービス・
安定稼働支援
技術力&現場力
設備の仕様確定後は、技術者と営業がメーカーと連携し、工場出荷までの工程や納期を一元的に管理しています。納期遅延といった問題が生じた際には、速やかに代替案を検討
し、関係者と調整をするなど、納期遵守に向けて対応します。海外輸送や現地納入では、専門の物流部門が各国の規制に対応し、必要な通関手続きを行うなど、輸送条件に応じ
て的確に管理します。大型プロジェクトでは、プロジェクトマネージャーが複数メーカーの設備納入だけでなく、エンジニアや現地作業者などのスケジュールや作業内容を統括し、
商習慣や文化の異なる国々でも円滑な推進を実現します。さらに、
ビザの手配や現地での各種調整も行い、
安全な作業環境を整えることで、
確実な納入と立ち上げを支えています。
018
社会課題を解決する「技術」と、
それを生み出す「人材」の力。
価値創造
一気通貫のエンジニアリングで、
世界のサプライチェーンを支える。
機械商社の提供価値
第一実業の海外部に入社して間もない頃の私は、さまざ
まな苦労を味わいました。大学で外国語を専攻していた
ものの、入社4年目の夏にニューヨークへ赴任した私は、
現地の速いネイティブ英語の電話がよく聞き取れず、落
ち込んだものです。文書でやり取りをしようにも、当時
宇野一郎
サステナビリティ戦略
インターネットも普及していなかった1980年代前半、
代表取締役会長執行役員 CEO
事業戦略
AI時代に問われる
DAIICHI JITSUGYO CO., LTD.
Integrated Report 2026
CEOメッセージ
の通信手段はテレックスでした。タイピングボードを利
用して文書の送受信を行うこの装置は、文章が長くなる
うなメッセージを送り合いました。そして、クレームや取
データ
ほど通信料が上がるため、単語を省略しながら暗号のよ
引事故などにも遭い大変な思いをしている私に、当時の
上司たちは「自分でまず考えなさい」というばかり。「こ
れでいいのだろうか」と不安に駆られながら、一つひとつ
019
それから40年以上が経った今、時代は大きく変わって
のサプライヤーや工事会社に個別発注していた領域を、
かに高めるかが課題でした。
います。テクノロジーは驚くべき発展を遂げ、困ったこと
当社が一つに束ねて提案する機会も増加しました。設備
そこで、高度な専門知識やマネジメント能力といった高
があればAIがいつでも、何でも答えてくれるようになりま
選定、現地規格への対応、工事範囲の調整、物流、据付、
いスキルを有するエンジニアを、エンジニアリング本部に
した。しかし、得られた情報をお客様の現場に即した提
試運転、アフターサービスまでをワンストップで担える対
集結させ、各事業本部の案件状況に応じて柔軟に配置す
案に落とし込み、プロジェクトを取りまとめて最後まで遂
応力が、お客様に安心して任せていただくことにつなが
る体制を整えています。エンジニアリング本部と各事業
行することは、AIだけでは完結できません。
り、当社の競争力を支えています。当社が 築いてきた
本部、グループ会社の技術・サービス機能が連携すること
そこに、次世代型エンジニアリング商社である第一実業
18ヵ国36拠点のグローバルネットワークを活用・拡大し、
で、プロジェクトごとに最適な体制を構築し、複合的な大
が果たすべき役割があります。
私は、
当社の提供価値を
「確
強みであるエンジニアリング力とかけ合わせることで、世
型案件にも対応できる力が高まりました。
かな実績に基づいた責任ある提案」だと考えています。
界のモノづくりをさらに豊かで持続可能なものにできる
はずです。
高スキル人材を獲得する必要性から、当社ではキャリア
採用の比率が高まり、新卒採用者を上回る水準となりまし
ら新規の大型商談を受け、メーカー・工事会社・当社の3
た。多様なバックグラウンドをもつ社員が集まり、それぞ
社で提案を行いました。商社というビジネスモデルは、
れがユニークな能力を発揮しています。このような環境に
海外では一般的ではありません。この企業からも、
「メー
てくれるんですか?」と質問を受けました。
グローバルな組織資本の拡充
ムにいち早く馴染み、心理的安全性を感じながら強みを
最大化できるようコミュニケーションを図ることです。当
社の歴史や経営理念、コンプライアンスへの理解を促すこ
「私たちは欧州に、何百台もの設備を域外から納入して
社会課題が複雑化・多様化する中、お客様の要求も高
CE宣言※をして安全を保証したものです。メーカーがた
度なものになっています。安全や品質だけでなく、環境対
だ作るだけではできない、その国の規格に適合した安全
応や自動化といったさまざまなエンジニアリング力が必要
安心な製品を提供するということが、私たちの使命です」
です。こうしたニーズに応えるため、当社は中期経営計画
と私が説明すると、お客様は「第一実業はそこまでしてく
「MT2027」において、成長を加速する事業戦略の一つと
れるんですか」と驚かれた様子でした。そしてプロジェク
して「エンジニアリング機能の拡充」を掲げています。
その実行に向けた人材戦略では、2023年に設立したエ
こうした付加価値は、世界的にサプライチェーンの再
ンジニアリング本部を活用します。当社は7つの事業本部
構築が課題となっている現代において、より一層強く求
を有し、多角的な経営を行ってきた一方で、それぞれの事
められています。近年では、お客様の間でもサプライヤー
業本部に知見が分散している状況でした。人材面におい
※製品がEUの法令や規格に準拠していることを証明する「EU適合宣言書」を発行すること。
とで、リスクを低減しながら組織としての一体感を醸成し
データ
きました。EUの指令に基づいた規格に全て適合させ、
トを私たちに任せていただける運びとなったのです。
おける私自身の役割は、さまざまな価値観の社員がチー
サステナビリティ戦略
カーと工事会社は分かりますが、第一実業は一体何をし
高度な専門人材の育成と
事業戦略
エピソードを一つご紹介します。欧州のとある企業か
価値創造
ても、部門を越えた異動は難しく、社内での流動性をい
DAIICHI JITSUGYO CO., LTD.
を見直す中で発注先を集約する動きが進んでおり、複数
手探りで、お客様に向き合うしかありませんでした。
Integrated Report 2026
CEOメッセージ
020
「MT2027」においては経営基盤強化の戦略として、
「人
を導入して4年目になり、活用も進んでいます。今後は、
的資本の価値向上」も定性目標の一つに掲げています。
海外拠点やグループ会社とのシステム統一を図っていきま
多様な人材が働きやすい環境整備は近年、多くの企業が
す。大規模な刷新となるため時間とコストがかかることを
努力しているところであり、当社においても、そうした環境
見込みますが、
「V2030」の実現に向けた生産性向上と収
づくりは持続的な成長に不可欠です。育児と仕事の両立
益力強化につなげたいと考えています。
支援をはじめ、誰もが挑戦しやすい制度・風土づくりを進
価値創造
ころです。国内では新しいERP(統合基幹業務システム)
DAIICHI JITSUGYO CO., LTD.
ていきます。
Integrated Report 2026
CEOメッセージ
め、好事例を社内に広げていきます。
これらの戦略を加速するため、2027年3月期には一時
的な減収減益を覚悟の上で、人的資本への先行投資に経
2026年以降はAI関連も視野
また、私たちのミッションである「人をつなぎ、技術を
て高い付加価値を生み出すだけでなく、
その価値をグロー
展開し、事業ポートフォリオを拡充してきました。時代の
バルに幅広く提供していく必要があります。それを支える
ニーズに合わせて柔軟に事業領域を拡大してきたことによ
基盤となるのが、組織資本です。当社がもつ豊富なグロー
り、社会の変化を乗り越え、追い風としながら成長を実現
バルネットワークは、海外展開を支える強力な組織資本で
しています。
「MT2027」の初年度である2026年3月期に
あるといえます。
「MT2027」ではこのネットワークを、重
は、ヘルスケア事業、航空・インフラ事業、自動車事業がけ
点エリアであるインドを起点として、アフリカや中近東へ
ん引役となり、3期連続で過去最高益を達成しました。中
も拡大していく方針です。単に拠点を増やすだけでなく、
でもヘルスケア事業は、医薬品の供給不足や健康志向の
現地の法規制やリスクを管理し、国内外の社員が安心し
上昇を背景に、引き続き大きな成長を狙える分野として期
てビジネスを展開できる経営インフラを整備し、人材の力
待しています。また、航空・インフラ事業についても、イン
を最大限に生かす仕組みをつくります。このようなグルー
バウンドや防衛・防災の需要の高まりが当面続く予測です。
プ経営の拡大に伴い、コンプライアンスやガバナンスに対
2027年3月期以降は、AIデータセンターをはじめとする
※
する意識向上の取り組みや、情報セキュリティ管理、BCP
新たな成長領域をターゲットに、事業領域の拡大を目指し
策定など、管理基盤についても継続的に高度化していきま
ます。都市向けの大型データセンター市場ではすでに激
す。さらに現在は基幹システムの刷新にも注力していると
しい競争が始まっていますが、地方での導入増加が見込
※Business Continuity Plan:事業継続計画
データ
当社はこれまで、既存事業を起点に新たな事業領域へ
サステナビリティ戦略
つなぎ、世界を豊かに」を実現するには、人的資本によっ
事業戦略
営リソースを集中させる計画です。
時代に合わせて広がる事業
021
なりました。社外取締役の選任においても、属性や専門性
代に残したいものもあります。それは第一実業が、
「意欲
発揮できる新たな成長機会だと捉えています。具体的に
の多様性を重視しており、取締役会ではより幅広い視点
さえあれば挑戦する機会が与えられ、夢を叶えられる
は、大規模なサーバーの過熱を防ぐ強力な冷却システム
から意見をいただいています。
会社」であることです。
入社当初は何でも自分で考えなければならない環境に
進めています。これまでインフラ分野に貢献してきた実績
れの役割の明確化は進んでいます。戦略や投資案件の検
苦労しましたが、そうした経験を通じて、自由に創意工夫
と知見、そして広大なネットワークを生かし、社会のDXに
討は活発に進んでいる一方で、この1年を振り返ると、投
しながら仕事をする喜びも知ることができたのも事実で
貢献していきます。
資の実行をお示しする段階には至っていません。今後は、
す。人材育成やリスクマネジメントの手法は改善し続ける
また近年、社会課題解決への貢献を通じた企業価値向
検討をより実効性のある戦略へと落とし込み、新たな事
必要があるものの、社員の主体性を重んじて仕事を楽しん
上が求められる中、機械商社にできることとは何か、考えを
業創出や投資案件の実行につなげていくことが重要です。
でもらう風土はこれからも大切にしていきます。
深めていくべきだと実感しています。機械を納めることで
各事業領域を担う3名のCSOには、それぞれの専門性を
企業 の 発展に最も重要なのは人材 です。成長戦略
お客様の役に立ち、その結果として社会貢献の一翼を担う
生かし、成長に向けた戦略をさらに具体化していくことを
「V2030」の達成に向け、これまでの経験の全てを生かし
という従来型の発想ではなく、社会課題を起点としたビジ
期待しています。
て人的資本の充実および業容拡大に貢献し、CEOとして
CEOとしての私自身の使命は、長期的な視野をもって
の集大成となる成果をつくり上げたいと考えています。ス
価値創造により、長期にわたる持続的な成長を目指します。
経営戦略を打ち立てることです。
「監督」と「執行」の分離
テークホルダーの皆様には、ますますのご指導、ご鞭撻の
は徐々に進んでいると認識していますが、完全に切り分け
ほど、何卒よろしくお願い申しあげます。
るのではなく、経営会議や常務連絡会などでは互いに意
監査等委員会設置会社への移行で
経営判断が迅速に
見を出し合っています。引き続きそれぞれの立場から柔軟
にコミュニケーションを取り、効果的な経営体制を築いて
いきます。
サステナビリティ戦略
ネスアイデアの創出が必要です。世界を豊かにするための
事業戦略
2025年4月にCxO体制を刷新したこともあり、それぞ
価値創造
や、データセンター向け発電ソリューションなどの提案を
DAIICHI JITSUGYO CO., LTD.
まれるコンテナ型データセンターの普及は、当社の強みを
Integrated Report 2026
CEOメッセージ
当社は2025年6月、コーポレート・ガバナンスのさらな
る充実を目的として、監査等委員会設置会社に移行しまし
事項について、経営会議で決定できる範囲が広がり、経営
社員の主体性を重んじて
挑戦を楽しめる風土を未来へ
データ
た。これにより、従来は取締役会で決議していた一部の
判断のスピードアップにつながっています。また、監査等
委員である取締役が議決権をもって取締役会に参加する
時代の潮流に合わせ、当社自身も組織のあり方やビジ
ことで、社外の目線を一層意識した議論が行われるように
ネスモデルを変革しなければなりません。ですが、次の世
022
第一実業の人材力と、
これからの人的資本経営
活躍 する6 名 が 集 まり、
「人」を テ ーマ に自社 の 強 み や
課題、これ からの 組織 づくりについて語り合いました。
価値創造
現場の熱意とデジタルの融合でつくる、
第一実業 が 選 ば れ 続 ける 理由 は? 各部門 の 第一線 で
DAIICHI JITSUGYO CO., LTD.
「事業部門」×「管理部門」で解き明かす
Integrated Report 2026
社員座談会
持続可能な成長基盤
人が紡ぐ信頼を、揺るぎない組織の強みへ
組織としての再現性を高める
それは社員たちの、どんなに厳しい局面でも当事者意識
をもって、仕事に向き合っている姿です。この姿勢から
「困ったときは第一実業」
とお客様から頼られることも多く、
強固な信頼関係を築けていることが強みだと実感してい
ます。
サステナビリティ戦略
髙木第一実業に入社後、印象深く感じたことがあります。
事業戦略
一人ひとりの高い「対応力」をベースに
松下当社が多くの歴史あるお客様と取引できているの
は、歴代の先輩方が長年にわたって誠実な対応を徹底し、
うした誠実な姿勢が、当社の精神性として根付いているよ
データ
確固たる信頼の土台を築き上げてくれたからこそです。そ
うに感じます。その上で、組織の機能やネットワーク、個
人の高い対応力やコミュニケーション力が相乗効果を生
む形で噛み合っているからこそ、お客様からも高い評価を
023
部門にも営業を経験してきた社員が多い点です。制度や
れらが「最初から狙って出せた成果なのか」
「再現性や持
売買の仲介役というイメージが強かったため、第一実業が
取り組みを決めるときも現場の実情を理解した上で議論
続可能性があるのか」という観点では、まだまだ課題を感
ここまで現場に入り込んで動いていることには驚きました。
できるので、組織全体が同じ方向を向いて連携できる強
じています。個人の力や高い資質だけに頼るのではなく、
仕入先のメーカーだけに委ねるのではなく、トラブルが起
みがあります。
組織として成果を生み出し続けるPDCAサイクルをどのよ
きても最後までお客様に向き合い続ける姿勢が当社の大
五十嵐当社は自社工場や製品をもつメーカーとは異な
うに確立していくのかが、これからの大きなテーマですね。
きな強みであり、お客様から選ばれ続ける理由なのだと
り、
「人が資本」であるという意識が受け継がれています。
実感しました。
先輩から「自分を売ってこい」と叩き込まれ、一人ひとりが
野口私自身、それを肌で実感しています。現場で何かト
自らの力でお客様と向き合ってきたからこそ、信頼される
エンジニアリング機能を強化し
ラブルが起きれば、すぐに駆けつけて誠心誠意対応する。
高い現場力が育ってきたのだと思います。ただその反面、
「次世代型エンジニアリング商社」
を
そうした努力を重ねる中で、お客様から「ここまで対応し
個人の判断や経験によるところが多く、知見やノウハウが
てくれて本当にありがとう、第一実業に頼んでよかった」と
共有されにくい状況から、
「属人化」につながりやすいとい
加速させる
言っていただけたんです。そういった姿勢が、
「困ったとき
う課題もあります。
五十嵐組織力を高めていく上で、エンジニアリング機能
は第一実業」と真っ先に頼っていただける強い関係性につ
青山他社でも人事を経験してきた立場から客観的に見て
を強化したことは大きなターニングポイントでした。自動
ながっているのだと思います。
も、当社の社員は個人の力が強く、目の前の課題に対して
化や省力化などのニーズが高度化・複雑化する中、お客様
エレクトロニクス事業本部
東部エレクトロニクス部
第一グループ長
エンジニアリング本部
プロジェクト推進部
部長代理
デジタルイノベーションセンター
デジタル戦略部
部長代理
総務本部
人事部
労務管理グループ長
菱谷雄介
青山周平
野口泰奨
髙木芳明
メーカーのエンジニアを 経て
エンジニアリング本部
(自動車)エンジニアリンググループ
グループ長
松下昌史
五十嵐光佑
製紙や製鉄業界の顧客を主
国際物流/営業部門/海外拠点
メーカーで の勤務後、当社に入
他社での人事経験を経て当社に
大手日系顧客やグローバル顧客
な対象として、営業活動を展
で 経験 を積 んだのち、現職に着
社。現在は、AI活用を含むDXを
入社。評価制度の見直しをはじ
に向けた電子部品実装機の販売
当社に入社。設備の仕様検討
開している。
任。大型プロジェクトやエンジニ
けん引している。
めとする、人事制度 の 整備・運
活動を行っている。
から導入・立ち上げ・検収まで
アリング案件を支援している。
用を担っている。
幅広く携わっている。
データ
プラント・エネルギー事業本部
プラント第一部
第三グループ長
サステナビリティ戦略
菱谷前職はメーカーに勤務していましたが、商社は商品
事業戦略
誠実に向き合い成果を出せる強みがあります。一方で、そ
価値創造
菱谷 もう一つ、社内体制として強みを感じるのは、管理
DAIICHI JITSUGYO CO., LTD.
いただけているのだと思います。
Integrated Report 2026
社員座談会
024
役割も広がっています。従来の商社は「提示された仕様
アリングを行っています。これによって、グローバルネッ
豊富な技術者がおり、現場の工程改善や不良率の低減に
書通りに動く機械を探して届ける」役割が中心でしたが、
トワークを活用して国内外の複数メーカーの技術力やコス
まで踏み込んだコンサルティングを実現しています。単に
今は私たちが構想段階から関わり、ライン全体やプラント
トを比較・検証した上で、構想段階からトータルな提案が
機械を供給するだけではなく、
「コト売り」を通じて差別
全体をコンサルティングすることが求められています。そ
できるようになりました。
化を図っています。
うした期待に応えるためにも、エンジニアリング機能を強
菱谷 これまでできなかったそのスタイルが実現したのは
髙木 そうした取り組みを進めていくためにも、縦割りの
化したことは当社の大きな成長につながっています。
なぜですか?
意識を取り払うことが重要ですね。当社には、
「ここから
髙木 おっしゃる通りですね。お客様がコア領域の業務
髙木高スキルなエンジニアの採用を強化したことが大き
は営業の仕事、ここからはエンジニアの仕事」という壁が
に集中できるよう、
「私たちが技術面で主導していくんだ」
いと思います。課題設定や企画構想といった上流段階か
まだ少し残っているように感じます。これでは、お客様へ
という気概をもって現場に入り込んでいます。お客様にお
らアプローチしていこうという動きを全社でさらに加速さ
のレスポンスが遅れ、生産性を低下させてしまう要因にな
ける業務領域の見直しが進む中で、商社に求められる役
せているのが、まさに今なのだと感じています。営業とエ
ります。当社が「次世代型エンジニアリング商社」を掲げ
割や期待の質そのものが高まっていると感じますね。第
ンジニアが互いの知見を共有しながら高め合っていくこと
た当初から、エンジニア自身のスキルアップだけでなく、
一実業では、お客様が新しい設備を検討し始める段階か
が、
「次世代型エンジニアリング商社」の姿だと思います。
「営業側も技術を学び、組織全体の提案力を底上げすべ
事業戦略
野口 それでいうと、エレクトロニクス事業本部には経験
価値創造
らエンジニアが営業に同行し、現場の確認や専門的なヒ
DAIICHI JITSUGYO CO., LTD.
側でコア業務への選択と集中が進み、当社に期待される
Integrated Report 2026
社員座談会
き」と社内で主張してきました。そこで私のチームでは、
技術課題、残項目などを一元管理する表を活用していま
す。打ち合わせ内で出た発言をそのまま記録する議事録
とは違い、ポイントを理解した上で端的にまとめる力が必
要な、この管理表を作成する作業をエンジニアだけではな
サステナビリティ戦略
プロジェクトの各フェーズにおける議事内容や決定事項、
く営業にも任せることで、技術面での理解の促進を図って
います。これにより「何が受注のポイントなのか」
「技術的
に押さえるべき要点はどこか」を整理する力が身につき、
ニアの間に会話が生まれることで、双方が一体となってプ
データ
自ずと技術への理解が深まる仕組みです。営業とエンジ
ロジェクトを動かす文化が醸成されていくと感じてい
ます。
松下 たしかに、事業本部がエンジニアリング本部やグ
025
えていますよね。今後はこうした体制をうまく活用し、初
流れがありますよね。当社でもアシスタントの仕事を棚卸
場合があります。成果を生み出すシステムにするためには、
期の検討段階からお客様と一緒に悩み、伴走できる関係
ししていくと、AIの導入によって自動化できる業務が必ず
現場のリアルな課題や使い勝手をベースに構築していか
性を築いていく。そうして築き上げた信頼が実を結び、大
見つかります。そのため、浮いた時間を生かして、よりク
ないと浸透させるのは難しいと思います。
型案件につながる事例を全社で増やしていきたいですね。
リエイティブで付加価値の高い仕事に集中できるような仕
五十嵐 そうですね。システム導入で陥りがちな点は、
「と
組みができると良いと思います。
りあえずデータをインプットして可視化しよう」で終わって
松下 ただ、現場目線の話をすると、CRMを活用しきれて
しまうパターンです。データを引き出してどのように運用
いないのも事実です。なぜシステムに膨大な情報を入力
するかという視点がなければ、入力作業の手間が増えるだ
「V2030」を支える基盤を構築
しなければならないのか、その目的やメリットが伝わって
けです。そのため、どういったアウトプットが必要なのかと
いないと現場は使い慣れたExcelの作業に戻ってしまいま
いう目的を議論・明確化した上で取り組むことが不可欠で
野口 これまでお話ししてきた通り、当社の強みは現場力
す。現場が「これを使えば仕事を効率的に進められる」と
す。
の高さにありますが、個人の経験に頼りすぎている側面も
実感できることが何より大事だと感じます。
菱谷入力項目を増やすこと自体が目的化し、最終的に
あります。お客様のニーズが単に機械を買うことからライ
髙木 システムの設計自体が現場目線で作られていない
「何を実現したいのか」というゴール設定が曖昧になってし
DXの推進で属人化を脱却し
事業戦略
と、会社側の意図と現場の使い勝手にギャップが生じる
価値創造
青山多くの企業で、AIを活用して業務を効率化していく
DAIICHI JITSUGYO CO., LTD.
ループ会社と連携しながら案件を進める機会は確実に増
Integrated Report 2026
社員座談会
ンやプラント全体の自動化や課題解決へと高度化する中
ションを提供する「コト売り」へのシフトを推し進めてきま
した。そうした価値を提供し続けるためにも、DXによる
仕組み化が求められていると感じています。
菱谷 まさにそこが、デジタル戦略部の最も重要な役割だ
と思います。当社のDX推進の大きな目的は、属人化を解
サステナビリティ戦略
で、当社も単なる「モノ売り」ではなく、ノウハウやソリュー
消して社員一人ひとりの生産性を高めることにあります。
その先にある狙いは、成長戦略「V2030」に向けた事業基
めると同時に、顧客管理システム(CRM)の導入を推進し
データ
盤の整備です。そのためにバックオフィスの自動化を進
てきました。また、2023年には社員に向けて「生成AI運
用ガイドライン」を策定し、安全な環境のもとで業務への
活用を進めています。
026
が主体的に挑戦できる環境づくり」です。その実現に向け
松下今後は制度は制度として、実務ベースでも柔軟に人
行っていく重要性を認識しています。そうした目的意識を
て、人事制度の整備を進めてきました。一つ目は、
「社内
材交流ができる風土を広げていけるといいですよね 。業務
もった上で、データ活用の取り組みとして力を入れている
公募制度」です。本制度によって若手社員を中心に自ら手
の枠組みや業界の垣根を越えた共通課題も多い中で、営
のが、ナレッジマネジメントです。例えば、過去のトラブル
を挙げて、希望する部門や業務へ挑戦できる環境が整い
業と管理部門が一緒に仕事ができる環境をつくっていきた
対応や工事案件での失敗事例、問い合わせ内容などを生
ました。二つ目は、
「役割等級型の人事制度」へのシフトで
いです。
成AIに学習させています。過去事例のナレッジや適切な
す。社員一人ひとりの役割・能力・実績に基づいて等級を
五十嵐繰り返しますが、商社にとって最大の資本は人で
対応策を瞬時に導き出して、現場の判断をサポートする仕
定め、目標達成度や能力によって評価する仕組みへと刷
す。新卒・経験者を問わず優秀な人材が集まっているから
組みを構築することで、若手や中途社員でも迷わず自走
新しました。意欲とスキルに応じて、アシスタント職から
こそ、景気変動や社会情勢などの外部環境に振り回され
できる環境をしっかりと整えていきたいと考えています。
営業職への挑戦も可能です。
ない組織基盤を構築していくことが重要です。
野口本部間の壁を越える人材交流は、ぜひ推進してほし
青山働き方の選択肢が増え、個人のキャリア観も多様化
いテーマの一つです。国内の部門間はもちろんですが、例
する現代においては、他社への人材流出が増加しやすくな
えば海外拠点のスタッフを日本へ招き、当社の営業スタイ
りますからね。人事部としても、このような事態をあらか
ルや技術の知見を直接学んでもらうような取り組みがあっ
じめ予見して、先手を打つ組織づくりの重要性を強く感じ
てもいいと考えています。グローバルで共通の強みをもっ
ています。当社で働く社員がやりがいをもって働き続けら
た組織をつくっていくためにも、人材の流動性を高めてい
れるよう、施策検討と環境整備を推し進めていきます。
役割型人事制度と社内公募で
一人ひとりの自律と挑戦を促す
青山当社が推進する人的資本経営において、最も重きを
松下 ルールやコンプライアンスを守りながら、取引先と
のコミュニケーションを大切にし、色々なことに挑戦でき
る商社ならではの面白さを次の世代へしっかりと継承して
いきたいですね。
サステナビリティ戦略
を使って何を成し遂げたいのかという合意形成を丁寧に
事業戦略
きたいですね。
価値創造
置いているのが「社員の自律的なキャリア形成」と「若手
DAIICHI JITSUGYO CO., LTD.
まっては意味がありませんね。経営陣や現場が、データ
Integrated Report 2026
社員座談会
野口結局のところ、楽しく明るい現場にビジネスの種と
なるような情報が集まり、付加価値の高いプロジェクトへ
は、社員一人ひとりが前向きに挑戦し、成長できる環境を
データ
と広がっていくのだと思います。人的資本経営の出発点
つくることです。個人の成長を組織全体の力につなげ、強
い人材の育成と柔軟な仕組みづくりによって、
「V2030」の
達成に向けて尽力していきましょう。
027
DAIICHI JITSUGYO CO., LTD.
Integrated Report 2026
価値創造
事業戦略
事業戦略
Business
Strategy
029 COOメッセージ
036 成長戦略と中期経営計画
038 事業別戦略
プラント・エネルギー事業
エナジーソリューションズ事業
サステナビリティ戦略
033 CFOメッセージ
産業機械事業
エレクトロニクス事業
自動車事業
データ
特集
AIデータセンター需要に応える4つの注力領域
ヘルスケア事業
航空・インフラ事業
060 海外戦略
028
DAIICHI JITSUGYO CO., LTD.
組織を変える「稼ぎ方改革」で、
「V2030」の完遂を目指す。
Integrated Report 2026
COOメッセージ
価値創造
「人材」と「仕組み」の融合で
次世代に求められる付加価値を創出
を定め、
「次世代型エンジニアリング商社」のビジョン実現
事業戦略
グローバルな成長や「モノ×コト」売りなどの基本戦略
への決意を込めた成長戦略「V2030」
。定量目標として掲
長・COOとして、必ず果たさなければならない使命です。
この目標を完遂するために欠かせない経営戦略が、
「人
的資本への投資」と、それを支える「仕組みの整備」です。
モノを持たない商社にとっては、人材こそが最も重要な
サステナビリティ戦略
げる売上高3,000億円、営業利益180億円の達成は、社
資本であり、稼ぐ力の源泉となります。一方で、多様な
人材を大幅に増やせば、組織としてのリスクが大きくなる
本を増強し、その能力を最大限に解き放つ「仕組み」の
代表取締役社長執行役員 COO
船渡雄司
構築が不可欠となります。
データ
のも事実です。だからこそ、リスクを抑えながら人的資
リスク管理やノウハウ共有の仕組み化により、新たに
加わった人材も早期に力を発揮できる環境を整えるとと
もに、AIやデジタルの活用で定型業務を徹底的に効率化
029
し、人間はより創造的な仕事や専門スキルの向上に集中
できるようにします。これにより、社員一人ひとりが挑戦
を楽しみながら、次世代に求められる高い付加価値を創
DAIICHI JITSUGYO CO., LTD.
Integrated Report 2026
COOメッセージ
出できる強い組織をつくり上げていきます。
価値創造
稼ぐ力は着実に向上
戦略的な先行投資で次の飛躍へ
「V2030」の目標達成に向けた業務プロセス改善の一
中期経営計画「MT2027」の2年目は、これまでに構築
見直し、当社のロジスティクス力を基盤としたリスクマネ
じたグループ内での活発な情報共有などを推進します。
してきた財務基盤を活用し、次の大きな成長に向けた仕
ジメントを強化しました。背景には、従来の事業運営で
これらの投資の結果として、一時的な減益を見込む計画
込みと、成長を加速するための基盤を固める期間です。
プロジェクトごとの見通しが十分ではなく、場合によって
となりましたが、中長期的にはより大きな価値の創出に
そして「V2030」で掲げた定量目標を達成するため、事
は追加費用の発生により損失が生じていたという反省が
必ず結びつくと確信しています。
業投資や組織改革を行っていきます。
ありました。現在では、受注前に要件やリスクの確認を
さらに2026年4月、当社グループが誇るエンジニアリ
徹底することにより、そうした損失はほとんど発生してい
ング力の機能強化に向けて、エンジニアリング本部にお
ません。この取り組みの結果、2026年3月期は過去最高
いて新 たにPMO(Project Management Office)を設
益を達成しました。当社グループの稼ぐ力は、着実に向
置しました。この組織には、国内外での営業経験が豊富
上しています。
な人材を登用し、プロジェクトマネージャーとしてのスキ
2027年3月期の1年間は、
先に述べた
「人材」
と
「仕組み」
への先行投資を本格化させます。すでに2026年4月に
ルを磨いていきます。これにより、各プロジェクトの推
進力を加速させます。
「V2030」達成への成長戦略と
組織を変える「稼ぎ方改革」
サステナビリティ戦略
や、AIを活用した業務効率の改善、ポータルサイトを通
事業戦略
環として、2026年3月期には見積手法や物流管理方法を
当社グループの事業ポートフォリオの強みは、日本政府
が定める重点17分野中12分野をカバーする幅広さにあり
一方で、売上高については、EV市場の減速に伴うエナ
ます。なかでも、AIの台頭によって活況となっているデー
定を実施したほか、高度なスキルを有する専門人材など
ジーソリューションズ事業の前期の受注減が大きく影響
タセンター需要に対しては、
「電力・蓄電池」
「半導体・実
合計100名程度を増員する計画を定めました。仕組み化
し、減収となる見込みです。しかし、足元ではデータセ
装関連」
「設備・保全・運用DX」
「脱炭素」の4つのテーマ
に向けたDX戦略としては、グローバルネットワークを支
ンター向け蓄電池の需要が高まってきており、受注状況
において当社グループの知見や提案力を生かすことがで
える海外拠点へのERP(統合基幹業務システム)の展開
は復調傾向にあります。
きます。
データ
全社員を対象とした大幅なベースアップおよび初任給改
030
複合的かつ高度な専門知識が必要です。例えば、電力・
タセンターに関連する幅広い領域において、受注拡大を
様と対話し、関係性の構築と受注機会の創出に努めてい
図っていきます。
ます。体力、知力ともにハードな中、お客様とのコミュニ
7事業セグメントの知見が集まるエンジニアリング本部
ケーションを楽しめる高い現場力をもった営業人材が集
ションズ事業が、半導体・実装関連ではエレクトロニクス
は、このような戦略を推進する上での中核となります。拡
まっていることは、当社グループの強みの一つです。引き
事業が、冷却システムでは産業機械事業が貢献します。
大するAIデータセンター需要を確実に取り込み、今後の
続きこうした積極的な活動と大胆な資本投下の両輪で、
これらの事業によるシナジーを最大限に発揮させ、AIデー
ビジネスにおける新たな柱とするべく、経営資本をエンジ
成長を加速させていきます。
ニアリング本部および関連する事業本部へと積極的に配
分していく考えです。
人的資本強化への中長期的な取り組みにおいては、個
人のノウハウに依存した営業活動からの脱却が大きな
テーマとなります。これまでは営業一人ひとりがお客様の
ミュニケーションを強化するための成長投資も加速しま
現場に深く入り込み、密接なコミュニケーションを取りな
す。今後、グループ会社である株式会社第一メカテックの
がら最適なソリューションを提案してきました。その反面、
社屋を建て替え、2030年には多機能なテクニカルセン
個々の経験やノウハウに依存する部分も多く、業務の属人
ターである「フューチャーキャンパス(仮称)
」が完成する
化が生じていました。
経験者採用比率が半数以上に達し、人材の多様性が高
術継承と多目的ショールーム機能を兼ね備えるものであ
まる中、こうした個人のノウハウを会社の財産として蓄積・
り、当社グループ全体の技術力やサービス力を発信する
活用していくことが重要です。そこで、ここ数年は独自の
拠点となります。大型設備の展示や実演によって「少し先
ERM(Enterprise Risk Management)や 業務プロセス
の未来のモノづくり現場」を体感できる場とし、当社グルー
の可視化、AI活用などに注力しています。例えば、若手社
プの提供価値をお客様と具体的に共有することで、競争
員や経験者採用人材が取引上のリスクを確認する際に、
力の強化につなげます。
過去のデータを参照できるようにするといった取り組みを
サステナビリティ戦略
予定です。建設工事に約40億円を投じるこの施設は、技
事業戦略
お客様をはじめとするステークホルダーの皆様とのコ
成長投資においては、数十億円単位の大型案件が注目
価値創造
蓄電池ではプラント・エネルギー事業とエナジーソリュー
DAIICHI JITSUGYO CO., LTD.
こうした市場でトータルソリューションを提供するには、
Integrated Report 2026
COOメッセージ
進めています。
会社の仕組みを変えるには、大きな投資が必要です。
続することも重要だと考えています。ビジネスの機会とは
当然、成果につながらなければ経営判断としての意味があ
もっと泥臭い、地道な人と人とのつながりによって生まれ
りません。そのため、この改革を単なる「働き方改革」で
るものだからです。例えば、年間数億円規模を投資してい
はなく、
「稼ぎ方改革」であると意識して体制を整備してい
る展示会の場です。当社グループは国内外の展示会に、
ます。社員一人ひとりの生産性を向上させることで「稼ぐ
年40回以上出展しています。社員は数日間にわたりお客
力」を高め、会社の成長とともに、社員が成長を実感し、
データ
されがちですが、日々の経営資源の投下を積み重ね、継
031
風土の強化を図っています。
業との取引では、こうした評価が取引の条件にも関わる
注力します。同じ価値観・同じ属性の人材に偏った組織
識することで、サステナビリティへの取り組みの形骸化を
運営を続けていては、会社としてこれからの社会の変化
防ぎ、実経営にも落とし込みやすくなると考えています。
を乗り越えられないと危機感を覚えています。一方で、
2025年に刷新したマテリアリティは、
「V2030」の目標
長年にわたって築かれてきた組織風土を短期間で変える
達成に欠かせないものです。社会課題と当社グループの
ことは難しいのも事実です。だからこそ、若手が中心と
ビジネスを結び、ステークホルダーの皆様とともに発展し
私 は 過去にCSuO(Chief Sustainability Officer)を
なって新しい仕組みを構築していくための施策を力強く
ていく上での指針として、経営戦略の策定と実行に役立
務めたこともあり、現在もサステナビリティに対しては強
実行し、全社を挙げた変革に本気で取り組んでいきます。
てていきます。
い思いをもって取り組んでいます。サステナビリティ基本
また、マテリアリティの実効性を高める取り組みとして、
変化の激しい時代にあっても、強固な「人材力」と「仕
方針にも掲げている通り、当社グループは環境・社会・
2027年3月期からはESG投資を呼び込む活動を開始して
組み」の相乗効果で、当社グループの持続的な成長を実
ガバナンスの課題に事業活動を通じて取り組むことで、
います。これまでも人権尊重や環境保全といった課題に
現します。ステークホルダーの皆様におかれましては、
持続的な成長を目指しています。つまり、サステナビリ
取り組んできましたが、近年ではCDPやEcoVadisなど外
中長期的な企業価値向上への取り組みに、ご理解とご支
ティ活動は経営戦略と一体のものとして推進していく必
部機関による評価も重要性を増しています。特に欧米企
援を何卒よろしくお願い申しあげます。
マテリアリティに基づいた
経営戦略の実行を推進
そのため、2025年にマテリアリティの見直しを実施し
た際には、5つのテーマそれぞれにオーナーとなる取締役
を配置しました。経営陣自らが各マテリアリティの達成
に責任をもつことで、社会課題に基づいた戦略の実行を
推進しています。
サステナビリティ戦略
要があるということです。
事業戦略
ケースがあります。こうした動きに対応し、定量評価を意
価値創造
今後は女性をはじめとする多様な人材の活躍に向けて
いきます。
DAIICHI JITSUGYO CO., LTD.
より高い意欲で挑戦できる働きがいのある会社を創って
Integrated Report 2026
COOメッセージ
マテリアリティの一つである「働く環境の整備と多様な
人材の確保・育成」に向けては、私自身も社員と直接対
まな意見をヒアリングしています。先に述べたベースアッ
データ
話する「タウンミーティング」の取り組みを通じてさまざ
プも、タウンミーティングで挙がった社員の声を真摯に
受け止めた結果です。また、人事制度や現場のリスクお
よび運用といった面でも改善提案を反映し、組織体制や
032
価値創造
強固な財務基盤と「資金創出力」を、
力強い成長エンジンへ。
DAIICHI JITSUGYO CO., LTD.
Integrated Report 2026
CFOメッセージ
取締役常務執行役員 CFO
事業戦略
府川治
サステナビリティ戦略
CCC短縮などにより
シュ・フロー 161億円を創出する強固な財務体質を改め
金銭債権の回収促進や棚卸資産の適正化を徹底した結
て示すことができたと考えています。
果、キャッシュ・コンバージョン・サイクル(CCC)は前
期末時点における現預金残高は約518億円となり、高
期 の66.76日から60.58日へと、6.18日短縮しました。
水準の手元流動性を確保しています。市場からは「現
2026年3月期における当社の財務状況は、極めて健
営業現場に「代金の回収までが自分の仕事」という意識
金を持ちすぎているのではないか」というご指摘をいた
全であり、着実な成果をあげました。親会社株主に帰
が伝統的に浸透していることに加え、CCCを軸とした全
だくこともありますが、エナジーソリューションズ事業な
属する当期純利益の堅調な積み上げに加え、全社を挙
社的な資金管理を徹底する取り組みにより、営業キャッ
どの大型のプロジェクトにおいては、仕入れから納入・
データ
キャッシュ創出力が向上
げた運転資本の効率化が大きく奏功しています。特に、
033
選・精査を優先したため限定的な規模にとどまりました
固です。
2027年3月期は、比較的リードタイムの短いエレクト
が、2027年3月期以降は実行を加速させていきます。そ
金需要が存在します。これに加え、戦略在庫の確保や、
ロニクス事業の売上寄与や、政策保有株式の縮減など
の具体的な取り組みとして、グループ会社である株式会
機動的なM&A・事業投資を即座に実行するための資金
により、期初予想からの上積みを目指します。前期の当
社第一メカテックを建て替え、多機能なテクニカルセン
としても、一定の手元流動性は必要です。財務基盤が
期純利益が99億5,000万円であったことを踏まえ、今
ターへと刷新することを決定いたしました。本施設は「次
強固になったことで、成長に向けて「勝負するお金」を
期は純利益100億円を一つの目標として挑戦していきた
世代型エンジニアリング商社」の象徴となる新拠点と位
確保できたと考えています。
いと考えています。
置付けるものであり、中長期的な利益貢献を目的に、建
設する計画です。
また、取適法への対応により、対象となる仕入先への
キャッシュアロケーションにおいては、
「MT2027」の
支払いを適切なタイミングで行う必要があり、相当規模
基本方針として掲げる「成長投資3年間累計150億円」
の資金需要が生じるため、手元資金の重要性は一段と
「株主還元3年間累計110億円」を着実に進めます。
事業ポートフォリオについては、現在の7事業を基本
的に堅持しながら、それぞれの事業の中で市場やお客
様のニーズに応じた入れ替えを臨機応変に進める考えで
まず初めに、成長投資については、初年度は案件の厳
とサプライチェーンの健全性を守りつつ、成長機会を逃
さない大きなアドバンテージとなると考えています。
事業戦略
高まっています。この強固な財務基盤こそが、法令遵守
価値創造
額の立替資金が発生するというビジネスモデル上の資
DAIICHI JITSUGYO CO., LTD.
検収、代金回収までのリードタイムが長く、一時的に多
Integrated Report 2026
CFOメッセージ
中期経営計画「MT2027」
規律あるアロケーション
CASH IN
基礎的営業CF※
160億円
2027年3月期の通期業績予想は、前期実績に対して
CASH OUT
配当+自己株式取得(最大50万株/20億円)
株主還元
成長投資150億円/3年累計
110億円
(増加運転資金
120億円)
既存セグメントを強化 する
投資
減収減益を見込んでいます。減収は事業環境の変化に
よる影響を受けたものですが、現在では対応が 進み、
50億円
純利益の見通しは、過去最高益を記録した2026年3月
成長投資
150億円
資本や社内インフラへの先行投資によるものであり、当
社の稼ぐ力が 衰えたわけでは決してありません。当期
● 隣接領域
BS最適化
手元資金
借入活用
社会的価値を生み出し、社
会課題の解決に向けた取り
組みへの投資
● 新規領域
新たなビジネス領域・ビジネ
スモデルへ挑戦するための
投資
株主還元の充実
投資ガイドライン
❶商材、商権確保につながる
投資
● 株主還元の強化
● 長期安定的な配当
❷販路拡大につながる投資
❸エンジニアリング強化につ
ながる投資
❹外国籍企業の攻略を目的と
した出資・JV設立
成長投資の拡大
● 事業投資
● インフラ投資
❺コト売りビジネスへの出資
データ
受注高は再び増加傾向にあります。また、減益は人的
投資領域
● 中核領域
サステナビリティ戦略
当期純利益100億円への挑戦と
❻持続可能な開発と社会への
貢献
❼探索的投資
期に次ぐ高水準を予定しており、収益基盤は極めて堅
034
※当期純利益+減価償却費−増加運転資金
ビスフィー)
を適正に可視化します。これにより、
プロジェ
や事業領域を柔軟に変えていくことができます。産業
クト全体 の 収益性向上を 一層確実 なものにしていき
機械事業から自動車事業が生まれたように、既存事業
ます。
時価総額1,000億円超を通過点に
市場の成長期待を高める
二つ目の株主還元については、
「連結配当性向40%ま
の中でも新陳代謝を重ねてきました。こうした柔軟性を
当社は、株主資本コストを7〜9%と認識した上で、こ
また、収益管理における新たな試みとして、一部の事
金額のいずれか高い方」を基準とする還元方針を維持
れを安定的に上回る「ROE10%以上」を定量目標に掲げ
業で「エンジニアリング費用の原価管理(可視化)」を導
し、安定的な配当を継続します。また、2027年3月期は
ています。長期発行体格付「A-」を維持できる財務健全
入しました。プロジェクトごとにエンジニアの人件費や
取得価額総額20億円、総数50万株を上限とする自己株
性を前提としつつ、必要に応じて借入も活用し、適切な
工数を精緻に割り振ることで、案件単位の最終利益を明
式の取得を実施し、資本効率の向上、およびEPS・ROE
資本構成を構築していく考えです。
確化するとともに、お客様へ提供するサービス価値(サー
の改善を図ります。
時価総額は現在1,000億円超を達成し、今後はさらに
の一方で、市場評価を示すPERは、依然として低位にと
どまっているという課題があります。これを解決するに
取り組み状況および今後の方向性
小型バイナリー発電装置の
中・大型バイナリー発電装置
●
さまざまな発電技術に蓄電技術
を織り込んだ複合的な提案
全社員の生活の安定
事業投資検討
機関投資家
面談数の推移
●
中長期的キャリア形成を支援
●
新規事業開発
29
社員一人ひとりが安心し
●
経営人材育成の推進 など
挑戦し続けられる環境づくり
CSOを中心に検討会を実施
多様性推進プロジェクト
女性の活躍を含む性別や
ライフステージを問わず、
付加価値の高い
注力分野へリソースの集中
2026年3月期実績
外投資家とのコミュニケーションはさらに活発化する余
47
くを網羅する当社の柔軟な事業ポートフォリオと、過去
17
0
2024/3
2025/3
2026/3
5,454
会社への出資
4,211
0
4,776
域を中心に、投資実行フェーズへ
投資家向け説明会
発信していきます。
盤石な収益基盤を強みとして「MT2027」の成長投資
2024.3.31 2025.3.31 2026.3.31
「骨太になる投資」
既存セグメントを強化する中核領
一度も営業赤字を計上していない安定した経営と株主還
元について、国内外の投資家の皆様へ丁寧かつ精力的に
株主数の推移
NITTOKU(株)との インド 合弁
地があると感じています。日本政府の重点17分野の多
8回
2026/3
を推進し、中長期的な企業価値向上を財務の側面から
力強くけん引していく所存です。
データ
全社員が活躍できる環境の整備
事業戦略室の設置
近年、機関投資家面談数は増加しているものの、特に海
IR活動の強化
●
月例給与水準ベースアップ
●
●
積極的な事業投資
人的資本投資の促進
製造権および販売権の事業譲渡
今後の注力分野
は、市場の期待を高めるIR活動の強化が 不可欠です。
サステナビリティ戦略
事業構造の最適化
事業戦略
高い目標を目指していく新しい段階へと入りました。そ
事業ポートフォリオの最適化
価値創造
たはDOE(株主資本配当率)4.0%の各基準で算出した
生かしながら、今後も成長機会を捉えていきます。
DAIICHI JITSUGYO CO., LTD.
す。当社は商社であるため、製造業と比べて取扱商材
Integrated Report 2026
CFOメッセージ
ステークホルダーの皆様におかれましては、変わらぬ
ご支援を賜りますようお願い申しあげます。
035
成長戦略「V2030」
積極的な投資
PL経営+BS経営
マルチステークホルダーを意識した経営
モノ売りから「モノ×コト」売り
グローバルの成長を取り込む
DX推進
「MT2027」および
「V2030」達成への
中長期的な取り組み
受注面でのトピックス
中期経営計画「MT2027」の初年度となる2026年3月期は、
2年目以降は次なる飛躍に向けた成長基盤の確立期間と位置付け、積極的な受注獲得と事業ポートフォリオの最適化を加速。
定性目標である「成長を加速する事業戦略」と「変化に対応するレジリエントな経営基盤」のもと、
最終目標とする営業利益150億円および3年間の累計営業利益400億円の達成に向けて、
売上高(億円)
売上高
2,500
●
●
180
2,100
億円
150
売上高
1,878
億円
137
120
億円
1,537
億円
半導体後工程設備
11.6%
11.7%
2023/3 2024/3 2025/3
2026/3
MT2024「創造」
ROE
10.2%
2027/3
定量予測
MT2027「成長」
ROE
10%以上
2028/3
定量目標
ROE
●
10%以上
2031/3
化粧品、健康食品、バ イオ へ の
エンジニアリング強化
航空・インフラ事業
定量目標
MT2030「飛躍」
医薬品製造 ラ イン の サ プ ラ イ
チェーン強化
データ
ROE
中国・アジ ア 市場向 け の 需要 の
取り込み
ヘルスケア事業
●
67
10.9%
AI半導体向けパッケージ基板
●
営業利益
91
10.3%
AIサーバー向け実装機
●
投資の重点ポイント
131
営業利益
自動組立装置や外観検査装置の
グローバル販売
●
●
営業利益
自動運転・先進運転支援システム
用自動組立ライン
サステナビリティ戦略
売上高
営業利益
インド二輪安全規格強化 による
ABS関連装置
エレクトロニクス事業
億円
2,218
ROE
電池製造の全工程一括ライン
●
売上高
億円
データセンター向け蓄電池
●
自動車事業
億円
2,191
営業利益(億円)
億円
EV向け車載用電池の製造ライン
●
事業戦略
全社一丸となって取り組んでいきます。
3,000
●
価値創造
エナジーソリューションズ
事業
営業利益137億円を計上し、3期連続で過去最高益を更新する好スタートを切りました。
DAIICHI JITSUGYO CO., LTD.
「MT2027」初年度は過去最高益を更新
次なる飛躍に向けた成長基盤の確立へ
定性・定量目標の達成でつなげる
Integrated Report 2026
成長戦略と中期経営計画
●
成長が見込まれるインフラ分野へ
の投資
036
事業投資ガイドライン
成長投資の150億円は、7つのセグメントを強化する「中核領域」、社会課題の解決に向けた「隣接領域」、新たなビジネスに挑戦するための「新規領域」で展開します。
事業投資領域
設備販売を増強する
短期
既存7セグメントを強化する投資
❷ 販路拡大につながる投資
競合排除、販路を拡大する
❸ エンジニアリング強化につながる投資
成長
投資
隣接領域
億円
社会的価値を生み出し、社会課題の解決に向けた取り組みへの投資
脱炭素社会
AI・IoT 次世代通信
3R 循環型社会
医療安全・安心な暮らし
❺ コト売りビジネスへの出資
❻ 持続可能な開発と社会への貢献
新たなビジネス領域・ビジネスモデルへ挑戦するための投資
❼ 探索的投資
グローバルの成長を取り込む
中期
安定した収益基盤を創出する
社会的価値を創造する
技術を育て、技術をつなぐ
新技術の探索、燃料販売やリサイクルビジネスなど新領域参画、スタートアップへの出資
長期
収益構造の変革が結実し過去最高益を達成しました。強靭化した財務基盤で還元と投資を両立します。
戦略骨子
進捗
◎
成長を加速する
事業戦略
△
◎
ポートフォリオ最適化
小型バイナリー発電装置の製造権および販売権の事業譲渡
エンジニアリング強化
ソリューション提供が浸透し、営業利益率6.3%を達成
営業利益率向上
グローバル
重点エリアのインドでは、産業機械事業、自動車事業の売上が伸長
事業投資
成長ドライバー
創出
NITTOKU FA INDIAへの出資。事業の基盤強化とシナジーを重視した選別を徹底、2027年3月期より事業投資を本格化
ガバナンスとリスク管理の強化
調達ルールの厳格化等により、リスクリテラシーとガバナンス体制が大幅に向上
高付加価値化
データ
変化に対応する
レジリエントな
経営基盤
事業投資ガイドライン
サステナビリティ戦略
定性目標の進捗
事業戦略
新規領域
サプライチェーン・社会インフラ
競合他社(設備商社)の買収など
設備販売に付加価値を創造する
❹ 非日系の攻略を目的とした出資・JV設立
150
メーカーの買収・出資、デモ機購入など
価値創造
中核領域
投資回収
事業投資ガイドライン
❶ 商材、商権確保につながる投資
DAIICHI JITSUGYO CO., LTD.
Integrated Report 2026
成長戦略と中期経営計画
DX/人的資本
バックオフィス業務の効率化
企業価値向上
○
資本効率の最大化
自己株式の取得・配当の維持。財務戦略と事業成長の両輪で、資本コストを意識した経営を徹底
2025/3
PBR 0.87倍 ROE 11.6%
2026/3
PBR 1.14倍 ROE 11.7%
037
プラント・エネルギー事業
プラント分野においては、長年にわたる豊富な経験により、各種プラントや装置とともに高度な専門性を生かした技術を提供しています。エネルギー分野においては、
DAIICHI JITSUGYO CO., LTD.
Integrated Report 2026
事業別戦略
バイオマス・バイナリー・太陽光・CCUS(二酸化炭素回収・利用・貯留)関連装置など再生可能エネルギー技術の提供、SOFC※1・BESS※2など新技術の提供および水素・
連商材の開発にも注力しています。
プラント・エネルギー事業
本部長福永和也
価値創造
アンモニアといった次世代燃料促進への取り組みを推進しています。また、脱炭素社会の実現に向けたFS※3・FEED※4支援サービス、各種ソリューション提案および関
さまざまな製品生産の上流となる原料・インフラ業界の企業と取引
当事業取引先業界
他事業取引先業界
事業戦略
製油所
エネルギー資源業界
石油化学・化学工場
自動車
産業機械
ヘルスケア
エレクトロニクス
航空・インフラ
金属類(鉄・アルミ・レアメタル)
燃料(石炭・天然ガス)
データ
発電所
サステナビリティ戦略
エナジー
ソリューションズ
森林/植林
製紙
※1 Solid Oxide Fuel Cell:固体酸化物形燃料電池
※2 Battery Energy Storage System:バッテリーエネルギー貯蔵システム
※3 Feasibility Study:プロジェクトの実現可能性を客観的に評価する事前調査
※4 Front End Engineering Design:FSの後に行われる基本設計
038
概況と成長戦略
2026年3月期の概況
DAIICHI JITSUGYO CO., LTD.
Integrated Report 2026
事業別戦略
リスク
国内向けの各種プラント用設備の売上が減少し、
減収減益となりました。一方で、
DJ-WAVEエンジニアリングとの協業によるリチウムイオン・バッテリー
●
トフォリオのさらなる整理・転換を進めていきます。今後の成長が期待される蓄電池関連分野でのビジネスを本格的に開始し、成長に向けた事業展開
が進展しました。
国内の人口減少、需要減退による
顧客の設備投資機会の減少
機会
●
成長戦略
●
今後の持続的成長に向け、事業ポートフォリオの見直しを最重要課題と位置付けています。各分野の可能性や課題を見極め、最も効率的な取り組み
体制の構築と、人材の最適配置による事業成長の具現化を目指します。これらの取り組みを、半年から1年を目途に実行フェーズへ移行させていきます。
電力ニーズの拡大による
電力インフラ設備需要の急増
次世代エネルギー開発の加速
上流工程における技術支援・
コンサルティング需要の増加
また、注力領域として、燃料電池、蓄電池、CCUS、地熱発電関連の資機材・サービスの提供を掲げるとともに、グローバルでの当事業の活性化を図り
事業戦略
●
価値創造
分野での大型EPC(設計・調達・建設)案件の受注など、新たな成果も出ています。また、小型バイナリー発電事業の譲渡を完了しましたが、引き続きポー
ます。さらに、DJ-WAVEエンジニアリングやスルザーグループとの連携を通じて新たなサービスを創出するとともに、品質向上が進む中国製機器につ
いては、日本向けに限らず第三国への拡販も目指します。その実現に向け、各国の規制などに対応する仕組みを構築し、新たな価値創造につなげてい
売上高(百万円)
売上高構成比率
計画
実績
23,856
20,700
営業利益(百万円)/営業利益率(%)
予想
計画
25,900
22,415
実績
7.7
25,000
23,700
営業利益率
予想
7.3
5.3
1,134
2026/3
2025/3
2026/3
2027/3
0
2025/3
1,625
1,184
2026/3
1,857
1,320
2027/3
データ
10.2%
1,843
0
サステナビリティ戦略
きます。
039
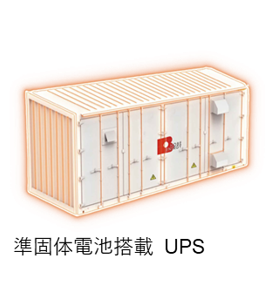
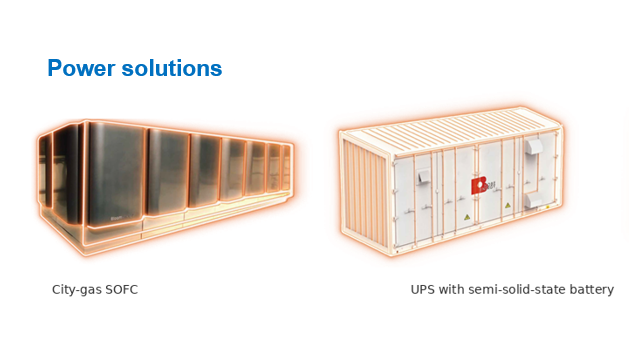
燃料電池・蓄電池でデータセンターの電力供給を支える
データセンター需要の拡大に伴い、安定稼働を支える電源確保の重要性が急速に高まっています。国内のデータセンター新設における最大の
組み合わせることで、系統からの給電を必要としない自律的な電源を確保し、
「整備待ち」を解消する独自の電源供給網を提案しています。さ
らに、グローバル調達力を生かし、各種非常用発電機や、燃えない準固体電池搭載UPS※などの短納期供給を可能にします。データセンター
の早期稼働を実現し、事業者の機会損失を最小限に抑えます。
特徴・強み
グローバルな調達力とエン
ジニアリング機能を生かし、
上流 から下流まで 一貫して
バッテリー製造・電力インフ
ラ設備を提案
価値創造
ボトルネックは、送電網の整備待ちによる数年単位の工期遅延です。これに対し、既存の都市ガスインフラを活用できる燃料電池(SOFC)を
DAIICHI JITSUGYO CO., LTD.
Integrated Report 2026
Topics
主な商材とその役割
ンフラを活用して敷地内で発電できるSOFCを提案しており、工期遅延を避け、1〜2年程度で電力を立ち上げ可能としています。
燃料電池・蓄電池分野にお
ける10年以上の経験と実績
事業戦略
AIデータセンターの主電源として普及が拡大。発電効率が高く、24時間フルパワーで発電を継続できます。当社では既存の都市ガスイ
主電源
燃料電池発電所
データセンター
24時間フルパワーで常時発電
サーバー
1〜2年で100MW級を立ち上げ
UPS・非常用発電機
送電網
(系統)
大型蓄電池(BESS)
ピークカット(充電→放電)
停電時は即座に自立運転へ移行
停電時に
データの損失を防ぐ
バックアップ電源
平常時は夜間などの安価な電力で充電し、需要が急増するピーク時に放電して契約電力の抑制(ピークカット)に貢献。
各工程メーカーとの提携に
より、非常用発電機 や準固
体電池搭載UPSなどの短納
期供給を実現
データ
補完・バックアップ
停電時はSOFCとともに即座に自立運転へ移行し、UPSと連携して電力供給を継続します。
送電網整備を待たずに短期
間で電源を確保できる独自
のソリューション
サステナビリティ戦略
既存の
都市ガスインフラ
高効率な生産設備・電源設
備の納入により、生産能力向
上とCO2排出量削減に貢献
※ Uninterruptible Power Supply:無停電電源装置
040
エナジーソリューションズ事業
脱炭素社会への移行が加速する中、エネルギー市場では再生可能エネルギーの普及やモビリティの電動化が急速に進展しています。当事業はリチウムイオン・バッテリー
DAIICHI JITSUGYO CO., LTD.
Integrated Report 2026
事業別戦略
(LIB)を中心に、燃料電池、次世代電池などの分野における多様化するニーズに応えるべく、グローバルな調達力とエンジニアリング機能を強みに、上流から下流まで
工程設計、装置選定、導入・立ち上げ、アフターサービスまでを包括的に支援することで、お客様の事業価値最大化に貢献しています。
エナジーソリューションズ事業
本部長田辺定
価値創造
一貫して製造設備を提供しています。また、設備メーカーとの共同開発を積極的に推進し、製造プロセスの実装・最適化を通じて生産性や品質の向上を目指すとともに、
次世代エネルギーデバイスの製造を上流から下流までをトータルサポート
リチウムイオン・バッテリーの製造工程
電極工程
組立工程
検査工程
電池材料となる正極材や負極材の
シート状の電極(正極・負極)を
正極・負極をセパレータと合わせ
完成した電池に
製造
製造
電池セルをパッケージング
充放電テストを実施、最終検査
事業戦略
材料工程
サステナビリティ戦略
主な商材
主な商材
主な商材
・混練機
・タブカット機
・充放電検査装置
・粉砕機
・塗工装置
・積層機/巻回機
・OCV/DCIR/ACIR
・混合機
・ロールプレス機
・電池組立装置
・検査工程搬送
・燃料電池(SOFC)向け材料
・スリッター
・電解液注入機
・出荷梱包/パレ・デパレ
・X線検査装置
・各種検査装置
・リーク/気密検査装置
・モジュール/パック装置
データ
主な商材
・焼成炉
041
概況と成長戦略
2026年3月期の概況
DAIICHI JITSUGYO CO., LTD.
Integrated Report 2026
事業別戦略
リスク
北米の大型プロジェクトが売上に大きく寄与した2025年3月期と比較すると、売上高は減少しました。一方で、コスト管理の徹底や収益性の改善によ
●
あり、日系顧客向け案件への依存度が高い点が挙げられます。顧客の設備投資動向に業績が左右されやすい事業特性を踏まえ、外国籍企業の開拓
●
や地域の分散を加速するとともに、保守・メンテナンスや材料ビジネスなどの継続案件の拡大を通じて、収益基盤の安定化を図ります。
顧客の設備投資機会の減少
EVおよびリチウムイオン・バッテリー
市場の減衰
価値創造
り、営業利益は前期並みの水準を維持しました。課題としては、外国籍企業向けの案件は増加しているものの、現時点では業績への寄与が限定的で
機会
成長戦略
●
「V2030」の目標達成に向けて、
「Phase1:大型プロジェクト案件の確実な受注」
「Phase2:新規事業の収益化」
「Phase3:新たなビジネスの創出・開拓」
リチウムイオン・バッテリー市場は、EV向けの成長率が鈍化する一方、AIデータセンターの増設や再生可能エネルギーの導入拡大を背景に、系統用を
省人化・高付加価値化ニーズ増加に
よるトータルソリューション提案機
会の拡大
事業戦略
●
の3段階で成長戦略を推進します。
AIデータセンターの増設に伴うエネ
ルギー貯蔵システムの需要拡大
中心とした定置用ESS※の需要増加が見込まれています。こうした国内外の旺盛な投資需要を着実に取り込み、受注拡大につなげます。中長期的には、
次世代電池やペロブスカイト太陽電池向けの差別化商材を展開するとともに、AIデータセンターやヒューマノイドロボットなどの成長分野において、サ
※ Energy Storage System:電力貯蔵システム
売上高(百万円)
売上高構成比率
計画
実績
営業利益(百万円)/営業利益率(%)
予想
計画
実績
54,101
6.6
40,044
36,200
26,900
5.2
5.0
2,684 2,639 2,644
31,100
24,500
2026/3
1,097
879
0
2025/3
データ
18.3%
営業利益率
予想
サステナビリティ戦略
プライチェーンへの参入につながる商材の開拓を進め、収益機会の拡大を図ります。
2026/3
2027/3
0
2025/3
2026/3
1,270
2027/3
042
データセンター向け需要を捉え、電池製造の対応領域を拡大
DAIICHI JITSUGYO CO., LTD.
Integrated Report 2026
Topics
データセンター市場の成長を背景に、電源確保、冷却、非常用電源、バックアップ電源などの電力ソリューション需要が増加しています。当事業では、これら電池・電源の製造における上流
も同市場への展開を拡大していきます。
電力システム
価値創造
から下流までの各工程で、多様なメーカーと連携し、データセンター市場のサプライチェーンに入り込んでいます。今までの電池製造のソリューション提供で培った知見を基盤として、今後
ITサーバー
ESS(電力貯蔵システム)
BBU(Battery Backup Unit)
CBU(Capacitor Backup Unit)
AIデータセンターの主電源として普及
電力を一時的に貯蔵し、需要に応じて
サーバーラック内部に設置され、停電
停電時にキャパシタで短時間の電力を
が拡大している燃料電池
放出するシステム
などの際に一時的に電力を供給
供給するユニット
サステナビリティ戦略
当社が提供する製造設備が、データセンター向け製品の生産を支えています
材料工程
電極工程
組立工程
事業戦略
SOFC(燃料電池)
検査工程
データ
043
産業機械事業
産業機械事業は1950年代、プラスチック成形加工機の販売から始まりました。その後、さまざまな分野へと事業を展開し、現在では家電や住宅設備、食品包装、医療
DAIICHI JITSUGYO CO., LTD.
Integrated Report 2026
事業別戦略
用機器など幅広い顧客との取引を行っています。扱う商材についても、プラスチック成形機から塗装用設備(塗装ライン)や3Dプリンターへと幅を広げています。製造
産業機械事業
本部長澤木久仁彦
機能を強みとする当社にとって追い風であり、当事業においても製造設備全体の提案を強化しています。
価値創造
業界では近年、生産ラインを設置する際、装置を単体で仕入れるのではなく、ライン全体を一括で導入するニーズが高まっています。このトレンドは、エンジニアリング
多種多様な業界のモノづくり現場における生産性向上や省人化を支援
事業ポートフォリオ
真空成形
事業戦略
押出成形
納入先業界
塗装設備
射出成形
主な商材
主な商材
主な商材
・高速連続真空圧空
成形ライン
・小ロット多品種対応連続
真空成形機 など
・大型射出成形機・中小型
精密射出成形機
・材料供給、金型温調、
インサートシステム など
・塗装ブース
・乾燥炉
・洗浄機
・搬送装置 など
アディティブ・
マニュファクチャリング
自動機・省力化
サステナブル素材
リサイクル
建設機械/農業機械
バッテリー/
モバイル/ OA
医療
サステナビリティ戦略
主な商材
・フィルム・シート製造装置
・コンパウンド・リペレット
装置
・押出機・巻取機 など
アグリ(イチゴ培養苗)
食品容器/部品トレー
主な商材
主な商材
主な商材
・各種部品組み付け、
マテハン装置/検査装置
・充填包装ライン など
・リサイクル押出装置
・各種トレー製造
・溶剤回収・再生装置
・イチゴ苗
データ
主な商材
・3Dプリンター(粉末焼結、
光造形、熱溶解積層、
インクジェット、砂型、
ろう型造形)
家電
など
住宅設備
二輪車
産業資材
044
概況と成長戦略
2026年3月期の概況
リスク
大型案件の減少などにより減収減益となりました。特にメディカル部門では、海外向け大型案件において顧客の投資計画変更の影響を受け、当初の
●
成長領域としての可能性が広がっています。現在は、事業部横断でのビジネススキームを構築し、需要獲得に向けた取り組みを進めています。また、
アグリ部門では、2027年3月期は、通期黒字化を目指しています。
脱プラスチック・塗装レス化・材料リ
サイクルなどによる設備投資の鈍化
機会
●
成長戦略
●
射出成形機を中心とする既存事業を収益基盤としながら、市場環境の変化を見据えた事業分野の拡大を進めています。脱プラスチック、塗装レス化、
●
ングの取扱いによる業種・業界の拡大、AI市場拡大に伴うデータセンター向け商材開発を行い、対策を進めています。また、メディカル分野ではカテー
●
テル領域に集中し、コア商材の確立と北米市場開発に再注力しています。データセンター関連については、将来の収益基盤の一つとして育成していきま
営業利益(百万円)/営業利益率(%)
予想
計画
27,210
20,900
実績
4.1
3.0
21,000
1,333
890
2026/3
2027/3
0
2.7
2025/3
936
740
2026/3
860
2027/3
データ
12.4%
2026/3
営業利益率
予想
28,700
1,152
2025/3
アディティブ・マニュファクチャリン
グ ※の進展
サステナビリティ戦略
実績
29,505
0
メディカルデバイス市場の成長
して立体をつくる技術
売上高(百万円)
21,900
データセンター向けインフラ需要の
増加
※3Dプリンターに代表される、材料を積層
す。これらの取り組みを通じて、事業拡大と安定的な収益体制の構築を目指します。
計画
自動化・省人化、物流改善ニーズの
高まり
事業戦略
材料リサイクルなどを背景に、従来取り扱ってきた設備への投資鈍化が懸念されるため、3Dプリンターをはじめとするアディティブ・マニュファクチャリ
価値創造
想定を下回る状況が続きました。一方で、データセンター関連では、長年培ってきた仕入先との関係を生かし、関連商材の開拓を始めており、新たな
売上高構成比率
DAIICHI JITSUGYO CO., LTD.
Integrated Report 2026
事業別戦略
045
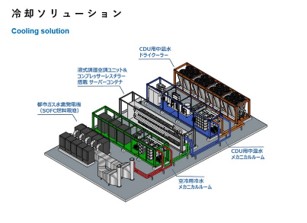
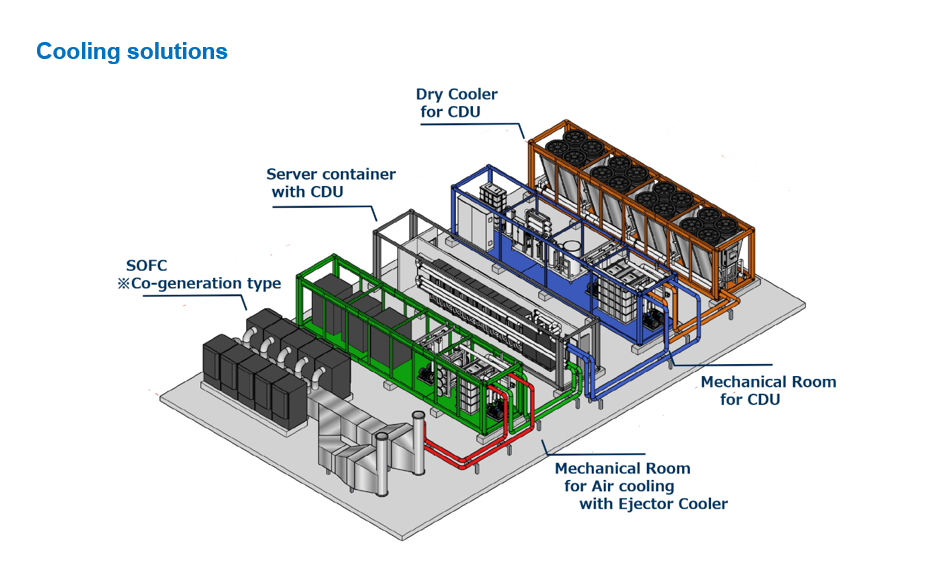
液冷技術の統合でデータセンターにおける「PUE 1.1 未満」を実現へ
DAIICHI JITSUGYO CO., LTD.
Integrated Report 2026
Topics
AIサーバーから発生する膨大な熱の処理について、商社の枠を超えたエンジニアリング体制で取り組んでいます。データセンターの省電力化と高密度サーバーの効率的な冷却を両立する
を連動させ、発電時に発生する熱を無駄なく利用する「ハイブリッド冷却システム」を提案します。本システムは、データセンターの電力利用効率を示す指標「PUE」で1.1未満という目標を
掲げています。2014年度以降に日本で建てられたデータセンターのPUE平均値は「1.47」※1であり、2029年度以降に新設する場合は「1.3以下」をクリアすることが省エネ法(エネルギーの
価値創造
ニデック株式会社製の高性能CDU(冷却液分配装置)の取り扱いに加え、株式会社カンネツがもつ液冷却配管設計・放熱制御技術を統合しました。この高度な液冷技術に、排熱回収技術
使用の合理化等に関する法律)で義務化される予定です。世界トップクラスの数値目標達成への取り組みを通じて、環境負荷低減と運用コスト抑制を同時に求める事業者のニーズに応え
ます。
都市ガス
事業戦略
ハイブリッド冷却システム
電力供給
コンテナデータセンター
メカニカルルーム
冷水
排熱回収冷却装置
サステナビリティ戦略
排熱回収
都市ガス水素発電
AHU※2 /
リヤドア等
サーバー
CDU
メカニカルルーム
ダイレクト・リキッド・クーリング用
冷却水
※1 総合資源エネルギー調査会省エネルギー・新エネルギー分科会省エネルギー小委員会工場等判断基準ワーキンググループ(令和7年度第2回)資料による
データ
冷却水
ドライクーラー
冷却液
※2 Air Handling Unit:空気調和機
046
エレクトロニクス事業
表面実装(SMT)、半導体などの分野において、電子部品実装システムや電子デバイスシステム、自動化設備を中心に、モノづくりプロセスの改革をもたらすソリューショ
DAIICHI JITSUGYO CO., LTD.
Integrated Report 2026
事業別戦略
ンを提供してきました。特に電子部品実装機の販売を主要ビジネスとし、エレクトロニクス業界で多くの実績を有しています。さらに、2021年に開始した構内物流自動
コンセプトで、生産性の効率化と業務品質の向上、製品品質の安定化を実現します。
エレクトロニクス事業
本部長山本慶二
価値創造
化ソリューション「LOGITO」ビジネスでは、業界を問わず幅広い顧客に対して物流の自動化を提案しています。「スマートロジスティクスを自由にデザインする」という
電子部品の実装をはじめとするモノづくりプロセスを改革
半導体・電子部品製造
組立
構内物流自動化ソリューション
「LOGITO」も提供
エレクトロニクス業界に限らず、さま
事業戦略
表面実装(SMT)
ざまなお客様の構内物流を自動化す
るソリューション「LOGITO」を提供し
詳細は
049ページ
サステナビリティ戦略
ています。
データ
主な商材
主な商材
主な商材
・電子部品実装関連システム
・基板外観検査装置
・各種搬送装置
・FOUP/FOSB梱包装置
・常温ウエハー接合装置
・プラズマクリーナー装置
・組立・自動機
047
概況と成長戦略
2026年3月期の概況
DAIICHI JITSUGYO CO., LTD.
Integrated Report 2026
事業別戦略
リスク
半導体分野では、AIサーバー向けの特需の影響もあり、計画を大きく上回って業績に貢献しました。これまで中国が中心であった市場も韓国・欧米へ
●
これまで市場をけん引していた車載関連企業による投資が減少したことに加え、生成AIの普及に伴うプレーヤーの変化を捉えられなかったことも要因
●
です。ただし、下期にはAIサーバー関連顧客からの大口受注や半導体後工程企業(OSAT)からの受注があり、市況変化を捉えた成果も生まれました。
地政学的リスク増加によるサプライ
チェーンの不安定化
半導体不足による市況悪化
価値創造
と広がりを見せており、今後の成長に向けた手応えを得ることができました。一方で、収益基盤である実装分野の国内市場は大きく落ち込みました。
機会
これらは、今後の事業拡大につながると考えています。
成長戦略
●
●
「MT2027」および「V2030」の目標達成に向けては、収益基盤である実装分野に加え、半導体分野および「LOGITO」分野を成長軌道に乗せることが
●
製造業などにおけるヒューマノイド
ロボットの活用
自動化・省人化ニーズの増加
ンの拡大に向けた体制を強化しています。さらに同事業の拡大に向けて、パートナー企業とのコンソーシアム構築を推進します。その一環として、
事業戦略
重要です。特に「LOGITO」分野では、専任部門として「LOGITO部」を発足させました。商材・人材の充実を図るとともに、構内物流自動化ソリューショ
生成AIの普及による新規需要
2027年3月期中に「LOGITO」展示場の設立を計画しています。お客様の多様なニーズに対応できる実証の場を提供し、それぞれの課題に応じた最
適なソリューションの提案につなげていきます。また、将来的に製造現場での普及が見込まれるヒューマノイドロボットについても、各社の強みを生か
売上高(百万円)
売上高構成比率
計画
実績
61,800
50,044
予想
62,100
営業利益(百万円)/営業利益率(%)
67,400
65,500
計画
実績
5.4
営業利益率
予想
5.4
51,073
4.9
3,181 3,200
データ
23.3%
2,6212,694 2,5842,747
サステナビリティ戦略
した連携により研究開発を加速し、
「V2030」では商業化を目指します。
2026/3
0
2025/3
2026/3
2027/3
0
2025/3
2026/3
2027/3
048
構内物流自動化ソリューション「LOGITO」
製造業や倉庫業における自動化ニーズの高まりに応じ、エレクトロニクス事業では構内物流の自動化ソリューション
た各工程を自動化するためのサービスです。当社の強みであるグローバルネットワークとエンジニアリング力を生か
現場設備のリアルタイム制御システムを当社独自開発
倉庫管理システム(WMS)の下位層で 設備・ロボットを 制御できる
「LOGITO-WCS」を独自開発しました。パッケージ化により、導入まで
の期間を従来の数ヵ月から1〜2週間程度 ※へと短縮し、導入コストも
し、多数のメーカーの製品からお客様の工場・倉庫に最適な機器を組み合わせて物流システムを構築できます。
抑制します。また、在庫管理にも対応し、運用設計の面でも最適化を
2026年4月からは社内に専任部門を立ち上げ、展示施設の設立を構想しています。
支援します。
「設備ごとに制御方式が異なり、連携仕様が膨らむ」といっ
価値創造
「LOGITO」を提供しています。「LOGITO」は、工場や倉庫内で必ず発生する仕分け・検品・搬送・荷下ろしといっ
DAIICHI JITSUGYO CO., LTD.
Integrated Report 2026
Topics
た現場の課題を解決するため複数メーカーの設備に対応しており、今
後も対応メーカーを順次拡大していく予定です。
他社物流
システム
1 世界中の先進技術から、
グループ会社
提携パートナー
※条件により変動
事業戦略
「LOGITO」の強み
お客様のWMS
お客様の現場に最適な「正解」を導き出す
特定のメーカーに偏らない中立的な視点で、膨大な選
択肢の中からお客様の構内物流の自動化に真にマッ
エンジニアリング
コーディネート
カスタマイズ
国内および
世界4軸体制
2 業界最大級のパートナーネットワークと
エンジニアリングの融合
自動化の要となる熟練エンジニアに加え、業界最大
設備機器
(信号機/シャッター
など)
級のパートナーネットワーク
(SIer/協力会社)
により、
(一部WES機能を含む)
自社構築では困難だった技術的課題を一括で解決。
高性能な
産業機械
3 海外調達と柔軟な提案力で、
最適な情報
投資対効果(ROI)を最大化する
グローバルな調達力を生かしたコスト最適化はもちろ
ん、精緻なROIシミュレーションに基づき、人件費削
モノづくりを行うお客様
減や生産性向上のメリットを最大化。
Standard
Robots社製
AMR
作業端末
(ハンディ端末
タブレット端末
など)
既存の使用設備も
カスタマイズ可能
データ
最先端の
生産技術
LOGITO-WCS
GALAXIS社製
パレットハンドリング
ロボット
サステナビリティ戦略
チするソリューションを厳選。
MyBull Robot社製
AMRなど
049
的なエネルギー管理が不可欠となっています。受配電・蓄電からエネルギーマネジメント
までの一体提案により、急激な負荷変動への対応や電源の安定化・高効率化を実現します。
特集
4 つの注力領域
プラント・エネルギー事業
エナジーソリューションズ事業
2 半導体・実装関連
AI向けGPUや先端半導体の需要急増に伴い、後工程(実装)の精密化や、製造プラント
価値創造
AIデータセンター需要に応える
関連する事業
DAIICHI JITSUGYO CO., LTD.
AI処理による電力消費の爆発的増加に対し、データセンターには安定的な電力供給と効率
Integrated Report 2026
1 電力・蓄電池
の歩留まり向上・物流自動化が急務となっています。実装システムから半導体材料プラン
ト、搬送の自動化まで、モノづくりプロセス全体を高度化・省力化するソリューションを
提供します。
でAIデータセンターの建設・拡張が猛烈なスピードで進んでい
関連する事業
エレクトロニクス事業
産業機械事業
プラント・エネルギー事業
ます。AIの高度な学習や処理には莫大な計算力が必要であり、
社会全体のデジタル基盤を支える最重要インフラとして、デー
タセンターに対する需要はかつてない高まりをみせています。
3 設備・保全・運用DX
AIデータセンターの発熱対策や設備の高密度化により、インフラの施工・配管設計から
や超高密度の熱処理など、構築・運用における技術的ハードル
運用の自動化・監視までの難易度が劇的に上がっています。水冷・給電などの設備構築
は極めて高くなっています。単に設備や機器を導入するだけで
から配管設計・施工、さらにはリモート保安や予兆保全といった運用DXまでをトータルで
は対応しきれず、安定稼働を担保するインフラの増強、安全な
エンジニアリング支援します。
運用管理、そして地球環境への配慮を、高いレベルで同時に実
関連する事業
産業機械事業
プラント・エネルギー事業
エレクトロニクス事業
現することが不可欠です。
こうした複雑な課題に対し、当社はエンジニアリング機能を
生かした統合的なソリューションで応えます。設計・施工から
4 脱炭素
主要なデータセンター事業者には厳格なESG基準が求められており、膨大な電力消費を
備・保全・運用DX」
「脱炭素」の4つの領域を重点的に強化し、
抑えつつ再生可能エネルギー・低炭素電源へ移行することが必須となっています。太陽
持続可能なAIインフラの構築に貢献していきます。
光や地熱などの再生可能エネルギー設備から、水素・アンモニア、CCS※まで、次世代エ
データ
保守運用までを見据え、
「電力・蓄電池」
「半導体・実装関連」
「設
サステナビリティ戦略
しかし、従来のデータセンターと比較して桁違いの電力消費
事業戦略
生成AIをはじめとする先進技術の急速な普及に伴い、世界中
ネルギーの導入やCO2削減ニーズにFS・FEED(詳細設計)段階から伴走します。
※発電所や工場から排出されるCO 2を分離・回収し、地下深くの地層に貯留する技術
関連する事業
プラント・エネルギー事業
エナジーソリューションズ事業
050
自動車事業
2019年の事業発足以降、自動車業界の変化をビジネスチャンスと捉え、ボディ・駆動・デバイスの3領域を柱として事業を展開してきました。ボディ領域では、自動車内
DAIICHI JITSUGYO CO., LTD.
Integrated Report 2026
事業別戦略
外装部品の成形機や塗装ライン、完成車両の組立・検査装置などを取り扱っています。駆動領域では、EV用パワートレイン向けの設備を、デバイス領域では、自動運
市場のトレンドと顧客ニーズに適応した提案を強化していきます。
自動車事業
本部長光田淳一
価値創造
転やADAS(先進運転支援システム)製品の組立・検査装置を提供しています。これらの領域において、自動車の「軽量化」
「電動化」
「自動運転・安全」をキーワードとして、
3領域で自動車づくりにイノベーションを起こし、車社会の進化に貢献
パワートレイン(駆動)領域
自動運転・安全(デバイス)領域
e-Axle・モーター
主な商材
カメラ
・樹脂成形設備・各種樹脂加工設備
・自動組立ライン ・性能・外観検査設備
・自動組立・検査ライン
車体外装
金属部品(ケース)
・車両組立設備・車両検査設備
・ダイカストシステム(ギガキャスト)
ECU(Electronic Control Unit)
・自動組立・検査ライン
・AI外観検査装置
車体塗装
インバーター・DCDCコンバーター
パワー半導体
・車両塗装ライン ・樹脂塗装ライン
・自動組立・検査ライン
・パワー半導体製造設備
データ
主な商材
サステナビリティ戦略
主な商材
車体内装
事業戦略
車体・内外装(ボディ)領域
051
概況と成長戦略
2026年3月期の概況
DAIICHI JITSUGYO CO., LTD.
Integrated Report 2026
事業別戦略
リスク
米国関税政策の影響やBEV(バッテリー式電気自動車)市場の減速などに伴う投資延期の影響により、受注高および売上高は計画を下回りました。一
●
BEV失速による顧客の業績悪化
の引き合いが増加しています。さらに、組織強化や商材開発についてもおおむね計画通りに進捗しました。今後、これらの施策をより確実な成果につ
●
設備投資の抑制による受注減少
なげていくためには、2027年3月期において取り組みをさらに浸透させることが重要であると認識しています。
機会
●
成長戦略
●
①OEMとの取引拡大、②HEV(ハイブリッド自動車)関連製品への提案強化、③商材・商権開発、④インド・米国市場に対する支援強化の4テーマに注
軽量化、電動化、自動運転・安全に
関する設備需要の増加
海外案件・ラインの取りまとめニー
ズの増加
化では、熱マネジメント関連製品、ユニットの組立設備、検査設備、自動化ラインの提案に注力します。商材・商権開発では、海外製品の代理権獲得
事業戦略
力します。OEMとの取引拡大では、車体・内外装、パワートレイン領域において取引拡大を目指し営業活動を強化します。HEV関連製品への提案強
価値創造
方で、営業利益は計画を上回る結果となりました。また、当社の「グローバルネットワーク」と「エンジニアリング機能」に対する評価は高く、大型案件
を含めた技術競争力のある設備・工法の開発を進めます。インド・米国市場に対しては、現地営業体制の強化に加え、本社との密接な連携を図ります。
これまで推進してきた電動化製品(e-Axle、モーター、インバーター、自動運転用カメラ・センサー)への取り組みについても、将来の成長に向けた投
売上高(百万円)
売上高構成比率
計画
実績
営業利益(百万円)/営業利益率(%)
予想
計画
42,508 47,200
44,100
42,000
40,742
実績
5.4
営業利益率
予想
6.1
4.6
32,800
2,186
2026/3
2,581
2,022
2,237
1,920
データ
19.4%
サステナビリティ戦略
資として継続します。
1,223
0
2025/3
2026/3
2027/3
0
2025/3
2026/3
2027/3
052
コニカミノルタグループの最先端技術で
自動車外観検査の自動化・DXを支援
主な取り扱い製品・技術
トンネル型インライン塗装欠陥検査システム
高精度なインライン検査
グループ企業となり、欧州の主要自
独自の技術により、微細な欠陥や凹凸を高精度に検知し、塗
検査システムを開発するスペインの
動車メーカーを中心に多数の自動検
装欠陥のサイズおよび種類を自動で判別します。
Eines Systems S.L.
(以下
「EINES社」
)
査ライン導入実績をもつ、画像処理
と、日系自動車 メーカー(OEM)を
技術のリーディングカンパニーです。
既存設備へ即座に導入できるコンパクト設計に加え、可動部
中心とするグローバル販売代理店契
この度、当社のもつ営業力と製造現
を排したメンテナンスフリーの構造により、塗装工程の生産
約を 締結しました。本契約により、
場 へ の 提案力・サ ポ ー ト 力 と、
性向上と大幅なコスト削減を実現します。
EINES社が提供する最先端の「自動
EINES社の「インライン自動検査技
●
車塗装欠陥・シーラー検査システム」
術」を融合させることで、国内のお客
後工程である自動研磨装置の提供も可能です。
および「隙間・段差・傷凹み検査シス
様へ最適なソリューションを提供で
テム」の取り扱いを開始し、完成車
きると判断し、契約締結に至りまし
メーカーへ向けた品質管理ソリュー
た。本提携を通じて、自動車製造現
ションの提供を強化しています。
場における検査自動化を推進し、お
化と品質の安定化が急務となってい
ます。特に、熟練検査員の目視に頼っ
トンネル型インライン隙間段差検査システム
●
させた、独自の3Dスキャン技術を搭載しています。
●
2019年にコニカミノルタ株式会社の
生産ラインを止めないノンストップ計測
正反射光とステレオビジョンを組み合わせることで、ラインを
稼働させたまま、大量の測定ポイントデータを高密度に取得・
メッシュ化します。
●
高精度な「隙間・段差」解析
取得したデータの高度な3D解析により、隙間や段差を極め
データ
強く求められています。EINES社は、
革新的なリアルタイム3Dスキャン
最先端の画像処理ソフトウェアと高性能ハードウェアを融合
ていた「外観検査」の自動化は、労働
力不足の解決およびDXの 観点から
後工程(自動研磨)へのシームレスな対応
サステナビリティ戦略
製造ラインにおける検査工程の効率
していきます。
容易な導入とメンテナンスフリー
事業戦略
化やモデルサイクルの短縮化に伴い、
客様の品質向上とコスト削減に貢献
●
価値創造
●
2026年3月、自動車製造向け外観
近年の自動車産業においては、EV
DAIICHI JITSUGYO CO., LTD.
Integrated Report 2026
Topics
て正確に計測し、自動車製造工程における品質管理を革新し
ます。
053
ヘルスケア事業
長年、錠剤外観検査システムの販売を中心に事業を展開してきました。現在でも医薬品は当事業の主力分野であり、国内メーカーを中心とした多くの医薬品製造現場
DAIICHI JITSUGYO CO., LTD.
Integrated Report 2026
事業別戦略
に設備を納入しています。そして2020年には、食品、化粧品、再生医療などへ事業領域の拡大を図り、ファーマ事業からヘルスケア事業へと名称を変更しました。これ
る顧客課題に対応します。
ヘルスケア事業
本部長上月勝恒
価値創造
らの領域で、エンドユーザーのQOL向上に資する価値提供を行っていきます。ヘルスケア産業への社会的ニーズが高まる中、製造ラインの最適化を提案し、複雑化す
医薬で培った経験と知識でヘルスケア業界を支え、人々の健康に貢献
主な商材
化粧品
エンジニア
リング
健康食品
医療機器
医薬
再生医療
錠剤検査機
カプセル検査機
印刷機
包装機
注射剤
第一実業ビスウィル社製
ファーマ事業本部
(〜2019)
錠剤外観検査システム
錠剤印刷検査システム
健康食品
第一実業ビスウィル社製
サステナビリティ戦略
医薬
錠剤検査機
カプセル検査機
包装機
事業戦略
化粧品
医療機器
ヘルスケア事業本部
(2020〜)
データ
設計から調達、据付まで一貫したエンジニアリングを提供
・当社エンジニアが顧客要望を踏まえた製造ラインを構想設計
・導入後の安定生産まで伴走し、安心を提供する
アフターサービス・ポリシー
詳細は
056ページ
各種医薬品包装機
054
概況と成長戦略
2026年3月期の概況
DAIICHI JITSUGYO CO., LTD.
Integrated Report 2026
事業別戦略
リスク
大型案件やエンジニアリング案件が順調に進捗し、過去最高水準の売上高・営業利益を達成しました。特に医薬品・高度管理医療機器・化粧品分野
●
店との連携強化も進み、ヘルスケア事業のグローバル展開に向けた基盤整備が進展しました。一方で、案件の大型化に伴い、プロジェクトマネジメン
トや技術人材の確保・育成が重要課題として顕在化しました。これらを成長に伴う課題と捉え、組織全体のリソース強化や人材育成を進めることで、
さらなる収益力の向上と事業基盤の安定化を図ります。
設備投資案件の大型化・複雑化に
伴うプロジェクトマネジメントの難化
●
海外サプライチェーンの不安定化
●
医薬品業界の薬価改定による投資抑制
価値創造
において大型案件を獲得し、顧客との関係強化につながりました。また、インド・ASEANを中心とした海外市場において、グループ会社や現地代理
機会
成長戦略
●
「高付加価値エンジニアリング案件の拡大」
「グローバル展開の加速」
「人材育成と組織強化」の3点に重点的に取り組みます。高付加価値エンジニアリ
●
加速では、インド、ASEAN、中国、北米を中心にさらなる事業拡大を図ります。人材育成と組織強化においては、次世代リーダーや技術人材の育成・
●
確保を進め、プロジェクトマネジメント力の向上と持続的成長を支える組織づくりを進めます。世界的な高齢化を背景に、設備投資需要は中長期的に
品質保証・省人化需要の増加
医薬品製造におけるGMP※要求の
高度化
※医薬品の品質確保のための製造・品質管
拡大が見込まれます。品質保証・省人化・自動化・デジタル化への要求も高まる中、当社の検査技術やエンジニアリング技術を生かし、
「V2030」の達
理に関する基準
売上高(百万円)
計画
実績
営業利益(百万円)/営業利益率(%)
予想
計画
23,826
22,000
22,000
21,600
実績
10.5
17,000
15,742
10.1
10.7
2,400 2,336 2,350
1,656
1,884
1,276
2026/3
0
2025/3
2026/3
2027/3
0
2025/3
2026/3
2027/3
データ
10.9%
営業利益率
予想
サステナビリティ戦略
成と人々の健康・安全な社会の実現に貢献していきます。
売上高構成比率
事業戦略
ング案件の拡大では、工場全体の構想・設計・施工支援、バリデーション対応まで含めた高収益型ビジネスへの転換を進めます。グローバル展開の
世界各国の高齢化を背景とする市
場ニーズ拡大
055
5領域のエンジニアリングで医薬品業界に新しい価値を提供
DAIICHI JITSUGYO CO., LTD.
Integrated Report 2026
Topics
昨今、製薬業界では医薬品の安定供給の重要性がますます増しており、安定した生産能力と信頼性を備えた企業の評価が高まっています。当事業では、政府による補助金などの支援を受け、
トワークを生かし、世界中の企業における生産性と品質を飛躍的に高めることにより、人々の健康に貢献することを追求します。
価値創造
生産能力を増強するとともに、品質向上を加速させている製薬各社に対し、資金調達を含めた医薬品工場全体のエンジニアリングソリューションを提供しています。当社のグローバルネッ
エンジニアリング領域
長年得意としてきたラインエンジニアリングから、技術の融合と深化によって領域を拡大してきました。
計画から引渡しまでのプロセス
装置、ライン、工場といったあらゆるエンジニアリングに対応し、設計からアフターサポートまで提供します。
複数分野
の融合
プラント
エンジニアリング
ライン
エンジニアリング
複数のラインを束ねて新たな工程を構築
工程全体の計画から設計・調達・施工・
立ち上げまで、一貫してマネジメントします
各社への見積依頼
●
詳細仕様の決定
●
施工計画の策定
●
レイアウト作成
●
提案審査
●
仕様変更管理
●
現場管理
●
予算検討
●
契約条件の交渉
●
スケジュール管理
●
●
発注
●
FAT / SAT※2
試運転・
アフターサポート
4つの提供価値
お客様の
負担軽減
品質の
確保
コストの
最適化
生産ラインの構築
お客様の要望に応じて装置を組み合わせ、
最適なラインを構築します
これまでの開発実績
スケジュールの
遵守
装置やシステムの設計・開発・製造
ビジネス
エンジニアリング
お客様の課題に合わせて
新しいシステムを提案し、製造します
データ
マシン
エンジニアリング
専門分野
への特化
工場全体を最適に設計・構築。安定生産に向け、
バリデーション※1も含めて支援します
施工〜引渡し
●
サステナビリティ戦略
各領域 で 必要 と な る 技術・知識
プロジェクト
エンジニアリング
新工場の立ち上げを設計から支援
詳細設計・管理
設備仕様の検討
事業戦略
見積・調達
基本計画/設計
●
潜在的ニーズを発掘して新たな事業を創出
市場や技術の変化を捉え、
新しい価値を生み出します
※1 医薬品の製造手順や管理方法などが期待される結果を与えることを検証し、文書化する作業
錠剤印刷検査システム
包材自動供給システム
※2 Factory Acceptance Test(工場受入試験)とSite Acceptance Test(現場受入試験)
056
航空・インフラ事業
航空・空港、防災・防衛の各分野において、社会インフラを支える重要な役割を担っています。事業の中核である航空・空港分野では、航空機の安全運航と空港の円滑
DAIICHI JITSUGYO CO., LTD.
Integrated Report 2026
事業別戦略
な運営を支える多様な地上支援機材・設備を提供しています。防災分野でも災害復旧を支援する特殊車両・機材を提案しています。近年は、海外の先進技術を活用し
います。
航空・インフラ事業
本部長安平慶
価値創造
たハイブリッド車両や各種省人・省力、電動化機材の導入にも注力し、環境配慮と運用効率の両立を図りながら、より高品質な空港維持管理サービスの実現に貢献して
現場を熟知したエンジニアが最先端のノウハウで交通インフラを支援
航空・空港分野
事業戦略
主な商材
日本の全空港に
累計2,000台以上の
地上支援機材を納入
牽引車(トラクター)
防除氷車(デアイサー)
コンテナローダー
グリコール回収車
航空用除雪車
令和2年度版」
摩擦係数測定車
サステナビリティ戦略
出典:国土交通省
「国土数値情報空港データ
防災・防衛分野
主な商材
事業本部内にカスタマーサービスの専門部署を設置し、納入後も継続
部品供給
分解調整
技術・操作トレーニング
組立
データ
充実のカスタマーサービス
してお客様をサポートします。また、2025年にはWEB受発注サービス
特殊救護車
指揮統制車
(スーパーアンビュランス) (コマンドカー)
パッセンジャー
ステップ
「DJK GSE Portal」の運用を開始しました。詳細は
059ページ
057
概況と成長戦略
2026年3月期の概況
DAIICHI JITSUGYO CO., LTD.
Integrated Report 2026
事業別戦略
リスク
過去最高の業績を達成した前期を大きく上回り、長年にわたり着実に積み上げてきた取り組みが成果として表れた1年となりました。特に受注面では
●
別化を図っています。この強みをさらに生かすべく、国内外のパートナー企業と協力し、短納期ニーズに対応する体制の強化に取り組みました。こう
●
した戦略が急回復した民間航空分野の需要に合致し、業績の拡大につながりました。一方で、外部環境の影響を受けやすく、業績変動が大きいとい
●
う特性もあります。今後も市場環境の変化を見据えながら、お客様に求められる価値を提供していくことで持続的な成長につなげていきます。
不安定な世界情勢の長期化
輸送中の事故による納期遅延やコ
スト増加
価値創造
複数の大型商談を獲得することができました。当事業では、競争力の高い商材に当社による保守・メンテナンスサービスという価値を加えることで差
屋外作業時の労災リスク
機会
成長戦略
●
2026年3月期は、主力である民間航空分野における大型案件が売上に大きく貢献しました。一方で、事業ポートフォリオの観点では、同分野への依存
堅調なインバウンド需要
事業戦略
度が高まる形となりました。そのため、鉄道、電力、一般道路、老朽化対策などの社会インフラ分野にもリソースを投入し、ポートフォリオの最適化を
目指します。これらの分野においても、中長期的に特別な存在として認知されることを目指し、製品・サービスの提案力や対応力のさらなる向上に取り
組んでいきます。事業運営においては、数値目標の達成のみを追求するのではなく、人材・サービス体制・提案力の強化を通じてお客様への提供価値
を高め、その価値に見合った適正な評価をいただける事業体制の構築を重視していきます。今後もこの姿勢を大切にしながら、市場の要求に応える
売上高(百万円)
売上高構成比率
計画
実績
予想
11,990
営業利益(百万円)/営業利益率(%)
計画
実績
10,300
10,000
8.8
8,800
7,639
6.7
959
1,080
751
4,000
2026/3
1,049
データ
5.5%
営業利益率
10.8
予想
サステナビリティ戦略
とともに、お客様の期待を超える存在となることを目指していきます。
511
213
0
2025/3
2026/3
2027/3
0
2025/3
2026/3
2027/3
058
「DJK GSE Portal」を導入
2025年に新たなシステム「DJK GSE Portal」を導入しました。受発注だけでなく、
在庫や不具合情報の一元管理が可能なため、お客様と当社の双方の効率化を実現
します。今後はシステムを通じてデータを蓄積・活用することで、市場の期待に先
回りするサービスの提供を目指します。
仕分けたり探したりする手間がかかる
お問い合わせごとに履歴が自動保存される
在庫確認
都度のお問い合わせが必要
サイト上でリアルタイムに確認できる
注文書
お客様の書式にて作成と送付が必要
第一実業の書式にてサイト上で作成できる
請求書管理
メールで受け取り、管理が必要
サイト上でいつでもダウンロードできる
情報共有
メールにてCCを手動で設定する
CCグループを事前に登録し一括で送信できる
見積〜請求の一元管理
見積依頼、発注、納品連絡、請求書の確
メッセージが管理されるほか、複数人へ
認から受領まで、サイト上で管理できま
のメール通知も設定できるため、社内メ
す。必要な書類にすぐアクセスできるた
ンバーへ簡単に情報を共有できます。
め、作業時間を短縮します。
サステナビリティ戦略
サイト上でやりとりが完結。案件ごとに
在庫確認機能
やりとりの管理
事業戦略
4つの主な機能
コメント機能
DJK GSE Portal
価値創造
お客様との部品取引に関するやりとりは、従来メールを中心に行ってきましたが、
従来(メール)
DAIICHI JITSUGYO CO., LTD.
部品の受発注や在庫管理を一元化
Integrated Report 2026
Topics
二段階認証
SMSによる二段階認証を利用できます。
リアルタイムで確認できます。営業担当
アカウントへの不正なログインを防ぎ、
に連絡せずに、お客様にて納期の目安
大切な取引情報を守ります。
データ
第一実業が 抱える在庫の有無や数を、
が立てやすくなります。
059
世界18ヵ国 36拠点で展開するグローバル戦略
世界的にもサプライチェーンの再構築が進む中、当社グループがこれまで築いてきた広範なグ
国内の各事業と連携しながら納める取引でした。しかし、近年では労働力不足を背景として、国内
ローバルネットワークは、他社との差別化を図る上での大きなアドバンテージです。外国籍社員を
の製造業は縮小傾向となっています。こうした状況下で持続的な成長を遂げるには、激化する国際
含む営業とエンジニアを各国に配置し、世界中から最適な設備を調達する力と、エンジニアリング
競争にも戦略的に挑み、グローバルにビジネスを拡大していくことが欠かせません。
力を融合させ、グローバルなお客様の多様なニーズに応えています。
価値創造
従来、第一実業の海外ビジネスの中心は、日系顧客の海外拠点に対して、日本の設備や技術を
DAIICHI JITSUGYO CO., LTD.
Integrated Report 2026
海外戦略
営業サービス拠点
4
中国エリア
拠点
10
アジアエリア
米州エリア
中国エリア
欧州エリア
拠点
フランクフルト・プラハ・ブダペスト・ソフィア
インドエリア
ニューデリー ・バンガロール・アーメダバード
※
中国エリア
上海・天津・蘇州・武漢・広州・深圳・香港・台北
インドエリア
3
サステナビリティ戦略
8
拠点
米州エリア
インドエリア
事業戦略
欧州エリア
欧州エリア
アジアエリア
シンガポール・クアラルンプール・ジョホールバル・
拠点
11
拠点
ペナン・バンコク※・ジャカルタ・ハノイ※・ホーチ
ミン・マニラ・ラグナ※・ソウル※
米州エリア
データ
アジアエリア
シカゴ・ヒューストン・オースティン・ノックスビル・
ケンタッキー・ケレタロ・モンテレイ・レオン・
サンパウロ・トロント
※テクニカルセンターを併設
060
DAIICHI JITSUGYO
INDIA PVT. LTD.
Managing Director
董事長兼総経理
久野貴之
アとなることを目標に掲げ、外国籍社員と日本人社員が一
ました。特に、自動車、産業機械、エレクトロニク
丸となって事業を拡大中です。市場環境としては、燃料価
スの3事業が 業績に大きく貢献しました。今後も
格の上昇により、天然ガス自動車と電気自動車の需要が急
変化し続ける市場環境に対応するため、国の政策
増しています。一方で、ガソリンとエタノールを任意の割合
動向を的確に捉え、それらと連動した事業展開を
で混合した燃料を用いるフレックス燃料車を各社が発表す
進めるなど、フレキシブルな対応が必要です。また、
るなど、リスクと新たなビジネス機会が混在する事象も起
インド企業の開拓と日系企業の取り込みを同時に
きています。現在は政府が推進するEV・半導体・再生可能
進め、インド企業にはインド人社員が対応する体制
エネルギー分野に注力しており、駐在員を増員しています。
を構築します。商材についても日本を含むグロー
また、半導体サプライヤーのネットワークの早期構築や、イ
バル調達や現地調達を最適に組み合わせること
ンド人社員の増員による販売・サービスのカバレッジ強化も
で、ラインナップを充実し、コスト競争力を含めた
重要なテーマです。
競争優位性を高めていきます。
今後の戦略
中国市場では景気減速や競争激化といった側面はあるも
日系企業の中国向け新規投資が慎重になる一
のの、EV・半導体・AIデータセンター・新エネルギー分野な
方、中国企業の技術力向上とグローバル展開が進
どで企業の技術革新と投資が継続しており、新たなビジネ
んでいる状況を踏まえ、現地に根差した戦略を加
ス機会が生まれている状況です。2026年3月期は、これら
速することが不可欠です。具体的には、成長市場
成長市場での販売活動を強化し、外部環境が厳しい中でも
への経営資源のシフトを引き続き進めるほか、グ
増収増益を達成しました。当エリアは「変化を力に、成長を
ローバルネットワークを活用して中国企業の海外
加速する」というスローガンを掲げ、新たな価値創造に挑戦
投資にも柔軟に対応し、顧客へのアプローチも強
しています。日本の優れた技術・設備を中国市場へ提供す
化します。また、中国市場の設備投資環境に合わ
るという従来の強みを生かしながら、中国で生まれる新し
せた体制整備を進めています。投資需要が縮小し
い技術・製品・ビジネスチャンスの発掘にも注力し、第一実
ている華北エリアから、投資の見込める華東エリ
業のグローバルネットワークを通じて世界へ展開していき
アへ人員を配置転換するなど、経営資源を最適化
ます。
します。
プラント・エネルギー事業
エナジーソリューションズ事業
1.1%
18百万円
41.2%
3,670百万円
34.2%
96百万円
3,053百万円
20.5%
1,824百万円
2.8%
7.7%
252百万円
8,916
百万円
売上高・売上構成比
特徴や 強み
エリア内セグメント売上高および比率 :
0.2%
産業機械事業
エレクトロニクス事業
9.2%
2,426百万円
7.9%
2,086百万円
8.3%
2,180百万円
22.8%
26,422
百万円
70.1%
18,518百万円
4.5%
1,200百万円
0.0%
9百万円
自動車事業
ヘルスケア事業
航空・インフラ事業
データ
海外売上高および比率 :
2026年3月期の受注金額は、過去最高を更新し
サステナビリティ戦略
上海一実貿易有限公司
インドエリアでは、第一実業の成長をけん引する中核エリ
事業戦略
中国エリア
今後の戦略
価値創造
結城樹範
売上高・売上構成比
特徴や 強み
DAIICHI JITSUGYO CO., LTD.
インドエリア
Integrated Report 2026
海外戦略
061
DAIICHI JITSUGYO
ASIA PTE. LTD.
Managing Director
6ヵ国に拠点を構える当エリアは、エレクトロニクスが事
「MT2027」期間中は引き続き、現在の計画を確実
業の主軸となっており、日系企業と中国企業を中心に幅広く
に達成できるよう各種施策を推進していきます。具
受注しています。「LOGITO」分野では、アジア系メーカー
体的な戦略として、まずは主力であるエレクトロニ
との協業も推進中です。また近年では当エリアでも省エネ
クス 事業 に お い て、中国 メー カ ーと の 協業 や
ルギー化が課題となっており、資源の再利用や再生可能エ
「LOGITO」商材の取り扱いを拡大します。さらに、
ネルギー、蓄電技術などを積極的に展開しています。2026
半導体分野における商材の拡販と専門営業人員の
年3月期には、廃タイヤ由来の熱分解油を精製する会社を合
拡充に注力する方針です。自動車事業では、現地
弁で設立し、精製プラントの建設を開始しました。本プラン
調達の商材を拡充し、多様化する顧客ニーズに応え
トは2026年末に完成予定です。ASEAN地域では中国企業
ます。プラント・エネルギー事業では、廃タイヤ由
の東南アジア進出によって競争が激化する中、第一実業の
来の熱分解油の拡販や環境対応商材の拡充のほか、
エンジニアリング機能を発揮し、いかに収益性を維持・向上
太陽光ビジネスのエリア拡大を図ります。ヘルスケ
させていくかが今後の課題となります。
DAIICHI JITSUGYO
(AMERICA), INC.
President
森本修司
3,643百万円
0.0%
43.1%
4百万円
6.0%
19.9%
6,782百万円
14,711百万円
2,058百万円
米国の関税政策をきっかけに投資の見送りやサ
ですが、
「MT2027」最終年度に向けて、さらなる経営体質の
プライチェーン再編などが続いており、2026年3月
強化と事業ポートフォリオの拡充に取り組んでいます。具体
期は営業利益が前年から半減となりました。特にメ
的には、バイオ医薬や半導体といった成長市場への参入、二
キシコでは経営環境が劇的に変化しているため、迅
次電池メーカーの工場建設案件や、AMR※や協働ロボットを
速な組織再編と人員の最適配置を行い、
「MT2027」
活用した自動化案件の強化といったさまざまな取り組みを実
の目標達成に向けた取り組みを加速させています。
行し、事業活動を活発化させています。また、2025年4月に
その成果として、メキシコでは複数の外国籍企業
は新たにDJKカナダを設立し、テリトリーを拡大しました。
との取引が新たに始まりました。今後はそのほか
同法人は2026年に実取引を開始し、
「V2030」最終年度には
の 拠点も含め、構内物流自動化ソリューション
売上高50億円を目指します。
「LOGITO」の提案を加速するほか、既存顧客との
※自律走行搬送ロボット
関係を深化し、主力の自動車および電池事業の中
26.5%
産業機械事業
0.2%
11,728百万円
97 百万円
3.8%
0.3%
138百万円
1,664百万円
38.2%
44,239
百万円
6.1%
2,692百万円
61.3%
27,132百万円
エレクトロニクス事業
自動車事業
ヘルスケア事業
データ
当エリアは自動車ビジネスが主体となっていることが特徴
エナジーソリューションズ事業
10.7%
売上高・売上構成比
今後の戦略
プラント・エネルギー事業
726百万円
百万円
ア事業では、需要の高い商材を拡販していきます。
特徴や 強み
エリア内セグメント売上高および比率 :
2.1%
34,105
長期的な拡大を図ります。
海外売上高および比率 :
6,179百万円
サステナビリティ戦略
米州エリア
18.1%
29.5%
事業戦略
今後の戦略
価値創造
吉田知弘
売上高・売上構成比
特徴や 強み
DAIICHI JITSUGYO CO., LTD.
アジアエリア
Integrated Report 2026
海外戦略
1.8%
785百万円
航空・インフラ事業
062
DJK
EUROPE GMBH
Managing Director
これまでけん引役だった車載用リチウムイオン·
バッテリー関連の受注は踊り場となっている一方、
にとっては競争が厳しい市場環境となっています。EV政策の
2026年3月期は、半導体大手顧客に対し、前工程
転換や地政学リスクなどが重なる中、当社の強みである「圧
向け設備で初の納入実績を上げました。同分野に
倒的な現地据付・エンジニアリング能力」を活用し、当エリア
引き続き注力するとともに、自動車投資の回復局
内における外国籍企業との取引拡大を図っています。2026
面を確実に捉えるべく、地域軸制から事業軸制へ
年3月期は、プラント・エネルギー、エレクトロニクス、航空・
のシフトも進めています。また、今後は同地域で
インフラ事業が力強くけん引し、エリア全体での受注額が過
活況なデータセンター向けビジネスも推進します。
去最高水準に匹敵したものの、大型納入案件のスケジュール
製品・サービス戦略ではアフターサービス体制を
遅延による売上計上の繰り延べなどにより、赤字を計上する
拡充するほか、エンジニアリング力を生かして一連
結果となりました。
「V2030」に向けて選択と集中を断行し、
の工程を「トータル自動化・省人化ライン」として
業績を回復することが課題となっています。
提案し、差別化を徹底します。
プラント・エネルギー事業
エナジーソリューションズ事業
産業機械事業
エレクトロニクス事業
1.2%
6.8%
22百万円
132百万円
8.6%
52.3%
25.3%
490百万円
166百万円
1,013百万円
5百万円
5.5%
1.7%
107 百万円
1,937
百万円
自動車事業
ヘルスケア事業
航空・インフラ事業
サステナビリティ戦略
「SMT実装」のプレゼンス強化に向けて、各種センターを開設
また中国では、コストを優先した生産から高付加価値生産へと急速
界的に高まる中、新規顧客を開拓するためには、実機によるデモンス
にシフトしており、モノづくりの現場では省人化にとどまらず、無人化
トレーションを通じて性能や導入効果を具体的に示すことが重要で
の実現を目指す段階へと移行が進んでいます。このような状況を踏ま
す。また、質の高いサービスを提供するためには、エンジニアのスキル
え、第一実業は他社との差別化を図りながら提案力・営業力を高める
向上を図る教育や実機訓練の場も不可欠です。そこで第一実業は、両
ため、従来のテクニカルセンターの枠を超えた「イノベーションセン
方の機能をあわせもつ「テクニカルセンター」を各国に展開しています。
ター」を計画しています。
2026年には、インド南部の産業集積地であるチェンナイに新たな
同センターは、最新鋭の設備を導入し、未来の理想的な工場の姿を
テクニカルセンターを開設します。近年、同エリアでは自動車や電子
具現化することで、お客様に次世代のモノづくりを体感いただける場
機器関連産業の進出が加速しています。お客様からの「実証テストを
を提供します。今後は、ヒューマノイドロボットやフィジカルAIなどの
行いたい」
「現地で迅速なサポートを受けたい」といったニーズの高ま
先端技術の活用も視野に入れ、ハード・ソフトの両面から、モノづくり
りに応えていきます。
現場の革新を支える提案力を一層高めていきます。
テクニカルセンター(インド・チェンナイ)
データ
電子部品をプリント基板の表面に搭載する「SMT実装」の需要が世
0.3%
事業戦略
域に優良な設備メーカーが多数存在することから、日本企業
エリア内セグメント売上高および比率 :
海外売上高および比率 :
Topics
欧州には「モノづくりの原点」という強いプライドと、各領
価値創造
守永亮平
今後の戦略
DAIICHI JITSUGYO CO., LTD.
欧州エリア
売上高・売上構成比
特徴や 強み
Integrated Report 2026
海外戦略
イノベーションセンター(中国・上海)のイメージ
063
価値創造
事業戦略
065 サステナビリティ推進責任者メッセージ
DAIICHI JITSUGYO CO., LTD.
Sustaina
bility
Strategy
Integrated Report 2026
サステナビリティ戦略
067 マテリアリティへの取り組み
068 マテリアリティ 1
071 マテリアリティ 2
エンジニアリング機能強化による
ソリューションの高付加価値化
073 マテリアリティ 3
サステナビリティ戦略
モノづくり現場における新たな価値の創造
働く環境の整備と多様な人材の確保・育成
080 社外取締役座談会
気候変動への取り組みと
サプライチェーンマネジメント
データ
084 マテリアリティ 4
09 1 マテリアリティ 5
ガバナンスの拡充
1 0 2 地域社会に向けた取り組み
064
地に足のついた
サステナビリティ戦略。
気候変動の加速、地政学リスクの高まり、経済的格差による社会の分断など、自然環境や社
会課題が複雑さを増す中、サステナビリティ経営の本質は、外部目線を意識した画一的な開示
西井啓介
き使命のもと、当社は人材への投資を重視し、社員一人ひとりの成長がお客様の課題解決につ
ながり、その先の人々の暮らしや社会を豊かにすると考えています。
現在、私たちは成長戦略「V2030」の達成に向け、5つのマテリアリティに基づき事業を推進
ります。当社の事業の強みは、世界各地に広がる製造現場へ最適な生産設備と高度な技術サー
しています。なかでも「モノづくり現場における新たな価値の創造」を基軸に、事業を通じて社
ビスを提供できることです。多岐にわたる産業セクターで長年培った機械販売のノウハウを基
会課題の解決につながる新たな価値の提供に重きを置いています。そのマテリアリティの進捗
に、世界18ヵ国36拠点のグローバルネットワーク、独自のエンジニアリング機能、設備に特化し
を確認するため、当社のサステナビリティ推進部では、部員自らが当社納入設備が稼働するプ
た物流サービスや保守・メンテナンス機能を組み合わせることで、当社が提供する価値はモノ
ラントを訪問し、経営層からオペレーターまで幅広いステークホルダーとの対話を通じて実態
の供給から、価格優位性を伴った生産設備のワンストップソリューションへと進化しています。
の把握に努めています。こうしたフィールドワークにより、サステナビリティの理論と実際の現
サステナビリティ戦略
一辺倒の対応から、自社の「稼ぐ力」の向上に繋げる戦略的な取り組みへと転換することにあ
私たちが目指すのは、モノづくり現場に根差した商社ならではの「地に足のついたサステナビ
事業戦略
上席執行役員経営企画本部長
サステナビリティ推進責任者
価値創造
商社ならではの
DAIICHI JITSUGYO CO., LTD.
モノづくり現場に根差した
Integrated Report 2026
サステナビリティ推進責任者メッセージ
場をつなげることで、現実的で実効性のある取り組みを行っています。
世界に目を向けると、ESG懐疑論や関連規制の緩和・見直しなど、サステナビリティを巡る環
上に加え、環境負荷低減にも大きな影響を与え続けます。だからこそ、世界中の多様な技術を
境は複雑さを増しています。しかし私たちにとってサステナビリティは一時的な潮流ではなく、
いち早く取り入れ、生産ラインに導入し、安定稼働に繋げることが、さまざまな産業を支える当
責任ある企業活動における当然の取り組みであり、持続可能な社会の実現に不可欠な基本姿勢
社の社会的貢献であり持続可能な価値の創造です。
です。社会から信頼され、必要とされる企業であり続けるために、私たちはこれからも現場に
お客様のモノづくり現場に寄り添い、ニーズと技術を的確につなぐ当社の社員こそが、こうし
根差した取り組みを継続し、ステークホルダーの皆様とともに、次の世代へつながる明るい未来
た価値創造を支える原動力です。「人をつなぎ、技術をつなぎ、世界を豊かに」という果たすべ
を築けるよう努力してまいります。引き続きご支援・ご指導を賜りますようお願い申しあげます。
データ
リティ戦略」です。納入した設備は数十年にわたりお客様の工場で稼働し、安全性や生産性向
065
「企業価値」という言葉は、人によって、あるいは文脈によって捉え方に違いがあるかもしれま
て、サステナビリティ委員会を設置し、上席執行役員がサステナビリティ推進責任者を務め、
せん。第一実業グループでは、
「世界を豊かに」することをミッションとして掲げ、限られた経
社内の取り組みを定期的にモニタリング、審議しています。これらの審議内容については、取
営資源を理念に照らし合わせて、バランスの取れた配分を行うことで、社会的かつ経済的にも
締役会に報告され、社外取締役の意見も踏まえて、評価を受けています。また、同委員会の事
価値の高い経営を実現できると考えています。そのため、取引先、従業員、株主・投資家といっ
務局をサステナビリティ推進部が担うほか、2025年からは、責任の明確化のため各マテリアリ
たステークホルダーにとっての価値を総体として最大化すること、すなわちレーダーチャート
ティの責任者として「マテリアリティオーナー」を設定しました。今後は、マテリアリティごとの
の四角形の面積を最大化することが、当社にとっての企業価値向上につながります。
価値創造
当社では、持続的な成長を実現していくことを目的に、代表取締役社長執行役員を委員長とし
DAIICHI JITSUGYO CO., LTD.
企業価値の考え方
Integrated Report 2026
サステナビリティ推進体制
目標およびKPIを設定し、サステナビリティ経営を推進していきます。
取締役会
サステナビリティ委員会
株主・投資家
代表取締役社長執行役員
現在の企業価値
(仮説)
事業戦略
マテリアリティオーナー
株価
高
コーポレート部門
事業部門
サステナビリティ推進部
高
高
取引先
従業員
売上高・利益
エンゲージメント
スコア
サステナビリティ戦略
サステナビリティ推進責任者
国内外拠点
高
● マテリアリティ進捗管理・報告
● 環境マネジメントシステム(EMS)を活用した推進活動
● サプライチェーン管理
● サステナビリティに関する情報開示について
● 人権尊重への取り組み
● 共生社会への取り組みについて
● 女性営業職のキャリア継続検討
● カスタマーハラスメントへの対応方針
目指すべき
企業価値
データ
サステナビリティ委員会の取り組み(議論内容)
地球環境・地域社会
外部評価
066
事業活動を通じて持続可能な社会の実現へ
中期経営計画「MT2 027」の 始動 にあ わ せ て刷新した5つのマテリアリティは、
「これ 無くして成長戦略『V2 03 0』を 達成 することが できない ほど、重要 な 課題」と位置
DAIICHI JITSUGYO CO., LTD.
Integrated Report 2026
マテリアリティへの取り組み
付けるものです。自社の成長 のみ ならず、事業活動を通じて持続可能な社会の実現に貢献 するべく、全社で推進しています。
「V2030」への目指す姿
1
モノづくり現場に
おける新たな価値の創造
徹底した現場主義により顧客ニーズを発掘し、社会課題
2
エンジニアリング
機能強化による
ソリューションの高付加価値化
当社のミッションである、人と技術をつなぐインテグレー
3
働く環境の整備と
多様な人材の確保・育成
4
気候変動への取り組みと
サプライチェーンマネジメント
PL経営+BS経営
マルチステーク
モノ売りから
グローバルの
ホルダーを
「モノ×コト」売り 成長を取り込む
意識した経営
DX推進
ション機能を発展させ、モノづくりを中心としたお客様
の現場で、圧倒的な存在価値が認められている。
誰もが安心して働ける環境と、多様性・包摂性を尊重す
る企業風土の中で育まれた社員一人ひとりの強みが、組
織全体の強みにつながり、創造的進化を続けている。
サステナビリティ戦略
地球温暖化をはじめとするさまざまな社会課題の解決に
向けた取り組みを、サプライチェーン全体との協業によ
り推進している。
データ
5
の解決につながる新たな価値を提供している。
積極的な投資
事業戦略
マテリアリティ
価値創造
成長戦略との紐付け
事業環境の変化に機敏に対応するグループ経営体制を
ガバナンスの拡充
構築し、効率的かつ健全で透明性のある、ゆるぎないガ
バナンス体制を維持・強化している。
067
モノづくり現場における新たな価値の創造
モノづくりの 現場で は、労働力や 後継者 の 不足、人件費の 高騰、自動化 の 遅 れといった社会課題を 抱 えています。当社としては、長年培ったノウハウを 生 かして、この
DAIICHI JITSUGYO CO., LTD.
01
Integrated Report 2026
マテリアリティ
ような状況下だからこそ提供できる価値 があると考え、
「モノづくり現場における新 たな 価値の創造」というマテリアリティを策定しました。今後は、新規事業へ の 参入
取り組みテーマ
「V2030」への
目指す姿
指標(KPI)
バウンダリー
新規顧客による受注高
2025年度実績
指標の状況
290億円
事業領域の拡大
●
連結
15件
●
●
顧客ニーズを発掘し、社
会課題 の 解決 につな が
る新たな価値を提供して
いる。
グローバル成長の取り込み
外国籍企業向け受注高
連結
NITTOKU株式会社とのインド合弁会社設立及
び巻線機のインド販売権獲得
アグロルーデンス株式会社との代替タンパク質
製造プロセス共同開発・製造設備販売
タイ/ ESG Chemicals Co., Ltd.への出資によ
る廃タイヤ由来熱分解油に係る製造・販売
585億円
●
外部環境への対応遅延による新規市場への参入機会喪失
●
社会課題の解決につながる新規事業の創出
●
既存顧客の事業縮小によるビジネス機会の喪失
●
事業ポートフォリオの強靭化
●
国・地域ごとに異なる商慣習への不適合
●
グローバルネットワークの拡大
●
技術淘汰による投資や戦略の失敗
●
既存技術・人脈の活用による取引先企業の拡大
データ
機会
リスク
サステナビリティ戦略
製造ライン・プロセス一括提案
による大型プロジェクト受注案
件数
徹底した現場主義により
取り組み状況
事業戦略
連結
価値創造
に果敢にチャレンジし、事業領域の 拡大を目指 すほか、一つひとつの 事業 の 価値を最大化していきます。
068
お客様が最新設備やシステムを体験できる施設「フューチャーキャンパス(仮称)」の建設プロ
されたもので、電動車の電源・モーター向けアルミダイカスト(鋳造)工程のカーボンニュートラ
ジェクトを開始しました。施設内では、最新設備・技術のデモンストレーションをはじめ、予知
ル化を目指す技術実証です。
保全・リモートメンテナンス、海外デモセンターとの連携などを体験できます。当プロジェクトは、
成長投資150億円のうち約40億円を投じ、工期は2027年11月〜2029年9月を予定しています。
保持炉を水素燃料対応へ改造し、同炉を含むダイカストライン一式のDENSO HARYANAへの
当社グループが社会に対して提供できる付加価値を、具現化して発信できる場として積極的に
移設工事を実施しました。併せて、当社グループ会社であるDAIICHI JITSUGYO INDIA PVT.
LTD.が、DENSO HARYANAとの建築・設備工事契約に基づき、水素供給ステーションの建築
およびダイカストラインのユーティリティ(電気・配管等)工事を実施しています。
※令和5年度補正グローバルサウス未来志向型共創等事業費補助金(我が国企業によるインフラ海外展開促進調査)
第一実業
アルミ溶解保持炉の
ダイカストライン
●
水素供給ステーションの建築
水素燃料対応への改造
一式の移設
●
ダイカストライン一式の据付
施設 で体験 できること
●
最新設備・技術のデモンストレーション
●
予知保全・リモートメンテナンス
●
海外デモセンターとの連携
など
事業戦略
第一実業
活用し、
「V2030」の実現とその先の事業成長につなげていきます。
価値創造
当社はデンソーとの請負契約等に基づき、同社が所有する株式会社宮本工業所製アルミ溶解
DAIICHI JITSUGYO CO., LTD.
本事業は、経済産業省が主導する補助金事業 ※に株式会社デンソー(以下「デンソー」)が採択
Integrated Report 2026
水素燃料を活用したアルミ溶解実証事業の工事を実施
「少し先の未来のモノづくり現場」を発信
フューチャーキャンパスプロジェクトが始動
DAIICHI JITSUGYO INDIA
サステナビリティ戦略
工場のDX化に役立つ情報発信のための
専門メディア「マモリワ」を監修
近年、プラントや工場では熟練技術者の不足や設備の老朽化に伴い、保全業務の効率化・高
度化が喫緊の課題となっています。IoT・AIを活用した予防保全や、データに基づく保全管理が
注目される一方で、
「何から取り組むべきか分かりにくい」という声も多く聞かれます。
この課題に対し、当社は工場のDX推進に役立つ専門WEBメディアを監修しました。今後、プ
ラント・工場の設備保全領域における基礎知識やシステム導入事例、設備別メンテナンスの情報
「マモリワ」掲載コンテンツ例
●
予知保全・保全管理の基礎知識
●
工場の設備管理に関するシステム
●
設備別の故障原因とメンテナンス方法
●
予兆保全システムの活用事例
●
工場における設備管理課題と解決策
フューチャーキャンパス(イメージ)
データ
など、DX化の第一歩に役立つ内容を随時更新していきます。
069
当社は2022年より、バイオマス関連事業を展開するアグロルーデンス株式会社(以下「アグロ
ヤマハ発動機株式会社の水素エネルギー実証施設「ZERO BLUE LAB 未森(みもり)」
(静岡
ルーデンス」
)と戦略的パートナーシップを締結し、コメ由来マイコプロテイン※1およびバイオエタ
県周智郡森町)に当社の取り扱う株式会社宮本工業所製のアルミ溶解保持炉が採用され、実証
ノールの商用化に向けた技術開発を行っています。
運転を開始しました。
二輪車などの工業製品に欠かせない鋳造部品の製造工程においては、アルミ合金を溶解する
設備を導入し、運用を開始しました。本設備は、コメから代替タンパク質とバイオエタノールを併
ための熱エネルギーとして、都市ガスなどの化石燃料を使用することが一般的です。しかし、従
産する独自技術のスケールアップ検証拠点です。連続運転を通じてプロセスの再現性・経済性・
来のアルミ溶解保持炉では燃焼時に大量のCO ₂が排出され、製造業全体のカーボンニュートラ
運転安定性を検証し、安定供給体制の構築を加速させます。また、本設備で取得する運転デー
ル実現に向けた課題となっていました。一方、このたび採用された水素ガス燃焼型のアルミ溶解
タは将来の商用プラント設計に活用し、複数拠点への展開を見据えた技術標準化を進めます。
保持炉は、燃焼時にCO ₂を一切排出せず、水のみが副産物となる次世代のクリーン技術として注
今後は年間5,000トン規模のマイコプロテインおよび年間1万〜2万キロリットル規模のバイオ
目されています。
当社は環境負荷の低い優れた設備の供給を通じて、お客様のカーボンニュートラルへ向けた
かした海外展開 も検討し、持続可能な資源の供給を通じて気候変動をはじめとする社会課題
製造技術をサポートします。サプライチェーン全体のCO ₂削減と持続可能な産業の実現に向け、
の解決に貢献します。
今後も革新的な環境対応ソリューションの提供に尽力していきます。
事業戦略
エタノールを生産する商用プラントの実現を目指すとともに、当社のグローバルネットワークを生
※2
価値創造
このたび両社の協働により、アグロルーデンス那須工場(栃木県大田原市)へ大規模技術実証
DAIICHI JITSUGYO CO., LTD.
ヤマハ発動機の水素エネルギー実証施設
「ZERO BLUE LAB 未森(みもり)
」へアルミ溶解保持炉を供給
Integrated Report 2026
アグロルーデンスと協働し
代替タンパク質・バイオ燃料の商用化に向けた実証設備を導入
※1 麹菌でコメのタンパク質を発酵させて製造する次世代タンパク質。牛肉等に比べ生産時の温室効果ガス排出量が
少なく、副産物からバイオ燃料も製造可能
※2 グローバルサウス地域へのプラント展開を共同検討中
サステナビリティ戦略
データ
アグロルーデンス那須工場の液化糖化装置および糖液濃縮装置
水素ガス対応アルミ溶解保持炉
070
エンジニアリング機能強化によるソリューションの高付加価値化
「V2 03 0」の 達成には、エンジニアリング 機能 の強化が 不可欠です。事業活動を 通じて持続可能な社会を実現するため、そして、多様化・複合化 するお客様 の課題解決
DAIICHI JITSUGYO CO., LTD.
02
Integrated Report 2026
マテリアリティ
に向けて、
「エンジニアリング 機能強化によるソリューションの高付加価値化」というマテリアリティを策定しました。今後は、顧客からの 信頼獲得 や、大型プロジェクト
指標(KPI)
取り組みテーマ
「V2030」への
バウンダリー
2025年度実績
指標の状況
単体
ー
管理技術者数の増加
単体
5名増加
プロジェクト審議体制の強化
単体
ー
グレーション機能を発展
ー
プロジェクト推進体制の
強化
させ、モノづくりを中心
所有資格・スキルマップ作成による技術職の適
材配置
●
技術職群目標管理制度の改定
●
プロジェクト管理ツールの運用開始
工事関連の研修を全社員対象に実施
(出席者:295名)
●
ー
としたお客様の現場で、
圧倒的な存在価値 が 認
められている。
●
●
安全な労働環境の提供
●
●
モノ売りへの執着による収益力の低下
DX対応遅延による競争力の低下
顧客ニーズへの対応力不足
●
ニーズを捉えた事業運営による顧客からの信頼獲得
●
独自性のあるサービスによる競合優位性確保
●
大型プロジェクトの受注増加による収益性向上
●
エンジニアリング機能を活用した新規事業創出
データ
人件費負担の増加
プロジェクト審議会開催
機会
リスク
●
●
サステナビリティ戦略
当社のミッションである、
プロジェクト管理ツール導入によ
る進捗管理精緻化
単体
事業戦略
技術系職群 の 適切な労働環境
整備
人と技術をつなぐインテ
取り組み状況
●
目指す姿
価値創造
の受注増加による収益性向上のために、エンジニアリング 本部が 中心となって、各事業とともに新 たな価値を創出していきます。
071
モノづくりの「全体最適化」を実現
他社 で 豊富 な 実績 を もつプ ロジェクトマネー
ジャー(PM)の採用を強化しました。これにより、
近年、第一実業 がお 客様 から求 められる役割 は「モノ売り」から「コト売り」へ、
大型案件や難度の高いプロジェクトの遂行力が向
大 きく広 が って い ま す 。 そ の 高 い 期待 に 応 える べく、豊富 な スキル を 有 する
上しています。商談の初期段階からPMが参画す
ることで、技術的視点から潜在的リスクを早期に
ンジニアリング 機能 に 特化した 体制 により 、新工場 の 立 ち上 げ を 含 む 大型案
洗い出し、大型プロジェクトを安全に完遂します。
件 や 複合的 な 課題 の 解決 など 、高付加価値 なソリュー ションの 創出 につ な げ
ています。
価値創造
各事業本部 の 技術者を 結集した「 エンジニアリング 本部」を 設置しました。エ
DAIICHI JITSUGYO CO., LTD.
プロジェクト遂行力
Integrated Report 2026
1
多様な知見と技術がエンジニアリング本部に結集
エンジニアリング本部
事業戦略
エンジニアリング本部の
強み
専門分野に
プロジェクトマネージャー
セールスエンジニア
まとめ上げる
精通した
機械の保全・修繕や
施工管理を得意とする
サイトマネージャー
全体人数:94 名 ※2026年3月末時点
グローバル(連結)でのエンジニア数は 495 名
提案力
3
対応力
「生産性向上」や「自動化・省人化」といっ
設備納入後も、保全・修理に特化した技
た顕在化されたニーズの一歩先にある、
術者による手厚いアフターサービスを提
お客様自身も気づいていない「本質的な
供します。機器の据付や組立はもちろん、
課題」を追求します。表面的な部分最適
稼働中の予防保全から不具合発生時の
にとどまらず、工場・ライン全体を最適
対応までトータルで支援。社会インフラ
化するソリューションを提供することで、
を支える現場をはじめ、お客様のモノづ
当社自身の競争優位性の確立や、新規ビ
くり現場の安定稼働に貢献し、継続的な
ジネスの創出にもつなげていきます。
信頼獲得につなげています。
データ
各事業セグメントとの連携
2
サステナビリティ戦略
大型プロジェクトを
072
働く環境の整備と多様な人材の確保・育成
コロナ禍における在宅勤務 の 導入をはじめ、社会情勢 によって働き方 が 多様化している一方、コミュニケーション不足や データ流出の可能性といった課題も浮上しまし
DAIICHI JITSUGYO CO., LTD.
03
Integrated Report 2026
マテリアリティ
た。当社で は、
「働く環境 の 整備と多様な人材の 確保・育成」というマテリアリティを策定し、誰もが 安心して働ける職場環境を目指します。具体的には、バックオフィ
取り組みテーマ
「V2030」への
目指す姿
境 と、多様性・包摂性 を
強みにつながり、創造的
進化を続けている。
生成 AI による業務削減時間※1
単体
21,771時間
バックオフィス業務の効率化
単体
ー
女性管理職比率向上※2
単体
2.7%
社員1名あたりの年間平均教育時
間の維持向上
単体
36.7時間
エンゲージメント調査偏差値向上
単体
60.5
多様な 働き方実現へ向け
たDXによる業務変革
多様な人材確保につな が
る女性活躍推進
働く環境の整備と働きがい
創出につながる人材育成
人材の流出・獲得困難による慢性的な人材不足
多様性受け入れなどによる社内摩擦発生
業務プロセスマップによる業務負荷可視化
AI OCRの導入による文書入力効率化
● 営業会議資料電子化
●
女性活躍推進宣言の制定
女性営業職員のキャリア面談
● 職群転換による中核人材候補の育成促進
●
●
●
●
部門長/海外駐在前研修の拡充
国内・海外人材育成委員会実施(6回)
月例給与水準のベースアップ
社長によるタウンミーティング実施
● 長時間労働の適正化
●
●
機会
●
多様な発想・思考を生かした事業運営の拡充
●
従業員エンゲージメントの向上
●
プロフェッショナル人材増加による労働生産性の向上
※1 当社が導入している生成AIプラットフォームが算出する業務削減時間
※2 管理職対象職群:単体の執行職、マネジメント職、プロフェッショナル職群(SP・IL)、技術職群(T1・TS)、及び左記職群に該当する海外子会社への出向者を含んでいます。
データ
●
生成AIナレッジ共有会実施(12回)
生成AIメルマガ配信(6回)
● 目標管理制度・契約書チェックへのAI活用
●
●
リスク
●
取り組み状況
●
で育まれた社員一人ひと
りの強みが、組織全体の
2025年度実績
指標の状況
サステナビリティ戦略
尊重 する企業風土 の 中
バウンダリー
事業戦略
誰もが安心して働ける環
指標(KPI)
価値創造
ス業務 の 効率化や女性管理職比率 の向上を 促進し、多様性や 包摂性を尊重 する企業風土を醸成 することで、一人ひとりの 働きがいにつなげ ていきます。
073
当社は、女性活躍を起点とした多様性の実現を通じて持続的な企業価値の向上を目指し、
組織全体の強みにつながる働きがいを創出するための一歩として、月例給与水準のベースアップ
U&Iプロジェクト※を推進しています。本プロジェクトには、マテリアリティの一つである「働く環
を実施しました。本改定は、2026年4月度給与より全社員を対象に適用しています。併せて、
境の整備と多様な人材の確保・育成」のオーナーである取締役に加え、女性の社外取締役が参画
2026年4月に入社した大学卒新入社員の初任給を、月額234,000円から月額286,000円に引き
しています。月1回開催する「U&I Council」の内容は適宜取締役会や経営層に報告を行い、経
上げました。
営戦略と連動させながら取り組みを加速させています。
これらの改定は、社員の生活基盤の安定に加え、中長期的なキャリア形成を支援し、挑戦意
欲やエンゲージメントの向上につなげることを目的としています。近年の経済環境の変化を踏ま
え、毎月の安定的な収入を高めることで、社員一人ひとりが能力を最大限に発揮できる環境を整
備し、人的資本の充実を通じた持続的な企業価値向上を目指します。
改定前
改定後
増額(引き上げ率)
234,000円
286,000円
+52,000円(22.2%)
大学院卒
266,000円
302,000円
+36,000円(13.5%)
女性営業社員を対象とした、働き方やキャリアパスに関するヒアリング
●
女性営業社員のキャリア継続施策を検討するU&I Councilの開催(月1回)
●
女性社員座談会・交流会の実施
●
仕事と育児の両立ハンドブックの製作
●
育休前・復帰前の面談シートや男性育休取得者向けアンケートの製作・運用
サステナビリティ戦略
大学卒
主な 取り組み
●
事業戦略
新卒初任給の改定
2025年下期からは女性営業職のキャリア継続を重点テーマに設定し各種取り組みを行いました。
価値創造
「V2030」の達成および当社のビジョンである「次世代型エンジニアリング商社」の実現に向け、
DAIICHI JITSUGYO CO., LTD.
給与水準および初任給を引き上げ
Integrated Report 2026
多様性を尊重し全社員の活躍を目指す
U&Iプロジェクト
データ
※全社員が活躍することによる企業価値向上を目的に、Universal(万人に共通する)とInclusive(全てを含み、排除
しない)の頭文字を取って、2024年7月にU&Iプロジェクトを立ち上げました。
074
社長の船渡は、専務在任時の2024年度に「タウンミーティング」を開始し、現在も重点施策の
少子高齢化が進み労働力不足が懸念される中、企業にとって業務の効率化・自動化は重要な
一つと位置付け、月1〜2回の頻度で実施しています。国内外グループ会社の社員を対象としたこ
「業務効率化プロジェクト」を推進し、営業バッ
課題となっています。当社では、DIC※主導のもと、
の取り組みでは、これまでに国内外で30セッションを開催し、延べ257名の社員と直接対話を重
クオフィス業務の効率化・デジタル化を進め、業務の見える化と生産性向上に取り組んでいます。
タウンミーティングを通じて、以下の実現を目指しています。
2024年度に営業アシスタントへのアンケートおよびインタビューを実施し、負荷の大きい業務
を抽出・特定しました。その結果明らかになった課題に対し、社内ポータルへのマニュアル集約、
●
社員との対話を通じた、現場課題の把握と対応
ナレッジ共有を目的とした社内SNSの整備、データ入力の自動化など、デジタル技術を活用した
●
経営方針や事業戦略への理解促進による、社員エンゲージメントの向上
業務効率化を推進しています。
●
全職種・複数部門からの社員参加を通じた、部門間連携の促進
●
透明性と信頼に基づく、良質な企業風土・文化の醸成
今後も、AIの活用を含め、さらなる業務効率化の実現に向けて取り組みを進めていきます。本
プロジェクトを通して、社員の成長機会を創出するとともに、働きがいと生産性の双方を高める
ことで、人的資本の最大化につなげていきます。
事業戦略
このように、経営層と現場をつなぐ双方向コミュニケーションの場を確保することで、組織の
価値創造
ねてきました。
DAIICHI JITSUGYO CO., LTD.
業務効率化プロジェクトを推進し働きがいと成長機会を創出
Integrated Report 2026
経営層と現場をつなぐコミュニケーション
社長タウンミーティング
一体感を高め、持続的な企業価値の向上につなげていきます。
目指す姿
持続的な企業価値向上
1.プロセス
効率・標準化
2.マニュアル
作成
生産性の高い業務仕組み
3.ナレッジ
共有
4.デジタル化
(自動・AI化)
データ
業務実態分析→課題箇所特定
サステナビリティ戦略
社員の活躍(人的資本最大化)
早期戦力化/長期キャリア成長/能力発揮
※デジタルイノベーションセンター
インドネシアにおけるタウンミーティングの様子
075
当社グループは、経営理念「人をつなぎ、技術をつなぎ、世界を豊かに」の実現に向け、市場の
多様なニーズに対応できる、しなやかさと強さを兼ね備えた自律型人材の育成を経営課題と位置
付けております。
「次世代型エンジニアリング商社」として持続的な企業価値を向上させるには、
先進的技術と高品位なサービスを付加価値として提案し、市場競争力を強化する人材基盤の構築
が不可欠であります。当社グループが求める人材は、主体的に思考し、周囲との協働を通じて価
値創造を牽引する人材であります。こうした人材の育成・確保は中長期的な競争力の源泉となり、
材戦略を推進しております。
●
人材育成方針
●
社内環境整備方針
「環境の変化に対応できる、しなやかさと強さを兼ね備えた人材の育成と組織形成」
「高度専門性」
「自律」
「多様性」
「健康経営」
を軸に
「採用」
「研修・教育」
「制度」
の深化・
充実を図る
ることで、顧客や市場ニーズの多面的な理解が深まり、競争優位性を生み出す「稼ぐ力」となりま
す。さらに、多様な人材との協働を通じて、従業員は異なる視点や経験から学び、自らの成長機
会を得られます。こうした環境において、従業員の心身の健康を支援し、一人ひとりが心身とも
に充実した状態で働くことができる職場環境の整備が重要であります。多様性推進と健康経営
を通じて、従業員が自己成長を実感しながら、心身ともに良好な状態で能力を発揮できる環境
を創出してまいります。
施策
期待される効果
・女性・外国籍人材採用強化
・職群転換制度の運用促進・多様性推進による競争
優位性向上
・採用活動の多角化
人材戦略
当社は社員一人ひとりを「自ら考え、周囲に働きかけながら、実現に結びつける」ビジネスパー
・社内公募制度の新設
な企業価値向上との両立を目指します。人的資本経営による社員の成長を会社の成長エンジン
とするため、以下の3つを柱とした人材戦略を展開しております。
・有給休暇取得促進
新入社員に対しては、設備納入時に必要となる安全教育をはじめとする基礎的な教育を実施
し、早期段階から実務的な知識・スキルを習得させております。一方、経験者採用においては高
・エンゲージメント調査
・健康診断 の 実施とフォ
ロー
・労働意欲 の 高まりや
健康増進 による生産
性と創造性向上
度な資格保有者の採用を重点的に進め、組織に必要な高度な専門性を確保してまいります。
施策
期待される効果
・階層別集団研修の実施
・Eラーニング教育支援
・公的資格取得支援、手当支給
・入社5年以内人材への
ビジネス基礎の習得
・企業理念、歴史の共有
関連指標
社員1人当たりの教育費
社員1人当たりの
平均研修時間
2025年3月期 2026年3月期
対象
実績
実績
86千円
51.0%
外国籍社員比率
2.4%
2.2%
管理職に占める
女性社員の割合
2.1%
2.7%
16.2時間
15.8時間
有給休暇取得率
67.8%
66.7%
エンゲージメント調査
総合満足度
76.2%
76.5%
健康診断受診率
84.9%
85.0%
ストレスチェック受検率
84.6%
86.9%
2件
10件
労働災害件数
単体・
連結
単体
88千円
36.7時間単体
89.2%
92.8%
・職群別研修
・ビジネス応用力の習得
・スキル向上Eラーニング教育支援・中堅人材の自立性醸成
・新卒理系、中途採用活動の多
角化
・次世代型エンジニア
・技術系職群の等級見直し
リング 商社実現に向
けた高度専門性強化
・工事安全衛生教育の充実
・技術系公的資格拡充
職長教育受講者数
46人
56人
全社員に占める
技術系職群の割合
8.2%
7.8%
③幹部候補の経営力向上
複数の事業領域や職能における実践経験を計画的に積ませ、国内外の関係会社への配置を通
じて、多角的な視点とグローバルな経営感覚を備えた幹部候補の育成を推進しております。
9,463時間 10,588時間
施策
単体
期待される効果
・国内外関係会社経営機
・経営幹部、幹部候補の
会創出
リスク管理能力向上
・多様化実現 のため の 異
・経営品質の継続的深化
動機会創出
関連指標
海外駐在経験者比率
2025年3月期 2026年3月期
対象
実績
実績
21.9%
25.1%
データ
37.5時間
階層別集合研修受講率
職群別研修延べ時間
50.9%
サステナビリティ戦略
・長時間労働適正化
①当社グループ事業基礎体力の向上
中途入社者比率
社員一月当たりの平均
残業時間
ソン志向を備えた人材とするべく、長期的な視点で育成することで、人的資本への投資と持続的
2025年3月期 2026年3月期
対象
実績
実績
事業戦略
・職群等級の 給与体系見・多様な人材との共働に
よる成長機会の創造
直し
関連指標
価値創造
持続的な企業価値の向上に直結するものと考えております。そこで、以下の2つの方針を掲げ、人
当社グループは7つの事業領域でグローバルにさまざまな市場・業界でビジネスを推進してい
ることから、顧客や仕入先も多岐にわたっております。多様な背景を持つ人材が組織内で活躍す
DAIICHI JITSUGYO CO., LTD.
② 従業員の労働意欲や成長意欲の向上
Integrated Report 2026
人的資本の強化による持続的な企業価値の向上
単体
076
エンジニアの就業・成長環境の整備
・女性のこれまで以上の活躍に重点を置き、多様な働き方を実
現し、働きがいのある環境の整備
グループ長・部長代理クラスへの残業代支給
・スキルマップを実装し適切なジョブへの任命や長期育成
・プレーヤー色の強いミドルマネジメント層の役割を再整理し、
残業代を支給
・海外長期プロジェクトの支援強化
・従来の二者択一的な選択肢から、ライフステージに合わせて
柔軟に働き方を選択できる制度に変更
外国籍社員
・最前線で 現場を牽引する社員のモチベーションの向上を
図る
DAIICHI JITSUGYO CO., LTD.
一般職、総合職の統合
Integrated Report 2026
人的資本強化へ向けての取り組み
部門長研修及び昇格試験への360度評価導入
・評価の公平性の確保
・ガバナンス、
行動指針、経営理念等を浸透させるための教育
・対話を重視した組織づくり
価値創造
・第一実業の役割等級制度をモデルに、地域性も重視した人
事制度を実装中
・自らの特性を把握し改善につなげる
経営戦略に基づいた人的投資と期待効果
人的資本経営を資本効率向上による企業価値向上へ
期待される効果
人的投資
具体策
短入社年次者への集合研修実施
DJK WAY基礎教育
ビジネス基礎の習得
費用補助による学習意欲啓発
共通教育:階層別集合研修
企業理念・歴史の共有
公的資格取得支援・手当支給
個別教育:Eラーニング
For MID-LEVEL
中堅社員への職群別研修実施
キャリアデザイン対応教育
ビジネス応用力の習得
費用補助による学習意欲啓発
共通教育:職群別集合研修
中堅人材の自律性醸成
公的資格取得支援・手当支給
個別教育:Eラーニング
新卒・中途採用活動の多角化
新卒理系・エンジニア採用強化
工事安全衛生教育の充実
作業責任者・工事責任者教育
公的資格取得支援・手当支給
支援対象技術系公的資格の拡充
新卒中途採用活動の多角化
女性・外国籍人材採用強化
職群等級の給与体系見直し
職群転換制度の運用促進
次世代型エンジニアリング商社
→高度専門性強化
多様性推進
→異文化理解力
→世界市場で「稼ぐ力」に
経営品質の継続的深化
再投資・再生産
当社事業基礎体力向上
ROE
PBR・PER
向上
向上
売上高成長率・
売上高総利益率向上
理系・中途採用比率
各種教育参加比率
女性中核人材比率
男女間賃金格差
外国籍採用比率
エンゲージメント調査
エンゲージメント調査結果
中堅層からの有望人材の選抜
事業本部・管理本部相互経験
スキルマトリックスに基づく
多能化実現の為の異動機会創出
国内外関連会社経営機会創出
経営幹部候補のキャリア管理
従業員の労働意欲成長意欲向上
B/S経営浸透
売上高と
販売管理費双方の増加
データ
リスク管理能力向上
Eラーニング受講率
有給休暇取得率
グループ保険料の費用負担
経営幹部・幹部候補の
各種集合研修受講率
有給休暇取得促進
従業員の健康増進
企業価値
Eラーニング受講率
部門別残業時間
各種の働き方改革施策推進
資本効率
各種集合研修受講率
残業時間適正化
従業員エンゲージメント向上
財務影響
経営戦略
サステナビリティ戦略
For NEWCOMER
関連指標
事業戦略
資本コストを超える収益性と成長による企業価値の向上
投下資本効率向上
成長持続
077
当社は成長戦略「V2030」達成に向け 「
“ 一緒に仕事をしてみたい」そう思える人材のそろった
当社では、全事業本部、エンジニアリング本部および管理系本部から選出された委員による人
会社”を人材育成の目指すべき姿として設定し、その人物像を下記のとおり定義し、各種の人事
材育成委員会、ならびに海外5エリアと連携した海外人材育成委員会を定期的に開催しています。
施策に反映させています。
委員会には代表取締役も参加し、経営戦略に基づく育成方針を協議しています。得られた議論
を踏まえ、教育研修や昇格試験など、幅広い育成体系を運用し、社員一人ひとりの成長段階や職
RESILIENCE
ビジネス上の体験を、自己変革の機会とすることができる、柔軟な思考
FAITH
仕事をしていく上で、共に働くことに敬意を持ち、相互に信頼を築くことができる
PROFESSION
全てのステークホルダーに対する貢献
DAIICHI JITSUGYO CO., LTD.
人材育成委員会
Integrated Report 2026
目指すべき人材像
務特性に応じた個別対応型の学びを提供しています。
また、自己申告制度や社内公募制度を通じて自律的なキャリア形成を支援するとともに、異な
実現しています。
前向きな姿勢で「人をつなぎ」、精通した知識で「技術をつなぎ」、献身的な行動により「世界を豊かに」できる
人材を育成してまいります。
価値創造
る経験や専門性を持つ人材が活躍できる環境整備を進め、多様な人材の育成と組織力の強化を
人材育成プログラム
P
職群
T
職群
OJT
OFF-JT
専門領域
チャレンジ・クロス経験
拡大
現場経験
他
上場企業経営
経営層
経営戦略・事業戦略
サステナビリティ戦略
資格手当・報奨金
メール
データ
経営理念会
・社文化等理解
異文化コミュニケーション
ビジネス
E
英会話英
・語学習アプリ
安全衛生管理
プロジェクト管理
Auto CAD
機械電
・気図
・面基礎
専門業務知識スキル
当社基礎知識
汎用的ビジネススキル
取引リスク管理
組織マネジメント
海外人事法
・務会
・計
新事業投資
ハラスメント
新入社員
フォロワーシップ
新S1
2〜5年目
新人OJT
後輩支援
新G長
交渉基礎
スタッフ職群
他社出向
上司先輩
社内公募制
現場経験
社内横断プロジェクト
T2
本部内異動
目標管理
PR
新部門長
アサーティブコミュニケーション
T1
部下育成
SP
本部間異動
TS
国内外グループ会社出向
IL
部門長
グループ長/
部長代理
外国語
エンジニアリング
対課題力
対人力
対自分力
事業戦略
M職群
078
2025年
3月期
2026年
3月期
従業員数
558名
591名
623名
661名
725名
男性
421名
441名
465名
493名
544名
女性
137名
150名
158名
168名
181名
12.6年
12.7年
11.3年
11.3年
11.2年
男性
12.9年
13.4年
11.6年
11.6年
11.5年
女性
11.5年
10.3年
10.4年
10.3年
10.2年
有給休暇取得率※1
56.8%
59.7%
68%
67.8%
66.7%
育児休業利用者数
10名
15名
10名
14名
10名
時短勤務利用者数
6名
12名
14名
14名
13名
育児休業復職率
83.3%
85.7%
100%
80%
85.7%
介護休業利用者数
0名
0名
1名
1名
0名
3.9%
4.3%
4.0%
2.9%
2.7%
5.4時間
9.3時間
16.1時間
37.5時間
36.7時間
人材育成、働く環境改善を戦略的に推進し、人的資本の最大化とサステナブルな企業成長を
実現するため、全従業員を対象として調査を実施しています。
調査結果の 概要
仕事に対するエンゲージメントは高く、
やりがいをもって積極的に仕事に取り組めている状態です。
仕事内容の領域では、
「意義と責任」
「仕事の多様性」に加え「成長の実感」の肯定割合が増加
しており、当社の事業に対する理解が深まっています。職場仲間の領域では、今年も上司・部下
の関係については高い評価となっており、
「経営者(社員との関係性)」については肯定割合が増
加しています。待遇の領域では、
「仕事の負荷」のみ昨年に引き続き肯定割合が相対的に低い結
果となっております。
項目
2024年3月期
2025年3月期
2026年3月期
調査対象人数
602人
636人
686人
回答率
84.9%
91.8%
94.0%
エンゲージメント
69.2%
76.2%
76.5%
全体満足
65.8%
66.8%
66.4%
働きがい
65.3%
66.9%
67.7%
組織風土
48.5%
51.8%
53.1%
人間関係
54.3%
58.7%
60.0%
待遇環境
52.3%
57.3%
56.7%
肯定的回答率
今後 の対応
経営者(社員との関係性)への肯定割合の向上については、2025年3月期に開始した「社長タウ
ンミーティング」の継続的な実施による成果と認識しており、今後もこの取り組みを推進してまい
待遇の領域については、従業員の負担軽減および組織の競争力強化を目的として、2026年4月
に全社員を対象とした月例給与の引上げを実施しました。これにより採用競争力の向上および採
離職率
社員1人当たり
平均研修時間※2
※1 有給休暇取得率=有給休暇取得日数÷有給休暇付与日数×100
※2 2024年3月期までは人事部主催の教育時間、2025年3月期からは人事部主催の教育に加え各事業部での教育時間
を含む。
人権の尊重
当社の事業活動において、従業員はもちろん、取引先の従業員などを含む、サプライチェーン全
体で人権を尊重していくことが、
「世界を豊かに」という当社の経営理念を実現することへの礎とな
ると考え、
「第一実業グループ人権方針」を策定しています。
第一実業グループ人権方針
https://www.djk.co.jp/sustainability/society/human̲rights̲policy/
データ
ります。
平均勤続年数
サステナビリティ戦略
2024年
3月期
事業戦略
2023年
3月期
項目
価値創造
2022年
3月期
エンゲージメント調査の目的
DAIICHI JITSUGYO CO., LTD.
人材関連の主要指標(単体)
Integrated Report 2026
従業員エンゲージメント
用活動の迅速化を図るほか、労務管理体制の継続的な整備を通じて、働き方環境の一層の改善に
取り組んでまいります。
079
本座談会 では、新任 の宮地氏を迎 え、それぞれ の専門知識をもつ3 名の 社外取締役 が集結。
挑戦を加速させるための人的資本経営について、議論を交わしました。
事業戦略
第一実業の組織風土には
価値創造
第一実業 の競争優位性の 源泉であり、
「MT2 027」の 推進力ともなるのが「人」です。
DAIICHI JITSUGYO CO., LTD.
組織風土の強みを生かし、
人的資本を核として次の変革へ。
Integrated Report 2026
社外取締役座談会
どのような強みや課題がありますか?
社外取締役に就任したばかりですが、当社は
「社長によるタウンミーティング」や「360度評価」など、
組織内の対話を促す取り組みが行われていることから、
風通しの良い企業という印象を抱いています。実際に先
日、部門長が集まる会議に初めて出席し、皆さんが部門
社外取締役
社外取締役
社外取締役
中山和夫
宮地克明
山田奈美香
総合商社やリース会社において、
1985年、
日産化学株式会社入社。
2018年に弁護士登録し、以来、
機械・プラント業界、食料業界、
研究所長や常務執行役員経営企
企業法務やコーポレートガバナン
ならなくなったときも、関係者が一丸となって、一つの目
M&Aアドバイザリー、投資ファ
画部長を歴任した。2021年、日
ス、一般民事における紛争解決、
標に向けて推進力をもって対応できることが当社の強み
ンド、コーポレート部門を経験。
本肥糧株式会社代表取締役。
第三者委員会対応や危機管理対
だと思います。こういった強みは、社員それぞれの強い
海外事業にも精通する。
2026年6月、当社の社外取締役
応など、コンプライアンス体制の
責任感や誠実な人間力によって下支えされているものと
に就任。
構築に尽力。
サステナビリティ戦略
宮地
の垣根を越えて意見を出し合う様子を拝見できました。
山田
新規のプロジェクトが発足したときも、長期
データ
にわたり継続してきたプロジェクトを収束させなければ
080
中山
現場重視の非常に生真面目なカルチャーであ
る一方で、ワークライフバランスを崩しやすくなるといっ
に同行する、あるいは1、2年営業に異動し業務を経験す
たデメリットもあることには注意が必要です。
ることで、チームとしての一体感が一層厚くなります。さ
らに副次的に本人の意欲や性格を把握する機会にもな
安心感があります。ただ、現場で働いている方々は責任
認識されており、部門長会議でも部門をまたいでの事例
り、
その後のキャリア形成にも生かされていました。一方、
感が強いあまり、何でも「自分でなんとかしなきゃ」と思っ
やノウハウの共有が取り組み案として挙がっていました。
適性などのミスマッチから退職してしまうケースも残念な
てしまう面もあります。これは現場重視で堅実に事業を
こうした議論の加速により、今後、現場でも横のつなが
がら発生していました。
進めてきたことの裏返しでもあるのですが、何か問題が
りを生かして組織力が強化されることを期待しています。
宮地
コミュニケーションを取りながら、社員一人ひとりに適
起きた際には、他部門や社外パートナーに助けを求める
した働き方やキャリアプランの形成を支援することが大
ことも大切です。
変重要です。またその際、マネジメントを担う中間管理
山田
たしかに、スキルの高い人材が多いからこそ、
社会からの要求が高度化する中、
「MT2027」の目標達成に必要な
お客様から頼られることは、仕事のやりがいを感じられ
人的資本経営とは?
職に過度な負担がかからないよう、経営陣が体制や仕組
みをしっかりと構築して支えなければなりません。
中山
キャリアプランの設計にあたっては、社員の
10年後や20年後の幸せを考える視点が大切だと考えてい
ます。当社では「モノ売り」から「コト売り」へと提供価値
バル展開が掲げられていますが、これらを実現するには、
を拡大するなど事業が複雑化しており、また専門性の高
従来の技術力に加えて、投資における判断力や海外市場
い人材の必要性が高まっていることもあり、キャリア採用
開拓力、投資に関する知見、新事業創出力など、新しい
の割合が半数以上に達しました。しかし、前職で培った
能力をもつ人材が必要となります。一方で、やはり個人
知識やスキルを発揮してほしいからといって、その分野だ
の業務負担の増加は懸念すべきで、単に採用数を増やす
けに限ったキャリアプランを歩ませ続けるのが本人の幸せ
だけでなく、労働時間や職場環境の整備を徹底し、採用
とは限りません。現在はニーズが高い分野であっても、数
後の人材流出を防ぐ必要があります。
年後には会社の事業ポートフォリオが変わることもあるわ
宮地
社会的なニーズやガバナンスの高度化により、
識が幅広くなっています。私の古巣である日産化学では、
けです。そのため中途・新卒を問わずに、開かれたキャリ
アに挑戦する機会を提供する必要があります。
山田
「MT2027」で掲げられている施策の推進に向
会社の仕組みや事業全体への理解を促すため、他部門
けて、社員のさまざまな挑戦を促す環境を整えることも
の業務を経験してもらうべく、人材を流動化する取り組
重要です。具体的には、成果だけでなく新しい提案や取
みがなされていました。例えば研究職員が営業に積極的
り組みを行った意欲や姿勢そのものを評価する仕組みを
データ
当社に限らず、現場で 働く人材に求められるスキル、知
サステナビリティ戦略
「MT2027」では、事業投資の推進やグロー
山田
事業戦略
業務の属人化が起きやすくなっているのかもしれません。
価値創造
縦割り感や属人化の解消は全社的に課題と
り、地に足の着いたビジネスの遂行には大変適しており
DAIICHI JITSUGYO CO., LTD.
思います。
Integrated Report 2026
社外取締役座談会
081
な人事評価制度を構築するべきだと考えます。また、そ
を促進するために欠かせないプロセスだというのが私の
れらの成功事例や失敗からの学びを知識・経験則として
考えです。企業活動における挑戦とはつまり、会社のさ
社内で共有することも有用です。失敗から得られた教訓
まざまな経営資本を使って事業や投資を行い、やりたい
を次の成功につなげる意識を組織全体で認識すること
ことを実現する、ということです。事業や投資を進めて
で、挑戦を恐れない文化が醸成されると考えます。
いく中で、想定されるリスクや社内ルールを理解し、成功
会社としては、ただ大きな損害が発生するだ
への道筋をきちんと描きながら、非営業を含めた会社全
けの失敗は当然避けたいものです。失敗や損失を次の
体のリソースを堂々と活用させてもらう、そのために必要
成功に生かし、必要なコストだったと思えるようにするこ
な仕組みが内部統制であり、ひいてはガバナンスなのだ
とが重要です。一方でガバナンスを重んじると「複雑な
と捉えています。
中山
という現場からの意見も往々にしてあります。しかし、内
宮地
私が長らく携わってきた研究開発の現場にお
事業戦略
手続きを要することで意思決定が遅くなるのではないか」
価値創造
部統制上必要な手続きを確実に行うことは、むしろ挑戦
DAIICHI JITSUGYO CO., LTD.
導入し、短期的な失敗が大きなマイナスにならないよう
Integrated Report 2026
社外取締役座談会
いては「新しいことに挑戦したものの、期待する成果が得
られなかった」ということが当たり前のようにあります。
会社承認を経てリスクも織り込んだ上で実行したもので
た教訓を共有し将来に生かすことがとても重要です。当
進」を掲げています。女性活躍が多様性確保の全てでは
社でも「挑戦を恐れない」
「失敗を共有する」という認識
ありませんが、最初の取り組みとして、女性管理職比率
をもって取り組み、
「MT2027」の目標実現につなげてほ
の向上をKPIとして設定しています。しかし当社では、20
しいところです。
代後半から40代にかけて生じるライフイベントに対し、
業務の負荷から勤務を継続することが難しく、退職して
多様な人材の確保に向けた
しまう女性営業職の方が多いため、女性の管理職が増え
にくい状況があります。業務負荷が重いことは、女性営
業職の方に限った問題ではありませんが、この課題を解
決しなければ、今後グローバル展開を拡大する上で、海
山田
当社はマテリアリティの一つである「働く環境
の整備と多様な人材の確保・育成」に基づく取り組みテー
マの一つとして「多様な人材確保につながる女性活躍推
データ
女性活躍推進の進捗状況はいかがですか?
サステナビリティ戦略
すので、挑戦の結果をマイナスと考えず、そこから得られ
外の取引先からの信頼を損ねることにもなりかねません。
中山
「商社の営業は労働環境が厳しいから、女性に
は向かない」という反論がよくありますが、この考えは古
082
制度設計、内部通報制度の整備・運用などのアドバイスを
られるのであれば、それは社員の性別を問わず是正すべ
す。例えば、人事の諸制度も、当社は東証プライム上場
通じて、より良い組織運営をサポートしていきます。社会
き労働問題ですよね。実際に海外の取引先では多くの女
企業の中では後れをとっている場合もあるという認識で
情勢が複雑化する中でも、当社が「人」を核にした成長を
性トップが活躍している状況があり、それは当社でも再現
す。社内ではさまざまな議論をし、制度を改善して進歩し
遂げられるよう、努力を重ねてまいります。
できるはずです。経営的な視点で考えても、女性人材を
たつもりでも、社会から見ればまだ不十分という場合には
採用や昇進の対象外にするのは、企業にとって大きな損
客観的な評価を伝え続けることが、社外取締役の役割で
任命していただきました。
「産業機械メーカー」と「モノづ
失になります。少子高齢化によって働き手が減少する中、
あると捉えています。
くり企業」の双方からの視点を生かして当社に貢献したい
宮地
製造業に長年携わった経験から社外取締役に
と考えています。当社は「MT2027」と「V2030」において、
社員の可能性を引き出すものか」
「リスクが偏在していな
ビジネスモデルの大きな転換を目指しています。その推
こうした現状を変えて女性活躍を推進するた
いか」といった建設的な疑問を第三者的な立場から投げ
進力となる人材活用の方策が実効性をもって実施されて
め、社内外の取締役をメンバーの一部とする委員会を
かけ続けたいと思います。また、法律の専門家としての知
いるのかを確認し、さらなる課題に対する解決策について
2024年に立ち上げました。従来型の画一的な就業環境
見に基づき、ハラスメント防止や職場環境づくりに関する
も、妥当性を議論していきます。
ことは、経営陣に突きつけられている喫緊の課題です。
山田
ではなく、出産・育児・介護といったライフステージの変
山田
事業戦略
社内の慣例にとらわれず「この施策は本当に
女性を含む多様な人材が働き続けられる環境を整備する
価値創造
らの視線で執行に対する指摘をしていきたいと考えていま
DAIICHI JITSUGYO CO., LTD.
典的な刷り込みです。もし、極端に厳しい働き方を強い
Integrated Report 2026
社外取締役座談会
化に合わせて働き方を選択できる制度の構築を目指して
談を実施し、意見や要望をヒアリングしました。今後はそ
の内容を踏まえて対応策を議論するほか、育児を支援す
る制度やサービスの拡充にも取り組む予定です。こういっ
たプロジェクトを形骸化させることなく、改善を重ねなが
ら具体的な施策につなげようとしている点には、当社の推
サステナビリティ戦略
います。2026年3月期には、女性営業職へのキャリア面
進力という強みが生きていると感じます。
データ
今後、社外取締役としてご自身の
役割をどのように果たしていきますか?
中山
経営全般について、社外、すなわち世の中か
083
気候変動への取り組みとサプライチェーンマネジメント
気候変動により、地球温暖化や 資源の 枯渇 などが深刻化しており、産業全体や 国際経済 にも大きな 損失 をもたらす 可能性 があります。そのため 企業としては、持続的
DAIICHI JITSUGYO CO., LTD.
04
Integrated Report 2026
マテリアリティ
な社会の実現に貢献 する長期的な 視点で の対策 が 求められています。こうした背景を踏まえ、
「気候変動への取り組みとサプライチェーンマネジメント」をマテリアリティ
取り組みテーマ
「V2030」への
目指す姿
2025年度実績
指標の状況
取り組み状況
カーボンニュートラル給油カードの使用による
環境負荷低減の自主的な取り組み
GHG排出量削減
Scope1及び2 排出量の削減
連結
排出量基準
年度比10%増
(1,780.47t
※
-CO2)
気候関連のリスク
機会分析
シナリオ分析の事業本部
カバー率
連結
28.6%
●
自動車事業本部シナリオ分析実施
サプライヤー
エンゲージメント
サステナビリティ調達に関する
ポリシーの制定
連結
ー
●
第一実業グループサプライヤー行動指針制定
●
●
九州支店の環境価値付電力購入証憑取得によ
るScope2排出量削減
解決 に 向 け た 取り組 み
を、サプライチェーン全
体との協業により推進し
ている。
●
カーボンプライシング導入等に伴う費用増加
●
環境負荷低減につながる製品市場の拡大
●
自然災害の増加による事業継続上の課題
●
ステークホルダーからの信頼獲得
●
取り組み不足によるサプライチェーンからの除外
●
レジリエンスの向上
データ
機会
リスク
サステナビリティ戦略
るさまざまな社会課題の
バウンダリー
事業戦略
地球温暖化をはじめとす
指標(KPI)
価値創造
として策定し、サプライヤーと協力しな がら気候関連 のリスクおよび 機会の 分析 や、GHG 排出量削減に取り組 んでいきます。
084
※2024年度のGHG排出量を記載
当社グループでは、2030年度までにScope1およびScope2の温室効果ガス排出量を2020年
度比で46%削減し、2050年度までにネットゼロを達成することを目標としています。目標達成
サプライヤーをはじめとする取引先との信頼に基づくパートナーシップを一層強化するため、
2026年2月に「第一実業グループサプライヤー行動指針」を制定しました。
本指針では、倫理・法令遵守、人権の尊重、環境保全など、サステナビリティに関する重要事
階的な導入や、非化石証書の活用により、Scope2マーケット基準におけるGHG排出量の削減を
項を定め、当社グループとサプライヤーが共有すべき価値観と行動基準を明示しています。グロー
進めています。東京本社、大阪支社、名古屋支社では2021年度から再生可能エネルギー由来の
バルなサプライヤーネットワークにおいて本指針の内容を正確に理解し実践していただくため、
電力メニューを導入しており、2022年度にはScope2マーケット基準におけるGHG排出量を実
日本語版だけでなく、英語、中国語、スペイン語を含む全4言語分を作成しました。
質ゼロとしました。九州支店では2025年度から、通常電力の使用に対して使用電力量に相当す
また、実効性を高めるため、本指針に基づくサステナビリティ調査票を作成し、2026年度は国
る非化石証書を別途調達し、Scope2マーケット基準における排出量の実質的な低減を図ってい
内主要仕入先100社を対象に調査を実施しました。今後は、調査結果を人権デューデリジェンス
ます。
にも活用し、人権リスクアセスメントおよび課題の把握を進める予定です。調査結果については、
コーポレートサイトでの開示を予定しています。当社グループは、今後もサプライチェーン全体に
のドイツ本社においても再生可能エネルギー由来の電力メニューを導入し、Scope2マーケット
おける人権を含む事業活動上の負の影響の特定と、防止・軽減に向けた取り組みを継続的に推
基準におけるGHG排出量を実質ゼロとしました。
進してまいります。
今後も国内外のグループ拠点において、拠点ごとの状況に応じた再生可能エネルギー由来電
力の導入や環境価値の活用など、2050年度ネットゼロ目標の達成に向けた取り組みを推進して
第一実業グループサプライヤー行動指針の項目
- 倫理観の保持および法令の遵守
- 人権の尊重
電力使用量と再生可能エネルギー比率(国内単体)
- 環境への対応
500,000
100
400,000
80
- 安全・品質
300,000
60
- 公正な企業活動
200,000
40
- 情報セキュリティ
100,000
20
0
0
2021年度
2022年度
再生可能エネルギー (kWh)
2023年度
2024年度
再生可能エネルギー比率(%)
2025年度
-
労働安全衛生
-
地域社会参画と発展への貢献
データ
2020年度
化石由来(kWh)
サステナビリティ戦略
まいります。
事業戦略
こうした取り組みは海外グループ会社にも拡大しています。2025年度からは、DJK EUROPE
価値創造
に向け、国内拠点では省エネルギー施策に加え、再生可能エネルギー由来の電力メニューの段
DAIICHI JITSUGYO CO., LTD.
サプライヤーとともに築く持続可能なサプライチェーン
第一実業グループサプライヤー行動指針の制定と調査の実施
Integrated Report 2026
GHG排出量削減の取り組み
Scope2マーケット基準のネットゼロ拠点拡大
- 情報開示
第一実業グループサプライヤー行動指針
089ページ
085
当社は、2022年に「気候関連財務情報開示タスクフォースTCFD」の最終報告書TCFD提言へ
当社グループは、サステナビリティ基本方針に基づき、持続可能で豊かな世界の実現に貢献し
の賛同を表明いたしました。以降当社は、TCFD提言の考え方に基づき、気候変動が当社の事業
てまいります。
経営理念の「人をつなぎ、技術をつなぎ、世界を豊かに」を具現化するため、エンジニアリング
機能を生かした事業活動により、お客様の環境課題を解決し、ステークホルダーの皆様から常
に必要とされる存在であり続けます。
気候変動に関する基本的な考え方
近年、世界各地において、異常気象が引き起こす災害等が発生し、気候変動に対する危機感
が高まっております。併せて世界的な脱炭素化の流れが加速し、日本政府も2050年にカーボン
ニュートラルの達成を目指すことを宣言いたしました。
このような情勢の中、当社グループは、経営理念の「人をつなぎ、技術をつなぎ、世界を豊かに」
を具現化するため、独自のエンジニアリング機能を生かした事業活動により、お客様の環境課題
生物多様性、森林・水等の限りある資源の重要性を認識し、事業活動への展開をはかります。
を解決し、ステークホルダーの皆様から常に必要とされる存在であり続けることを目指しており
事業活動を行う上で環境に関する国内外の法規、規則、協定等を遵守します。
ます。地球環境の保全、改善に資する商品・サービスを提供することにより、事業活動を通じて
当社グループで働くすべての役職員が環境経営の理解、意識の向上を行い、これを継続的な
教育を通じ広く啓蒙してまいります。
気候変動の緩和と適応に向け取り組んでまいります。
環境マネジメントシステム(EMS ※ )推進体制 ※Environmental Management System
当社は、2004年1月よりISO14001に基づく、環境マネジメントシステム(EMS)を運用し、環
境負荷低減を組織的に推進しています。
針に基づきEMS推進委員会を中心に、PDCAサイクルにより継続的な改善に取り組んでいます。こ
うした仕組みを通じて、気候変動についてもリスクと機会の両面から取り組みを加速させています。
トップ マネジメント 代表取締役社長執行役員
すかを把握するべく、4つの開示要素である
「ガバナンス」
「戦略」
「リスク管理」
「指標と目標」
に沿っ
て情報開示することが推奨されております。
当社は、これらの項目に基づいた情報開示の拡充に努めていくとともに、気候変動への取り組
みが社会の持続的発展と当社の中長期的な企業価値の向上に資するものと強く認識し、サステ
ガバナンス
当社は、2004年1月よりISO14001に基づく、環境マネジメントシステム(EMS)を運用し、気
EMS推進委員会
EMS推進委員長総務部長
TCFD提言は、気候変動に伴うリスクと機会が、財務を含む会社経営にどのような影響を及ぼ
ナビリティへの取り組みをより一層推進してまいります。
EMS内部監査員
環境管理責任者総務本部長
TCFD提言が 推奨する情報開示項目
サステナビリティ戦略
トップマネジメントは代表取締役社長執行役員、環境管理責任者は総務本部長と定め、環境方
TCFDレポート
事業戦略
地球環境の保全、改善に資する商品の取り扱いを行い、事業活動を通じ、気候変動の緩和に
貢献してまいります。
価値創造
本環境方針のもとに環境マネジメントシステム(EMS)を構築し、その運用と継続的改善に努
めてまいります。
活動に与えるリスクおよび機会を抽出しTCFD提言に基づく情報開示に努めています。
DAIICHI JITSUGYO CO., LTD.
世界の産業の価値あるパートナーとして、創造的な地球社会の実現に貢献する
Integrated Report 2026
TCFD提言に基づく開示について
環境方針
EMS推進委員会事務局総務部
当社ではEMS委員を各本部および支社・支店に複数名配置し、継続的なEMS推進を各本部に
て実施することで、全社活動を促進させています。
長執行役員、環境管理責任者は総務本部長と定め、環境方針に基づきEMS推進委員会を中心に、
PDCAサイクルにより継続的な改善に取り組んでおります。
また、当社は持続的な成長を確保することを目的として、2022年4月にサステナビリティ推進
データ
各本部・支社・支店 E M S 推進委員
候変動を含む環境負荷低減を組織的に推進しております。トップマネジメントは代表取締役社
委員会(現サステナビリティ委員会)を設置し、気候変動を含むサステナビリティに関する事項を
審議することとしております。同委員会は、代表取締役社長執行役員を委員長とし、サステナビ
また、運用管理においては、環境に直接的に関係する項目に限らず、労働安全の管理や力量教育
リティ推進責任者である上席執行役員のもと、社内の取り組みを定期的にモニタリングし、今後
の促進、事業継続対策等の項目を入れることで、EMS運用による社員の意識向上を図っています。
の取り組みに対する審議・検討を行っております。審議内容については取締役会に報告され、取
086
そして、2023年4月にサステナビリティ推進部を設置し、EMS運用をさらに強化するとともに、
リスク・機会の種類
サステナビリティ推進責任者のもと同委員会の事務局として当社グループ全体における取り組み
を加速させております。
移行
リスク
戦略
当社グループは、
「気候変動への取り組みとサプライチェーンマネジメント」をマテリアリティの
掲げております。
また、自社の温室効果ガス(GHG)削減目標として、Scope1及びScope2の削減率を定めると
評判
時間軸 ※
カーボンプライシングの導入
営業活動にかかるコストの増加
中期
小
小
各国の炭素規制、
GHG排出量報告義務の強化
取引手続き・モニタリング 調査等
におけるコストの増加
短期
小
小
環境対応への遅れによるステー
クホルダーからの評判低下
人員不足、労働生産性の低下
中期
小
小
洪水によるサプライチェーン寸断
に伴う販売機会の喪失
長期
小
小
物流や保険料等のコスト増大によ
る価格転嫁への懸念
長期
小
小
気温の上昇
バイオマス原料等の調達困難
長期
小
小
カーボンニュートラル政策
補助金による取引機会の増加
中期
小
小
新たなエネルギー源
新市場における取引機会の増加
中〜
長期
小
小
気候変動への取り組みの外部評価
脱炭素化への取り組みの本気度に
よる企業価値の向上、外部評価の
向上、社員エンゲージメントの上昇
中期
小
小
自社への影響
時間軸 ※
原材料価格高騰
取扱商材の仕入れ価格高騰による
利幅の低下
中期
小
小
化石燃料ビジネスの衰退
関連業界・市場規模縮小による従
来の設備需要の減少
中期
中
小
新規事業の失敗
新しい脱炭素技術を活用した商材
への投資の失敗による減益
中期
小
小
CCS等の新たな機会
掘削事業の横展開による取引機会
の増加
長期
中
小
1.5℃ 4℃
リスク
ともに、成長戦略「V2030」の投資戦略に脱炭素を取り込むなど、事業を通じた取り組みを開始
急性
しております。
価値創造
一つとして特定し、サステナビリティ基本方針及び環境方針を定め、脱炭素社会の実現を目標に
政策/
法規制
財務影響
自社への影響
トリガー
DAIICHI JITSUGYO CO., LTD.
行っております。
全社に共通する気候関連のリスク及び機会
Integrated Report 2026
締役会では独立社外取締役の視点も取り入れたうえで、サステナビリティの取り組みの評価を
異常気象の激甚化
物理的
リスク
気候関連のリスクと機会
慢性
討を実施いたしました。検討に当たっては、サステナビリティ推進部を中心に、関連事業本部、
管理部門等から構成するTCFD分析ワーキンググループを発足させ、議論および検討を行い、代
表取締役社長執行役員を委員長とするサステナビリティ委員会での承認を得ました。
資源の効率性
機会
参照したシナリオ
レジリエンス
設定シナリオ
1.5℃シナリオ
4℃シナリオ
将来社会像
脱炭素化により化石燃料関連のビジネス
が減少し、新素材・新技術等による製品
需要が増加
脱炭素・低炭素 の動きは一部にとどま
り、気候変動に起因する自然災害が頻
発、激甚化
「Net Zero Emissions by 2050
Scenario」
(NZE)
(IEA WEO2022)
「Stated Policies Scenario(STEPS)」
(IEA WEO2022)
移行リスクシナリオ
RCP2.6(IPCC AR5)
SSP1-1.9/SSP1-2.6(IPCC AR6)
個別事業における気候関連のリスク及び機会
プラント・エネルギー事業
リスク・機会の種類
RCP8.5(IPCC AR5)
SSP5-8.5/SSP1-2.6(IPCC AR6)
リスク
市場
市場
市場
トリガー
※短期:3年以内、中期:4〜9年以内、長期:10年以上
財務影響
1.5℃ 4℃
データ
物理リスクシナリオ
※短期:3年以内、中期:4〜9年以内、長期:10年以上
サステナビリティ戦略
シナリオ分析の結果
事業戦略
当社では、TCFD提言が示す気候関連リスク・機会項目等に基づき、事業に影響する項目の検
087
自社への影響
時間軸 ※
内燃機関自動車 の 新車販売台数
の低下による取引機会の喪失
中期
トリガー
政策/法規制燃料規制や環境規制の強化
当社のリスク管理は、リスク管理委員会を中心として行われ、サステナビリティに係るリスクにつ
1.5℃ 4℃
いても、同委員会の議案として取り上げられております。但し、気候変動リスクを含む重要かつ優
小
小
先的に取り組むべきリスクについては、サステナビリティ委員会のモニタリングを受けております。
また、リスク管理委員会は、リスク管理を効果的かつ効率的に実施するために、リスク管理規
中期
小
小
程に基づき、その他のリスクと併せて当社戦略に沿った気候変動リスクの管理を行っております。
EV製造企業の増加による顧客購
買力の低下及び自社営業コストの
増大
中期
小
小
指標及び目標
内燃機関への設備投資縮小に伴う
関連製造設備の収益低下
中期
小
小
EV普及の鈍化
EV需要の 停滞に伴う設備投資の
減少及び取引機会の減少
中期
ー
中
モビリティサービスの
普及・拡大
自動車生産量の低下による製造設
備需要の減少
長期
小
小
EVの普及
リスク
市場
当社グループの気候変動リスクに関する指標及び目標並びに実績は、次のとおりであります。
目標
価値創造
EV製造設備の 価格競争激化によ
る収益の低下
DAIICHI JITSUGYO CO., LTD.
リスク・機会の種類
財務影響
Integrated Report 2026
リスク管理
自動車事業
2030年度までに2020年度のScope1及びScope2における温室効果ガスの排出量(1,617.37t-CO2)
機会
市場
EV市場の拡大
中期
中
小
Scope1及びScope2
売上高当たりのScope1及び2のGHG排出量
(単位:t-CO2)
(単位:t-CO2 /百万円)
1,912
555
1,357
中期
中
小
新工法開発による新規設備投資に
伴う取引機会の拡大
中期
中
小
※短期:3年以内、中期:4〜9年以内、長期:10年以上
対応策
気候変動はリスク・機会の両面において当事業への影響が少なくないことから、中・長期的な
成長に向け、経営における重要課題の一つと認識しております。この複数のシナリオ分析を踏ま
え、当社では気候変動に関するリスク低減と機会獲得に向けた対応策を講じており、具体的には、
1,209
2023年度
2024年度
Scope1
Scope2
1,625
528
1,097
2025年度
計測項目
カテゴリー 2(資本財)
業戦略におけるレジリエンスの向上に努めてまいります。
0.005
2024年度
2025年度
Scope2
カテゴリー 5(事業から発生する廃棄物)
カテゴリー 6(出張)
カテゴリー 7(従業員の通勤)
カテゴリー 12(販売した製品の廃棄)
703,715.55
802,772.38
748,976.74
2,936.20
2,092.24
3,086.19
ー
401.72
382.97
17,908.02
17,267.49
19,585.44
52.94
36.38
63.23
7,325.66
8,567.93
8,911.19
444.17
475.17
491.03
ー
1,118.30
1,045.13
※Scope2はマーケット基準で算出しております。
※排出量の算定に関しては、当社および国内外連結子会社を範囲としますが、小規模で全体の影響が限定的な拠点に
ついては除外しております。
データ
カテゴリー 4(輸送・流通〈上流〉
)
けた各種活動や新たな成長市場への参入の実施等により事業ポートフォリオの最適化を図り、事
0.005
2023年度実績
(t-CO2) 2024年度実績
(t-CO2)
(t-CO2)2025年度実績
カテゴリー 1(購入した製品・サービス)
術に関する事業などの取り組みを進めております。
くり企業に対する環境配慮製品やサービスの提供のみならず、カーボンニュートラルの実現に向
2023年度
Scope1
0.007
0.002
Scope3
カテゴリー 3(燃料及びエネルギー関連活動)
してまいります。また、当社グループの置かれたサプライチェーンにおいて、お客様であるモノづ
0.008
0.003
0.007
事業投資の検討に気候関連リスク・機会の観点を取り入れ、バイオマス発電やアンモニア製造技
今後も分析対象事業を順次広げつつ、これらの分析結果を定期的かつ継続的にモニタリング
0.01
0.003
サステナビリティ戦略
EV製造関連企業の増加による取
引機会の拡大
1,780
571
事業戦略
新たな生産設備の需要増加に伴う
収益の向上
を46%削減、2050年度までにネットゼロを目指す。
088
第一実業グループは、経営理念「人をつなぎ、技術をつなぎ、世界を豊かに」のもと、社会や環
パワーハラスメント、
セクシュアルハラスメント等のあらゆる形態のハラスメントを認めません。
(5)先住民及び地域住民の権利
境の変化へ柔軟に対応し、コンプライアンス遵守をはじめとする社会的要請に応えることで、持
各国・地域の法令及び国際的取り決めに従い、先住民及び地域住民の権利と文化を尊重し、
続的な成長と社会貢献の両立を目指しています。
権利侵害を防止します。
私たちは、ビジネスパートナーの皆様を「価値創造」に欠かせない大切なパートナーであると
考えており、サプライチェーンは事業基盤そのものです。そのため、当社グループではサプライ
3.環境への対応
(1)地球環境の保護と汚染防止
地球温暖化を始めとする環境問題の解決に貢献するとともに、有害廃棄物・汚染物質の削減
して位置付けています。
と適正処理に取り組み、大気・水・海洋・土壌の汚染防止に努めます。
ビジネスパートナーの皆様に、当社グループと共に取り組んでいただきたい事項をまとめ、
2026年2月に「第一実業グループサプライヤー行動指針」を定めました。
1.倫理観の保持および法令の遵守
高い倫理観を保ち、良識と責任をもって行動します。
(2)コンプライアンスの徹底
①法令遵守は経営の根幹であると認識し、各国・地域の法令を遵守します。
②法令違反その他のコンプライアンス上の問題について報告体制を確保し、通報者の秘密を
不利益な取り扱いをしません。
2.人権の尊重
(1)人権の尊重
①人権を尊重し、いかなる場合においても、個人の尊厳を守ります。
②人権に関する各国・地域の法令および国際規範を遵守します。
③事業活動が人権に与える影響を認識します。人権の侵害、またはそれらを助長する企業や
団体等との取引、パートナーシップなどのあらゆる連携を行いません。
いかなる場合も、強制労働、児童労働、人身売買を認めません。またサプライチェーンにおい
てもこれらを許容しません。
(3)差別の禁止
いかなる場合も、性別、人種、出生、国籍、宗教、思想、年齢、障がいの有無、その他個人的
な特性に基づいた差別は行いません。
(3)資源の有効活用
森林・水等をはじめとする限りある資源を有効利用するため、環境マネジメントシステムを活
用し、省資源、廃棄物削減、水使用削減、再資源化等に積極的に取り組み、サステナブルな
製品サービスの提供に努めます。
(4)生物多様性の保全
事業活動が生物多様性に影響を与えることを認識し、
生物多様性に配慮した活動を推進します。
(5)環境関連法令遵守
事業活動を行う上で化学物質を含む環境に関する各国・地域の法令、規則、協定等を遵守し
ます。また、サプライチェーン上にある全ての関係先に環境保護を求めます。
4.労働安全衛生
(1)公正な雇用・労働・処遇
①労働安全衛生に関わる各国・地域の法令を遵守し、健康・安全に配慮した働く人に優しい
職場環境を整備します。
②公正な人事・処遇制度の構築とその適切な運用に取り組みます。
③均等待遇原則を尊重し徹底するために、各国・地域の雇用・労働に関する法令に従い、国籍、信条、社
会的身分などを理由に、
賃金、
労働時間その他の労働条件につき差別的な取り扱いは一切行いません。
④労働時間については、
各国・地域の法令に従う事はもとより、
過剰労働時間の削減に努めます。
データ
(2)強制労働・児童労働・人身売買の禁止
使用の効率化など気候変動による影響の軽減に向けた取り組みを積極的に推進します。
サステナビリティ戦略
厳守しながら迅速に調査を行います。通報者および調査協力者のプライバシーを保護し、
脱炭素社会の実現を目指し、事業活動において、温室効果ガスの排出削減およびエネルギー
事業戦略
(1)倫理観の保持
(2)気候変動への取り組み
価値創造
チェーンマネジメントをマテリアリティ(重要課題)として特定し、優先的に取り組むべきテーマと
第一実業グループサプライヤー行動指針
DAIICHI JITSUGYO CO., LTD.
基本的な考え方
(4)ハラスメントの禁止
Integrated Report 2026
サプライチェーンマネジメント
⑤賃金については、法定最低賃金の支払いはもとより、最低賃金を上回る生活賃金の支払い
を行う事に努めます。
⑥各国・地域の法令に則り、結社の自由と団体交渉権を尊重することで、より公正な労働環
境の実現を目指し、役職員の幸福と企業の持続的な成長を両立させます。
089
製品やサービスの安全・品質に関する各国・地域の法令を遵守し、自社の品質基準および顧
客の要求事項を満たす製品やサービスを提供します。
(2)安全・品質情報の提供
製品やサービスの安全・品質情報については、必要な情報を適切に提供します。
(3)事業継続
業継続計画(BCP)などの運用体制を構築します。
6.公正な企業活動
(1)公正かつ自由な取引
事業活動を行う各国・地域において適用される独占の禁止、公正かつ自由な競争・取引に関
する法令や規則を遵守します。また、
そのような行為に該当すると疑われる行為を行いません。
①製品やサービスの輸出入にあたり、各国・地域の関連法令を遵守します。
②国際的な平和と安全の維持を妨げる製品、部品材料または情報を輸出することがないよう
に、兵器転用や規制地域への輸出の可能性を厳重に確認し、適正な手続きを行います。
(3)責任ある調達
①事業活動はサプライチェーンにおける多くの企業や人々からの協力の下に成り立っているこ
②紛争鉱物、木材・紙製品等、人権・環境等の社会問題を引き起こす原因となる原材料の使
用に配慮した調達を行い、使用した原材料のトレーサビリティの確保に努めます。
(4)個人的利益相反行為の禁止
迅速な権利化を図り、これを適切に利用します。
②第三者が所有する知的財産を尊重し、製品・技術の研究・開発・販売などにおいて、権利
侵害を未然に防止します。
(2)サイバー攻撃に対する防御
①機密情報や個人情報を含む情報システムへのアクセス管理を徹底し、不正な侵入、改ざん、
漏えい、紛失、破壊および利用妨害から守るために、社内規則に則り、情報を取り扱います。
②サイバー攻撃等、コンピューター・ネットワーク上の脅威への対策を講じ、被害が最小限に
留まるようにします。
③情報セキュリティに関する、インシデントが発生した場合の対策および体制を継続的に見
直します。
(3)機密情報の管理
①機密情報の管理を徹底し、これを第三者に漏えいさせません。また、業務以外の目的のた
めに、機密情報を使用しません。さらに、第三者から開示を受けた機密情報も会社の機密
情報と同様に取り扱います。
②定められた手続きを経ずにこれらの情報を開示することや、漏えいさせることはなく、本来
の目的以外の使用、および関係者以外の閲覧は、許容しません。
(4)個人情報の保護
会社が有する個人情報は、これを厳重に管理し、本来の目的以外には使用しません。また、
職務上の地位や権限を乱用し、または職責に反して、個人の利益を図ったり、または会社の利
各国・地域の法令で認められる場合等の正当な理由がない限り、本人の承諾なく、外部に開
益を損なうことはしません。
示しません。
(5)インサイダー取引の禁止
インサイダー取引規制の趣旨を理解し、重要情報の取扱等については、各国・地域の関連法
株式等の取引は行いません。
(6)贈収賄・腐敗行為の防止
①国内海外を問わず、公務員またはこれに準ずる者に対して賄賂、贈与、接待などの各国・
地域の法令に違反する行為を一切行いません。
②取引先への過剰な贈答・接待は行いません。
8.地域社会参画と発展への貢献
(1)地域文化等の尊重
地域の文化や慣習を尊重した事業活動を行うと共に、
事業を通じた地域社会の発展に貢献します。
9.情報開示
データ
令および社内規則を遵守します。公になっていない自社または他社の重要事実を知った場合、
サステナビリティ戦略
とを認識し、誠実で適正な取引を徹底し、責任ある調達を行います。
①自社の知的財産の価値を正しく理解し、業務上生じた発明・考案・意匠等の権利を保全し
事業戦略
(2)輸出入関係法令の遵守
7.情報セキュリティ
(1)知的財産の尊重・活用
価値創造
大規模な自然災害等の脅威によって、製品やサービスの提供に支障が生じる場合に備え、事
テロ行為、麻薬取引、マネーロンダリング等の組織的犯罪に関与しません。
DAIICHI JITSUGYO CO., LTD.
(1)安全・品質の確保
(7)組織的犯罪への関与の禁止
Integrated Report 2026
5.安全・品質
(1)適切な情報開示
各国・地域の関係法令に従い、社会から求められる会社情報を適時かつ正確に開示し、事業活
動の透明性を高めます。
090
ガバナンスの拡充
当社は、透明性と規律に基づくガバナンスを 経営の 基盤と位置付けており、適切なガバナンス体制 の 構築により経営判断 の 質を向上させ ています。グローバ ル な事業
DAIICHI JITSUGYO CO., LTD.
05
Integrated Report 2026
マテリアリティ
展開に伴う商慣行 の 違いや 新 たなリスクに対応 するため、海外拠点を含 むグル ープ全体 の内部統制と情報 セキュリティ体制 の 強化を 進 め、リスク低減を 通じた 持続的
取り組みテーマ
「V2030」への
指標(KPI)
バウンダリー
2025年度実績
指標の状況
取り組み状況
●
目指す姿
単体
ー
情報セキュリティ体制の
強化
事業環境 の 変化に機敏
単体
6件
社外取締役比率維持向上
単体
41.7%
に対応するグループ経営
情報セキュリティ教育
(Eラーニング受講率100%)
●
情報資産の特定及び管理
●
インシデント報告体制整備
●
インシデント発生時対応マニュアル整備
体制を構築し、効率的か
つ健全で透明性のある、
ゆるぎないガバナンス体
制を維持・強化している。
取締役会における多様性
の確保
●
不十分な内部統制による経営品質の低下
事故・不祥事の発生による社会的信用の失墜
●
安定的な経営基盤の確立
●
透明かつ迅速な意思決定による収益性の向上
●
ステークホルダーからの信頼獲得
データ
機会
リスク
●
ー
サステナビリティ戦略
インシデント件数
情報セキュリティ委員会開催(6回)
●
事業戦略
情報セキュリティポリシーの拡充
と浸透
価値創造
な 利益創出を実現していきます。
091
コーポレート・ガバナンスに関する基本的な考え方
社外取締役女性役員
比率
比率
当社は、
「人をつなぎ、技術をつなぎ、世界を豊かに」との経営理念のもと、持続的な事業活動
社外取締役を2名に増員
を通じた企業価値向上を目指しております。
この成果を、株主をはじめとする全てのステークホルダーの皆さまと共に享受するためには、
2016
女性社外取締役の就任
8名(社内6名、社外2名)
25%
13%
33%
22%
33%
11%
42%
17%
取締役会実効性評価を開始
経営基盤であるコーポレート・ガバナンスの充実が不可欠であると考えております。
DAIICHI JITSUGYO CO., LTD.
取締役人数
取り組み・できごと
Integrated Report 2026
コーポレート・ガバナンス
当社は、事業特性を踏まえた、より健全で、透明かつ効率的な取り組みを、不断に追求するこ
監督と執行の分離を進め、環境変化に対応した果断で柔軟な意思決定と、実効的な監督の両
2018
価値創造
とを基本方針としております。
コーポレートガバナンス・コード改訂
指名・報酬に関する諮問委員会設置に向けた取り組みほか
立を目指して参ります。
コーポレート・ガバナンス強化の変遷
当社はコーポレート・ガバナンス強化を図るため、取締役会の多様性を確保するとともに、取
ガバナンス委員会の設置
2020
締役会の実効性評価、ガバナンス委員会の設置など実効性の向上に段階的に取り組んでいます。
取り組み・できごと
社外取締役
取締役人数
女性取締役を2名に増員
女性社外取締役
社外取締役女性役員
比率
比率
コーポレートガバナンス・コード改訂
2021
2011
執行役員制度に移行
役員構成数の減員(14名→6名)
社外取締役1名の就任
コーポレートガバナンス・
コードへの対応
14名(社内のみ)
6名(社内のみ)
6名(社内5名、社外1名)
0%
0%
17%
譲渡制限付株式報酬制度の導入
0%
2022
雇用型執行役員制度の導入
役員賞与の業績連動性の強化
2023
企業経営経験のある
社外役員の登用
2024
女性監査役の登用
2025
監査等委員会設置会社へ移行
女性取締役を2名に増員
0%
9名(社内6名、社外3名)
データ
2015
株式報酬制度の導入
(退職慰労金の廃止)
中核人材における多様性の確保、
サステナビリティを巡る課題への取り組みほか
サステナビリティ戦略
2009
9名(社内6名、社外3名)
事業戦略
取締役
社外取締役を3名に増員
0%
政策保有株式に関する方針の策定ほか
12名(社内7名、社外5名)
092
当社は、監査等委員会設置会社であり、監査等委員3名のうち2名は社外取締役であり、監査
取締役会
等委員は取締役として取締役会に毎回出席するほか、常勤の監査等委員は社内の重要会議に出
取締役会は、取締役12名(うち5名は社外取締役であり、監査等委員である取締役3名を含む)
席するなどして、客観的立場で取締役の業務執行を監査・監督しております。
で構成されております。
また、監査等委員会は、会計監査人から監査計画及び監査結果について報告並びに説明を受
原則として毎月1回開催しており、臨時取締役会を適宜開催し、活発な意見交換を行う中で、
けるほか、監査対象、監査方法あるいは監査結果についての意見交換を行い、情報の共有に努め
経営の基本方針やその他重要事項を決定するとともに、業務執行状況を監督する機関としての
る等、監査の実効性確保に努めております。
機能を十分に果たしております。
監査法人および内部監査体制について
な業務運営を行い、もって企業価値の一層の向上を図ることを目的に執行役員制度を導入してお
監査法人は、有限責任監査法人トーマツと監査契約を締結しており、公正不偏な立場から会
り、連結子会社各社の業務執行を管理・監督しております。
経営戦略
●
計監査を受けているほか、適宜、会計面のアドバイスを受けています。
内部監査体制につきましては、内部監査部が中心となり、役職員の職務の執行が法令、定款及
主な取締役会決議・報告事項
び内部統制基本方針並びに当社行動規範に適合していることを確認し、内部統制の評価等を
中期経営計画「MT2027」 ● 女性活躍推進宣言
行っています。
サプライヤー行動指針 ● 資本コスト ● 政策保有株式 ● 機構改革、規程改定
● 取締役会実効性評価
● 監査等委員・内部監査部の監査報告
● 役員業務執行状況報告
● コンプライアンス関連
● 業績評価方法
財務・経理
●
決算関連
●
資金計画
個別案件
●
事業投資
●
大型営業取引案件
●
事業戦略
●
ガバナンス
調達
株主総会
ガバナンス委員会
(指名・報酬)
業務執行
答申
取締役会
取締役
諮問
選定
代表取締役
サステナビリティ委員会
リスク管理委員会 ほか
選任・解任
選任・解任
監査
監査等委員会
(監査等委員である取締役)
監査
(連携)
(連携)
(連携)
会計監査人
監査
(連携)
内部監査部
経営会議
データ
社内委員会
選任・解任
サステナビリティ戦略
コーポレート・ガバナンス体制
意思決定・監督
価値創造
さらに、当社は意思決定・監督機能と業務執行機能を分離することにより機動的かつ効率的
2026年3月期
DAIICHI JITSUGYO CO., LTD.
監査等委員
Integrated Report 2026
コーポレート・ガバナンス体制の概要
各事業本部・子会社(国内外)
コーポレート部門
内部監査
093
DAIICHI JITSUGYO CO., LTD.
Integrated Report 2026
役員一覧
価値創造
代表取締役社長執行役員
取締役常務執行役員
取締役常務執行役員
取締役常務執行役員
取締役常務執行役員
船渡雄司
府川治
上野雅敏
大槻信二
岡田尚一郎
1982年 4月
当社入社
1987年 4月
当社入社
1992年 4月
当社入社
1985年 4月
当社入社
1990年 4月
当社入社
1990年 4月
当社入社
2013年 4月
執行役員大阪事業本部長兼
大阪支店長
1997年 10月
海外本部ロンドン支店長
2006年 4月
DAIICHI JITSUGYO ASIA PTE.
LTD. Director
2003年 4月
精機営業本部電精ファインデバイス
第一部長
2005年 10月
中国本部香港支店長
2008年 4月
DAIICHI JITSUGYO(AMERICA), INC.
General Manager
2008年 10月
PFSC統括事業本部本部長代理
2000年 10月
DAIICHI JITSUGYO(THAILAND)
CO.,LTD.
General Manager
2014年 4月
執行役員、
DAIICHI JITSUGYO (AMERICA),
INC. 取締役社長
2017年 4月
執行役員ファーマ事業本部長
2010年 10月
DAIICHI JITSUGYO(AMERICA), INC.
Secretary&Treasurer
2022年 4月
代表取締役社長執行役員
2021年 4月
常務執行役員
2015年 10月
経理本部本部長代理
2025年 4月
代表取締役会長執行役員CEO
(現任)
2023年 4月
常務執行役員CSuO
2019年 4月
執行役員管理本部長
2023年 6月
取締役常務執行役員CSuO
2020年 4月
執行役員経理本部長
2024年 4月
取締役専務執行役員CSuO
2021年 4月
常務執行役員CFO兼経理本部長
2025年 4月
代表取締役社長執行役員COO
(現任)
(内部監査部、関係会社管掌)
2021年 6月
常務取締役常務執行役員CFO兼
経理本部長
2013年 4月
管理本部財務部長
2022年 4月
取締役常務執行役員CFO兼
経理本部長
2024年 4月
取締役常務執行役員CFO(現任)
(経理本部、総務本部、企画管理部、
コーポレートコミュニケーション部担当)
2019年 6月
常務取締役
2022年 4月
取締役常務執行役員
2023年 4月
取締役常務執行役員CDO
2025年 4月
取締役常務執行役員CSO
2026年 4月
取締役常務執行役員CSO(現任)
(経営企画本部、デジタルイノベーショ
ンセンター、ERM室担当兼エンジニ
アリングセンター責任者)
2003年 4月
DAIICHI JITSUGYO(PHILIPPINES),INC.
Managing Director
2004年 4月
DAIICHI JITSUGYO(PHILIPPINES),INC.
President
2005年 10月
DAIICHI JITSUGYO(THAILAND)
CO.,LTD.
Managing Director
2015年 10月
エレクトロニクス事業本部本部長代理
2019年 4月
執行役員エレクトロニクス事業本部長
2022年 4月
上席執行役員エレクトロニクス事業本部長
2023年 4月
常務執行役員
2025年 4月
常務執行役員CSO
2025年 6月
取締役常務執行役員CSO
2026年 4月
取締役常務執行役員CSO(現任)
(ヘルスケア事業、エレクトロニクス事
業、アジアエリア、インドエリア担当)
2010年 4月
上海一実貿易有限公司
自動車プラスチック環境機械統括部長
2012年 4月
上海一実貿易有限公司
自動車プラスチック事業部長
2014年 10月
大阪事業本部産業機械統括部長
2017年 4月
産業機械事業本部本部長代理
2019年 4月
執行役員産業機械事業本部長
2022年 4月
上席執行役員産業機械事業本部長
2023年 4月
常務執行役員
2025年 4月
常務執行役員CSO
2025年 6月
取締役常務執行役員CSO(現任)
(産業機械事業、航空・インフラ事業、
中国エリア担当)
データ
2017年 4月
代表取締役社長
2019年 4月
執行役員、
DAIICHI JITSUGYO ASIA PTE. LTD.
取締役社長
2013年 4月
執行役員エレクトロニクス事業
本部長
2007年 10月
第一實業(香港)有限公司総経理
サステナビリティ戦略
2016年 6月
常務取締役
2012年 7月
DJK EUROPE GMBH Managing
Director
事業戦略
代表取締役会長執行役員
宇野一郎
094
DAIICHI JITSUGYO CO., LTD.
Integrated Report 2026
役員一覧
価値創造
社外取締役
社外取締役
取締役監査等委員
社外取締役監査等委員
社外取締役監査等委員
中山和夫
宮地克明
豊泉隆宏
小山充義
小野亜希子
2018年 12月
弁護士登録
1980年 4月
三井物産株式会社入社
1985年 4月
日産化学株式会社入社
1989年 4月
当社入社
1981年 4月
東京国税局入局
2019年 1月
宏和法律事務所入所
2006年 4月
同社プロジェクト業務部長
2010年 6月
同社取締役物質科学研究所長
2019年 5月
文部科学省コンプライアンスチーム
支援メンバー(現任)
2008年 6月
同社アジア・大洋州本部C.A.O兼
アジア・大洋州三井物産株式会社S.V.P
(在シンガポール)
2011年 6月
同社取締役新事業企画部長
2006年 4月
DAIICHI JITSUGYO ASIA PTE. LTD.
General Manager
2015年 9月
税理士登録
小山税理士事務所
(現坂本・小山税務会計事務所)開設
(現任)
2020年 6月
当社取締役(現任)
2021年 1月
山田・尾﨑法律事務所入所(現任)
2025年 8月
文部科学省再就職コンプライアンス
チームアドバイザリーメンバー(現任)
2012年 4月
同社執行役員食糧本部長
2014年 4月
同社常務執行役員食糧本部長
2015年 6月
JA三井リース株式会社
代表取締役副社長執行役員
2020年 6月
同社顧問
2021年 3月
井関農機株式会社社外取締役
2023年 6月
当社取締役(現任)
2014年 10月
同社執行役員材料科学研究所長
2016年 4月
同社常務執行役員経営企画部長
Nissan Chemical America
Corporation社長兼務
2016年 6月
同社取締役常務執行役員経営企画部長
2021年 4月
日本肥糧株式会社代表取締役社長
丸新運輸梱包株式会社、パリノ・サー
ヴェイ株式会社、日本林業肥料株式会
社社長兼務
2026年 6月
当社取締役(現任)
2013年 4月
管理本部国際業務部長
2016年 1月
DAIICHI JITSUGYO(AMERICA),
INC.
Secretary&Treasurer
2018年 7月
総務本部本部長代理
2019年 4月
管理本部副本部長
2020年 4月
総務本部長
2021年 4月
執行役員総務本部長
2022年 4月
上席執行役員総務本部長
2024年 6月
常勤監査役
2022年 12月
ホテルマネージメントインターナショ
ナル株式会社社外監査役(現任)
2023年 1月
株式会社イトーキ社外監査役
2025年 6月
当社取締役(監査等委員)
(現任)
2002年 9月
中島公認会計士事務所代表
2005年 9月
株式会社ブレインリンクディレクター
2008年 4月
GCAサヴィアングループ株式会社
バイスプレジデント
2011年 1月
株式会社アットストリーム出向
(マネージャー)
2013年 6月
小野公認会計士事務所代表(現任)
2022年 5月
株式会社スクロール社外取締役
(監査等委員)
(現任)
2024年 6月
当社監査役
2025年 3月
合同会社ブレインリンク代表社員
(現任)
2025年 6月
当社取締役(監査等委員)
(現任)
データ
2025年 6月
取締役(監査等委員)
(現任)
2016年 6月
当社監査役
1999年 5月
公認会計士登録
サステナビリティ戦略
2019年 6月
公益財団法人全日本柔道連盟
コンプライアンスホットライン窓口
(現任)
2014年 4月
同社取締役執行役員電子材料研究所長
1995年 10月
監査法人トーマツ
(現有限責任監査法人トーマツ)入所
事業戦略
社外取締役
山田奈美香
095
社外取締役
経験業務・知識等
選任理由
氏名
地位
氏名
弁護士として企業法務に関する幅広い知見を有しており、コンプライアンス等に関する柔軟
山田奈美香
かつ適切な助言及び指導をいただいております。今後も、独立した立場から経営に対する
適切な監督機能を発揮し、当社の持続的成長と企業価値の向上に貢献いただくことを期待し
業界知見・
企業経営・
営業・マー 国際性
企業戦略
ケティング
属性
法務・
財務・
リスクマネ 人材戦略
会計
ジメント
その他
性別独立性
代表取締役
会長執行役員
●
●
●
●
男性
船渡雄司
代表取締役
社長執行役員
●
●
●
●
男性
府川治
取締役
常務執行役員
●
男性
上野雅敏
取締役
常務執行役員
大槻信二
取締役
常務執行役員
岡田尚一郎
取締役
常務執行役員
山田奈美香
社外取締役
中山和夫
社外取締役
●
●
●
宮地克明
社外取締役
●
●
●
豊泉隆宏
取締役
監査等委員
小山充義
社外取締役
監査等委員
●
男性
●
小野亜希子
社外取締役
監査等委員
●
女性
●
ております。
価値創造
宇野一郎
他社での経営経験に加え、海外事業にも精通し、国内外の多岐にわたる業界の豊富な知見
を有しており、当社グループに対しても、外部の客観的かつ実践的な視点から有益な助言及
中山和夫
び指導をいただいております。今後も、独立した立場から経営に対する適切な監督機能を
●
●
●
DAIICHI JITSUGYO CO., LTD.
取締役のスキルマトリクス
Integrated Report 2026
社外役員選任理由
発揮し、当社の持続的成長と企業価値の向上に貢献いただくことが期待できると判断し、選
任いたしました。
経験と高い見識を有しております。こうした高度な経営管理能力及び研究開発戦略に関する
宮地克明
●
●
●
●
●
男性
●
●
●
男性
男性
深い知見に基づき、多角的な視点から経営判断への有益な助言や指導が期待できること、
また、当社の経営体制の強化及びガバナンスの向上への貢献が期待できると判断し、選任い
たしました。
選任理由
氏名
税理士として豊富な経験と財務及び会計に関する高い知見を有しております。2016年6月よ
り社外監査役として当社の経営の健全性確保と企業価値向上に大きく寄与されてきました。
●
※2
※2
女性
●
男性
●
男性
●
こうした実績を踏まえ、今後は監査等委員である社外取締役として経営の監督強化に貢献い
ただくことを期待しております。
●
●
●
男性
年6月より社外監査役として客観的かつ専門的見地からの助言及び適切な監査を行い、当社
の経営の健全性確保と企業価値向上に大きく寄与されてきました。こうした実績を踏まえ、
今後は監査等委員である社外取締役として当社の経営の監督強化に貢献いただくことが期
データ
公認会計士として豊富な経験と財務及び会計に関する幅広い知識を有しております。2024
小野亜希子
サステナビリティ戦略
監査等委員である社外取締役
小山充義
●
事業戦略
長年にわたり素材メーカーにおいて研究開発及び経営の中枢を担い、製造業における豊富な
※1
●
待できると判断し、選任いたしました。
※1 テクノロジー・IT・DX
※2 他業種知見
096
社外取締役の知見および助言を生かし、透明性および公平性の確保とガバナンス強化によっ
て企業価値を向上させることを目的に、経営陣幹部(代表権のある取締役をいう)および取締役
の指名・報酬およびその他のガバナンスに関する事項を審議し、取締役会に答申又は提案を行
う取締役会の任意の諮問機関としてガバナンス委員会を2020年10月1日に設置し、運営していま
す。本委員会は委員の過半数を独立社外取締役で構成しており、活動状況は次のとおりです。
委員長:社外取締役
(社外取締役3名/代表取締役会長執行役員/代表取締役社長執行役員)
取締役会の構成(2問)
●
取締役会の議題(6問)
●
取締役会の運営(5問)
●
取締役会を支える体制(5問)
今後、取り組むべき課題・対応
●
中長期的な企業価値向上に向けた議論の一層の推進
●
後継者計画への関与強化
●
業務執行と監督機能の分離強化
●
審議環境の改善
役員報酬等
役員の報酬等の 額又はその算定方法の決定方針
2026年3月期
開催回数
6回(2025年4・6・11・12月、2026年2月)※2月は2回開催
当社は役員の報酬等の額又はその算定方法の決定に関する方針を定めており、その内容は、
価値創造
構成
●
DAIICHI JITSUGYO CO., LTD.
アンケート質問事項(全18問)
Integrated Report 2026
ガバナンス委員会
企業業績と企業価値の中長期的な向上を促すものとし、各役員の職責に見合った報酬体系とし
ています。
2026年3月期
審議内容
役員報酬(固定報酬・業績連動報酬、非金銭報酬)について
● 後継者計画について
● 社外取締役候補者について
●
社外取締役を除く取締役の個人別報酬については、取締役会の諮問に基づき、ガバナンス委
報酬額を決定いたします。
当社の役員の報酬は、固定報酬、業績連動報酬および非金銭報酬等により構成されており、
取締役会の実効性評価
業務執行取締役の種類別の報酬割合および報酬額については、その客観性・妥当性を確保する
取締役会の実効性については、前期の実効性評価において認識された課題の改善に向けて取
り組み、当期の実効性の対応状況を確認しました。
観点から、同業種かつ同規模である他企業における報酬構成割合および従来の支給実績との比
較・検証を行うとともに、中期経営計画「MT2027」のインセンティブとして機能するよう、ガバ
組んだ内容は以下のとおりです。今後も、課題解決に向けて継続的に取り組んでいきます。
ナンス委員会への諮問および答申を踏まえ、取締役会で決定しております。
監査等委員を含む社外取締役の報酬額については、その職務の独立性という観点から固定報
酬および業績連動性のない株式報酬のみとしており、株主総会で決議された総額の範囲内にお
評価方法
2025年12月取締役会にて取締役全員にアンケート実施(回答は記名方式)
2026年2月取締役会にて、アンケート回答結果に基づく分析・評価を行い、今後の取り組み
を議論
いて決定しております。
取締役(社外取締役を除く)の報酬制度の 概要
サステナビリティ戦略
2025年3月期の取締役会の実効性評価結果における課題認識を踏まえ、2026年3月期に取り
課題
事業戦略
員会が審議し取締役会に答申します。取締役会は、
ガバナンス委員会からの答申について審議し、
取締役(監査等委員である取締役を除く)の報酬は、固定報酬(金銭報酬)、業績連動報酬(全
2026年3月期の取り組み
社業績等に連動する賞与)、
非金銭報酬等
(譲渡制限付株式による株式報酬)
で構成しております。
また、2025年6月24日開催の第102期定時株主総会決議により承認された年額4億60百万円の
取締役における女性比率の向上を推進
中長期的な企業価値向上に向けた議論の推進
成長戦略「V2030」達成に向けた中長期的な議論を実施中
取締役会資料の十分な事前検討時間の確保
審議資料の事前配布タイミングの改善に取り組み中
範囲内で社外取締役を除く取締役に対して、固定報酬に加えて業績連動報酬としての賞与を支
給することとしております。
データ
取締役会構成員におけるさらなる多様性の確保
097
固定報酬
各役位別の役割や責任を明確にし、それらに沿った金額を毎月一定額ずつ支給する金銭報酬
固定報酬
55%
業績連動報酬のインセンティブカーブ
支給率
業績連動報酬
30%
非金銭報酬
15%
130%
です。
※業績連動報酬目標達成度100%のケース
業績連動報酬
全社業績に係る賞与(以下、
「賞与A」)と、中期経営計画の達成に資する指標等に係る賞与(以
の達成に資する指標等の達成度に基づいて、基準値の0%〜130%で変動して支給する金銭報酬
です。
業績連動報酬(賞与A)の算定方法
業績連動報酬(賞与A)の業績指標を連結営業利益および親会社株主に帰属する当期純利益
とします。
業績指標として連結営業利益を選定した理由は、当社グループの本業から創出した利益を適
属する当期純利益を選定した理由は、成長に向けた投資の成果や株主還元の原資となり、当社
グループの最終業績に責任を負うという観点より指標としてふさわしいと判断したためです。
各取締役への支給額=業績連動報酬(賞与A)の総額 ※1×
各取締役の役位別係数 ※2
業績連動報酬(賞与A)の総額=104,560千円×(連結営業利益の年度目標に対する達成度×75%+親会社株主
に帰属する当期純利益の年度目標に対する達成度×25%)なお、年度目標に対する達成度が130%を超える場合、
いずれも130%として計算します。
取締役
員数
上限金額
会長執行役員
100
1
32,286,000円
社長執行役員
常務執行役員
当社は、代表取締役社長執行役員をはじめとする取締役及び執行役員が積極的に決算説明会
重視し、双方向の良好なコミュニケーションを図るIR(インベスター・リレーションズ)活動を展
開しております。
❶ IR活動を統括する取締役
❹ 社内フィードバックのための方策
IR部門を担当する取締役を指名しております。
決算説明会、会社説明会及び機関投資家面談な
どの結果については、経営陣にフィードバックし
❷ IR活動のための体制
IR担当部門を中心として、経理本部、総務本部、経営企画本部とIR
97
1
31,318,000円
56
4
18,080,000円
を行い、企業価値向上に生かしております。
❺ インサイダー情報の管理
❸ 対話の手段
代表取締役社長執行役員他経営陣出席の下、決算説明会などの
社外取締役や監査等委員である取締役も面談に臨みます。
2026年3月期の取り組み
ております。また、取締役会にもフィードバック
内部情報管理規程を全役職員に周知徹底してお
り、さらに問合せ窓口をIR担当部門に統一化す
ることによって、インサイダー情報の管理に努め
ております。
●
決算説明会:年2回(5月、11月)
●
個人投資家向け説明会:年6回(7月(2回)、8月、1月、2月、3月)
●
投資家面談:年47回
情報開示
データ
代表取締役
係数
130%
等投資家との対話に臨み、経営戦略・事業戦略・財務情報について、公平性・正確性・継続性を
進と情報開示に努めております。また、必要と判断する場合、
役位
100%
※賞与額は業績指標の達成度に応じて変動
します。
株主との建設的な対話に関する方針
開催や、事業報告書・統合報告書の発行などにより、投資の促
※2 各取締役の役位別係数(2026年3月期)
代表取締役
0%
※業績連動報酬目標達成度100%のケース
活動に関する意見交換を行い、IR活動の方針を決定しております。
※1 業績連動報酬(賞与A)の総額の計算方法
目標達成率
サステナビリティ戦略
役位別係数の合計
業績連動報酬非金銭報酬
10%
30%
事業戦略
正に反映する評価指標としてふさわしいと判断したためであり、業績指標として親会社株主に帰
固定報酬
60%
100%
価値創造
下、
「賞与B」)の2種類を支給します。賞与Aは連結業績の目標達成度に、賞与Bは中期経営計画
代表取締役以外の取締役におけるケース
DAIICHI JITSUGYO CO., LTD.
報酬等の種別の割合
代表取締役におけるケース
Integrated Report 2026
各報酬の 概要
経営内容の透明性を高めるために、コーポレートコミュニケーション部が中心となって積極的
非金銭報酬等
譲渡制限付株式報酬制度を導入しております。役割に応じて毎年一定額の株式を支給し、役
員の退任時に譲渡制限が解除される設定となっています。
に情報を適時公開するとともに、IR活動の一環として決算説明会を開催し、株主や投資家の皆
様へ事業の状況と今後の方向性について報告及び説明を行っております。
併せて、コーポレートサイト等を通じて経営情報の迅速かつ適切な開示を行っております。
098
経営、事業を取り巻くリスクへの対応
外部環境リスク
当社は成長戦略「V2030」を策定し、積極的な投資、
「モノ売り」から「モノ×コト売り」への変革、グローバルの成長
の取り込み、DX推進などの基本戦略を掲げ、新たなビジネスを創出することを重要戦略と位置付けています。
そのためには従来のトレード(売買活動)に加え、事業投資、ソリューション提供型のトレード、海外・国内ネットワー
クを駆使したクロスボーダー取引など多様な手法を駆使してビジネスを創出することが重要になってきています。
これらは、取引規模の大型化・複雑化と当社の「事業推進上のリスク」の上昇を意味しています。このような事業推進
上のリスクに対し、企業の社会的責任を果たしながら持続的な成長を追求するため、全社的にリスクの洗い出し、重
ERM)を敷いています。
戦略や事業目的の達成に影響を及ぼす可能性のある事象(プラス・マイナス双方を含む)をリスクと認識し、組織全体
として適切に管理する仕組み・プロセスを構築しています。
当社の受容できるリスク量への考え方(リスク選好)を明確化した上で、網羅的にリスクを識別し、影響度、発生頻度、
ています。
当社は、右図のビジネスリスクモデルから事業に関連する内外のさまざまなリスクを全社的かつ網羅的に特定し、重要
リスクの洗い出しを実施しています。
-
組織構造の戦略整合性
-
顧客ニーズ
-
持分価値・
金融商品変動
-
パフォーマンスギャップ
-
経営資源配分
-
資金調達
-
生産性・業務効率
-
KPI
-
権限移譲
-
事業ポートフォリオ
-
業務の属人化
-
事業投資判断
-
人材流出・離職率
-
商品ライフサイクル
-
人材不足
-
資金の上昇
-
レギュレーション変更
-
景気変動・経済危機
-
人口減少・少子高齢化
-
与信
-
債務不履行
-
取引先集中
-
士気・モラル
-
地政学的リスク
-
脱炭素
-
環境規制・環境問題
-
グリーンテクノロジー
-
プラスチック規制
-
大地震
-
台風・洪水
-
火山噴火
-
情報処理/ IT
-
情報セキュリティ
-
ソフトウェアの脆弱性
-
情報漏洩
-
DX
-
生成AI
-
テロ・紛争
-
ガバナンス
-
パンデミック
-
取締役会の実効性
-
フィッシング詐欺
-
取締役の指名・報酬
-
経営層メンバーの多
様性
委員長
ERM室担当役員
- 通信障害
委員
取締役常務執行役員以上者、常務執行役員、上席執行役員
- システム障害
事務局
ERM室
-
関連法規
-
グループ会社のガバナ
ンス
-
外為法
-
ハラスメント
-
個人情報保護法
-
内部通報制度
各本部にERM責任者を配置し、自部門のリスクに対して責任をもつ
コーポレート部門による助言・追加対策の立案機能をもつ
- データ保護法
内部監査部門によるリスク管理活動の評価
-
法令改正
ERM責任者
-
会計基準変更
-
敵対的買収
-
差別
-
健康・安全管理
-
労務問題
-
労働災害
-
交通事故
-
行動規範・
Code of Conduct
-
サステナビリティ・
環境保護
-
広告・プロモーション
-
知的財産権
-
予算オーバー
-
営業/運営
-
顧客満足
-
事業領域拡大への対
応力
-
サプライチェーン
-
評判
-
投資家との関係
-
ソーシャルメディア
-
誘拐・拘束
適切な指導・助言/追加対策の立案
- 誠実性
航空・インフラ
ヘルスケア
自動車
エレクトロニクス
産業機械
エナジー
ソリューションズ
-
賄賂や汚職
-
インサイダー取引
-
反社会的勢力との取引
-
品質問題
-
仕入先の品質管理体制
-
外部報告
-
決算報告・財務報告
-
重要な会計上の
見積り
-
外部報告の虚偽記載
-
開示統制の整備・
運用
-
内部統制評価
-
固定資産の価値の
減少(減損)
-
税務戦略
-
税務リスク
-
年金・基金
-
企画
-
予実管理
-
価格設定
-
業績評価(査定)
-
目標管理・
発揮能力評価制度
-
納期遅延
-
製造物責任
-
不良在庫
-
管理/運営
-
職場環境
-
人材育成・研修
データ
- 役職員の不正
プラント・
エネルギー
エンジニアリング本部
総務本部
経理本部
経営企画本部
1線
︵業務固有︶
デジタルイノベーションセンター
2線
︵業務共通︶
-
株主構成
-
後継者計画
-
変革への抵抗感
サステナビリティ戦略
▲ ▲ ▲
3線
-
ビジョン
-
社会人の基本
-
サイバー攻撃・
ハッキング
リスクマネジメント体制
2線
-
コンプライアンス
-
為替変動・為替予約
事業戦略
予見可能性などの観点からリスクの定性・定量的な評価を行い、回避、低減、移転、受容などの観点から対策を検討し
-
戦略
-
金利変動
-
輸送コスト
体系的アプローチを確立しました。
-
共通/運営
-
市場ニーズ
-
商社不要論
当社は、持続的な成長の実現を脅かすあらゆるリスク
(不確実性)
を統合的かつ効率的に把握・評価・管理する、組織的・
リスク管理委員会
-
財務
-
競合他社
-
商習慣
新たなリスク管理体制
1線
- 外部環境
意思決定情報リスク
価値創造
み付け、対応の優先順位付け、リスク対応、その後のモニタリングと改善を行う全社的リスクマネジメント体制(以下、
業務プロセスリスク
DAIICHI JITSUGYO CO., LTD.
DJKビジネスリスクモデル
Integrated Report 2026
リスクマネジメント
- アウトソーシング
- 固定資産管理
- 基幹システム導入の
QDC
099
当社への影響
影響への具体的な対応策
当社グループの主な事業は各種機械・器具・部品の販売及び各種機械・器具の賃貸等であり、国内販売並びに輸出入を行っております。
海外においては、2025年4月から2028年3月までの3年間にわたる中期経営計画「MT2027」において、世界5軸体制による海外事業
展開を加速させていくとともに、グローバル企業とのビジネス拡大を図り、収益力の強化に取り組んでおります。従いまして、国内はも
マクロ経済環境の
変化によるリスク
とより世界的な景気動向によっては、当社グループの業績が変動する可能性があります。米州、中国、インド、アジア、欧州の政治動向
又は経済動向は、当社グループの事業機会を拡大させる可能性がある一方で、各国に広がりつつある保護主義、中国や新興国経済の
成長鈍化、米中対立の影響による世界経済の減速懸念、世界的な地政学リスクの発現や米国の関税措置の影響による景気減速等、こ
サプライチェーンの再編や米国の政治動向、地域を問わない政治的・経済的紛争により投資が左右されることは当社グループの業績
した海外各国の当社グループ会社間での密なコミュニケーションにより、迅速な
情報の入手と展開を行う体制を構築しております。また、事業ポートフォリオの
機動性を活かして速やかに事業シフトを行うとともに、政治的不安定地域、経済
減速地域の取引先を最大限にサポートすることにより、業績悪化のリスクを最小
限にとどめる体制を敷いております。
に関わる重要度の高いリスクと認識しております。
我が国の企業は海外市場への進出や生産拠点の海外移転を依然進めております。これに対応し、当社グループも海外拠点の拡充等
価値創造
れらの地域における経済活動の停滞は当社グループの業績を悪化させる要因となる可能性もあります。とりわけ中国に偏りつつあった
当社グループでは、当社及び世界5軸体制による海外事業展開に伴い連携を強化
DAIICHI JITSUGYO CO., LTD.
事業等のリスク
Integrated Report 2026
事業等のリスク
によりグローバル化を推進し、ビジネスチャンスの拡大を図っております。それに向けて、商社としてのコーディネート力を活かし、国
海外売上高比率
増大に伴うリスク
内外の取引先に対して日本及び海外の商品やサービスの提供を支援し、クロスボーダー取引の展開にも注力しております。当連結会計
当社グループでは、当社グループのグローバルネットワークや幅広い取引先との
年度における連結売上高に占める海外売上高の割合は前期の52.6%から52.8%へと増加しており、今後も中期経営計画の着実な実行
関係を活かして迅速に情報・動向を把握し、最適な取引形態を選択することによ
により海外売上高比率は高まっていく傾向にあるものと予想されます。このため、国際的な金融環境、税制、為替レート動向、原油や
り収益減少のリスクを最小限にとどめるように努めております。
原材料価格・輸送費用の動向、顧客企業の生産拠点への設備投資動向等が当社グループの業績に影響を及ぼす可能性があります。ま
当社グループは、取引銀行5行と貸出コミットメント契約を締結し、必要に応じて資金を調達しております。当連結会計年度における当
金利・資金調達に
関わるリスク
社グループの有利子負債は74億95百万円となっており、今後も運転資金の機動的かつ安定的な調達と金利コストの削減を目指してま
当社グループでは、金融機関との良好な関係の継続や、適時の対話による機関投
いります。しかし、金融市場が不安定な場合や、当社グループの信用力の悪化により格付機関から当社グループに付与されている信用
資家との関係の構築と深化に努めるとともに、資金調達先の多様化を図っており
格付が引き下げられた場合等においては、当社グループにとって好ましい条件で適時に資金調達をできる保証はなく、当社グループの
ます。また、不測の事態に備えた資金政策や、良好な財政状態の維持による格
営業活動の制約要因となる可能性があるほか、当社グループの経営成績及び財政状態に影響を及ぼす可能性があります。また、今後
付けの維持や向上により、運転資金の機動的かつ安定的な調達、資金調達コス
の売上高及び金利動向によっては金融収支が悪化し、業績及び財政状態に影響を及ぼす可能性もあります。加えて、国内外の主要金
トや金利コストの削減に努めております。
当社グループでは、事業継続対策の一つとして十分な安全性を備えたデータセン
IT・システムリスク
当社グループの事業活動におけるシステム・ネットワークへの依存度は年々拡大しており、セキュリティの高度化、コンピュータシステム
ター及びクラウドサービスを利用しシステムやデータの保護を図っており、また、
データのバックアップ等によりシステムやデータの保護に努めておりますが、自然災害、コンピュータ・ウイルス、不正アクセス、電力供
役職員が使用するコンピュータ等の末端機器への監視システムを導入することで
給の制約や大規模停電、故障や不具合等によりシステムや通信ネットワークに甚大な障害が発生した場合、取引先との受発注業務をは
コンピュータ・ウイルスや不正アクセスへの対応を行っております。電力・通信イ
じめ、事業活動に支障をきたすほか、多額のコストや当社グループの評価に重大な影響を与え、業績及び財政状態に影響を及ぼす可
ンフラの不具合による事業活動への影響に対しては、当社が定める事業継続対
能性があります。
応マニュアルにおいて、速やかに通信が可能な地域へ移動し事業停止期間を最
サステナビリティ戦略
融市場において大きな混乱が生じた場合には、資金調達コストが増大する可能性もあります。
事業戦略
た、海外での事業活動には予期できない政治体制・経済環境の変動、法律・規制の変更等による社会的混乱等のリスクが存在します。
短に抑える等の対策を講じております。
当社グループのビジネスモデルは、設計・エンジニアリングの支援に始まり、最適な機械を選んで国内外の仕入先から調達し、据付、
事業の展開に関わる
ング商社」を目指して事業範囲をグローバルに拡大する中で、個々の取引が大型化、複雑化、長納期化しております。それに伴い、ク
ロスボーダー取引リスクの増加、大型工事案件の増加による事故の発生、法的責任や費用の発生、技術の陳腐化に伴う市場価値の下
落等のリスクが想定されます。
当連結会計年度末における当社グループの売上債権の合計額は480億37百万円と、総資産の27.4%を占めており、取引先の信用悪化
や経営破綻等により損失が発生する信用リスクを負っております。また、得意先からの商品及びサービスの受注に伴い、各種機械・器
与信リスク
具等の製造を各仕入先に対して発注しております。経済環境の悪化等による取引先の流動性危機、連鎖倒産、もしくは特定の大口与
信先の経営不安等が発生し債権が回収不能になった場合等、発生しうるリスクを完全に排除することはできず、当社グループの業績及
び財政状態に影響を及ぼす可能性があります。
当社グループでは十分な技量を備えたエンジニアの採用とその人事評価制度の
整備、経営企画本部内に設置したグローバル戦略推進部門や契約締結に関わる
法務・経営管理部門の強化等、リスク回避とビジネスチャンス獲得に向けた市場
への対応力、競争力を高める取り組みを行っております。
データ
リスク
稼働、メンテナンスまでを一括で請け負えることが強みであります。より付加価値の高いサービスを提供する「次世代型エンジニアリ
当社グループでは、取引権限やリスク管理に関する規程に則り、与信限度額・成
約限度額について必要な承認手続きを行うこと、与信先の信用状態に応じて必要
な担保・保証等の取り付けをすること、債権の流動化等のリスクヘッジを講じて
おります。
100
計画におけるリスク
影響への具体的な対応策
当社グループは、長期の成長戦略及び中期経営計画を策定しております。これらの戦略や計画は中長期に及ぶことから、従来の事業
当社グループでは、機能を強化している経営企画部門を中心として投資検討能力
においてここに記載しているリスクが潜在する期間も中長期にわたることに加え、積極的に推進を図っていく事業関連投資やその他
の向上によるリスクの最小化を図っており、投資実行後は、定期的検証に基づく進
投資においても、十分な効果が現れなかった場合には、当社グループの業績及び財政状態に影響を及ぼす可能性があります。
捗分析、変更是非の検討と判断、速やかな開示を行ってまいります。
地震、台風、火災、感染症の流行等の災害発生により、当社グループの事務所、工場、役職員などに対する被害が発生し、営業・生産
災害リスク
活動に支障が生じる可能性があるほか、重大な被害が発生した場合には、当社グループの業績および財政状態に影響を及ぼす可能性
事業継続計画基本書を策定しているほか、災害に対する事業継続対応マニュアル
があります。また、災害により当社グループの主要な取引先に重大な被害が発生した場合には、取引先の営業・生産活動の停滞が当
の作成、安否確認システムの導入、防災訓練などの対策を講じています。
DAIICHI JITSUGYO CO., LTD.
長期戦略や中期経営
当社への影響
Integrated Report 2026
事業等のリスク
社グループの業績を悪化させる要因となる可能性もあります。
影響額の算定、また継続的なモニタリングを行っていくと同時に、当社グループの
置かれたサプライチェーンにおいて、環境配慮製品やサービスを当社グループのお
昨今大きな影響が懸念されている気候変動に関して、当社グループでは、TCFDの提言にある種々のリスクが、当社グループのみなら
客様であるモノづくり企業へ提供することにより、脱炭素社会の実現と環境課題
サステナビリティに
ずサプライチェーンにおいても重要な影響を及ぼすものと認識しており、税負担の増大等による直接的かつ財務的な影響のみならず、
に積極的に取り組んでおります。また、気候変動に関連する課題以外でも、環境
関するリスク
取扱商品・製品の技術的問題や市場での需要の減少、それに伴う企業評価の低下等が当社グループの業績及び財政状態を悪化させ
破壊、人権、ダイバーシティ等に関連するさまざまな基準や市場の変化に伴って当
る要因となる可能性があります。
社グループのビジネス領域での需要や競争原理が変化し、それらの変化への対応
価値創造
当社グループではこの課題を専門的に取扱う組織体を設置し、シナリオの設定や
が遅れた場合には、当社グループの業績に影響を及ぼす可能性があると認識して
おり、グローバル企業が実施するさまざまなサプライチェーンデューデリジェンス
事業戦略
に適合する会社基準の策定に取り組んでおります。
2026年3月期におけるリスク管理活動
各本部においてリスクの洗い出し・評価を行い、重要リスクを選定した上で、リスク管理委員会において対応方針を審議・決定しています。決定した対応策については継続的にモニタリングを行い、その
結果を次年度のリスク評価・改善活動につなげることで、全社的なリスク管理の実効性向上を図っています。
活動内容
リスク洗い出し
P
リスク重み付け
P
重要リスク選定
P
対応者の選定
P
重要リスクと対応者の確定
P
対応策の立案
P
対応策の確定
D
対応策の実施
D
モニタリング
C
フィードバック
A
改善活動
4月
5月
6月
7月
8月
9月
10月
11月
12月
1月
2月
3月
データ
P
対応期日
サステナビリティ戦略
PDCA
101
ステークホルダーの 一つである地域社会 からの評価も、私 たち第一実業グループの 企業価値を高める重要な要素だと位置付けています。
DAIICHI JITSUGYO CO., LTD.
Integrated Report 2026
地域社会に向けた取り組み
そのため、ミッションの中にある「世界を豊 かに」という言葉を全社員 が心に刻み、社会をより豊 かにするための 活動を推進しています。
日本赤十字社(赤十字活動)への寄付
備蓄する水や食品の賞味期限が残り1年ほどになった際、フードバンク活動団体(セカンド
ハーベスト・ジャパン様など)へ寄付しています。フードバンク活動とは、包装の不具合や賞味
災害の有無にかかわらず、毎年、日本赤十字社へ寄付し
価値創造
防災備蓄品の寄付
ています。
期限が近いなどの理由で廃棄されてしまう食品を、福祉施設や生活困
窮者などへ無償提供する活動です。同団体への寄付を通じて、よりよ
災害支援
災害義援金の拠出
国内外において地震、津波、風水害などの大規模な自然災害が発生した際、被災された方々
の救援および被災地の復旧・復興支援を目的とした災害義援金を寄付しています。当社では
の支援として当社の取扱商材である「両側拡幅多目的トレー
ラー」を無償で貸与しました。
出が可能です。金額はガイドラインに沿って協議し、都度決定します。また、併せて役職員に
も寄付を募る活動を行っています。被災地域の活動に少しでも役立てていただけるよう、1日
も早い復旧・復興を願いながら支援していきます。
時期
災害名称/国
拠出先
拠出額
(千円)
1,000
日本赤十字社
2008年5月
四川大地震/中国
2008年6月
岩手・宮城内陸地震/日本
1,000
日本赤十字社
2011年3月
東日本大震災/日本
10,000
日本赤十字社
平成28年熊本地震/日本
10,000
熊本県
2018年7月
平成30年7月豪雨災害/日本
10,000
日本赤十字社
2019年10月
令和元年台風19号災害/日本
3,000
日本赤十字社
2020年7月
令和2年7月豪雨災害/日本
1,000
日本赤十字社
2023年3月
2023年トルコ・シリア地震/トルコ、
シリア
2,000
日本赤十字社、
駐日トルコ共和国大使館
2024年2月
令和6年能登半島地震/日本
5,000
日本赤十字社
2024年5月
2024年台湾東部沖地震/台湾
500 ※
日本赤十字社
2025年5月
2025年ミャンマー地震/ミャンマー
500
日本赤十字社
2026年8月
令和8年熊本地震/日本
5,000
日本赤十字社
※グループ会社の拠出を含む。
海外出張時に現地で使い残した外国コインを集め、日本
ユニセフ協会に寄付しています。
医療従事者への支援
第一実業ベリーズファーム(埼玉県入間郡毛呂山町)にて
データ
2016年4月
ユニセフ外国コイン募金活動
サステナビリティ戦略
災害義援金を拠出する際の判断基準となるガイドラインを定めているため、迅速かつ公正な拠
2024年1月に発災した能登半島地震において、医療活動
事業戦略
い社会につながることを願い、今後も寄付を継続していきます。
生産するイチゴを、毎年1月から3月頃に近隣の大学病院へ
寄付しています。
102
2025年度実績
れました。本制度は、障がいのある人もない人も、お互いを尊重し、支え合いながら地域の中
訪問校数
21校
訪問校数
24校
で共に生活する社会(共生社会)の実現に向けて、障がいおよび障がい者理解への取り組みを
講演数
26講演
講演数
29講演
対象児童数
2,498名
対象児童数
3,269名
積極的に行う企業・団体を東京都が認定するもの。当社が進める取り組みが評価され登録さ
れました。
賛同企業・団体一覧
https://www.fukushi1.metro.tokyo.lg.jp/tokyoheart/sandou.html
パラ・パワーリフティング体験会
東京本社と大阪支社にて開催し、社員が競技の魅力に触れるとともに、パラスポーツへの理
学校訪問
解促進と社内交流の活性化につなげる機会として実施しています。講師は、当社の社員で現役
子どもたちがパラスポーツ体験や選手との交流を通じて、多様性や共生社会への理解を深め
のパラ・パワーリフティング選手としても活躍する石原正治です。体験会では、パワーリフティ
る機会を提供しています。その一つが、NPO法人パラキャン※を通じた、学校訪問活動です。
ング初心者向けの体験だけでなく、経験者が持ち上げる重量を競う企画も。今後は、全国の
当社の社員で現役のパラアスリートでもある石原正治が小・中学校、高等学校などを訪問し、
各支店にも展開し、社員エンゲージメントの向上につなげていきます。
事業戦略
子どもたちに車いすバスケットボールを体験してもらう場を設けています。本活動への参加を
価値創造
特設サイト「ハートシティ東京」
DAIICHI JITSUGYO CO., LTD.
2026年3月に、東京都福祉局が推進する「共生社会の理念に賛同する企業・団体」に認定さ
訪問実績
2024年度実績
Integrated Report 2026
東京都福祉局による「共生社会の理念に賛同する企業(第2回)」に認定
通じて、サステナビリティを推進するとともに、当社の最も重要な資産である「人」を軸に、多
様性の実現と柔軟かつしなやかな人材の育成に取り組んでいきます。
※障がい者アスリートを講師に招き、学校や自治体でパラスポーツ(障がい者スポーツ)の体験プログラムを企画・
運営している団体
サステナビリティ戦略
パラ・パワーリフティング連盟への協賛
NPO法人日本パラ・パワーリフティング連盟に協賛していま
に、多様性と包摂性を尊重する社会の実現を推進します。
データ
す。本協賛を通じて、アスリートの皆様の挑戦を応援するととも
過去に協賛した大会
チャレンジカップ京都(2025年6月28・29日)
第26回全日本パラ・パワーリフティング国際招待選手権大会(2026年1月17・18日)
103
DAIICHI JITSUGYO CO., LTD.
Integrated Report 2026
価値創造
事業戦略
1 05 財務・非財務ハイライト
データ
Data
Section
サステナビリティ戦略
データ
1 07 11ヵ年連結財務サマリー
1 09 グループ会社一覧
1 1 0 会社概要/株式情報
104
連結財務ハイライト
受注高・売上高・営業利益(百万円)
総資産(百万円)・ROA ※1(%)
171,373
221,755
219,140
206,348 202,512
187,790
203,724
148,075
152,535
90,701
175,639
79,852
2,499.41
2,311.61
63,658
58,722
51.5
153,674
13,103
13,696
41.6
37.8
6,717
4.4
2022/3
2023/3
2024/3
受注高
売上高
営業利益
2025/3
2026/3
2022/3
2023/3
総資産
ROA
2024/3
2025/3
2026/3
2022/3
2023/3
純資産
2024/3
2025/3
2026/3
自己資本比率
キャッシュ・フロー(百万円)
5,882
26,782
0.10
0.09
2,585
2024/3
※2 ROE(自己資本当期純利益率)
2025/3
ROE
2026/3
2022/3
2026/3
1株当たりの配当金(円)・配当性向(%)
16,136
2023/3
有利子負債
2024/3
DER
※3 DER(D/Eレシオ)
2025/3
△409
2022/3
営業CF
40.1
71.0
59.3
1,221
660
△478
投資CF
28.9
△7,690
2024/3
33.0
△188
△860
△1,705
2023/3
48.3
△1,290
△4,569
2026/3
92.0
30,217 11,594
8,940
△1,742
△3,426
0.03
2023/3
2025/3
1株当たり当期純利益
2025/3
財務CF
現金および現金同等物の期末残高
2026/3
2022/3
30.1
30.2
2023/3
2024/3
1株当たりの配当金
2025/3
データ
0.08
9.6
親会社株主に帰属する当期純利益
51,829
0.13
10.3
2022/3
33,882
32,309
11.7
10.9
2024/3
1株当たり純資産額
サステナビリティ戦略
6,316
2023/3
311.77
7,495
7,339
7,461
5,363
2022/3
278.57
125.0
7,631
8,841
11.6
235.33
※2023年10月1日付けで普通株式1株につき3株の割合で株
式分割を行っており、合わせて過年度も調整後の数値を記
載しています。
有利子負債(百万円)・DER ※3(倍)
9,951
197.30
4.3
※1 ROA(総資産当期純利益率)
親会社株主に帰属する
当期純利益(百万円)・ROE ※2(%)
167.01
事業戦略
4.3
2,004.65
1,823.62
46.5
44.3
4.8
9,090
6,866
2,834.14
73,441
5.7
132,235
1株当たり純資産額・
1株当たり当期純利益(円)
価値創造
244,296
154,702
純資産(百万円)・自己資本比率(%)
193,795
DAIICHI JITSUGYO CO., LTD.
Integrated Report 2026
財務・非財務ハイライト
2026/3
配当性向
※2023年10月1日付けで普通株式1株につき3株の割合で株
式分割を行っており、合わせて過年度も調整後の数値を記
載しています。
105
非財務ハイライト
教育・研修費※1(千円/人)
/教育・研修時間※1(時間/人)
(単体)
従業員数/海外従業員数/技術者数(人)
(連結)
96
86
44
486
440
408
436
412
399
2023/3
海外従業員数
2024/3
2025/3
37.5
36.7
2025/3※1
2026/3
16.1
442
2026/3
技術者数
9.3
2022/3
2023/3
教育・研修費
教育・研修時間
2024/3
事業戦略
2022/3
88
495
464
461
5.4
従業員数
86
価値創造
1,319
1,258
1,564
1,467
1,402
DAIICHI JITSUGYO CO., LTD.
Integrated Report 2026
財務・非財務ハイライト
※1 2024/3までは人事部主催の教育時間、2025/3からは人事部主催の教育に加え各事業部での教育時間を含む。
サステナビリティ戦略
安全講習会実施日数 ※2(日)
管理職に占める女性労働者の割合(%)
(単体)
100
97
74
2.9
2.5
2.7
2.6
2.1
17
データ
※エンジニアリング本部発足以降の数値のため、
2022/3〜2023/3の数値はありません
16
6
2022/3
社外向け実施日数(日)
2023/3
社内向け実施日数(日)
2024/3
2025/3
2026/3
2022/3
2023/3
2024/3
2025/3
2026/3
割合(国内のみ)
※2 当社が講師として実施した日数
106
2016年 3月期 2017年 3月期 2018年 3月期 2019年 3月期 2020年 3月期 2021年 3月期 2022年 3月期 2023年 3月期 2024年 3月期 2025年 3月期 2026年 3月期
経営成績(百万円)
185,686
161,891
161,476
140,029
148,075
153,674
187,790
221,755
219,140
売上総利益
18,164
20,476
22,362
24,269
23,938
21,457
24,138
26,671
31,879
37,771
39,109
営業利益
3,886
5,844
6,394
7,573
6,998
5,729
6,866
6,717
9,090
13,103
13,696
当期純利益※1
2,637
3,338
4,730
4,457
4,876
4,754
5,363
6,316
7,461
8,841
9,951
包括利益
1,480
3,781
5,391
3,759
3,890
6,764
5,944
7,237
11,777
8,617
14,039
海外売上高※2
57,965
76,096
75,707
80,769
75,784
65,586
79,112
82,367
90,518
116,550
115,742
6,541
8,916
中国
19,335
16,231
21,940
31,407
28,287
23,207
37,719
30,581
31,881
28,025
26,422
アジア※3
25,575
37,402
36,539
32,124
32,998
23,868
25,108
30,121
28,736
25,802
34,105
米州
9,437
13,244
13,593
14,333
8,575
14,897
11,888
13,701
19,249
50,993
44,239
欧州
2,174
8,799
3,379
2,815
3,044
3,459
4,368
7,942
10,541
4,745
1,937
その他
1,443
418
254
87
2,877
152
27
20
110
442
120
減価償却費
847
850
805
774
890
883
774
1,033
1,134
1,145
1,155
設備投資額
968
937
525
387
1,166
1,050
720
837
874
769
914
総資産
94,767
116,681
102,379
112,561
111,486
119,958
132,235
152,535
193,795
171,373
175,639
運転資本
23,372
25,636
29,255
32,497
35,008
38,950
43,729
48,767
54,695
62,162
70,002
有利子負債
10,711
9,289
8,409
7,802
7,850
7,805
7,631
5,882
7,339
2,585
7,495
純資産
36,006
38,794
43,194
45,710
48,446
53,845
58,722
63,658
73,441
79,852
90,701
インド
サステナビリティ戦略
154,120
事業戦略
124,177
価値創造
売上高
DAIICHI JITSUGYO CO., LTD.
項目
Integrated Report 2026
11ヵ年連結財務サマリー
財政状態(百万円)
データ
※1 2016年3月期以降は親会社株主に帰属する当期純利益となります。
※2 仕向先ベースでの算出としています。
※3 2024年3月期以前はインドエリアの数値を含みます。
107
2016年 3月期 2017年 3月期 2018年 3月期 2019年 3月期 2020年 3月期 2021年 3月期 2022年 3月期 2023年 3月期 2024年 3月期 2025年 3月期 2026年 3月期
1株当たり情報 ※1(円)
1株当たり当期純利益
152.13
148.23
167.01
197.30
235.33
278.57
311.77
1株当たり配当金
28
31
35
36
43
43
48
59
71
92
125
1株当たり純資産
1,115.85
1,211.01
1,347.43
1,424.82
1,507.10
1,674.57
1,823.62
2,004.65
2,311.61
2,499.41
2,834.14
発行済株式数 ※1※2(千株)
32,191
31,944
31,970
31,965
32,078
32,074
32,127
31,676
31,717
31,882
31,929
従業員数(人)
1,064
1,097
1,134
1,167
1,209
1,229
1,258
1,319
1,402
1,467
1,564
売上総利益率
14.6
13.3
12.0
15.0
14.8
15.3
16.3
17.4
17.0
17.0
17.8
売上高営業利益率
3.1
3.8
3.4
4.7
4.3
4.1
4.6
4.4
4.8
5.9
6.3
売上高当期純利益率
2.1
2.2
2.5
2.8
3.0
3.4
3.6
4.1
4.0
4.0
4.5
総資産当期純利益率(ROA)
2.8
3.2
4.0
4.1
4.4
4.1
4.3
4.4
4.3
4.8
5.7
自己資本当期純利益率
(ROE)
7.4
9.0
11.6
10.1
10.4
9.3
9.6
10.3
10.9
11.6
11.7
総資産回転率(回)
1.33
1.46
1.69
1.51
1.44
1.21
1.17
1.08
1.08
1.21
1.26
流動比率
142.1
134.1
151.2
149.7
156.4
161.0
161.3
156.4
146.8
170.8
188.3
自己資本比率
37.9
33.2
42.1
40.5
43.4
44.8
44.3
41.6
37.8
46.5
51.5
D/Eレシオ(DER)
(倍)
0.30
0.24
0.20
0.17
0.16
0.15
0.13
0.09
0.10
0.03
0.08
その他情報
主要指標(%)
データ
139.44
サステナビリティ戦略
147.99
事業戦略
104.12
価値創造
82.06
DAIICHI JITSUGYO CO., LTD.
項目
Integrated Report 2026
11ヵ年連結財務サマリー
※1 2017年10月1日付けで普通株式5株につき1株の割合で株式併合を行っています。また、2023年10月1日付けで普通株式1株につき3株の割合で株式分割を行っており、合わせて過年度も調整後の数値を記載しています。
※2 発行済株式の総数から自己株式を控除しています。
108
事業内容
所在地
社名
所在地
事業内容
非連結子会社
連結子会社
ブラジル・
サンパウロ
産業用各種機械器具の販売
第一実業ビスウィル株式会社
大阪府吹田市
外観検査装置の開発・製造・販売
一實股份有限公司
台湾・台北
産業用各種機械器具の販売
株式会社DJ-WAVEエンジニアリング
東京都千代田区
各種プラント設備のプロセスシミュ
レーション・設計製作・調達・建設業務
壹机(上海)机械有限公司
中国・上海
産業用各種機械器具の修理・製造
DAIICHI JITSUGYO (AMERICA), INC.
米国・シカゴ
産業用各種機械器具の販売
DJK FACTORY SOLUTIONS
(PHILIPPINES), INC.
フィリピン・ラグナ
DJK GLOBAL MEXICO, S.A. DE C.V.
メキシコ・ケレタロ
産業用各種機械器具の販売
デモマシン・パーツ等の売買
実装機に使用する部品のメンテ
ナンス
DJK EUROPE GMBH
ドイツ・フランクフルト
産業用各種機械器具の販売
DJK ENGINEERING INDIA
PVT. LTD.
インド・
ニューデリー
産業用各種機械器具の製造・販売
上海一実貿易有限公司
中国・上海
産業用各種機械器具の販売
DJK CANADA, INC.
カナダ・トロント
産業用各種機械器具の販売
第一實業(香港)有限公司
中国・香港
産業用各種機械器具の販売
プラントデジタルエックス株式会社
東京都千代田区
各種プラント設備のプロセスシ
ミュレーション
第一実業(広州)貿易有限公司
中国・広州
産業用各種機械器具の販売
持分法適用関連会社
DAIICHI JITSUGYO ASIA PTE. LTD.
シンガポール
産業用各種機械器具の販売
株式会社浅野研究所
愛知県みよし市
プラスチックス真空成形機の製
造・販売
DAIICHI JITSUGYO
(THAILAND) CO., LTD.
タイ・バンコク
産業用各種機械器具の販売
持分法非適用関連会社
DAIICHI PROJECT SERVICE CO., LTD.
タイ・バンコク
建設の請負
東京都千代田区
産業用ポンプ、攪拌機および 関
連機器の輸入販売
DAI-ICHI JITSUGYO
(MALAYSIA) SDN. BHD.
マレーシア・
クアラルンプール
産業用各種機械器具の販売
DAIICHI JITSUGYO
(PHILIPPINES), INC.
フィリピン・
マカティ
産業用各種機械器具の販売
PT. DJK INDONESIA
インドネシア・
ジャカルタ
産業用各種機械器具の販売
DAIICHI JITSUGYO
(VIETNAM) CO., LTD.
ベトナム・ハノイ
産業用各種機械器具の販売
DAIICHI JITSUGYO INDIA PVT. LTD.
インド・ニューデリー
産業用各種機械器具の販売
第一スルザー株式会社
データ
DAIICHI JITSUGYO DO BRASIL
COMERCIO DE MAQUINAS LTDA.
サステナビリティ戦略
産業用各種機械器具の修理・製
造・販売
事業戦略
埼玉県川口市
価値創造
株式会社第一メカテック
DAIICHI JITSUGYO CO., LTD.
社名
Integrated Report 2026
グループ会社一覧
109
役員一覧
第一実業株式会社
代表取締役会長執行役員
宇野一郎
本社:
東京都千代田区神田駿河台四丁目6番地
代表取締役社長執行役員
船渡雄司
御茶ノ水ソラシティ 17階
取締役常務執行役員
府川治
設立:
1948年8月12日
取締役常務執行役員
上野雅敏
資本金:
5,105百万円
取締役常務執行役員
大槻信二
上場証券取引所: 東京証券取引所プライム市場
取締役常務執行役員
岡田尚一郎
山田奈美香
8059
支社:
大阪、名古屋
取締役(社外取締役)
中山和夫
支店:
仙台、広島、福岡、ソウル
取締役(社外取締役)
宮地克明
出張所:
富山
取締役監査等委員
豊泉隆宏
国内子会社:
3社
取締役監査等委員
(社外取締役)
小山充義
海外子会社:
20社
取締役監査等委員
(社外取締役)
小野亜希子
連結子会社:
17社
常務執行役員
青山重博
従業員数:
単体:725名
常務執行役員
小玉大二郎
上席執行役員
西井啓介
連結:1,564名
当社の事業内容、ニュースリ
リース、IR情報、サステナビ
リティ情報などの詳細をご覧
いただけます。
事業戦略
証券コード:
取締役(社外取締役)
コーポレートサイト
価値創造
商号:
アクセスはこちらから
https://www.djk.co.jp/
発行済株式の所有者別状況(千株未満四捨五入)
発行可能株式総数 96,000,000株
発行済株式の総数 32,759,200株
1単元の株式数 100株
株主数 5,454名
大株主
金融機関
個人・その他※2
32.2%
48.5%
持ち株数(千株)
出資比率 (%)
UHPartners2投資事業有限責任組合
3,039
9.52
日本マスタートラスト信託銀行株式会社(信託口)
2,691
8.43
UHPartners3投資事業有限責任組合
2,381
7.46
光通信KK投資事業有限責任組合
2,060
6.45
株式会社みずほ銀行
1,534
4.81
外国法人等
株式会社三井住友銀行
1,532
4.80
133名/ 3,299千株
発行済株式数
32,759千株
金融商品取引業者
0.8%
28名/ 250千株
10.1%
データ
※1 出資比率の算定に際し、発行済株式の総数から自己株式830千株を控除しています。
21名/ 10,533千株
5,195名/ 15,899千株
株主名
※1
サステナビリティ戦略
株式情報(2026年3月31日現在)
株式の状況
DAIICHI JITSUGYO CO., LTD.
会社概要
Integrated Report 2026
会社概要/株式情報
その他国内法人
8.4%
77名/ 2,778千株
※2「個人・その他」には自己株式830千株(2.5%)を含んでいます。
110
〒101-8222
東京都千代田区神田駿河台四丁目6番地御茶ノ水ソラシティ17階
TEL : 03-6370-8600(代) FAX : 03-6370-8601
https://www.djk.co.jp/