|
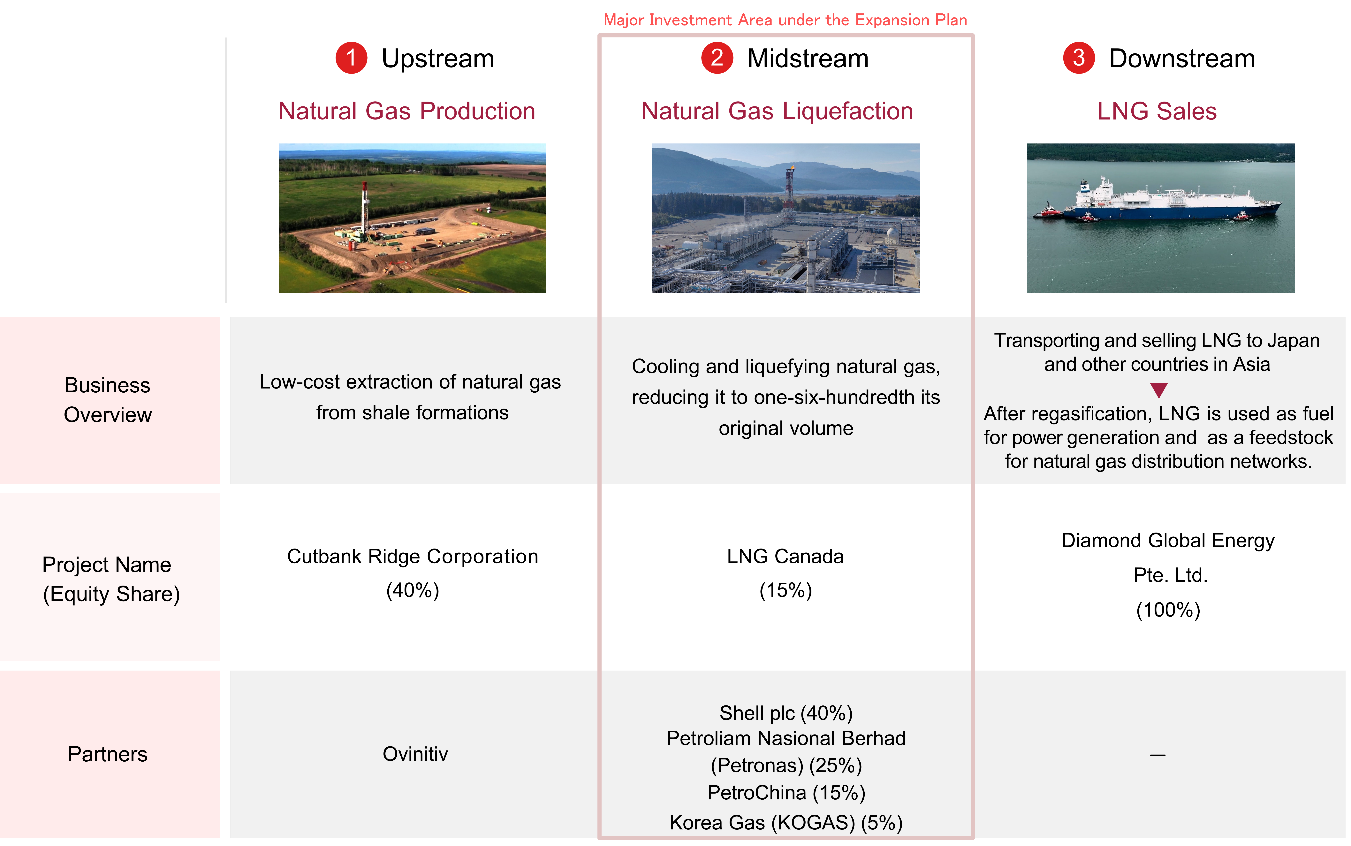
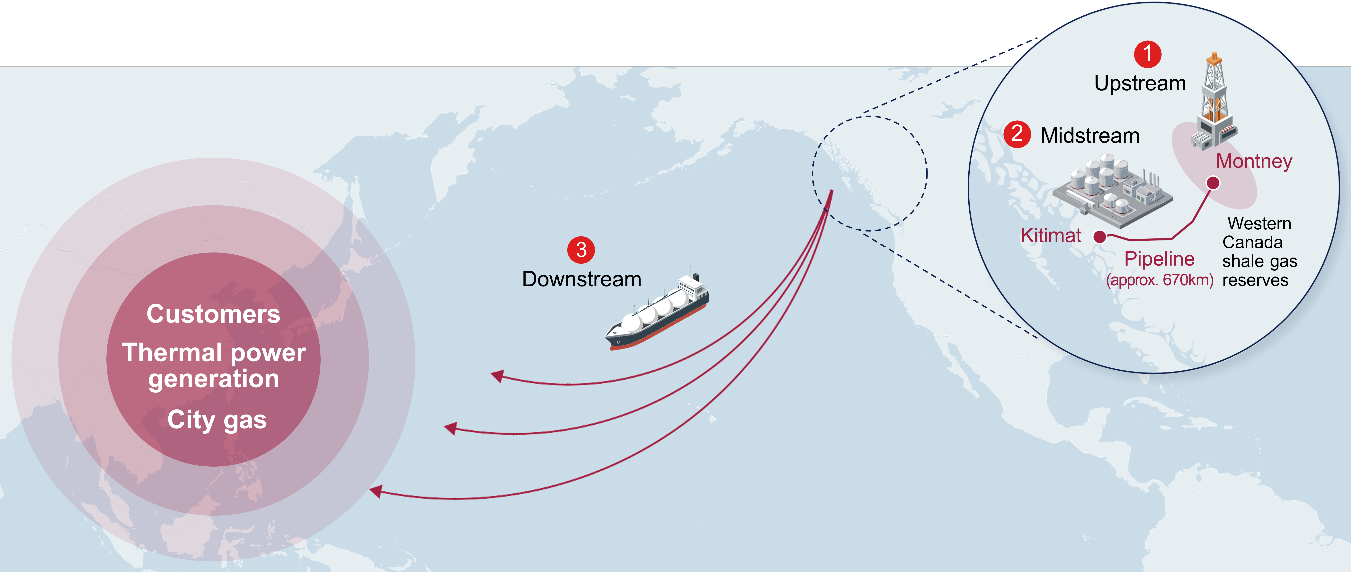
Mitsubishi Corporation is a diversified trading house operating through multiple business segments. Its core activities include energy, materials, metals, social infrastructure, mobility, food, and power solutions. In the energy sector, the company manages natural gas resources, LNG projects, and power generation through subsidiaries such as Mitsubishi Energy and Diamond Gas Holdings. The materials segment involves chemicals, plastics, and cement production via Mitsubishi Chemical and Mitsubishi Cement. Metals resources are handled through entities like Mitsubishi Corporation RTM International and Iron Ore Company of Canada. The social infrastructure division focuses on construction, urban development, and machinery rental, supported by Chiyoda Chemical Engineering and Mitsubishi Machinery Rental. Mobility operations include automotive sales and finance through Isuzu and Mitsubishi Motors affiliates. The food industry segment encompasses agricultural products, meat processing, and logistics, with key subsidiaries including Itoham, Olam Group, and Mitsubishi Food. Power solutions are provided through Mitsubishi Energy Solutions and Diamond Generating Corporation. The company serves global markets with a network of local subsidiaries in Europe, North America, and Asia. Summarised from the annual report, fiscal year ended Mar 2026 |
Industry Conglomerates | Homepage mitsubishicorp.com |
| Sector Industrials | IR page mitsubishicorp.com/jp/en/ir | |
|
Tags
trading house, energy, materials, metals, infrastructure, mobility, food, power solutions, chemicals, logistics, Mitsubishi Energy, CUTBANK DAWSON GAS RESOURCES, DGS JAPAN, DIAMOND GAS HOLDINGS, DIAMOND LNG CANADA, ASTMOS ENERGY, BRUNEI LNG, CAMERON LNG HOLDINGS, JAPAN AUSTRALIA LNG, Mitsubishi Chemical, Mitsubishi Plastics, Metal One, CAPE FLATTERY SILICA MINES, Saudi Petrochemical, Toyo Boseki MC, MCC DEVELOPMENT, METANOL DE ORIENTE, METORM, Mitsubishi Cement, JECO, Mitsubishi Corporation RTM International, MITSUBISHI DEVELOPMENT, ANGLO AMERICAN QUELLAVECO, ANGLO AMERICAN SUR, COMPANIA MINERA DEL PACIFICO, IRON ORE COMPANY OF CANADA, Chiyoda Chemical Engineering, Mitsubishi Urban Development, Mitsubishi Machinery Rental, Nikken, DIAMOND REALTY INVESTMENTS, MITSUBISHI ELEVATOR HONG KONG, DIPO STAR FINANCE, ISUZU UTE AUSTRALIA, MITSUBISHI MOTORS KRAMA YUDHA SALES INDONESIA, TRI PETCH ISUZU SALES, Mitsubishi Motors, TOYO TIRE, Mitsubishi Life Science, AGREX DO BRASIL, CERMAQ, INDIANA PACKERS, Itoham, Yakukin Holdings, OLAM GROUP, S.L.C., MC Healthcare Holdings, Mitsubishi Packaging, Mitsubishi Logistics, Mitsubishi Food, Japan Care Supply, Mitsubishi Auto Lease, Mitsubishi HC Capital, Life Corporation, Loyalty Marketing, Lawson, Mitsubishi Energy Solutions, DIAMOND GENERATING ASIA, DIAMOND GENERATING CORPORATION, ENECONEXAMP
|
Press page — |
Metrics
| Valuation | |
|---|---|
| Market cap | ¥ 17.206T |
| Market cap (USD) | $ 107.537B |
| P/E | 16.09 |
| PEG | — |
| P/BV | 1.64 |
| P/S | 0.83 |
| P/OCF | 8.38 |
| P/FCF | 10.59 |
| Dividend yield | 2.4% |
| Turnover / mcap | — |
| Returns | |
|---|---|
| ROE | 7.8% |
| ROI | 5.0% |
| ROIC | 5.0% |
| Profit margin | 4.2% |
| Growth | |
|---|---|
| Revenue growing | No |
| Profits growing | No |
| Revenue up 3y | No |
| Revenue up 5y | No |
| Earnings growth 3y (net profit CAGR) | -12.2% |
| Quality | |
|---|---|
| Profitable | Yes |
| Margin expanding | No |
| Buying back stock | No |
| Diluting (TTM) | No |
| Debt/Equity | — |
| Podcast bulls (TTM) | Sign up |
| Podcast bears (TTM) | Sign up |
| Podcast sentiment (TTM) | Sign up |
| Podcast sentiment % (TTM) | Sign up |
| News sentiment (TTM) | 0 |
| Quality score | -10.5% |
| Insiders | |
|---|---|
| Buys, 1w | Sign up |
| Buys, 1m | Sign up |
| Buys, 1y | Sign up |
| Sells, 1w | Sign up |
| Sells, 1m | Sign up |
| Sells, 1y | Sign up |
Sign up to see this company's insider trades
| Figure | FY 2026 | FY 2025 | FY 2024 | FY 2023 | FY 2022 | FY 2021 | FY 2020 | FY 2019 | FY 2018 | FY 2017 | FY 2016 | FY 2015 | FY 2014 | FY 2013 |
|---|---|---|---|---|---|---|---|---|---|---|---|---|---|---|
| Revenue | 18.916T | 18.618T | 19.568T | 21.572T | 17.265T | 12.885T | 14.78T | 16.104T | 7.567T | 6.426T | 6.926T | 7.669T | 7.635T | 6.01T |
| Net profit | 800.46B | 950.709B | 964.034B | 1.181T | 937.529B | 172.55B | 535.353B | 590.737B | 560.173B | 440.293B | -149.395B | 400.574B | 444.793B | 360.028B |
| Free cash flow | 1.137T | 1.274T | 826.838B | 1.475T | 662.011B | 628.569B | 523.714B | 337.167B | — | — | — | — | — | — |
| Figure | FY 2026 | FY 2025 | FY 2024 | FY 2023 | FY 2022 | FY 2021 | FY 2020 | FY 2019 | FY 2018 | FY 2017 | FY 2016 | FY 2015 | FY 2014 | FY 2013 |
|---|---|---|---|---|---|---|---|---|---|---|---|---|---|---|
| Share price | 5.317K | 2.626K | 3.487K | 4.753K | 4.599K | 3.13K | 2.292K | 3.073K | 2.861K | 2.405K | 2.42K | 2.42K | 1.917K | 1.743K |
| Price performance 12m | 1.02 | -0.25 | -0.27 | 0.03 | 0.47 | 0.37 | -0.25 | 0.07 | 0.19 | -0.01 | 0 | 0.26 | 0.1 | — |
Filed figures
Lines the statements and their notes report beside the headline figures, read from the filings' XBRL as filed (no restatement applied), with figures computed from one filing's own lines. Cash-flow lines carry their cash direction: an outflow is negative. Each period links to its filing; a figure's period, report date and tag are in its tooltip.
| Figure | Mar 2017 | Mar 2018 | Mar 2019 | Mar 2020 | Mar 2021 | Mar 2022 | Mar 2023 | Mar 2024 | Mar 2025 | Mar 2026 |
|---|---|---|---|---|---|---|---|---|---|---|
| Balance sheet detail | ||||||||||
| Trade receivables (JPY) | — | 3.52T | 3.72T | 3.17T | 3.27T | 4.28T | 4.13T | 4.24T | 4.17T | 4.19T |
| ↳ YoY growth | +5.7% | -14.9% | +3.2% | +31.0% | -3.6% | +2.8% | -1.8% | +0.4% | ||
| ↳ 5y CAGR | +3.2% | +2.7% | +5.6% | +5.1% | ||||||
| Borrowings, current (JPY) | — | 1.27T | 1.52T | 1.47T | 1.26T | 1.6T | 1.4T | 1.73T | 1.34T | 1.61T |
| Borrowings, non-current (JPY) | — | 3.68T | 3.57T | 4.29T | 4.38T | 4.04T | 3.49T | 3.39T | 3.28T | 4.14T |
| Lease liabilities (JPY) | — | — | 285B | 1.5T | 1.54T | 1.59T | 1.67T | 559B | 722B | 761B |
| Cash and deposits (JPY) | 1.15T | 1.01T | 1.16T | 1.32T | 1.32T | 1.56T | 1.56T | 1.25T | 1.54T | 1.84T |
| Intangible assets (JPY) | — | 615B | 632B | 896B | 816B | 768B | 748B | 446B | 461B | 576B |
| Right-of-use assets (JPY) | — | — | — | 1.43T | 1.47T | 1.52T | 1.59T | 456B | 689B | 721B |
| Net debt (borrowings + leases - cash) (JPY) | — | 3.95T | 3.93T | 5.94T | 5.87T | 5.68T | 5T | 4.44T | 3.8T | 4.67T |
| Cash flow detail | ||||||||||
| Operating cash flow (JPY) | 583B | 742B | 653B | 850B | 1.02T | 1.06T | 1.93T | 1.35T | 1.66T | 1.49T |
| Purchases of property, plant and equipment (JPY) | — | -277B | -316B | -326B | -389B | -394B | -455B | -521B | -384B | -353B |
| Change in inventories (cash effect) (JPY) | — | -60.3B | -20.1B | -73.4B | 41.7B | -236B | -12.9B | -71.6B | -37.9B | -66.1B |
| Dividends paid (cash effect) (JPY) | — | -154B | -198B | -198B | -200B | -204B | -229B | -293B | -342B | -406B |
| Interest paid (cash effect) (JPY) | — | -65.2B | -82.3B | -94.8B | -67.7B | -64.4B | -134B | -213B | -167B | -157B |
| Income taxes paid (cash effect) (JPY) | — | -197B | -258B | -185B | -115B | -157B | -340B | -474B | -146B | -237B |
| Free cash flow (OCF - PPE - intangibles) (JPY) | — | 465B | 337B | 524B | 629B | 662B | 1.48T | 827B | 1.27T | 1.14T |
| Income detail | ||||||||||
| Total comprehensive income (JPY) | — | 604B | 620B | 62.4B | 583B | 1.57T | 1.78T | 1.8T | 1.19T | 1.67T |
| Comprehensive income to owners (JPY) | 452B | 560B | 565B | 25.8B | 604B | 1.47T | 1.65T | 1.71T | 1.06T | 1.51T |
| Reported | Jun 23, 2017 | Jun 21, 2019 | Jun 19, 2020 | Jun 19, 2020 | Jun 25, 2021 | Jun 24, 2022 | Jun 23, 2023 | Jun 21, 2024 | Jun 18, 2025 | Jun 12, 2026 |
Sign up to see institutional holdings
Sign UpPodcast Mentions
Sign up to see podcast mentions and sentiment
Sign UpTimely disclosures published on TDnet, newest first, titles as filed in Japanese. The link opens the disclosure on TDnet. Filings with EDINET (periodic reports, extraordinary reports, offerings, holding and buy-back reports), newest first, titles as filed in Japanese. The link opens the filing on EDINET. Press releases from the company's own website, newest first.




Prompts
Click prompts to add them under the company line, click again to take one out, then copy the result into your AI chat. Shared by Asian Century Stocks and Uncovered Thai Stocks. Thank you.
Company History
Name and ticker changes, and re-registrations under a new regulatory id. When a ticker stopped being used is not recorded, so former tickers are undated.
| Date | Change | Detail |
|---|---|---|
| Jul 28, 2025 | Acquired | Acquired Mitsubishi Shokuhin Co., Ltd. (EDINET code E02558). Its filings from before the deal are on its own company page, not shown here. |
ETFs Holding Mitsubishi Corporation
Exchange-traded funds whose newest published daily portfolio holds one of the company's listings, largest weight first.
| ETF | Weight in ETF | Shares | Market value | As of |
|---|---|---|---|---|
| CGIE | 1.87% | 1,353,300 | $ 45.468M | Nov 16, 2026 |
| VDI | 1.14% | 6,200 | $ 186.111K | Jul 31, 2026 |
| CGDG | 0.97% | 1,733,600 | $ 58.245M | Nov 16, 2026 |
| ORR | 0.75% | 83,940 | $ 2.72M | Nov 18, 2026 |
| CGGE | 0.62% | 604,600 | $ 20.313M | Nov 16, 2026 |
| NTSI | 0.56% | 103,800 | $ 2.776M | Jun 30, 2026 |
| DWMF | 0.46% | 5,800 | $ 155.131K | Jun 30, 2026 |
| AIVI | 0.28% | 6,100 | $ 163.155K | Jun 30, 2026 |
| DFAI | 0.25% | 1,388,100 | $ 46.201M | Nov 12, 2026 |
| IVSI | 0.23% | 692 | $ 18.501K | Jun 30, 2026 |
| GEW | 0.22% | 10,815 | $ 325.229K | Aug 31, 2026 |
| AVDE | 0.17% | 991,700 | $ 33.183M | Nov 16, 2026 |
| DFIC | 0.13% | 605,000 | $ 20.136M | Nov 12, 2026 |
| DFAX | 0.11% | 394,500 | $ 13.13M | Nov 12, 2026 |
| DFIV | 0.09% | 605,418 | $ 20.15M | Nov 12, 2026 |
| DXIV | 0.01% | 800 | $ 26.627K | Nov 12, 2026 |