DISCLAIMER: This document has been translated from a part of the Japanese original for reference purposes only. In the event of any discrepancy between this translated document and the Japanese original, the original shall prevail. September 2,…
DISCLAIMER: This document has been translated from a part of the Japanese original for reference purposes only. In the event of any discrepancy between this translated document and the Japanese
original, the original shall prevail.
September 2, 2026
Consolidated Financial Results
for the Fiscal Year Ended July 20, 2026
(Under Japanese GAAP)
Company name:
Uchida Yoko Co.,Ltd.
Listing:
Tokyo Stock Exchange
Securities code:
8057
URL:
https://www.uchida.co.jp/
Representative:
Noboru Okubo, President and Chief Executive Officer
Inquiries:
Shoichiro Satoh, Director, Executive Managing Officer, and Executive Manager of Finance Management Group
Telephone:
+81-3-3555-4066
Scheduled date of annual general meeting of shareholders:
October 10, 2026
Scheduled date to commence dividend payments:
October 14, 2026
Scheduled date to file annual securities report:
October 9, 2026
Preparation of supplementary material on financial results:
Yes
Holding of financial results briefing:
Yes (for analysts)
(Yen amounts are rounded down to millions, unless otherwise noted.)
Consolidated financial results for the fiscal year ended July 20, 2026 (from July 21, 2025 to July 20, 2026)
(1) Consolidated operating results
(Percentages indicate year-on-year changes.)
Net sales
Fiscal year ended
Operating profit
Profit attributable to owners of
parent
Ordinary profit
Millions of yen
%
Millions of yen
%
Millions of yen
%
Millions of yen
%
July 20, 2026
425,729
26.3
15,631
28.4
16,770
27.8
12,486
27.1
July 20, 2025
337,055
21.3
12,174
30.3
13,126
29.5
9,825
40.4
Note: Comprehensive income For the fiscal year ended July 20, 2026:
For the fiscal year ended July 20, 2025:
¥18,052 million
¥8,144 million
Diluted earnings per
share
Basic earnings per share
[121.6%]
[(42.5)%]
Ratio of ordinary profit to
total assets
Return on equity
Ratio of operating profit
to net sales
Fiscal year ended
Yen
Yen
%
%
%
July 20, 2026
253.23
16.0
9.3
3.7
July 20, 2025
199.45
14.5
8.1
3.6
Reference: Share of profit (loss) of entities accounted for using equity method
For the fiscal year ended July 20, 2026:
¥171 million
For the fiscal year ended July 20, 2025:
¥104 million
Note: The Company conducted a 5-for-1 stock split of common shares effective January 21, 2026. Basic earnings per share was calculated assuming that the stock split had taken
place at the beginning of the fiscal year.
(2) Consolidated financial position
Total assets
As of
Net assets
Equity-to-asset ratio
Net assets per share
Millions of yen
Millions of yen
%
Yen
July 20, 2026
187,176
85,982
45.8
1,737.66
July 20, 2025
174,917
70,805
40.3
1,431.86
Reference: Equity
As of July 20, 2026:
As of July 20, 2025:
¥85,702 million
¥70,548 million
Note: The Company conducted a 5-for-1 stock split of common shares effective January 21, 2026.Net assets per share was calculated assuming that the stock split had taken place
at the beginning of the fiscal year.
(3) Consolidated cash flows
Cash flows from operating
activities
Fiscal year ended
Cash flows from investing
activities
Cash flows from financing
activities
Cash and cash equivalents at end
of fiscal year
Millions of yen
Millions of yen
Millions of yen
Millions of yen
July 20, 2026
13,069
(1,331)
(3,466)
31,364
July 20, 2025
549
(1,027)
(2,751)
23,071
Cash dividends
Annual dividends per share
First quarterend
Second quarterend
Third quarterend
Fiscal
year-end
Total cash
dividends (Total)
Total
Ratio of dividends
to net assets
(Consolidated)
Payout ratio
(Consolidated)
Yen
Yen
Yen
Yen
Yen
Millions of yen
%
%
Fiscal year ended
July 20, 2025
300.00
300.00
2,957
30.1
4.4
Fiscal year ended
July 20, 2026
76.00
76.00
3,750
30.0
4.8
76.00
76.00
Fiscal year ending
July 20, 2027
(Forecast)
35.7
Note: The Company conducted a 5-for-1 stock split of common shares effective January 21, 2026. The year-end dividend per share for the fiscal year ended July 20, 2026 and the yearend dividend per share for the fiscal year ending July 20, 2027 (forecast) are shown taking into account the impact of the stock split. The year-end dividend per share for the fiscal
year ending July 20, 2026 will be 380.00 yen and the year-end dividend per share for the fiscal year ending July 20, 2027 (forecast) will be 380.00 yen.
- Forecast of consolidated financial results for the fiscal year ending July 20, 2027 (from July 21, 2026 to July 20, 2027)
(Percentages indicate year-on-year changes.)
Net sales
Fiscal year ending
July 20, 2027
Operating profit
Profit attributable to
owners of parent
Ordinary profit
Basic earnings per share
Millions of yen
%
Millions of yen
%
Millions of yen
%
Millions of yen
%
Yen
400,000
(6.0)
15,000
(4.0)
16,000
(4.6)
10,500
(15.9)
212.89
- Notes
(1) Significant changes in the scope of consolidation during the fiscal year: None
(2) Changes in accounting policies, changes in accounting estimates, and restatement
(i)
Changes in accounting policies due to revisions to accounting standards and other regulations: None
(ii) Changes in accounting policies due to other reasons: None
(iii) Changes in accounting estimates: None
(iv) Restatement: None
(3) Number of issued shares (common shares)
(i)
(ii)
(iii)
Total number of issued shares at the end of the fiscal year (including treasury shares)
As of July 20, 2026
52,096,855 shares
As of July 20, 2025
52,096,855 shares
Number of treasury shares at the end of the fiscal year
As of July 20, 2026
2,776,344 shares
As of July 20, 2025
2,826,679 shares
Average number of shares outstanding during the fiscal year
Fiscal year ended July 20, 2026
49,310,698 shares
Fiscal year ended July 20, 2025
49,259,898 shares
Note: The Company has conducted a stock split with an effective date of January 21, 2026 at the ratio of 5 shares to 1 common share.
Assuming that the stock split occurred at the beginning of the previous fiscal year, the number of shares outstanding at the end of the
fiscal year, the number of treasury shares at the end of the fiscal year, and the average number of shares during the fiscal year are
calculated.
[Reference] Overview of non-consolidated financial results
1.
Non-consolidated financial results for the fiscal year ended July 20, 2026 (from July 21, 2025 to July 20, 2026)
(1) Non-consolidated operating results
(Percentages indicate year-on-year changes.)
Net sales
Fiscal year ended
Operating profit
Ordinary profit
Profit
Millions of yen
%
Millions of yen
%
Millions of yen
%
Millions of yen
%
July 20, 2026
219,696
40.8
6,285
27.1
11,608
28.2
10,459
26.7
July 20, 2025
156,060
15.5
4,943
71.3
9,055
52.8
8,254
67.4
Basic earnings per share
Diluted earnings per share
Fiscal year ended
Yen
Yen
July 20, 2026
212.00
July 20, 2025
167.49
Note: The Company has conducted a stock split with an effective date of January 21, 2026 at the ratio of 5 shares to 1 common share.
Assuming that the stock split occurred at the beginning of the previous fiscal year, basic earnings per share is calculated.
(2) Non-consolidated financial position
Total assets
As of
Net assets
Equity-to-asset ratio
Net assets per share
Millions of yen
Millions of yen
%
Yen
July 20, 2026
133,767
56,838
42.5
1,151.82
July 20, 2025
129,600
47,653
36.8
966.67
Reference: Equity
As of July 20, 2026:
As of July 20, 2025:
¥56,838 million
¥47,653 million
Note: The Company has conducted a stock split with an effective date of January 21, 2026 at the ratio of 5 shares to 1 common share. Assuming that
the stock split occurred at the beginning of the previous fiscal year, net assets per share are calculated.
- Financial results reports are exempt from audit conducted by certified public accountants or an audit firm.
- Proper use of earnings forecasts, and other special matters
The forward-looking statements, including forecasts of financial results, contained in these materials are based on information currently available
to the Company and certain assumptions deemed reasonable. However, the Company makes no assurances that these forecasts will be achieved.
Actual financial results and other results may differ materially due to various factors. For matters related to the above earnings forecasts and
forward-looking information, please refer to “Forward-Looking Information” on page 5 of the attached materials.
○Table of Contents of the Appendix
- Overview of Operating Results and Financial Position………………………………………………………………… 2
(1) Overview of Operating Results for current fiscal year………………………………………………………………… 2
(2) Overview of Financial Position for the current fiscal year……………….…………………………………………… 4
(3) Overview of Cash Flows fort the current fiscal year…………………………………………………………………… 4
(4) The current fiscal year and dividends for the next fiscal year………………………………………………………… 5
(5) Outlook for the Next Fiscal Year and Forward-Looking Information………………………………………………… 5
- Management Policies……………………………………………………………………………………………………. 6
(1) Basic Management Policies…………………………………………………………………………………………… 6
(2) Basic Policy on Distribution of Profits ………………………………………………………………………………… 6
(3) Target Management Indicators ………………………………………………………………………………………… 6
(4) Medium - to Long-term Management Strategies and Issues to be Addressed ………………………………………… 6
- Basic Approach to the Selection of Accounting Standards……………………………………………………………… 7
- Consolidated Financial Statements and Significant Notes Thereto……………………………………………………… 8
(1) Consolidated Balance Sheets ………………………………………………………………………………………… 8
(2) Consolidated statement of income and consolidated statement of comprehensive income …………………………… 10
(3) Consolidated Statements of Changes in Equity………………………………………………………………………… 12
(4) Consolidated Statements of Cash Flows ……………………………………………………………………………… 14
(5) Notes to Consolidated Financial Statements…………………………………………………………………………… 16
-Notes on Going Concern Assumption……………………………………………………………………………………16
-Notes on Segment information………………………………………………………………………………………… 16
-Notes on Per share information ………………………………………………………………………………………… 17
-Notes on Significant events after reporting fiscal year………………………………………………………………… 17
1.Overview of Operating Results and Financial Position
(1) Overview of Operating Results for the Current Fiscal Year
During the fiscal year under review, the Japanese economy was affected by rising energy prices, as well as concerns over the
procurement of raw materials and increases in raw material prices, due to the situation in the Middle East. However, capital
investment aimed at addressing labor shortages and promoting digitalization remained firm, and corporate earnings have
remained at a high level.
However, looking ahead, there are also risks that the domestic economy could face downside pressure due to further
increases in resource prices resulting from the stalemate in the situation in the Middle East, geopolitical turmoil spreading
worldwide, and sudden changes in monetary and fiscal policies in Japan and overseas, including the United States.
On the other hand, from a medium- to long-term perspective, it is becoming increasingly clear that the factor expected to
have the greatest impact on Japan is the transformation of its social structure resulting from the rapid decline in the birthrate.
A transition toward social and industrial structures adapted to a declining birthrate is indispensable, and the value of “people
and data” is expected to increase further. Japan is therefore required to mobilize resources from both within and outside the
country to maximize their utilization.
For 116 years, the Uchida Yoko Group has supported customers’ “work” and “learning” activities and accumulated knowhow through its various business units. In the fiscal year under review, which marks the second year of the 17th MediumTerm Management Plan, from the fiscal year ened July 20, 2025 to the fiscal year ending July 20, 2027, the Group
accelerated organizational restructuring through the reconfiguration of business units based on this accumulated know-how,
as well as management reforms aimed at strengthening collaboration. Through these initiatives, the Group sought to
contribute to social transformation by promoting its Group Vision of “Creating Value from Information and Co-Creating
Knowledge.”
During the fiscal year under review, amid increasing investment demand in Japan in both public and private markets that
support the utilization of “people and data,” the Group steadily captured this demand under the above policy, resulting in
strong business performance.
In the public market, GIGA School devices, which were introduced all at once in schools five years ago on a one-device-perstudent basis, entered a full-scale replacement period. Amid the larger-scale GIGA-related special demand in the fiscal year
under review, the Company demonstrated its capability to handle the entire process in an integrated manner, from device
procurement to kitting and deployment, and achieved implementation results that exceeded those of the previous GIGA
School device deployment cycle.At the same time, demand also expanded for large-scale projects to integrate learning and
administrative networks by implementing network enhancements and security measures to enable the smooth use of large
numbers of devices, and the Company increased its project wins.Meanwhile, in local government system standardization
projects being advanced in line with national guidelines, the Company steadily completed the work planned for the fiscal
year under review. In addition, in public facilities such as school facilities, local government facilities, and welfare facilities,
the Company’s proposals tailored to issues faced in the fields of education, administration, and welfare were highly
evaluated, leading to progress in project wins. As a result, in the public market as a whole, both net sales and profit
significantly exceeded expectations.
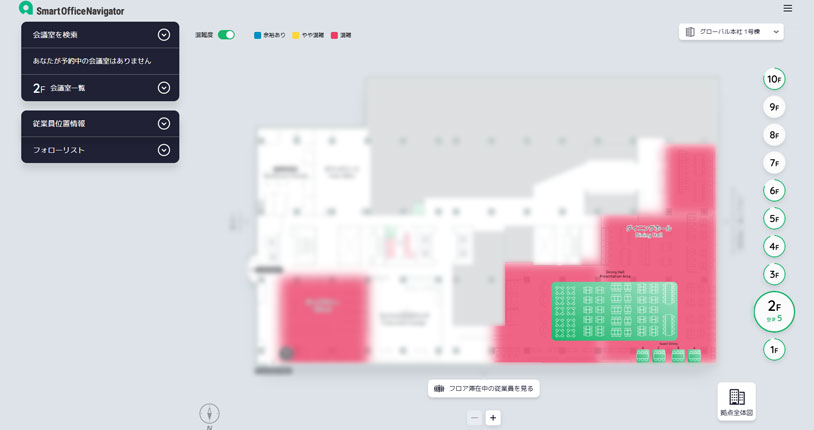
In the private market, the Company secured large-scale projects for solutions that visualize and utilize employee location
information and environmental data within offices, while the number of users of cloud-based meeting room reservation
support services also increased, ensuring stable revenue.
In the first half of the fiscal year under review, replacement demand associated with Windows upgrades continued from the
previous fiscal year. In software license projects for major companies, renewals of contracts with existing customers and new
large-scale projects progressed throughout the year. As a result, the major private-sector market, including the office
environment construction field, remained generally firm.
The Company also expanded efforts to strengthen its management foundation for future growth, including hiring personnel,
improving employee treatment through measures such as base salary increases, and enhancing workplace environments. In
addition, selling, general and administrative expenses increased as the Company proceeded with the introduction and
deployment of a common Group sales management system to strengthen Group management.
As a result, consolidated net sales for the fiscal year under review were 425,729 million yen, up 26.3% year on year;
operating profit was 15,631 million yen, up 28.4% year on year; ordinary profit was 16,770 million yen, up 27.8% year on
year; and profit attributable to owners of parent was 12,486 million yen, up 27.1% year on year. Net sales and all profit
categories reached record highs for the second consecutive fiscal year.
Net Sales
Gross Profit
Selling, general and
administrative expenses
Operating Profit
Ordinary Profit
Profit attributable to
owners of parent
Previous
Consolidated
Fiscal Year
337,055
52,387
40,213
Current
Consolidated
Fiscal Year
425,729
59,240
43,609
12,174
13,126
9,825
15,631
16,770
12,486
(Millions of yen)
Change
Change
Amount
Rate (%)
88,674
6,853
3,396
26.3
13.1
8.4
3,457
3,643
2,661
28.4
27.8
27.1
Operating results by segment are as follows.
Government and Education Business
Replacement demand for one device per student under the GIGA School Program reached its peak, resulting in concentrated
large-scale deployments throughout Japan. The Company leveraged the processing capacity of the kitting centers it had
expanded in the previous fiscal year, as well as its nationwide deployment capabilities, to smoothly carry out the
simultaneous deployment of devices.
In network renewal projects that integrate administrative and learning systems, the Company secured large-scale projects as
its proposals were highly evaluated for leveraging its design capabilities for large-scale device environments, technical
expertise and knowledge in security, and deep understanding of school environments. The Company also made progress in
receiving large-scale orders for prefecture-wide school administrative systems.
In local government system standardization projects, although more local governments than expected postponed projects to
the next fiscal year or later, the Company steadily completed work scheduled for the fiscal year under review as well as
many related welfare system projects.
In addition, amid demand for the establishment of new faculties and the reorganization of departments at universities to
develop science and engineering talent, as promoted by the government, the Company secured large-scale projects by
leveraging the know-how it has cultivated in handling everything from consulting to environment construction. Furthermore,
in school reconstruction and renovation projects aimed at supporting new forms of education, the Company made steady
progress in winning increasingly large-scale projects.
As a result, net sales were 161,038 million yen, up 73.6% year on year, and operating profit was 8,974 million yen, up 71.2%
year on year, representing substantial growth.
Office Business
As corporate earnings remained firm, companies continued to invest in creating comfortable office environments aimed at
securing and retaining human resources. Against this backdrop, demand for high-grade, large-scale projects also expanded in
the shared office and rental office fields, and the Company won numerous projects.
In addition, large-scale office investments, including office relocations, layout changes, and initiatives to enhance
communication, remained solid primarily in the Tokyo, Nagoya, and Osaka metropolitan areas. In regional areas, renovation
demand aimed at strengthening branch functions increased, and the Company won large-scale welfare facility projects, while
public-sector government building projects also performed steadily.
Although the Company steadily captured this demand, net sales were 59,172 million yen, down 0.4% year on year, due to the
reactionary decline from large-scale projects recorded in the previous fiscal year. On the other hand, operating profit was
2,132 million yen, up 7.3% year on year, reflecting the recovery of overseas markets and improved profitability in peripheral
office-related businesses.
Information Business
Among major private-sector companies, amid growing needs for infrastructure development with a view to AI and data
utilization, the Company made progress in securing large-scale system projects that visualize employee location information
and various data within office buildings in real time, in order to enhance communication among employees and understand
office utilization. Contracts for the Company’s meeting room operation support service, in which it holds a high market
share, also grew steadily.
In addition, IT service-related demand associated with the termination of Windows 10 support, which had continued from
the previous fiscal year, contributed to results in the first quarter of the fiscal year under review. Cloud-based subscription
software license contracts also continued to grow throughout the year.
On the other hand, in relatively highly profitable SI projects for small and medium-sized enterprises, many business
negotiations were postponed due to delays in the supply of servers and PCs caused by semiconductor shortages. In addition,
demand for business system renewals was in a transition period.
As a result, net sales were 204,447 million, up 11.3% year on year, and operating profit was 4,293 million yen, down 6.5%
year on year.
Other
The principal businesses in this segment are education and training services and staffing services. Although net sales were
1,071 million, down 10.2% year on year, group training programs and DX training services for private-sector companies
continued to perform steadily. Operating profit was 174 million yen, down 39.9% year on year.
(2) Overview of Financial Position for the Current Fiscal Year
(Assets, Liabilities, and Net Assets)
Current assets
Non-current assets
Total assets
Current liabilities
Non-current liabilities
Total liabilities
Total net assets
Equity-to-asset ratio (%)
Previous
Consolidated
Fiscal Year
131,642
43,274
174,917
92,319
11,793
104,112
70,805
40.3
Current
Consolidated
Fiscal Year
136,431
50,744
187,176
87,302
13,892
101,194
85,982
45.8
Change Amount
4,788
7,470
12,259
(5,017)
2,099
(2,917)
15,176
+5.5points
(Millions of yen)
Change Rate
(%)
3.6
17.3
7.0
(5.4)
17.8
(2.8)
21.4
・Current assets increased by 4,788 million yen in total, mainly due to an increase of 8,563 million yen in cash and deposits,
and decreases of 2,348 million yen in inventories and 1,898 million yen in notes and accounts receivable - trade, and
contract assets.
・Non-current assets increased by 7,470 million yen in total, mainly due to an increase of 5,189 million yen in retirement
benefit asset and an increase of 2,312 million yen in investment securities resulting from the fair value valuation of listed
securities.
・Current liabilities decreased by 5,017 million in total, mainly due to decreases of 12,023 million yen in trade payables and
3,056 million yen in accounts payable - other, despite increases of 6,784 million yen in contract liabilities, 1,960 million
yen in accrued consumption taxes, and 651 million yen in income taxes payable.
・Non-current liabilities increased by 2,099 million yen in total, mainly due to increases of 2,038 million yen in deferred tax
liabilities and 581 in provision for product warranties, and a decrease of 693 million yen in retirement benefit liability.
・Total net assets increased by 15,176 million yen, mainly due to the recording of profit attributable to owners of parent of
12,486 million yen, a decrease of 2,957 million yen resulting from dividends paid, increases of 3,431 million yen in
remeasurements of defined benefit plans and 1,654 million yen in valuation difference on available-for-sale securities
resulting from the fair value valuation of listed securities.
・As a result, the equity-to-asset ratio increased by 5.5 percentage points, from 40.3% at the end of the previous fiscal year to
45.8%.
(3) Overview of Cash Flows for the Current Fiscal Year
Cash flows from operating activities
Cash flows from investing activities
Cash flows from financing activities
Previous
Consolidated
Fiscal Year
549
△1,027
△2,751
Current
Consolidated
Fiscal Year
13,069
△1,331
△3,466
(Millions of yen)
Change Amount
12,520
△304
△715
Cash and cash equivalents at the end of the fiscal year under review increased by 8,292 million yen from the end of the previous
fiscal year to 31,364 million yen.
・Net cash provided by operating activities amounted to 13,069 million yen, compared with 549 million yen provided in the
previous fiscal year. This was mainly due to the recording of profit before income taxes of 18,009 million yen, compared
with 14,479 million yen in the previous fiscal year; an increase in contract liabilities of 6,783 million yen, compared with an
increase of 56 million yen in the previous fiscal year; a decrease in inventories of 2,414 million yen, compared with an
increase of 13,118 million yen in the previous fiscal year; and a decrease in trade receivables and contract assets of 1,949
million yen, compared with an increase of 14,555 million yen in the previous fiscal year. These factors were partially offset
by a decrease in trade payables of 12,051 million yen, compared with an increase of 18,334 million yen in the previous fiscal
year, and income taxes paid of 5,119 million yen, compared with 3,032 million yen in the previous fiscal year.
・Net cash used in investing activities amounted to 1,331 million yen, compared with 1,027 million yen used in the previous
fiscal year. This decrease was mainly due to cash outflows including payments of loans receivable of 1,263 million yen,
purchase of intangible assets of 1,072 million yen, and purchase of property, plant and equipment of 888 million yen, partially
offset by proceeds from sale of investment securities of 1,724 million yen.
・Net cash used in financing activities amounted to 3,466 million yen, compared with 2,751 million yen used in the previous
fiscal year. This decrease was mainly due to dividends paid of 2,957 million yen.
The following is a summary of changes in the Group's cash flow-related indicators.
Equity-to-asset
ratio (%)
Market value-based
equity ratio
Cash flow to interestbearing debt ratio
Interest coverage ratio
Fiscal year
ended July
2022
36.7%
Fiscal year
ended July
2023
39.2%
Fiscal year
ended July
2024
42.8%
Fiscal year
ended July
2025
40.3%
Fiscal year
ended July
2026
45.8%
38.0%
39.7%
53.9%
56.1%
55.4%
-
0.7 years
1.1 years
9.1 years
0.4 years
-
120.0 times
79.6 times
6.9 times
125.6 times
Equity-to-asset ratio: Equity / Total assets
Equity-to-asset ratio based on market value: Market capitalization / Total assets
Interest-bearing debt to cash flow ratio: Interest-bearing debt / Operating cash flow
Interest coverage ratio: Operating cash flow / Interest payments
•All indicators are calculated based on consolidated financial figures.
•Market capitalization is calculated by multiplying the closing share price at the end of the fiscal year by the number of
shares outstanding at the end of the fiscal year, excluding treasury shares.
•Operating cash flow is the cash flows from operating activities in the consolidated statement of cash flows. Interest-bearing
debt includes all liabilities recorded on the consolidated balance sheet on which interest is paid. Interest payments are based
on interest paid as stated in the consolidated statement of cash flows.
•The interest-bearing debt to cash flow ratio and interest coverage ratio for the fiscal year ended July 20, 2022 are not
presented because operating cash flow was negative.
(4) Dividends for the Current and Next Fiscal Years
In the current fiscal year, business performance significantly exceeded the initial forecast, resulting in a substantial increase in
profit attributable to owners of parent. Accordingly, the Company has decided to increase the ordinary dividend per share by
4.00 yen, from 72.00 yen per share announced on June 3, 2026, to 76.00 yen per share.
For the next fiscal year, the Company currently plans to continue paying a dividend of 76.00 yen, the same amount as the
dividend for the current fiscal year. However, the Company will make an appropriate decision based on a comprehensive
consideration of future earnings trends, the business environment, and other factors.
The basic policy on profit distribution is described in “2. Management Policies (2) Basic Policy on Profit Distribution.”
(5) Outlook for the Next Fiscal Year and Forward-Looking Information
For the next fiscal year, progress is expected in local government system standardization projects that were postponed from the
current fiscal year to the next fiscal year. However, replacement demand associated with the termination of Windows 10 support
is expected to subside, and only some device replacement projects related to the GIGA School Program are expected to remain.
On the other hand, business results in other areas that form the baseline of the Group’s performance are expected to steadily
expand, mainly in the private market. Accordingly, in terms of both net sales and profit, the Group plans to maintain a level
close to that of the current fiscal year, in which record-high profits were significantly renewed.
In the private market, investment in DX and talent acquisition is expected to remain strong. The Group expects growth in the
office environment construction business, as well as growth in the major private-sector ICT business and a recovery in business
system projects for small and medium-sized enterprises.
In the public market, the Group will proceed with local government system standardization projects. In addition, with a view
to utilizing data after the GIGA School Program, the Group will promote large-scale network construction, one of its strengths,
as well as the creation of learning environments that facilitate the use of ICT.
Based on these factors, the Group forecasts consolidated net sales of 400,000 million yen, down 6.0% year on year; operating
profit of 15,000 million yen, down 4.0% year on year; and ordinary profit of 16,000 million yen, down 4.6% year on year for
the next fiscal year. Profit attributable to owners of parent is also forecast at 10,500 million yen, down 15.9% year on year,
although the Group does not expect to record the gain on sale of investment securities that was recorded in the previous fiscal
year. The Group plans to maintain profit attributable to owners of parent at a level of at least the 10,000 million yen range.
The next fiscal year will be the final year of the 17th Medium-Term Management Plan. At the start of the plan, the Group
expected special demand to subside in the third year and projected net sales of 340,000 million yen and operating profit of
11,500 million yen. However, based on the circumstances described above, the earnings forecast for the next fiscal year is
expected to significantly exceed those level.
(Millions of yen)
Results for
the fiscal
year ended
July 20
2022
Net sales
221,856
Year-on-year change
76.2%
Operating income
7,890
Year-on-year change
76.1%
Profit*1
4,840
Year-on-year change
78.6%
*1 Profit attributable to owners of parent
Results for
the fiscal
year ended
July 20
2023
Results for
the fiscal
year ended
July 20
2024
Results for
the fiscal
year ended
July 20
2025
Results for
the fiscal
year ended
July 20
2026
Forecast for
the fiscal
year ending
July 20
2027
246,549
111.1%
8,436
106.9%
6,366
131.5%
277,940
112.7%
9,345
110.8%
6,996
109.9%
337,055
121.3%
12,174
130.3%
9,825
140.4%
425,729
126.3%
15,631
128.4%
12,486
127.1%
400,000
94.0%
15,000
96.0%
10,500
84.1%
Compared
to 2022
180.3%
190.1%
216.9%
The figures in the above forecasts are based on judgments and assumptions made in light of information currently available
to the Company. Changes in economic trends in Japan and overseas may have a significant impact on business performance.
We will disclose any major changes in the future as appropriate.
2. Management Policies
(1) Basic Management Policy
Based on its corporate philosophy of "Through the creation of environments conducive to innovation and creativity, we play
our part in building a better world for all and helping to deliver industrial prosperity and happiness for our employees." the
Group aims to be a company that earns the trust and satisfaction of all stakeholders in society, including shareholders, business
partners, and employees.
We have defined our corporate vision as "Creating value from data and Collaborating in the Design of knowledge," and have
made continuing to support our customers' growth the reason for our Group's existence. We aim to contribute to society and
enhance our corporate value.
(2) Basic Policy on Profit Distribution
With regard to shareholder returns, the Company’s basic policy is to aim for further expansion and enhancement of shareholder
returns, balancing “enhancement of financial base” and “investment for realization of medium- to long-term corporate
management strategies” on the premise of maintaining stable dividends.
Under this policy, the Company will implement a progressive dividend policy, under which it will, in principle, maintain or
increase the dividend level.
(3) Target Management Indicators
We aim to maintain a stable return on equity (ROE) of 10% or more while promoting investments for our own transformation
to respond to future market changes.
(4) Medium- to Long-Term Management Strategies and Issues to Be Addressed
The most significant impact on Japanese society going forward will be changes in the social structure caused by the rapid
decline in the birthrate in Japan. For Japan to achieve growth, it is essential to transform its social and industrial structures in
response to the declining birthrate. Investment in “people” and “data” will become increasingly important for transformation
that changes mechanisms together with the utilization of data.
Over its 116-year history, the Uchida Yoko Group has consistently worked to develop customers’ “work” and “learning” in both
the private and public markets. Through these efforts, the Group has developed both ICT-related businesses and environment
construction-related businesses, and has built numerous distinctive and unique business units. We believe that bringing together
the know-how accumulated across the Group’s diverse businesses to contribute to Japanese society, where the utilization of
people and data will be increasingly required, is both the Group’s social mission and a growth opportunity.
However, under the mere extension of conventional management practices, there were circumstances in which these valuable
resources could not be fully utilized. Therefore, in order to address the significant impact of Japan’s declining birthrate, which
is certain to materialize in the future, the Group began reforms in 2015 from a medium- to long-term perspective.
Under the 14th Medium-Term Management Plan, from the fiscal year ended July 20, 2016 to the fiscal year ended July 20,
2018, the Group adopted a perspective different from its conventional three-segment structure. In order to take a comprehensive
view of all businesses across the Company, the Group established a business portfolio based on four matrices: from the business
axis, ICT-related businesses and environment construction-related businesses, and from the market axis, the private market and
the public market. Based on this portfolio, the Group began sharing resources.
Under the 15th Medium-Term Management Plan, from the fiscal year ended July 20, 2019 to the fiscal year ended July 20,
2021, the sharing of resources enhanced flexibility and mobility, enabling the Group to respond more broadly and steadily than
before to the expansion in demand around 2020 and achieve record-high profits. This effect also proved effective during the
COVID-19 pandemic, allowing the Group to respond accurately and flexibly to rapid market changes, including GIGA School
Program projects and increased IT investments by major private companies. As a result, the Group achieved significant results
and raised the baseline of performance in each business field.
Under the 16th Medium-Term Management Plan, from the fiscal year ended July 20, 2022 to the fiscal year ended July 20,
2024, the Group proceeded with organizational restructuring mainly at Uchida Yoko Co., Ltd., while also beginning
preparations for restructuring across the entire Group. In addition to making consolidated listed subsidiary UCHIDA ESCO
Co., Ltd. a wholly owned subsidiary, the Group began making large-scale investments to build a common Group sales
management system. The Group also took on the challenge of overseas investment by acquiring a 100% interest in a software
development company in Luxembourg to achieve new growth.
Under the current 17th Medium-Term Management Plan, from the fiscal year ended July 20, 2025 to the fiscal year ending July
20, 2027, the Group aims to establish its unique competitive advantage by utilizing resources across the entire Group and
strengthening competitiveness through the mobilization of resources beyond segments, in order to bring together its ICT and
environment construction know-how in strategically important markets.
In the fiscal year ended July 20, 2026, the development of the common sales management system integrated across the Group
has progressed to the final group companies. The Group is also advancing a common Group framework and system
development for the reorganization and strengthening of system engineers in order to respond to the expected expansion of data
utilization going forward.
In the fiscal year ending July 20, 2027, in the major private-sector ICT business, where growth is expected, the Group will
effectively integrate operations across Group companies and promote customer development in coordination with the Office
Business.
In the public market, based on the significant results achieved through the GIGA School Program and local government system
standardization projects, the Group will strengthen its structure to bring together the strengths of its education ICT business
and local government business. Through these initiatives, the Group will contribute to Japanese society by promoting its Group
Vision of “Creating Value from Information and Co-Creating Knowledge.”
3. Basic Policy on Selection of Accounting Standards
Taking into consideration the comparability of consolidated financial statements across periods and among companies, the
Group's policy is to prepare its consolidated financial statements in accordance with Japanese GAAP for the time being.
With regard to the application of IFRS, the Group intends to respond appropriately after considering developments in Japan
and overseas.
- Consolidated Financial Statements and Significant Notes Thereto
(1)Consolidated balance sheet
(Millions of yen)
As of July 20, 2025
As of July 20, 2026
Assets
Current assets
Cash and deposits
25,872
34,436
Notes and accounts receivable - trade, and contract assets
69,634
67,735
Securities
1,500
1,500
Merchandise and finished goods
14,326
10,290
Work in process
15,588
17,161
Raw materials and supplies
614
728
Short-term loans receivable
310
1,515
Other
3,854
3,145
Allowance for doubtful accounts
(58)
(83)
131,642
136,431
13,787
14,197
Accumulated depreciation
(10,749)
(10,957)
Buildings and structures, net
3,037
3,239
Machinery, equipment and vehicles
2,132
2,305
Accumulated depreciation
(1,856)
(1,890)
276
415
Tools, furniture and fixtures
7,068
6,849
Accumulated depreciation
(6,245)
(5,922)
823
927
310
352
Accumulated depreciation
(202)
(188)
Leased assets, net
108
163
Land
6,381
6,429
Total property, plant and equipment
10,627
11,174
Software
3,190
2,831
Other
33
24
3,224
2,855
19,479
21,791
Long-term loans receivable
197
Retirement benefit asset
6,954
12,143
Deferred tax assets
1,359
1,332
Other
1,557
1,572
Allowance for doubtful accounts
(125)
(126)
Total investments and other assets
29,423
36,714
43,274
50,744
174,917
187,176
Total current assets
Non-current assets
Property, plant and equipment
Buildings and structures
Machinery, equipment and vehicles, net
Tools, furniture and fixtures, net
Leased assets
Intangible assets
Total intangible assets
Investments and other assets
Investment securities
Total non-current assets
Total assets
(Millions of yen)
As of July 20, 2025
As of July 20, 2026
Liabilities
Current liabilities
Notes and accounts payable - trade
50,775
41,889
Electronically recorded obligations - operating
8,213
5,076
Short-term borrowings
1,970
1,910
Accrued expenses
5,579
5,589
Accounts payable - other
4,661
1,604
Income taxes payable
3,242
3,893
579
2,540
12,096
18,880
306
205
3,116
3,274
52
218
Other
1,725
2,219
Total current liabilities
92,319
87,302
2,821
4,860
581
Retirement benefit liability
6,012
5,319
Asset retirement obligations
238
362
Other
2,719
2,768
Total non-current liabilities
11,793
13,892
104,112
101,194
Share capital
5,000
5,000
Capital surplus
80
171
Retained earnings
57,146
66,675
Treasury shares
(1,366)
(1,342)
Total shareholders' equity
60,860
70,503
7,702
9,356
Foreign currency translation adjustment
486
912
Remeasurements of defined benefit plans
1,498
4,929
Total accumulated other comprehensive income
9,687
15,198
257
279
Total net assets
70,805
85,982
Total liabilities and net assets
174,917
187,176
Accrued consumption taxes
Contract liabilities
Provision for product warranties
Provision for bonuses
Provision for loss on construction contracts
Non-current liabilities
Deferred tax liabilities
Provision for product warranties
Total liabilities
Net assets
Shareholders' equity
Accumulated other comprehensive income
Valuation difference on available-for-sale securities
Non-controlling interests
(2)Consolidated statement of income
(Millions of yen)
Fiscal year ended
July 20, 2025
Fiscal year ended
July 20, 2026
Net sales
337,055
425,729
Cost of sales
284,668
366,489
Gross profit
52,387
59,240
Selling, general and administrative expenses
40,213
43,609
Operating profit
12,174
15,631
Interest income
108
172
Dividend income
563
606
Share of profit of entities accounted for using equity method
104
171
Rental income from real estate
27
25
Other
314
344
1,118
1,320
Interest expenses
80
104
Rental expenses on real estate
14
12
Loss on retirement of non-current assets
12
17
Bad debt expenses
25
Other
32
47
Total non-operating expenses
166
181
13,126
16,770
Gain on sale of investment securities
1,353
1,279
Total extraordinary income
1,353
1,279
Loss on valuation of shares of subsidiaries and associates
39
Total extraordinary losses
39
Profit before income taxes
14,479
18,009
Income taxes - current
4,366
5,717
Income taxes - deferred
245
(249)
Total income taxes
4,612
5,468
Profit
9,867
12,541
42
54
9,825
12,486
Non-operating income
Total non-operating income
Non-operating expenses
Ordinary profit
Extraordinary income
Extraordinary losses
Profit attributable to non-controlling interests
Profit attributable to owners of parent
Consolidated statement of comprehensive income
(Millions of yen)
Fiscal year ended
July 20, 2025
Profit
Fiscal year ended
July 20, 2026
9,867
12,541
Valuation difference on available-for-sale securities
(747)
1,621
Foreign currency translation adjustment
(302)
425
Remeasurements of defined benefit plans, net of tax
(683)
3,431
11
32
Total other comprehensive income
(1,722)
5,511
Comprehensive income
8,144
18,052
Comprehensive income attributable to owners of parent
8,102
17,997
Comprehensive income attributable to non-controlling
interests
42
54
Other comprehensive income
Share of other comprehensive income of entities accounted
for using equity method
Comprehensive income attributable to
(3)Consolidated statement of changes in equity
Fiscal year ended July 20, 2025
(Millions of yen)
Shareholders' equity
Share
capital
Balance at beginning of fiscal
year
Capital
surplus
5,000
Retained
earnings
34
Treasury
shares
49,487
(1,391)
Total
shareholders'
equity
53,131
Changes during fiscal year
Dividends of surplus
(2,166)
(2,166)
Profit attributable to owners of
parent
9,825
9,825
Purchase of treasury shares
Disposal of treasury shares
46
(1)
(1)
26
72
Net changes in items other than
shareholders' equity
Total changes during fiscal year
Balance at end of fiscal year
46
7,658
24
7,729
5,000
80
57,146
(1,366)
60,860
Accumulated other comprehensive income
Valuation
difference
on
availablefor-sale
securities
Balance at beginning of fiscal
year
8,438
Total
NonForeign
Remeasurements
accumulated controlling Total net
currency
assets
of defined benefit
other
interests
translation
plans
comprehensive
adjustment
income
788
2,182
11,409
247
64,788
Changes during fiscal year
Dividends of surplus
(2,166)
Profit attributable to owners of
parent
9,825
Purchase of treasury shares
(1)
Disposal of treasury shares
72
Net changes in items other than
shareholders' equity
(736)
(302)
(683)
(1,722)
9
(1,712)
Total changes during fiscal year
(736)
(302)
(683)
(1,722)
9
6,016
7,702
486
1,498
9,687
257
70,805
Balance at end of fiscal year
Fiscal year ended July 20, 2026
(Millions of yen)
Shareholders' equity
Share
capital
Balance at beginning of fiscal
year
Capital
surplus
5,000
Retained
earnings
80
Treasury
shares
Total
shareholders'
equity
(1,366)
60,860
57,146
Changes during fiscal year
Dividends of surplus
(2,957)
(2,957)
Profit attributable to owners of
parent
12,486
12,486
Purchase of treasury shares
Disposal of treasury shares
90
(1)
(1)
24
115
Net changes in items other than
shareholders' equity
Total changes during fiscal year
Balance at end of fiscal year
90
9,528
23
9,643
5,000
171
66,675
(1,342)
70,503
Accumulated other comprehensive income
Valuation
difference
on
availablefor-sale
securities
Balance at beginning of fiscal
year
7,702
Total
NonForeign
Remeasurements accumulated controlling Total net
currency
assets
of defined benefit
other
interests
translation
plans
comprehensive
adjustment
income
486
1,498
9,687
257
70,805
Changes during fiscal year
Dividends of surplus
(2,957)
Profit attributable to owners of
parent
12,486
Purchase of treasury shares
(1)
Disposal of treasury shares
115
Net changes in items other than
shareholders' equity
1,654
425
3,431
5,511
22
5,533
Total changes during fiscal year
1,654
425
3,431
5,511
22
15,176
9,356
912
4,929
15,198
279
85,982
Balance at end of fiscal year
(4)Consolidated statement of cash flows
(Millions of yen)
Fiscal year ended
July 20, 2025
Fiscal year ended
July 20, 2026
Cash flows from operating activities
Profit before income taxes
14,479
18,009
Depreciation
1,950
2,244
Increase (decrease) in allowance for doubtful accounts
(16)
23
Increase (decrease) in provision for product warranties
(397)
480
Increase (decrease) in provision for loss on construction
contracts
17
166
Decrease (increase) in retirement benefit asset
(903)
(638)
Increase (decrease) in retirement benefit liability
(81)
(234)
Interest and dividend income
(672)
(779)
80
104
Share of loss (profit) of entities accounted for using equity
method
(104)
(171)
Loss on valuation of shares of subsidiaries and associates
39
Loss (gain) on sale of investment securities
(1,353)
(1,279)
Decrease (increase) in accounts receivable - trade, and
contract assets
(14,555)
1,949
Decrease (increase) in inventories
(13,118)
2,414
Increase (decrease) in trade payables
18,334
(12,051)
Increase (decrease) in contract liabilities
56
6,783
Increase (decrease) in accrued expenses
(64)
1
Increase (decrease) in accounts payable - other
(8)
(3,249)
Increase (decrease) in accrued consumption taxes
(564)
1,960
Other, net
(118)
1,719
Subtotal
2,960
17,495
Interest and dividends received
679
789
Interest paid
(80)
(104)
(3,032)
(5,119)
Income taxes refund
22
8
Net cash provided by (used in) operating activities
549
13,069
Interest expenses
Income taxes paid
(Millions of yen)
Fiscal year ended
July 20, 2025
Fiscal year ended
July 20, 2026
Cash flows from investing activities
Payments into time deposits and other
(188)
(306)
Proceeds from withdrawal of time deposits and other
200
257
Purchase of property, plant and equipment
(725)
(888)
0
1
(1,243)
(1,072)
Purchase of investment securities
(108)
(3)
Proceeds from sale of investment securities
1,210
1,724
Loan advances
(311)
(1,263)
Proceeds from collection of loans receivable
144
255
Other, net
(5)
(36)
(1,027)
(1,331)
Net increase (decrease) in short-term borrowings
(160)
(60)
Repayments of lease liabilities
(390)
(415)
(2,166)
(2,957)
Dividends paid to non-controlling interests
(32)
(32)
Purchase of treasury shares
(1)
(1)
(2,751)
(3,466)
13
21
Net increase (decrease) in cash and cash equivalents
(3,214)
8,292
Cash and cash equivalents at beginning of fiscal year
26,286
23,071
Cash and cash equivalents at end of fiscal year
23,071
31,364
Proceeds from sale of property, plant and equipment
Purchase of intangible assets
Net cash provided by (used in) investing activities
Cash flows from financing activities
Dividends paid
Net cash provided by (used in) financing activities
Effect of exchange rate change on cash and cash equivalents
(5) Notes to Consolidated Financial Statements
Notes on Going Concern Assumption
No items to be reported
Notes on Segment information
Segment Information
1 Overview of Reporting Segments
The Group's reporting segments consist of segments that take into account similarities between products and services and sales
markets, and are subject to periodic review by the Board of Directors in order to determine the allocation of management resources
and evaluate business performance.
The details of the business for each reporting segment for the current fiscal year are as follows.
Government and Education Business is engaged in the construction and sale of ICT systems to universities, elementary, junior high,
and high school markets, the manufacture and sale of educational equipment, the design and sale of space design and furniture to
educational facilities, the core business of government agencies and local governments, the construction of ICT systems, and the
manufacture, sale, design, and construction of office-related furniture.
Office Business, manufactures, and sells office-related furniture for the private and public markets, designs, designs, and constructs
spaces, sells ICT equipment, and manufactures and sells office machinery and hobby craft-related products.
Information Business is engaged in the design and construction of mission-critical systems for companies, the design, construction,
maintenance, and sale of ICT equipment and network systems, and the provision and sale of software licenses and ICT asset
management.
2. Method of calculating the amount of sales, profits or losses, assets, liabilities, and other items for each reporting segment
The method of accounting for the reported business segments is generally the same as described in the "Fundamental Important
Matters for the Preparation of Consolidated Financial Statements".
Profit in the reporting segment is a figure based on operating income. Internal revenues and transfers between segments are based
on prevailing market prices.
3. Information on the amount of sales, profits or losses, assets, liabilities, and other items for each reporting segment
The previous fiscal year (July 21, 2024 to July 20, 2025)
(Millions of yen)
Reportable segments
Government
and
Office Information
Education Business Business
Business
Total
Other
(Note)
1
Total
Amount
recorded in
Adjustments consolidated
(Note) 2
financial
statements
(Note)3
Net Sales
Sales to external customers
92,781
59,419
183,661
335,862
1,192
337,055
337,055
84
274
181
540
5,694
6,234
(6,234)
92,865
59,694
183,843
336,402
6,887
343,290
(6,234)
337,055
Segment Profit
5,240
1,987
4,591
11,819
290
12,109
64
12,174
Segment Assets
48,063
28,725
67,183
143,972
4,060
148,032
26,884
174,917
1,045
540
294
1,880
70
1,950
1,950
1,034
527
396
1,959
16
1,975
1,975
Intersegment sales or transfers
Total
Other items
Depreciation
Impairment losses
Increase in property, plant and
equipment and
intangible assets
Note: 1 The "Other" category consists of business segments not included in the reporting segments and includes education and
training business, staffing service business,
real estate leasing business, and others.
2 The adjustment amount is as follows:
(1) The amount of adjustment for segment profit is the elimination of inter-segment transactions.
(2) The main items of the adjusted segment assets of 26,884 million yen are cash and deposits of the parent company
and investment securities that have not been allocated to each reporting segment.
3 Segment profit is adjusted to operating income in the consolidated statements of income.
The current fiscal year (July 21, 2025 to July 20, 2026)
(Millions of yen)
Reportable segments
Government
and
Office Information
Education Business Business
Business
Total
Other
(Note)
1
Total
Amount
recorded in
Adjustments consolidated
(Note) 2
financial
statements
(Note)3
Net Sales
Sales to external customers
161,038
59,172
204,447
424,658
1,071
425,729
425,729
84
242
120
447
6,038
6,485
(6,485)
161,122
59,415
204,567
425,105
7,109
432,215
(6,485)
425,729
Segment Profit
8,974
2,132
4,293
15,399
174
15,574
56
15,631
Segment Assets
53,391
31,018
65,729
150,139
4,171
154,310
32,866
187,176
1,217
616
353
2,187
57
2,244
2,244
1,014
832
382
2,230
21
2,251
2,251
Intersegment sales or transfers
Total
Other items
Depreciation
Impairment losses
Increase in property, plant and
equipment and
intangible assets
Note: 1 The "Other" category consists of business segments not included in the reporting segments and includes education and
training business, staffing service business, real estate leasing business, and others.
2 The adjustment amount is as follows:
(1) The amount of adjustment for segment profit is the elimination of inter-segment transactions.
(2) The main items of the adjusted segment assets of 32,866 million yen are cash and deposits of the parent company
and investment securities that have not been allocated to each reporting segment.
3 Segment profit is adjusted to operating income in the consolidated statements of income.
Notes on Per share information
item
Previous Fiscal Year
(From July 21, 2024
to July 20, 2025)
Current Fiscal Year
(From July 21, 2025
to July 20, 2026)
Net assets per share
1,431.86 yen
1,737.66 yen
Net earnings per share
199.45 yen
253.23 yen
Note: 1 Diluted earnings per share are not presented because the company has no securities with dilutive effects.
2 The Company has conducted a stock split with an effective date of January 21, 2026 at the ratio of 5 shares to 1 common share.
Assuming that the stock split occurred at the beginning of the previous fiscal year, net assets per share and net earnings per
share are calculated.
3 The basis for calculating the current fiscal year profit per share is as follows:
item
Previous Fiscal Year
(From July 21, 2024
to July 20, 2025)
Profit attributable to owners of parent (millions of yen)
Current Fiscal Year
(From July 21, 2025
to July 20, 2026)
9,825
Amounts not attributable to common shareholders
(millions of yen)
12,486
Profit attributable to owners of parent attributable to
common shares (millions of yen)
9,825
12,486
Average number of common shares outstanding during
the fiscal year (Thousand shares)
49,259
49,310
Notes on Significant events after reporting fiscal year
No items to be reported


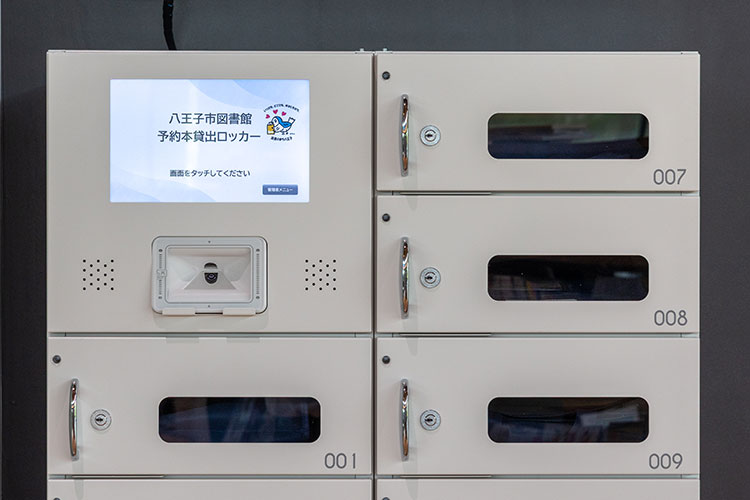
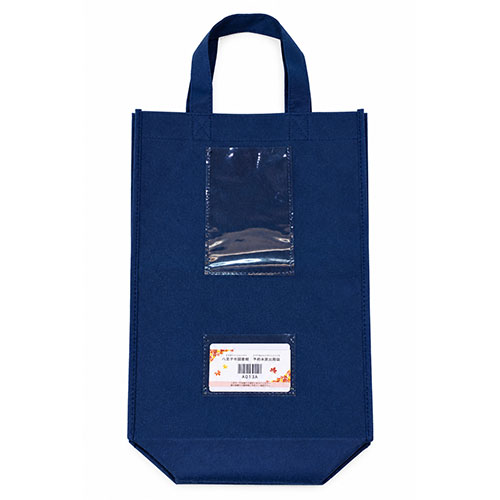
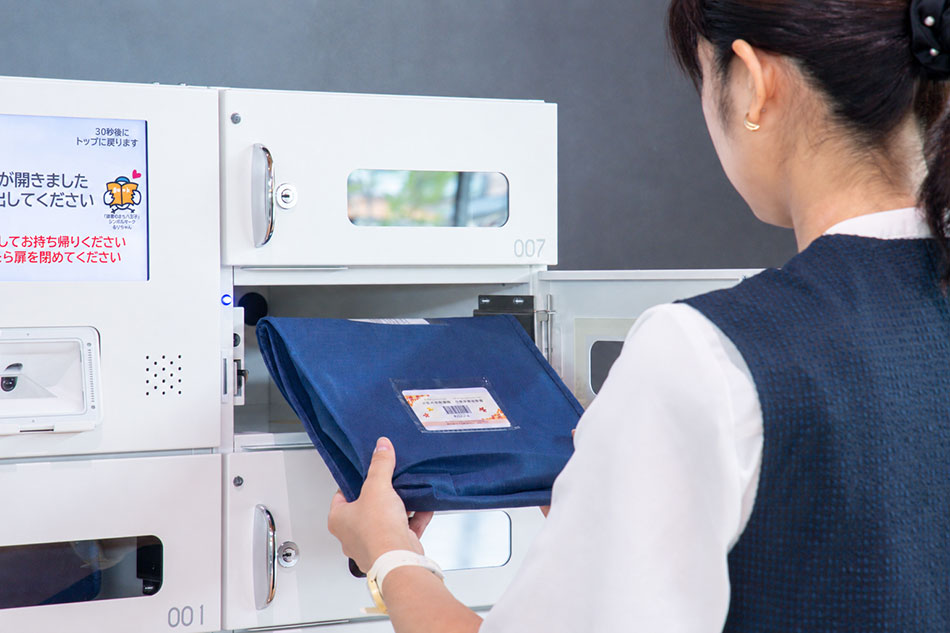 予約本を受け取る様子。予約本貸出袋での受け取りにより、本の取り残しを防止する。
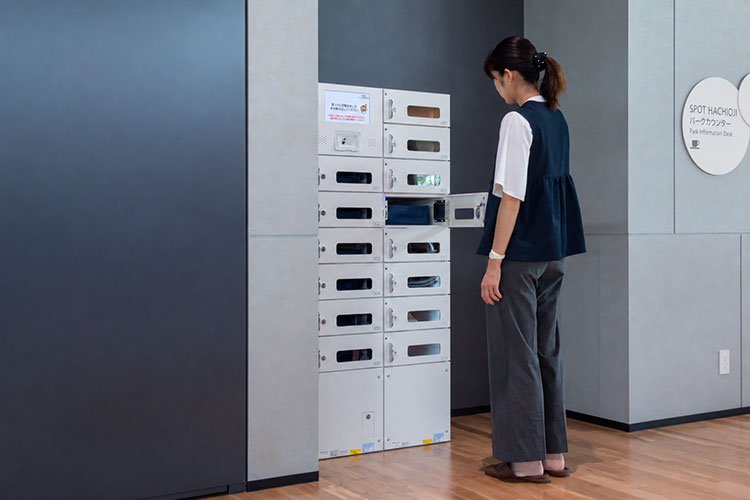
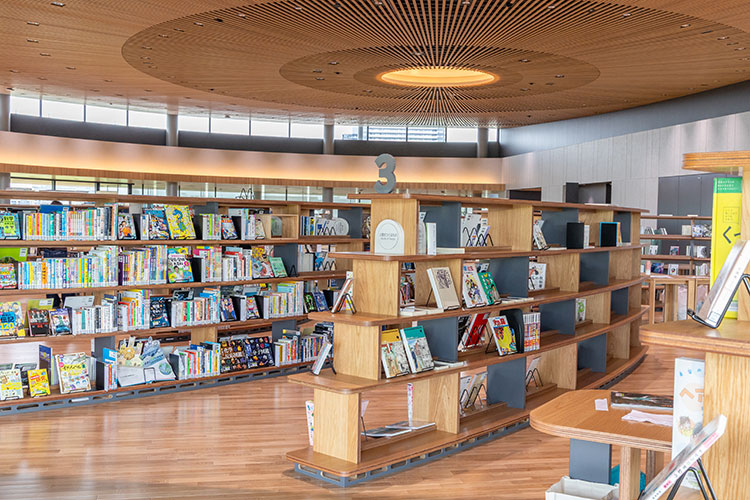


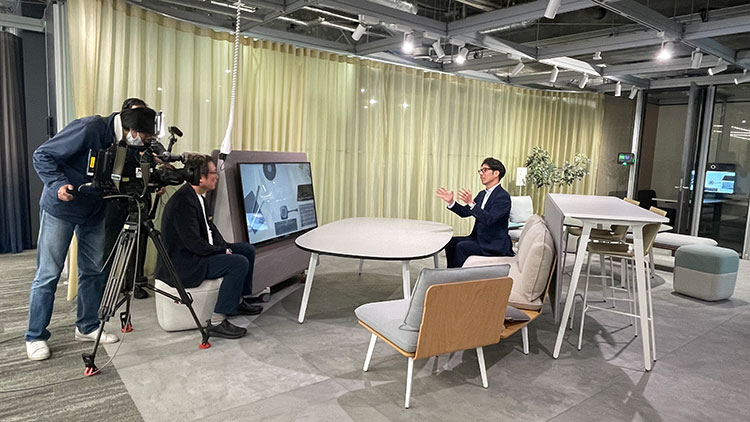
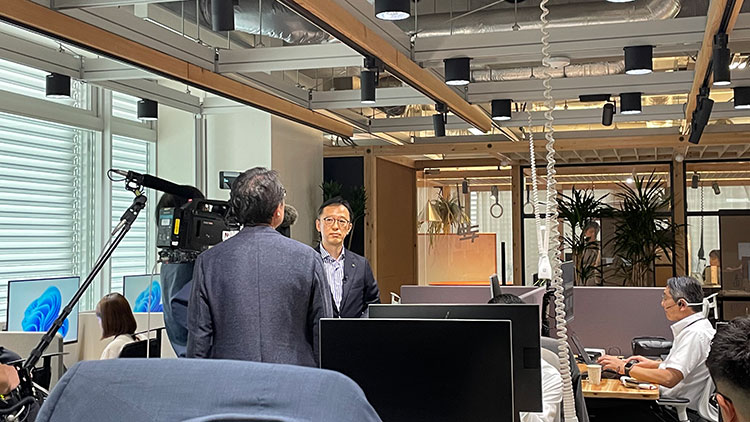

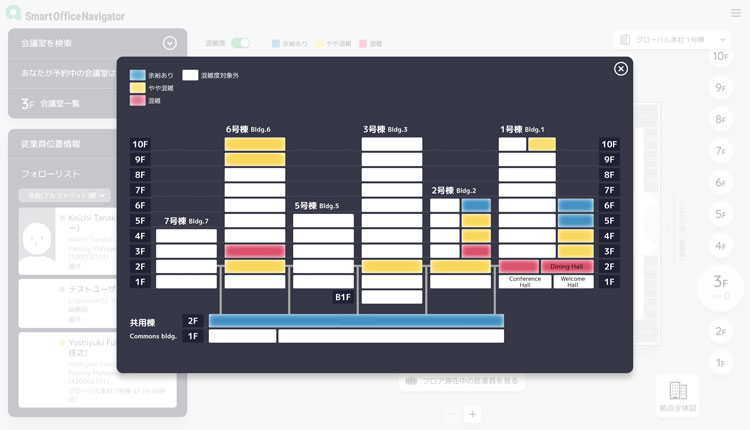
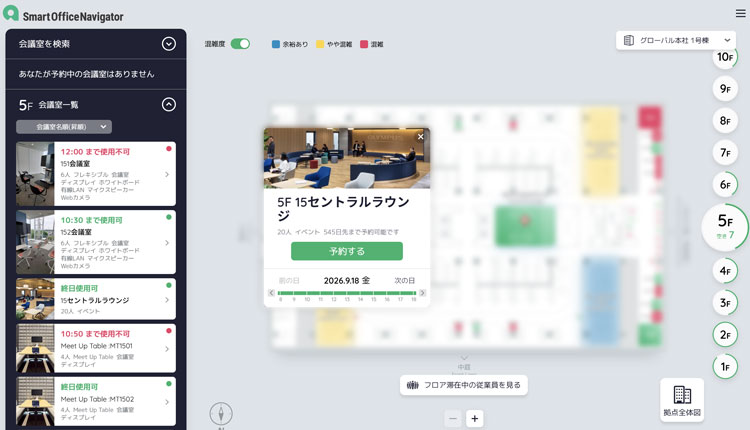
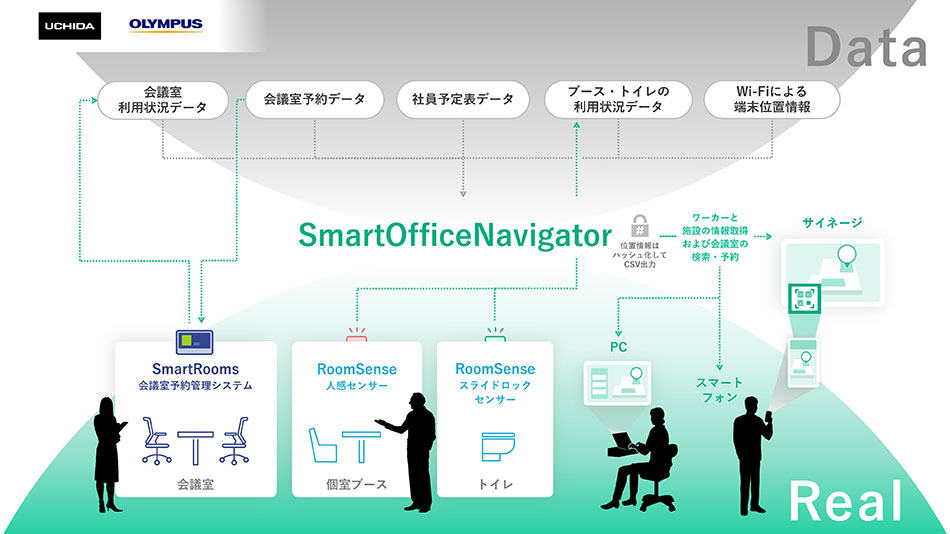 オフィス空間での人の居場所や多様な設備・機器・センサーの情報を統合管理