自己株券買付状況報告書(法24条の6第1項に基づくもの)
Bull 2
Bear 0
Capital return
Fiscal year ends March
Quarters are offset from the calendar — Q1 is Apr–Jun
|
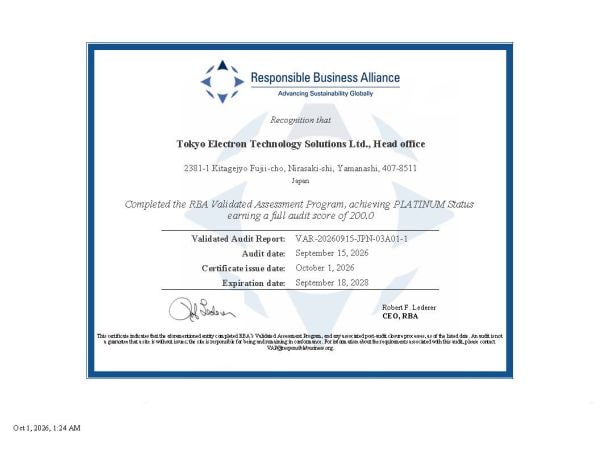
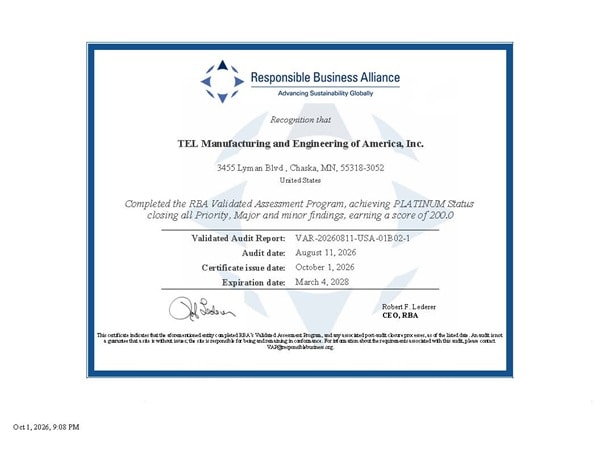
Tokyo Electron Limited develops, manufactures, sells, and provides maintenance services for semiconductor manufacturing equipment. The company operates as a single business segment focused on electronics technology. Key subsidiaries involved in manufacturing include Tokyo Electron Technology Solutions, Tokyo Electron Kyushu, Tokyo Electron Miyagi, and TEL Manufacturing and Engineering of America, Inc. Maintenance and service operations are conducted by subsidiaries such as Tokyo Electron FE, Tokyo Electron America, Inc., Tokyo Electron Korea Ltd., and Tokyo Electron Europe Ltd. Next-generation technology development is led by the parent company and TEL Technology Center, America, LLC. Tokyo Electron BP handles logistics, facility management, and insurance operations within the group. Summarised from the annual report, fiscal year ended Mar 2026 |
Industry Semiconductor Equipment & Materials | Homepage tel.com |
| Sector Technology | IR page tel.com | |
|
Tags
semiconductor manufacturing equipment, wafer processing, maintenance services, electronics technology, Tokyo Electron Technology Solutions, Tokyo Electron Kyushu, Tokyo Electron Miyagi, TEL Manufacturing and Engineering of America Inc., Tokyo Electron FE, Tokyo Electron America Inc., Tokyo Electron Korea Ltd., Tokyo Electron Europe Ltd., TEL Technology Center America LLC, Tokyo Electron BP
|
Press page tel.com/news |
Metrics
| Valuation | |
|---|---|
| Market cap | ¥ 26.924T |
| Market cap (USD) | $ 168.274B |
| P/E | 12.88 |
| PEG | 1.89 |
| P/BV | 12.27 |
| P/S | 9.18 |
| P/OCF | 35.48 |
| P/FCF | 44.75 |
| Dividend yield | 5.5% |
| Turnover / mcap | — |
| Returns | |
|---|---|
| ROE | 29.3% |
| ROI | 27.8% |
| ROIC | 23.2% |
| Profit margin | 23.5% |
| Growth | |
|---|---|
| Revenue growing | Yes |
| Profits growing | Yes |
| Revenue up 3y | No |
| Revenue up 5y | No |
| Earnings growth 3y (net profit CAGR) | 6.8% |
| Quality | |
|---|---|
| Profitable | Yes |
| Margin expanding | No |
| Buying back stock | No |
| Diluting (TTM) | — |
| Debt/Equity | — |
| Podcast bulls (TTM) | Sign up |
| Podcast bears (TTM) | Sign up |
| Podcast sentiment (TTM) | Sign up |
| Podcast sentiment % (TTM) | Sign up |
| News sentiment (TTM) | 12 |
| Quality score | 16.7% |
| Insiders | |
|---|---|
| Buys, 1w | Sign up |
| Buys, 1m | Sign up |
| Buys, 1y | Sign up |
| Sells, 1w | Sign up |
| Sells, 1m | Sign up |
| Sells, 1y | Sign up |
Sign up to see this company's insider trades
| Figure | FY 2026 | FY 2025 | FY 2024 | FY 2023 | FY 2022 | FY 2021 | FY 2020 | FY 2019 | FY 2018 | FY 2017 | FY 2016 | FY 2015 | FY 2014 | FY 2013 |
|---|---|---|---|---|---|---|---|---|---|---|---|---|---|---|
| Revenue | 2.444T | 2.432T | 1.831T | 2.209T | 2.004T | 1.399T | 1.127T | 1.278T | 1.131T | 799.719B | 663.948B | 613.124B | 612.17B | 497.299B |
| Net profit | 574.454B | 544.133B | 363.963B | 471.584B | 437.076B | 242.941B | 185.206B | 248.228B | 204.371B | 115.208B | 77.891B | 71.888B | -19.408B | 6.076B |
| Free cash flow | 320.291B | 414.135B | 309.74B | 349.957B | 218.284B | 84.958B | 200.365B | 143.055B | 140.401B | 118.275B | 57.397B | — | — | — |
| Figure | FY 2026 | FY 2025 | FY 2024 | FY 2023 | FY 2022 | FY 2021 | FY 2020 | FY 2019 | FY 2018 | FY 2017 | FY 2016 | FY 2015 | FY 2014 | FY 2013 |
|---|---|---|---|---|---|---|---|---|---|---|---|---|---|---|
| Share price | 37.232K | 20.109K | 39.572K | 16.043K | 63.259K | 46.788K | 20.354K | 15.999K | 20.014K | 12.156K | 7.336K | 8.383K | 4.165K | 4.165K |
| Price performance 12m | 0.85 | -0.49 | 1.47 | -0.75 | 0.35 | 1.3 | 0.27 | -0.2 | 0.65 | 0.66 | -0.12 | 1.01 | 0 | — |
Filed figures
Lines the statements and their notes report beside the headline figures, read from the filings' XBRL as filed (no restatement applied), with figures computed from one filing's own lines. Cash-flow lines carry their cash direction: an outflow is negative. Each period links to its filing; a figure's period, report date and tag are in its tooltip.
| Figure | Mar 2017 | Mar 2018 | Mar 2019 | Mar 2020 | Mar 2021 | Mar 2022 | Mar 2023 | Mar 2024 | Mar 2025 | Mar 2026 |
|---|---|---|---|---|---|---|---|---|---|---|
| Balance sheet detail | ||||||||||
| Trade receivables (JPY) | 134B | 160B | 147B | 150B | 192B | 849B | 905B | 770B | 953B | 1.04T |
| ↳ YoY growth | +14.9% | +19.2% | -7.9% | +2.2% | +27.7% | +343.0% | +6.5% | -14.9% | +23.8% | +9.2% |
| ↳ 5y CAGR | +10.5% | +44.7% | +41.5% | +39.3% | +44.7% | +40.3% | ||||
| Cash and deposits (JPY) | 70.9B | 87.4B | 178B | 150B | 187B | 274B | 473B | 462B | 416B | 451B |
| Intangible assets (JPY) | 15.4B | 15.9B | 9.05B | 10.9B | 17.2B | 22.5B | 28.6B | 32.4B | 35.9B | 37.5B |
| Cash flow detail | ||||||||||
| Operating cash flow (JPY) | 137B | 187B | 190B | 253B | 146B | 283B | 426B | 435B | 582B | 540B |
| Purchases of property, plant and equipment (JPY) | -17.6B | -41.8B | -46.5B | -49.4B | -53.8B | -56.2B | -66.9B | -117B | -158B | -209B |
| Purchases of intangible assets (JPY) | -1.12B | -4.43B | -1.56B | -3.38B | -7.12B | -8.95B | -9.42B | -7.99B | -9.67B | -10.5B |
| Change in receivables (cash effect) (JPY) | -17.4B | -26B | 10.5B | -5.37B | -37.7B | — | -24.8B | 84.8B | -97.5B | -29.9B |
| Change in inventories (cash effect) (JPY) | -44.1B | -110B | -14.8B | -44.1B | -17.2B | -100B | -173B | -97.7B | 8.49B | 48B |
| Change in payables (cash effect) (JPY) | 24.1B | 28.5B | -31.8B | 22.3B | -8.26B | 18.9B | -11.4B | -29.6B | 19.5B | 14.4B |
| Dividends paid (cash effect) (JPY) | -39.4B | -82.2B | -125B | -95.5B | -110B | -166B | -253B | -202B | -236B | -272B |
| Share buybacks (cash effect) (JPY) | -6M | -16M | -5B | -154B | -4.34B | -15M | -1.73B | -120B | -150B | -150B |
| Income taxes paid (cash effect) (JPY) | -32.6B | -49.8B | -103B | -41.9B | -87.8B | -106B | -209B | -119B | -143B | -178B |
| Operating cash flow before change in receivables (JPY) | 154B | 213B | 179B | 258B | 184B | — | 451B | 350B | 680B | 570B |
| Free cash flow (OCF - PPE - intangibles) (JPY) | 118B | 140B | 143B | 200B | 85B | 218B | 350B | 310B | 414B | 320B |
| Income detail | ||||||||||
| Research and development expense (JPY) | 83.8B | 97.1B | 114B | 120B | 137B | 158B | 191B | 203B | 250B | 278B |
| ↳ 5y CAGR | +12.4% | +13.6% | +14.5% | +12.2% | +15.8% | +15.3% | ||||
| Total comprehensive income (JPY) | 120B | 206B | 243B | 187B | 306B | 486B | 501B | 478B | 476B | 624B |
| Comprehensive income to owners (JPY) | 120B | 206B | 243B | 187B | 306B | 486B | 501B | 478B | 476B | 624B |
| Reported | Jun 20, 2017 | Jun 19, 2018 | Jun 23, 2020 | Jun 23, 2020 | Jun 17, 2021 | Jun 21, 2022 | Jun 18, 2024 | Jun 18, 2024 | Jun 16, 2025 | Jun 22, 2026 |
Sign up to see institutional holdings
Sign UpPodcast Mentions
Sign up to see podcast mentions and sentiment
Sign UpTimely disclosures published on TDnet, newest first, titles as filed in Japanese. The link opens the disclosure on TDnet. Filings with EDINET (periodic reports, extraordinary reports, offerings, holding and buy-back reports), newest first, titles as filed in Japanese. The link opens the filing on EDINET. Press releases from the company's own website, newest first.
SEMICON Europa 2026
Bull 0
Bear 0
Routine
Event Summary
Date
2026.11.10 - 2026.11.13
Location
Munich, Germany
Target
Device Engineer Process Engineer Mechanical Engineer AI Engineer Software Engineer Data Scientist / Analyst Other
SEMICON Europa 2026, sponsored by Tokyo Electron (TEL) as a platinum sponsor, will be held in Munich, Germany from November 10-13.
At the Smart Manufacturing session to be held at TechARENA, Hall B0 on November 12, Catherine Doyle, Technical Program Manager, Tokyo Electron Europe will present "Shift Left to Ramp Smart: Cutting Cost of Ownership with Advanced Sensor Analytics and Machine Learning in HVM".
We look forward to seeing you at SEMICON Europa 2026.

Related Links


-
WeChat


© 1996-2026. Copyright Tokyo Electron Limited. All Rights Reserved.

This website uses cookies
Cookies may include third party cookies that track your use of our website. You can change the settings of other cookies except the essential cookies at any time from the settings of your browser. By using our website, you are considered to agree our Cookie Policy .


Prompts
Click prompts to add them under the company line, click again to take one out, then copy the result into your AI chat. Shared by Asian Century Stocks and Uncovered Thai Stocks. Thank you.
Tokyo Electron Limited (ticker 8035), listed in Japan.
Copied
ETFs Holding Tokyo Electron Limited
Exchange-traded funds whose newest published daily portfolio holds one of the company's listings, largest weight first.
| ETF | Weight in ETF | Shares | Market value | As of |
|---|---|---|---|---|
| JPAN | 6.17% | 1,300 | $ 617.105K | Jun 30, 2026 |
| ADVE | 3.64% | 700 | $ 332.287K | Jun 30, 2026 |
| UMMA | 2.40% | 20,020 | $ 7.076M | Aug 31, 2026 |
| JHID | 1.94% | 444 | $ 210.765K | Jun 30, 2026 |
| VDI | 1.71% | 800 | $ 279.061K | Jul 31, 2026 |
| DINT | 1.46% | 12,720 | $ 4.253M | Jul 31, 2026 |
| CGIE | 1.26% | 555,500 | $ 30.632M | Nov 16, 2026 |
| DIHP | 1.21% | 1,372,010 | $ 79.832M | Nov 12, 2026 |
| IVSI | 1.15% | 192 | $ 91.102K | Jun 30, 2026 |
| DWMF | 1.12% | 800 | $ 379.757K | Jun 30, 2026 |
| NTSI | 1.11% | 11,600 | $ 5.506M | Jun 30, 2026 |
| GGTL | 0.89% | 250 | $ 118.623K | Jun 30, 2026 |
| CGXU | 0.76% | 886,600 | $ 48.89M | Nov 16, 2026 |
| CGDG | 0.66% | 722,800 | $ 39.858M | Nov 16, 2026 |
| DFAI | 0.47% | 1,472,805 | $ 85.697M | Nov 12, 2026 |
| JSTC | 0.43% | 23,051 | $ 1.27M | Nov 17, 2026 |
| CGNG | 0.39% | 207,000 | $ 11.415M | Nov 16, 2026 |
| DFSI | 0.37% | 75,900 | $ 4.416M | Nov 12, 2026 |
| CGGE | 0.36% | 210,700 | $ 11.619M | Nov 16, 2026 |
| GEW | 0.32% | 1,325 | $ 468.125K | Aug 31, 2026 |
| CGIC | 0.30% | 138,900 | $ 7.659M | Nov 16, 2026 |
| AVSD | 0.30% | 20,200 | $ 1.101M | Nov 16, 2026 |
| DXIV | 0.24% | 9,800 | $ 570.226K | Nov 12, 2026 |
| DFIC | 0.23% | 605,100 | $ 35.209M | Nov 12, 2026 |
| AVDE | 0.18% | 625,800 | $ 34.101M | Nov 16, 2026 |
| DFAX | 0.13% | 275,700 | $ 16.042M | Nov 12, 2026 |