Oct. 15, 2026 Facebook Twitter LinkedIn Main Contents Mitsui & Co., Ltd. (head office: Tokyo; President and CEO: Kenichi Hori) and its wholly owned subsidiary, Mitsui & Co. (U.S.A.), Inc. (together, "Mitsui"), announced that Mitsui and Penske…
Oct. 15, 2026
Main Contents
Mitsui & Co., Ltd. (head office: Tokyo; President and CEO: Kenichi Hori) and its wholly owned subsidiary, Mitsui & Co. (U.S.A.), Inc. (together, "Mitsui"), announced that Mitsui and Penske Corporation ("PC"), the latter acting on behalf of itself and its wholly owned subsidiary, Penske Automotive Holdings Corp. (collectively, the "PC-Mitsui Investors"), submitted a non-binding proposal (the "Proposal") to acquire all of the free-float shares of common stock of Penske Automotive Group, Inc. (NYSE: PAG) ("PAG") on July 22, 2026 (US time).
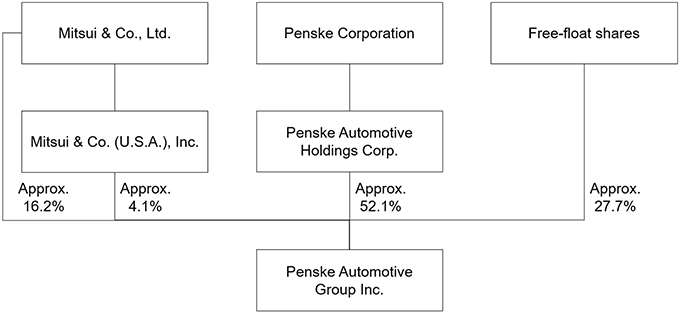
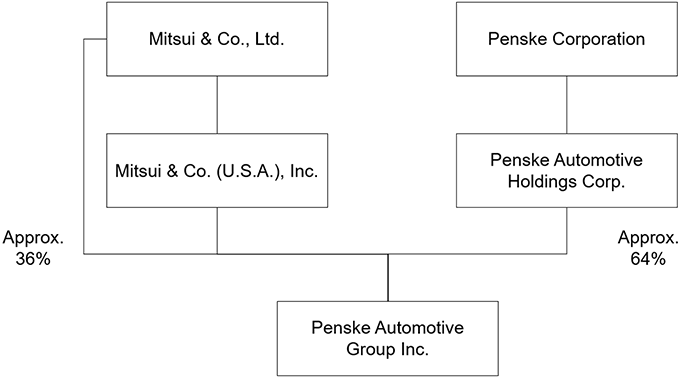
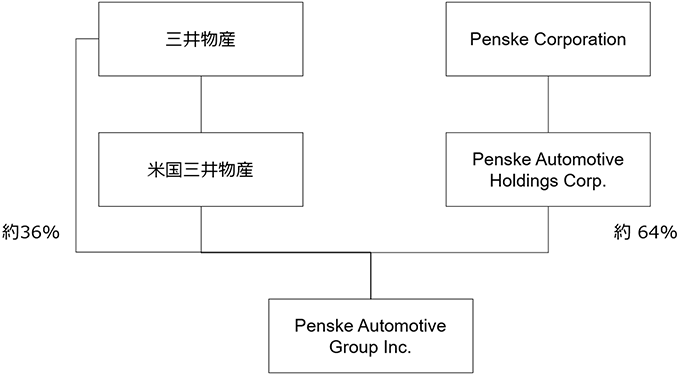
With respect to the Proposal, following the recommendation of a special committee comprised of independent and disinterested members of PAG's Board of Directors, on October 14, 2026 (US time) PAG's Board of Directors (with directors affiliated with the PC-Mitsui Investors recusing themselves from the deliberations and vote), approved the going-private merger involving PAG (the "Merger"). Today, Mitsui made a decision to acquire, together with PC, all of the free-float shares of PAG. Accordingly, Motown Acquisition Corp. ("Buyer"), a Delaware corporation which was established for the purpose of this transaction by PC and Mitsui & Co., Ltd., and PAG entered into an Agreement and Plan of Merger (the "Merger Agreement"). In connection with the acquisition of the shares to be acquired for cash in the Merger, Mitsui & Co., Ltd. and PC have committed to provide equity financing to Buyer of up to US$1.6 billion (Approx. 240 billion yen) and US$600 million (Approx. 90 billion yen), respectively. Following the completion of the Merger, Mitsui's and PC's ownership interests in PAG are expected to increase from approximately 20.3% to approximately 36% and from approximately 52.1% to approximately 64%, respectively.
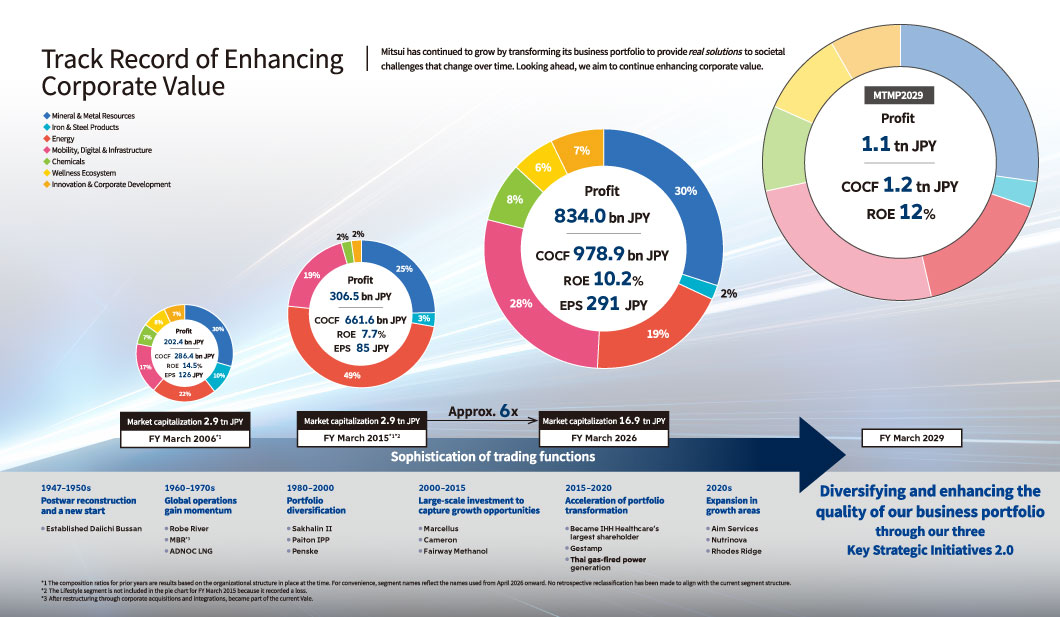
This transaction was not included in the Medium-term Management Plan 2029 announced in May 2026. The transaction is currently expected to be completed in the last quarter of FY March 2027, subject to receipt of required approvals and satisfaction of other closing conditions. The impact on Mitsui's consolidated financial results for FY March 2027 is expected to be limited. From FY March 2028 onward, Mitsui expects additional earnings contributions beyond the assumptions of Medium-term Management Plan 2029, reflecting the expected increase in our ownership interest.
1. Objective of the transaction
PAG is a diversified international transportation services company and one of the world's premier automotive and commercial truck retailers. PAG operates dealerships in the United States, the United Kingdom, Canada, Germany, Italy, Australia and Japan and is one of the largest retailers of commercial trucks in North America for Freightliner. PAG also distributes and retails commercial vehicles, diesel and gas engines, power systems and related parts and service principally in Australia and New Zealand.
Mitsui has supported PAG's growth strategy since its initial investment in PAG in 2001, and over that time PAG has succeeded in diversifying its business domains beyond passenger vehicle retail.
The automotive industry is experiencing a transformative period due to technological advancements. To appropriately respond to these changes, PC and Mitsui aim to sustain current operational excellence while innovating and growing PAG's business. Mitsui will support PAG's business development and create collaborative projects by leveraging its comprehensive capabilities and network in cross-functional business domains.
2. Outline of the Merger
(1) Merger structure
The Merger will be implemented through the Merger of Buyer, a newly formed Delaware corporation owned by PC and Mitsui & Co., Ltd. and established for purposes of the transaction, with and into PAG, with PAG continuing as the surviving corporation. Pursuant to the Merger Agreement, shares of PAG common stock held by the PC-Mitsui Investors will remain outstanding, while other outstanding shares of PAG common stock (other than certain shares to be cancelled and shares in respect of which appraisal rights have been properly exercised) will be converted into the right to receive cash consideration as described below. Shares of Buyer will be converted into newly issued shares of PAG common stock at the effective time of the Merger. Following completion, PAG will be privately held by the PC-Mitsui Investors. This transaction is subject to customary closing conditions specified in the Merger Agreement, including (a) approval at a shareholders' meeting convened by PAG by (i) the holders of a majority of the outstanding shares of PAG common stock entitled to vote thereon and (ii) a majority of the votes cast by disinterested stockholders and (b) receipt of required regulatory approvals. Completion of the Merger is not subject to a financing condition.
(2) PAG overview
|
|
|
| Name of company |
|
Penske Automotive Group, Inc. |
| Head office |
|
Bloomfield Hills, Michigan, USA |
| Establishment |
|
1990 |
| Representative |
|
Roger Penske, Chair and CEO |
| Description of business |
|
Diversified international transportation services businesses (mainly automotive retail) |
| Sales |
|
US$31,809 million (Fiscal year ended December 2025) |
| Total assets |
|
US$17,598 million (As of December 31, 2025) |
| Employees |
|
Approx. 28,600 (As of June 30, 2026) |
| Shareholders & equity stake |
Before transaction |
PC and its subsidiary* approx. 52.1%, Mitsui approx. 20.3%, other shareholders approx. 27.7% (based on shares outstanding as of July 16, 2026) |
| After transaction (plan) |
PC and its subsidiary* approx. 64%, Mitsui approx. 36% (expected, subject to completion of the Merger and final capitalization) |
|
| Website |
|
http://www.penskeautomotive.com/ |
* Penske Automotive Holdings Corp.
(3) Merger consideration
US$212 per share of PAG common stock entitled to receive cash consideration pursuant to the Merger Agreement.
The merger consideration implies an aggregate equity value for PAG of approximately US$13.9 billion (Approx. 2.1 trillion yen), calculated using the number of fully diluted shares outstanding of PAG common stock as of September 30, 2026.
(4) Estimated number of shares of PAG to receive merger consideration
Approximately 18,285,048 shares of PAG common stock, based on the diluted outstanding share count of 65,788,374 as of September 30, 2026, less the 34,181,121 shares held by PC and its subsidiary and less the 13,322,205 shares held by Mitsui. The actual number of shares (or equivalent) entitled to receive cash consideration will be determined in accordance with the Merger Agreement at the effective time of the Merger, including with respect to the treatment of existing awards under PAG's equity plan.
(5) Total estimated transaction cost for the PC-Mitsui Investors
Approximately US$3.9 billion (Approx. 585 billion yen) (US$212 per PAG share ×18,285,048 PAG shares (or equivalent) based on the estimated share count described in paragraph (4) above and excluding amounts in respect of Company Performance Awards (defined in the Merger Agreement), transaction fees, financing costs and other expenses).
(6) Source of funding
To finance the transaction Mitsui & Co., Ltd. and PC have entered into separate equity commitment letters pursuant to which they have committed to provide up to US$1.6 billion (Approx. 240 billion yen) and US$600 million (Approx. 90 billion yen), respectively, subject to the terms and conditions of their respective equity commitment letters. In addition to the US$2.2 billion (Approx. 330 billion yen) of equity funding to be provided by the PC-Mitsui Investors to Buyer, Buyer intends to finance the transaction through borrowings from one or more third-party lenders. Buyer has obtained debt financing commitments to fund a portion of the transaction consideration and related costs.
3. Structure
Before the transaction
Envisaged structure after the transaction
Related Release
TSE
Non-binding Proposal with Penske Corporation to Acquire Free-float Shares of Penske Automotive Group, Inc. (Jul. 22, 2026)
This announcement contains forward-looking statements. These forward-looking statements are based on Mitsui's current assumptions, expectations and beliefs in light of the information currently possessed by it and involve known and unknown risks, uncertainties and other factors. Such risks, uncertainties and other factors may cause Mitsui's actual results, financial position or cash flows to be materially different from any future results, financial position or cash flows expressed or implied by these forward-looking statements. These risks, uncertainties and other factors referred to above include, but are not limited to, those contained in Mitsui's latest Annual Securities Report and Semi-annual Securities Report, and Mitsui undertakes no obligation to publicly update or revise any forward-looking statements.
This announcement is published in order to publicly announce specific facts stated above, and does not constitute a solicitation of investments or any similar act inside or outside of Japan, regarding the shares, bonds or other securities issued by us.
The information contained in this release is true and accurate at the time of publication; however, it may be subject to change without prior notice.
Cautionary Statements Regarding Forward Looking Statements (U.S. Securities Laws)
Certain statements and information set forth in this timely disclosure release constitute “forward-looking statements” within the meaning of the Private Securities Litigation Reform Act of 1995. Forward-looking statements include, without limitation, projections, predictions, expectations, or beliefs about future events or results and are not statements of historical fact. Such statements may include statements regarding the ability of PAG and Buyer to complete the transactions contemplated by the Merger Agreement, including the ability to satisfy the conditions set forth therein, the expected timing of completion of the Merger and PAG, Mitsui and Penske Corporation’s beliefs and expectations about the benefits sought to be achieved in the Merger, including the expected value provided to PAG’s stockholders. Such forward-looking statements are based on various assumptions as of the time they are made, and are inherently subject to known and unknown risks, uncertainties and other factors that may cause actual results, performance or achievements to be materially different from any future results, performance or achievements expressed or implied by such forward-looking statements. Words such as “anticipate,” “believe,” “estimate,” “expect,” “intend,” “may,” “goal,” “plan,” “seek,” “project,” “continue,” “will,” “would,” and variations of such words and similar expressions are intended to identify such forward-looking statements. Although Mitsui and Penske Corporation believe that their expectations with respect to forward-looking statements are based upon reasonable assumptions within the bounds of their existing knowledge of their business and operations, there can be no assurance that actual results, performance, or achievements will not differ materially from any projected future results, performance or achievements expressed or implied by such forward-looking statements. Actual results may vary materially because of risks and uncertainties that are difficult to predict. These risks and uncertainties include, among others, the inability to complete the Merger due to the failure to obtain required stockholder or regulatory approvals or the failure to satisfy other conditions set forth in the Merger Agreement; risks related to disruption of management’s attention from PAG’s ongoing business operations due to the Merger; unexpected costs, charges or expenses resulting from the Merger; PAG’s ability to retain and hire key personnel in light of the Merger; potential litigation relating to the Merger that could be instituted against PAG or the purchasers or their respective directors, managers or officers, including the effects of any outcomes related thereto; and the effect of the Merger on PAG’s relationships with its suppliers and customers, operating results and business generally. Reference is made to the “Risk Factors” and “Management’s Discussion and Analysis of Financial Condition and Results of Operations” sections of PAG’s Form 10-K for the fiscal year ended December 31, 2025 filed with the SEC on February 27, 2026, and comparable sections of PAG’s Quarterly Reports on Form 10-Q for the quarterly periods ended March 31, 2026 and June 30, 2026 filed with the SEC on April 30, 2026 and July 30, 2026, respectively, and other filings, which have been filed with the SEC and are available on the SEC’s website at www.sec.gov.
All of the forward-looking statements made in this timely disclosure release are expressly qualified by the cautionary statements contained or referred to herein. The actual results or developments anticipated may not be realized or, even if substantially realized, they may not have the expected consequences to or effects on Mitsui, Penske Corporation, PAG or their respective business or operations. Readers are cautioned not to rely on the forward-looking statements contained in this timely disclosure release. All forward-looking statements attributable to Mitsui are qualified in their entirety by this cautionary statement. Except to the extent required by the federal securities laws and the SEC’s rules and regulations, and Japanese securities laws, Mitsui has no intention or obligation to update publicly any forward-looking statements whether as a result of new information, future events, or otherwise.
Additional Information and Where to Find It
This press release is not intended to be, and does not constitute, a solicitation to buy or an offer to sell any securities nor a solicitation of any vote or approval with respect to the Merger. In connection with the Merger, PAG intends to file relevant materials with the SEC, including a preliminary proxy statement on Schedule 14A (the “Proxy Statement”). The definitive proxy statement (if and when available) will be mailed to PAG’s stockholders seeking their approval of the Merger and other related matters. PAG, Buyer and their affiliates also intend to jointly file with the SEC a transaction statement on Schedule 13E-3 (the “Schedule 13E-3”). This communication is not a substitute for the Proxy Statement, the Schedule 13E-3 or any other document that PAG may file with the SEC or send to its stockholders in connection with the Merger. STOCKHOLDERS OF PAG ARE ADVISED TO READ THE DEFINITIVE PROXY STATEMENT, THE SCHEDULE 13E-3 AND ANY OTHER DOCUMENTS FILED BY PAG, PC AND MITSUI WITH THE SEC IN CONNECTION WITH THE MERGER CAREFULLY AND IN THEIR ENTIRETY BECAUSE THEY WILL CONTAIN IMPORTANT INFORMATION ABOUT PAG AND THE BUSINESS TO BE CONDUCTED AT THE SPECIAL MEETING. All such documents together with the materials incorporated by reference therein, when filed, may be obtained free of charge at the SEC’s website (http://www.sec.gov
). These documents, once available, and PAG’s other filings with the SEC also will be available free of charge on the Investor Relations portion of PAG’s website at https://investors.penskeautomotive.com/financials/sec-filings.
Participants in the Solicitation
PAG, PC and Mitsui and their respective directors, certain executive officers and certain employees may be deemed to be participants in the solicitation of proxies from PAG’s stockholders with respect to the Merger. Information about PAG’s directors and executive officers and their ownership of PAG’s common stock is set forth in the sections of PAG’s proxy statement on Schedule 14A filed with the SEC on March 20, 2026, captioned “Proposal 1 – Election of Directors”, “Executive Officers”, “Executive Compensation”, “Director Compensation” and “Security Ownership of Certain Beneficial Owners and Management”. Transactions with related persons (as defined in Item 404 of Regulation S-K promulgated under the Securities Act of 1933, as amended) are disclosed under the heading titled “Related Party Transactions” in PAG’s proxy statement. To the extent that such individual’s holdings of PAG’s common stock have changed since the amounts disclosed in PAG’s proxy statement, such changes have been or will be reflected on Statements of Changes in Beneficial Ownership on Form 4 or other reports filed (or that will be filed) with the SEC (to the extent such participant is subject to Section 16 of the Securities Exchange Act of 1934, as amended). Other information regarding the identity of the potential participants, and their direct or indirect interests in the Merger, by security holdings or otherwise, will be set forth in the Proxy Statement, Schedule 13E-3 and other materials to be filed with SEC in connection with the Merger. Information concerning the interests of the participants in the solicitation, which may, in some cases, be different than those of PAG’s shareholders generally, will be set forth in the Proxy Statement, the Schedule 13E-3 when they become available. Investors should read the Proxy Statement and Schedule 13E-3 carefully before making any voting or investment decisions. These documents can be obtained free of charge from the sources indicated above, when available.
Information
For inquiries on this matter, please contact
Mitsui & Co., Ltd.
Investor Relations Division
Contact form
Mitsui & Co., Ltd.
Corporate Communications Division
Contact form
Menu
======================================================================
2026
2025
2024
2023
2022
2021
2020
2019
2018
2017
2016
Related Pages

Our business: Services & Products: Mobility Business Unit I
For the world.
With the world.

360° business innovation__360° business innovation
Company__Company
Release__Release
Sustainability__Sustainability
Investor Relations__Investor Relations
Other
Social Media
Copyright©1996-2026Mitsui&Co.,Ltd. AllRightsReserved.
Site Search
Site Search
Close
































 安永会長(左)とオタヴィオ・コルテス駐日ブラジル大使(右)
 リオ・ブランコ国家勲章の正章と、副章および略章
 Mitsui Chairman Yasunaga (left) and Brazilian Ambassador to Japan Octavio Cortez (right)
 The Grand Cross insignia, badge, and miniature decoration of the Order of Rio Branco