|
Toyota Tsusho Corporation is a diversified trading company operating through eight business segments: Metal Plus, Circular Economy, Supply Chain, Mobility, Green Infrastructure, Digital Solutions, Lifestyle, and Africa. The company engages in the trading, manufacturing, and processing of metals, chemicals, and agricultural products, alongside logistics, automotive distribution, renewable energy projects, and IT services. Key subsidiaries include Toyota Tsusho America, Inc., Toyota Tsusho Europe S.A., and CFAO SAS. The group serves global markets with a significant presence in Asia, Europe, the Americas, and Africa, providing supply chain solutions, mobility products, and infrastructure services to industrial and consumer customers. Summarised from the annual report, fiscal year ended Mar 2026 |
Industry Industrial Distribution | Homepage toyota-tsusho.com |
| Sector Industrials | IR page toyota-tsusho.com | |
|
Tags
metals trading, automotive distribution, logistics, renewable energy, chemicals, agricultural products, it services, circular economy, supply chain management, infrastructure development, Toyota Tsusho America Inc., Toyota Tsusho Europe S.A., Toyota Tsusho (Thailand) Co. Ltd., Toyota Tsusho Thai Holdings Co. Ltd., Toyota Tsusho Asia Pacific Pte. Ltd., Toyota Tsusho India Private Limited, Toyota Tsusho (Australasia) Pty. Ltd., Toyota Tsusho (Shanghai) Co. Ltd., Toyota Tsusho (China) Co. Ltd., Toyota Tsusho South Pacific Holdings Pty Ltd, Toyota Caucasus LLC., CFAO SAS, Aeolus SAS, Toyota Tsusho Manufacturing Ghana Co. Limited, Toyota Steel Center Co. Ltd., Guangqi Toyotsu Steel Processing Co. Ltd., TT Automotive Steel (Thailand) Co. Ltd., Toyotsu Materials Co. Ltd., Toyotsu Chemplus Co. Ltd., Toyotsu Lithium Pte. Ltd., Toyotsu Rare Earths India Private Limited, Radius Recycling Inc., Sanyo Chemical Industries Co. Ltd., KPX Holdings Co. Ltd., Toyotsu Logistics Co. Ltd., Kyowa Sangyo Co. Ltd., Chuo Seiki Co. Ltd., Hino Sales Support Co. Ltd., Purdy Motor S.A., Euras Energy Holdings Co. Ltd., Toyotsu Machinery Co. Ltd., Toyota Tsusho Marine Fuel Co. Ltd., Nexti Electronics Co. Ltd., Elematic Co. Ltd., Tomen Devices Co. Ltd., PT. Toyota Tsusho Real Estate Cikarang, NovaAgri Infra-Estrutura de Armazenagem e Escoamento Agrícola S.A., Daiya Seipan Co. Ltd., PT. Bungasari Flour Mills Indonesia, Toyotsu Human Resources Co. Ltd.
|
Press page toyota-tsusho.com/english/press |
Metrics
| Valuation | |
|---|---|
| Market cap | ¥ 6.707T |
| Market cap (USD) | $ 41.917B |
| P/E | 16.17 |
| PEG | 1.75 |
| P/BV | 2.39 |
| P/S | 0.50 |
| P/OCF | 21.10 |
| P/FCF | 48.73 |
| Dividend yield | 1.7% |
| Turnover / mcap | — |
| Returns | |
|---|---|
| ROE | 12.3% |
| ROI | 11.2% |
| ROIC | 11.7% |
| Profit margin | 3.2% |
| Growth | |
|---|---|
| Revenue growing | Yes |
| Profits growing | Yes |
| Revenue up 3y | Yes |
| Revenue up 5y | Yes |
| Earnings growth 3y (net profit CAGR) | 9.2% |
| Quality | |
|---|---|
| Profitable | Yes |
| Margin expanding | No |
| Buying back stock | No |
| Diluting (TTM) | No |
| Debt/Equity | — |
| Podcast bulls (TTM) | Sign up |
| Podcast bears (TTM) | Sign up |
| Podcast sentiment (TTM) | Sign up |
| Podcast sentiment % (TTM) | Sign up |
| News sentiment (TTM) | 43 |
| Quality score | 22.2% |
| Insiders | |
|---|---|
| Buys, 1w | Sign up |
| Buys, 1m | Sign up |
| Buys, 1y | Sign up |
| Sells, 1w | Sign up |
| Sells, 1m | Sign up |
| Sells, 1y | Sign up |
Sign up to see this company's insider trades
| Figure | FY 2026 | FY 2025 | FY 2024 | FY 2023 | FY 2022 | FY 2021 | FY 2020 | FY 2019 | FY 2018 | FY 2017 | FY 2016 | FY 2015 | FY 2014 | FY 2013 |
|---|---|---|---|---|---|---|---|---|---|---|---|---|---|---|
| Revenue | 11.562T | 10.31T | 10.189T | 9.849T | 8.028T | 6.309T | 6.694T | 6.763T | 6.491T | 7.92T | 8.17T | 8.663T | 7.743T | 6.304T |
| Net profit | 370.516B | 362.506B | 331.444B | 284.155B | 222.235B | 134.602B | 135.551B | 132.622B | 130.228B | 102.597B | -43.714B | 67.571B | 73.034B | 67.432B |
| Free cash flow | 297.201B | 331.012B | 367.094B | 283.31B | -117.149B | 107.343B | 150.095B | 109.629B | — | — | — | — | — | — |
| Figure | FY 2026 | FY 2025 | FY 2024 | FY 2023 | FY 2022 | FY 2021 | FY 2020 | FY 2019 | FY 2018 | FY 2017 | FY 2016 | FY 2015 | FY 2014 | FY 2013 |
|---|---|---|---|---|---|---|---|---|---|---|---|---|---|---|
| Share price | 5.949K | 2.493K | 10.266K | 5.62K | 5.06K | 4.645K | 2.547K | 3.606K | 3.605K | 3.37K | 3.185K | 3.185K | 2.62K | 2.44K |
| Price performance 12m | 1.39 | -0.76 | 0.83 | 0.11 | 0.09 | 0.82 | -0.29 | 0 | 0.07 | 0.06 | 0 | 0.22 | 0.07 | — |
Filed figures
Lines the statements and their notes report beside the headline figures, read from the filings' XBRL as filed (no restatement applied), with figures computed from one filing's own lines. Cash-flow lines carry their cash direction: an outflow is negative. Each period links to its filing; a figure's period, report date and tag are in its tooltip.
| Figure | Mar 2017 | Mar 2018 | Mar 2019 | Mar 2020 | Mar 2021 | Mar 2022 | Mar 2023 | Mar 2024 | Mar 2025 | Mar 2026 |
|---|---|---|---|---|---|---|---|---|---|---|
| Balance sheet detail | ||||||||||
| Trade receivables (JPY) | — | 1.34T | 1.4T | 1.25T | 1.4T | 1.8T | 1.73T | 1.8T | 1.82T | 2.02T |
| ↳ YoY growth | +4.2% | -10.4% | +12.2% | +27.9% | -3.7% | +3.9% | +1.5% | +10.7% | ||
| ↳ 5y CAGR | +5.2% | +5.2% | +7.8% | +7.5% | ||||||
| Borrowings, current (JPY) | — | 543B | 510B | 503B | 572B | 741B | 747B | 627B | 565B | 846B |
| Borrowings, non-current (JPY) | — | 927B | 993B | 1.02T | 1.07T | 1.12T | 1.28T | 1.36T | 1.29T | 1.32T |
| Cash and deposits (JPY) | 431B | 423B | 466B | 496B | 677B | 653B | 772B | 879B | 952B | 1.4T |
| Intangible assets (JPY) | — | 167B | 157B | 161B | 163B | 182B | 184B | 275B | 276B | 356B |
| Net debt (borrowings + leases - cash) (JPY) | — | 1.05T | 1.04T | 1.03T | 966B | 1.2T | 1.25T | 1.11T | 902B | 765B |
| Cash flow detail | ||||||||||
| Operating cash flow (JPY) | 194B | 215B | 211B | 268B | 245B | 50.1B | 444B | 542B | 512B | 461B |
| Purchases of property, plant and equipment (JPY) | — | -64B | -87B | -104B | -124B | -136B | -161B | -175B | -181B | -164B |
| Purchases of intangible assets (JPY) | — | -10.8B | -14.2B | -13.9B | -13.4B | -31.5B | -19.9B | -23.9B | -18.4B | -19.5B |
| Change in receivables (cash effect) (JPY) | — | -1.74B | -52.5B | 124B | -126B | -318B | 129B | 8.18B | -25.6B | -91.8B |
| Change in inventories (cash effect) (JPY) | — | -40.9B | -94.8B | -31.8B | -29.5B | -261B | -3.85B | 121B | -11.8B | -306B |
| Change in payables (cash effect) (JPY) | — | 26.2B | 101B | -99.4B | 140B | 307B | -132B | -126B | 11B | 199B |
| Dividends paid (cash effect) (JPY) | — | -29.6B | -34.9B | -38.7B | -35.2B | -46.5B | -65.5B | -81.3B | -107B | -119B |
| Share buybacks (cash effect) (JPY) | — | -43M | -26M | -139M | -25M | -31M | -20M | -55M | -22M | -15M |
| Interest paid (cash effect) (JPY) | — | -25.9B | -26B | -30.4B | -24.5B | -26.2B | -45.3B | -60B | -52.7B | -55.5B |
| Operating cash flow before change in receivables (JPY) | — | 217B | 263B | 144B | 371B | 368B | 315B | 534B | 538B | 553B |
| Free cash flow (OCF - PPE - intangibles) (JPY) | — | 140B | 110B | 150B | 107B | -117B | 263B | 343B | 313B | 278B |
| Income detail | ||||||||||
| Total comprehensive income (JPY) | 139B | 177B | 70.9B | 54.2B | 339B | 344B | 400B | 655B | 310B | 704B |
| Comprehensive income to owners (JPY) | 129B | 153B | 51.9B | 41.3B | 311B | 305B | 355B | 634B | 285B | 663B |
| Reported | Jun 30, 2017 | Jun 25, 2019 | Jun 25, 2019 | Jun 23, 2020 | Jun 24, 2021 | Jun 24, 2022 | Jun 23, 2023 | Jun 21, 2024 | Jun 19, 2025 | Jun 18, 2026 |
Sign up to see institutional holdings
Sign UpPodcast Mentions
Sign up to see podcast mentions and sentiment
Sign UpTimely disclosures published on TDnet, newest first, titles as filed in Japanese. The link opens the disclosure on TDnet. Filings with EDINET (periodic reports, extraordinary reports, offerings, holding and buy-back reports), newest first, titles as filed in Japanese. The link opens the filing on EDINET. Press releases from the company's own website, newest first.
2026年10月30日 各
位 会社名:
豊田通商株式会社
代表者名:
取締役社⻑今井斗志光
(コード:8015、東証プライム・名証プレミア) 問合せ先:
広報部⻑杉浦賢人 (TEL. 052-584-5000)
特定子会社の異動に関するお知らせ
豊田通商株式会社(以下、当社)及び当社の連結子会社であるToyota Tsusho Asia Pacific Pte. Ltd.(以 下、TTAP)は、当社の連結子会社である Toyota Bangladesh Limited(以下、TBL)に対し、追加の出資 を行うことを 10月 30 日(日本時間)に決定いたしました。これにより、TBL の資本金は当社資本金の 100 分の 10 以上となり当社の特定子会社に該当することになりますので、お知らせいたします。
- 異動の理由及び内容 当社は、バングラデシュにおける拠点として TBL を設置しております。このたび、同国におけるモビリ ティ事業のさらなる拡大のため、当社が1,412百万バングラデシュタカ(1,815百万円)の増資を実施するこ とを決定いたしました。これにより、TBL の資本金は 6,041百万バングラデシュタカ(7,770百万円)とな り、当社の資本金額の 100 分の 10 以上に相当することから、TBLは当社の特定子会社に該当することと なります。
- 異動する特定子会社の概要 (1) 名称
Toyota Bangladesh Limited
(2) 所在地
バングラデシュ人⺠共和国ダッカ市
(3) 代表者の役職・氏名
代表取締役社⻑ Premmit Singh
(4) 事業内容
トヨタ車両・補給部品の輸入、卸売・小売・アフターサービス事業
(5) 資本金
6,041百万バングラデシュタカ(7,770百万円)(増資後)
(6) 設立年月日
2025 年8月
(7) 出資者及び出資比率
当社:1%、TTAP:99%
(8) 上場会社と当該会社との
資本関係
当社が直接的に当該会社の発行済株式総数の 1%、
人的関係
当社及びTTAPは当該会社へ役職員を計4名派遣しており ます。
取引関係
商品の販売及び仕入
間の関係
TTAPが99%を保有しております。
(9)当該会社の最近1年間の連結財政状態及び連結経営成績 決算期
2026 年 3 月期
連結純資産
651百万BDT
連結総資産
897百万BDT
(838百万円)
(1,154百万円)
連結売上高
75百万BDT
親会社株主に帰属する
-14百万BDT
当期純利益
(97百万円)
(-19百万円)
- 今後の見通し 本件に伴う当社の 2027 年 3 月期の業績及び財政状態への影響につきましては軽微です。
(注)本資料における為替レートは、1バングラデシュタカ=1.29円を適用しています。












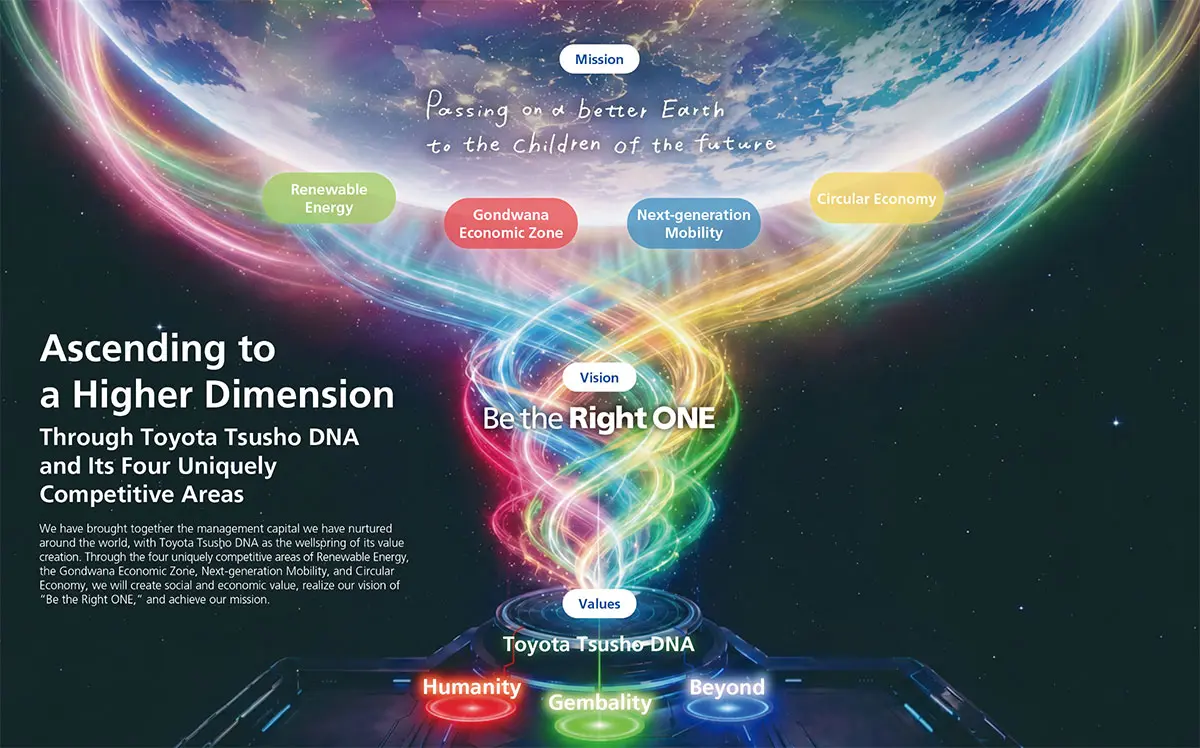
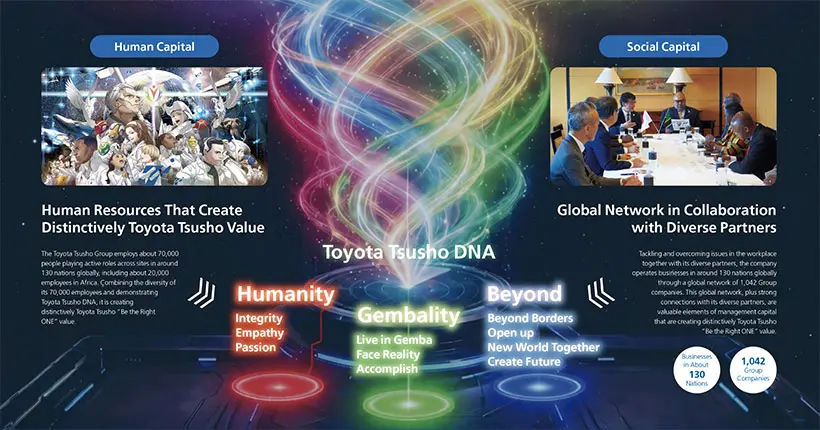
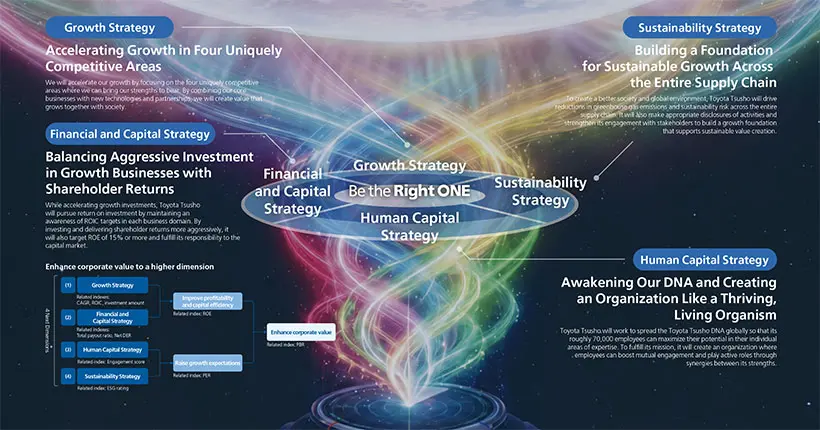
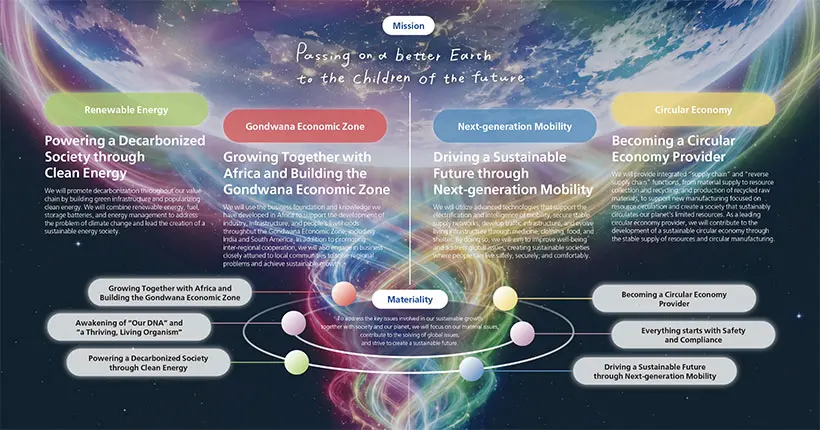
 Carrying on Toyota Tsusho DNA
 Stimulating Internal Communications
 AI Strategy
 10 Years Since COCE Was Established
 Gembality in Environmental Management

Prompts
Click prompts to add them under the company line, click again to take one out, then copy the result into your AI chat. Shared by Asian Century Stocks and Uncovered Thai Stocks. Thank you.
Company History
Name and ticker changes, and re-registrations under a new regulatory id. When a ticker stopped being used is not recorded, so former tickers are undated.
| Date | Change | Detail |
|---|---|---|
| Dec 23, 2024 | Acquired | Acquired Elematec Corporation (EDINET code E02941). Its filings from before the deal are on its own company page, not shown here. |
ETFs Holding Toyota Tsusho Corporation
Exchange-traded funds whose newest published daily portfolio holds one of the company's listings, largest weight first.
| ETF | Weight in ETF | Shares | Market value | As of |
|---|---|---|---|---|
| JPAN | 1.95% | 5,300 | $ 194.945K | Jun 30, 2026 |
| TDI | 0.82% | 80,671 | $ 2.966M | Jun 30, 2026 |
| DWMF | 0.37% | 3,400 | $ 125.059K | Jun 30, 2026 |
| IVSI | 0.31% | 676 | $ 24.854K | Jun 30, 2026 |
| AVIV | 0.26% | 130,200 | $ 5.305M | Nov 16, 2026 |
| DIHP | 0.16% | 250,200 | $ 10.671M | Nov 12, 2026 |
| DFIV | 0.14% | 753,384 | $ 32.133M | Nov 12, 2026 |
| DFSI | 0.11% | 31,400 | $ 1.339M | Nov 12, 2026 |
| FLSP | 0.11% | 29,000 | $ 1.067M | Jun 30, 2026 |
| DFIC | 0.10% | 366,700 | $ 15.64M | Nov 12, 2026 |
| DFAI | 0.10% | 432,116 | $ 18.43M | Nov 12, 2026 |
| AVDE | 0.09% | 441,300 | $ 17.979M | Nov 16, 2026 |
| DFAX | 0.09% | 240,000 | $ 10.236M | Nov 12, 2026 |
| DXIV | 0.05% | 2,800 | $ 119.425K | Nov 12, 2026 |