2026年12月期 第3四半期決算補足説明資料
Bull 1
Bear 0
Results
|
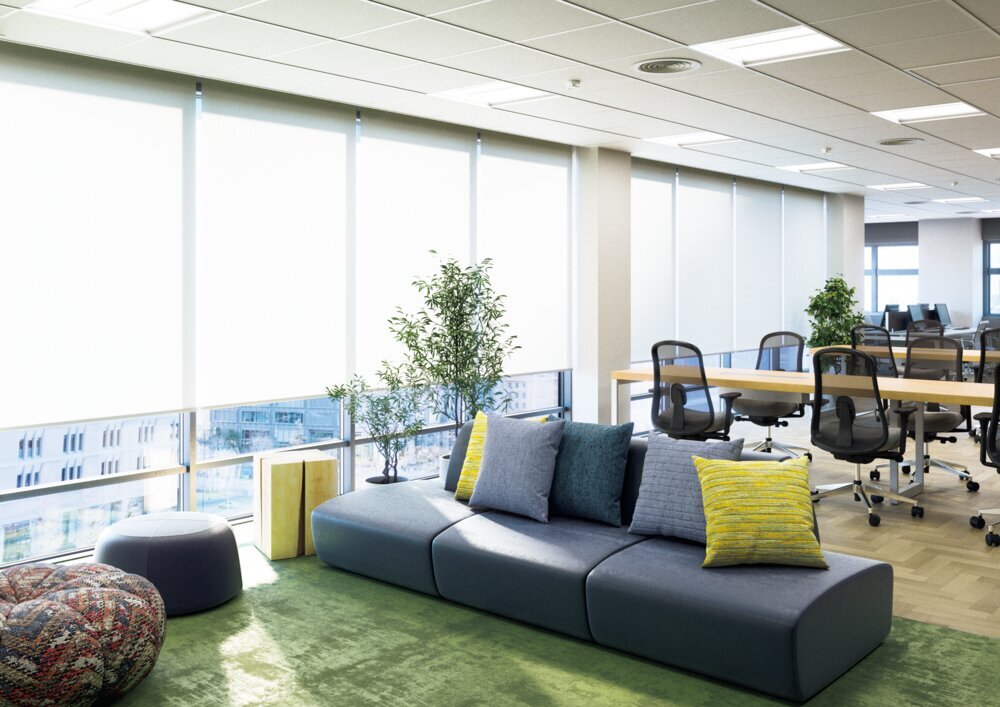
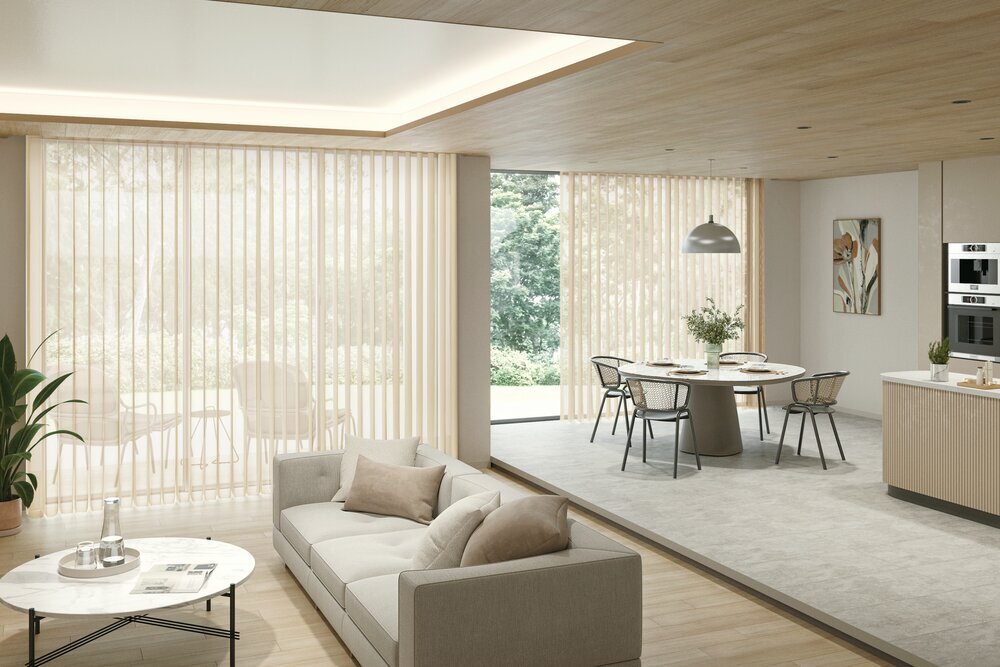
Tachikawa Corporation is a Japanese manufacturer and distributor of interior and exterior finishing products, mechanical parking systems, and speed reducers. The company operates through three main business segments: interior and exterior finishing, parking equipment, and speed reducers. In the finishing segment, it manufactures and sells blinds and movable partitions, with production and assembly handled by subsidiaries Tachikawa Kiko, Fuji Hensoki, Tachikawa Fukuhaku Kogyo, and Shiga Tachikawa Fukuhaku Kogyo. Installation services are provided by Tachikawa Sobi, while Tachikawa Trading manages import and export activities. Tachikawa Service handles inventory management, and Tachikawa Chuosaku Kogyo (Shanghai) Co., Ltd. manages manufacturing and sales in China. The parking equipment segment involves the production, sales, and maintenance of mechanical multi-story parking systems by Fuji Hensoki. The speed reducer segment includes the manufacture and sale of reducers by Fuji Hensoki, some of which are used as components for electric blinds. The group serves the Japanese domestic market and exports products internationally. Summarised from the annual report, fiscal year ended Dec 2025 |
Industry Building Products & Equipment | Homepage blind.co.jp |
| Sector Industrials | IR page blind.co.jp | |
|
Tags
blinds, movable partitions, mechanical parking systems, speed reducers, interior finishing, exterior finishing, installation services, import export, inventory management, Tachikawa Kiko, Fuji Hensoki, Tachikawa Fukuhaku Kogyo, Shiga Tachikawa Fukuhaku Kogyo, Tachikawa Sobi, Tachikawa Trading, Tachikawa Service, Tachikawa Chuosaku Kogyo (Shanghai) Co. Ltd.
|
Press page blind.co.jp/news |
Metrics
| Valuation | |
|---|---|
| Market cap | ¥ 55.231B |
| Market cap (USD) | $ 345.199M |
| P/E | 16.36 |
| PEG | 1.87 |
| P/BV | 0.96 |
| P/S | 1.24 |
| P/OCF | 12.21 |
| P/FCF | 15.75 |
| Dividend yield | 2.6% |
| Turnover / mcap | — |
| Returns | |
|---|---|
| ROE | 5.9% |
| ROI | 5.7% |
| ROIC | 5.5% |
| Profit margin | 7.6% |
| Growth | |
|---|---|
| Revenue growing | Yes |
| Profits growing | Yes |
| Revenue up 3y | Yes |
| Revenue up 5y | Yes |
| Earnings growth 3y (net profit CAGR) | 8.7% |
| Quality | |
|---|---|
| Profitable | Yes |
| Margin expanding | No |
| Buying back stock | No |
| Diluting (TTM) | No |
| Debt/Equity | — |
| Podcast bulls (TTM) | Sign up |
| Podcast bears (TTM) | Sign up |
| Podcast sentiment (TTM) | Sign up |
| Podcast sentiment % (TTM) | Sign up |
| News sentiment (TTM) | 6 |
| Quality score | 27.8% |
| Insiders | |
|---|---|
| Buys, 1w | Sign up |
| Buys, 1m | Sign up |
| Buys, 1y | Sign up |
| Sells, 1w | Sign up |
| Sells, 1m | Sign up |
| Sells, 1y | Sign up |
Sign up to see this company's insider trades
| Figure | FY 2025 | FY 2024 | FY 2023 | FY 2022 | FY 2021 | FY 2020 | FY 2019 | FY 2018 | FY 2017 | FY 2016 | FY 2015 | FY 2014 | FY 2013 | FY 2012 |
|---|---|---|---|---|---|---|---|---|---|---|---|---|---|---|
| Revenue | 42.623B | 41.408B | 41.305B | 41.296B | 41.237B | 39.981B | 42.055B | 39.066B | 40.106B | 39.35B | 39.283B | 38.951B | 38.659B | 38.135B |
| Net profit | 3.24B | 2.802B | 2.709B | 2.52B | 2.868B | 2.9B | 2.762B | 2.32B | 2.281B | 1.742B | 1.378B | 935.483M | 983.346M | 667.944M |
| Free cash flow | 3.506B | 458.009M | 1.4B | -390.73M | 154.968M | 4.037B | 2.076B | 2.084B | 2.301B | 1.988B | -363.821M | — | — | — |
| Figure | FY 2025 | FY 2024 | FY 2023 | FY 2022 | FY 2021 | FY 2020 | FY 2019 | FY 2018 | FY 2017 | FY 2016 | FY 2015 | FY 2014 | FY 2013 | FY 2012 |
|---|---|---|---|---|---|---|---|---|---|---|---|---|---|---|
| Share price | 1.978K | 1.351K | 1.392K | 1.128K | 1.134K | 1.256K | 1.306K | 1.078K | 1.453K | 884.21 | 780.07 | 673.87 | 515.08 | 450.59 |
| Price performance 12m | 0.46 | -0.03 | 0.23 | -0.01 | -0.1 | -0.04 | 0.21 | -0.26 | 0.64 | 0.13 | 0.16 | 0.31 | 0.14 | — |
Filed figures
Lines the statements and their notes report beside the headline figures, read from the filings' XBRL as filed (no restatement applied), with figures computed from one filing's own lines. Cash-flow lines carry their cash direction: an outflow is negative. Each period links to its filing; a figure's period, report date and tag are in its tooltip.
| Figure | Dec 2016 | Dec 2017 | Dec 2018 | Dec 2019 | Dec 2020 | Dec 2021 | Dec 2022 | Dec 2023 | Dec 2024 | Dec 2025 |
|---|---|---|---|---|---|---|---|---|---|---|
| Balance sheet detail | ||||||||||
| Trade receivables (JPY) | 14.7B | 15.2B | 14.3B | 16.1B | 14.5B | 15.9B | 16.2B | 24.6B | 24.5B | 22.6B |
| ↳ YoY growth | -3.8% | +3.8% | -6.0% | +12.5% | -9.8% | +9.8% | +1.7% | +52.1% | -0.6% | -7.7% |
| ↳ 5y CAGR | -1.0% | +1.7% | +1.2% | +11.5% | +8.8% | +9.3% | ||||
| Lease liabilities (JPY) | 69.1M | 63.9M | 244M | 217M | 192M | 165M | 126M | 115M | 138M | 179M |
| Cash and deposits (JPY) | 10.6B | 12.5B | 14.2B | 15.1B | 18.5B | 18.1B | 16.1B | 15.5B | 15.5B | 17.7B |
| Intangible assets (JPY) | 262M | 253M | 394M | 495M | 491M | 454M | 375M | 305M | 421M | 454M |
| Cash flow detail | ||||||||||
| Operating cash flow (JPY) | 2.46B | 2.94B | 2.95B | 2.87B | 5.17B | 2.13B | 2.14B | 4.31B | 1.64B | 4.52B |
| Purchases of property, plant and equipment (JPY) | -472M | -551M | -684M | -615M | -1.03B | -1.89B | -2.47B | -2.87B | -1.08B | -809M |
| Purchases of intangible assets (JPY) | -1.26M | -88M | -187M | -177M | -106M | -80.5M | -56.2M | -47.8M | -107M | -208M |
| Change in receivables (cash effect) (JPY) | 467M | -685M | 884M | -1.77B | 2.04B | -1.38B | -377M | 144M | -92.8M | 660M |
| Change in inventories (cash effect) (JPY) | -209M | 252M | -918M | -150M | 259M | -190M | -1.08B | 187M | -384M | -64.8M |
| Change in payables (cash effect) (JPY) | -458M | 84M | 353M | -150M | -668M | 906M | 130M | -1.04B | -1.83B | -60.3M |
| Dividends paid (cash effect) (JPY) | -290M | -291M | -293M | -543M | -543M | -562M | -584M | -631M | -703M | -1.04B |
| Share buybacks (cash effect) (JPY) | — | — | — | — | — | — | -313M | -819M | -164M | — |
| Interest paid (cash effect) (JPY) | -53,000 | -19,000 | -19,000 | -21,000 | -22,000 | -4,000 | -5,000 | -11,000 | -3,000 | -412,000 |
| Income taxes paid (cash effect) (JPY) | -1.11B | -1.19B | -1.31B | -1.44B | -1.7B | -1.51B | -1.57B | -1.08B | -1.48B | -1.56B |
| Operating cash flow before change in receivables (JPY) | 1.99B | 3.63B | 2.07B | 4.64B | 3.12B | 3.51B | 2.52B | 4.17B | 1.74B | 3.86B |
| Free cash flow (OCF - PPE - intangibles) (JPY) | 1.99B | 2.3B | 2.08B | 2.08B | 4.04B | 155M | -391M | 1.4B | 458M | 3.51B |
| Income detail | ||||||||||
| Research and development expense (JPY) | 686M | 667M | 673M | 705M | 629M | 651M | 621M | 614M | 629M | 790M |
| ↳ 5y CAGR | -2.1% | -1.0% | -1.4% | -1.8% | -2.3% | +4.7% | ||||
| Total comprehensive income (JPY) | 1.15B | 2.81B | 1.94B | 3.21B | 2.83B | 3.35B | 2.4B | 3.6B | 3.45B | 4.41B |
| Comprehensive income to owners (JPY) | 1.09B | 2.72B | 1.88B | 3.04B | 2.73B | 3.15B | 2.22B | 3.41B | 3.38B | 4.41B |
| Provision for credit losses (JPY) | 11.3M | 11.4M | -6.78M | 18.7M | 11.9M | 4.28M | 20.1M | -245,000 | 394,000 | -2.43M |
| Credit cost ratio (credit losses / average receivables) (%) | 0.1% | 0.1% | 0.0% | 0.1% | 0.1% | 0.0% | 0.1% | 0.0% | 0.0% | 0.0% |
| Reported | Mar 30, 2017 | Mar 29, 2018 | Mar 28, 2019 | Mar 27, 2020 | Mar 30, 2021 | Mar 30, 2022 | Mar 30, 2023 | Mar 28, 2024 | Mar 28, 2025 | Mar 18, 2026 |
Sign up to see institutional holdings
Sign UpPodcast Mentions
Sign up to see podcast mentions and sentiment
Sign UpTimely disclosures published on TDnet, newest first, titles as filed in Japanese. The link opens the disclosure on TDnet. Filings with EDINET (periodic reports, extraordinary reports, offerings, holding and buy-back reports), newest first, titles as filed in Japanese. The link opens the filing on EDINET. Press releases from the company's own website, newest first.
2026年12月期 第3四半期決算短信〔日本基準〕(連結)
Bull 1
Bear 0
Results
適時開示 2026.10.29 「2026年12月期 第3四半期 決算説明資料」を掲載しました PDF PDF
Bull 3
Bear 0
Results
2026年12月期 第3四半期 決算補足説明資料 2026年 10月29日
(東京証券取引所 プライム市場証券コード 7989)
Copyright ©TACHIKAWA CORPORATION
目次
- 2026年12月期第3四半期決算概況
・・・・・ P.03
・・・・・ P.10
2026年12月期業績予想
Copyright ©TACHIKAWA CORPORATION © 2026 TACHIKAWA CORPORATION
1
エグゼクティブサマリー 1.2026年第3四半期決算概況 ・第3四半期累計期間における売上高は、主力の室内外装品関連事業が前年並みとなるも、 駐車場装置関連事業、減速機関連事業において大幅な増収となった
・売上高の増加に加え、販売価格の改定効果や経費削減効果等もあり、各段階利益とも増益となった
2.2026年12月期業績予想 ・中東情勢の緊迫化により供給面での不安定さが生じるなか、調達コストに影響が生じており、
原材料価格の高騰に対しては販売価格の改定を順次実施 ・連結業績予想については、現時点において2026年2月10日に公表した予想の変更なし (今後、状況の変化により連結業績予想を修正する必要が生じた場合は、速やかに公表)
Copyright ©TACHIKAWA CORPORATION © 2026 TACHIKAWA CORPORATION
2
1. 2026年12月期
第3四半期決算概況
Copyright ©TACHIKAWA CORPORATION
3
2026年12月期第3四半期決算概況 ・主力の室内外装品関連事業の売上高は前年並みとなるも、駐車場装置関連事業、減速機関連事業で増収 (売上高前年比:室内外装品関連事業99.7%、駐車場装置関連事業177.6%、減速機関連事業113.5%) 駐車場装置関連事業ではパズルタワーの新設物件の増加などがあり、大幅な増収となった ・原材料価格の高騰等により売上総利益率は低下したが、広告宣伝費等の販管費の減少があり増益 2026年度第3四半期
(単位:百万円)
2025年度第3四半期
金額
構成比
前年比
売上高
32,845
100.0%
105.7%
31,081
100.0%
売上総利益
13,186
40.1%
101.6%
12,977
41.8%
販売費及び一般管理費
9,736
29.6%
99.2%
9,816
31.6%
営業利益
3,449
10.5%
109.1%
3,160
10.2%
経常利益
3,631
11.1%
110.4%
3,288
10.6%
親会社株主に帰属する 当期純利益
2,387
7.3%
101.2%
2,358
7.6%
Copyright ©TACHIKAWA CORPORATION
金額
構成比
4
2026年12月期第3四半期 セグメント概況 室内外装品関連事業 ・ファブリック製品のリニューアルや、電動製品の強化など、顧客のニーズに合わせた機能を追加 ・調光ファブリック製品、家庭用電動製品の売上高が伸長するも、非住宅物件の減少等により、全体では減収 ・販売価格改定の実施や、販管費の抑制に努めたものの、下期以降の原材料高騰影響が大きく、営業利益は減益 売上高:億円
利益:億円
300.0 250.0 200.0
40 266.1
254.8
249.8
24.9
26.6
265.3
27.8
売上高 265億28百万円 営業利益
26.5
150.0
30
26億45百万円
前年比 99.7% 前年比
95.3%
20
100.0 10 50.0 0.0
0 2023年3Q
Copyright ©TACHIKAWA CORPORATION
2024年3Q
2025年3Q
2026年3Q
5
2026年12月期第3四半期 セグメント概況 駐車場装置関連事業 ・立体駐車場を併設するホテル建設の増加に伴い受注が好調に推移し、パズルタワーの新設物件の売上高が増加 ・既設物件に対する改造改修案件は付加価値提案を強化し売上高が増加 ・売上高の大幅な増加や、利益率の高い改造改修案件の売上計上により、営業利益は大幅に増益 売上高:億円
利益:億円
40.0
8 34.4
35.0
5.8
30.0 25.0
19.4
20.0
2.0
0.0
Copyright ©TACHIKAWA CORPORATION
2024年3Q
2025年3Q
2026年3Q
営業利益
177.6% 前年比
5億82百万円
216.9%
・パズルタワー 製品特徴
3
くし歯式
ハイスピードな入出庫が可能 省電力(パレット式の1/2)、 高耐震性
2
オートゲート クローズ システム
各センサによる安全確認で 自動でゲートが閉まり、 閉め忘れを防止
Web出庫 予約
スマホなどで出庫 予約登録をすると 出庫の待ち時間を短縮
0 2023年3Q
34億37百万円
特徴
1
0.5
前年比
機能
4
2.7
15.0 10.0
6 5
21.7
20.5
5.0
7
売上高
6
2026年12月期第3四半期 セグメント概況 減速機関連事業 ・工作機械市況が回復する中、価格改定効果もあり、汎用減速機の売上高が増加 ・世界的な半導体需要の増加に伴い、半導体生産工場に納品する天井走行式自動搬送台車用の減速機売上高が増加 ・売上高の増加や、前年に実施した汎用減速機の価格改定効果により、営業利益は大幅に増益 売上高:億円
利益:億円
35.0 30.0
4
25.4 25.0 20.0
3
23.3
28億79百万円
113.5%
前年比
2億21百万円
191.6%
・減速機主な製品の特徴
2.2
2.1
前年比
営業利益
28.8
27.5
売上高
2
製品
市場
使用例
汎用減速機
生産工場
工作機械、 コンベア 食品・医療 製造設備
半導体搬送用 ギアードモータ
半導体 生産工場
天井走行式 自動搬送台車
バッテリー 駆動用AC サーボモータ
無人搬送 台車(AGV)
大型高荷重 AGV 大型牽引台車
15.0 1.2
10.0
1
0.7 5.0 0.0
0 2023年3Q
Copyright ©TACHIKAWA CORPORATION
2024年3Q
2025年3Q
2026年3Q
7
2026年12月期第3四半期連結貸借対照表 ・支店建設用の土地、札幌製作所の建設工事などの設備投資や、社債の購入等により固定資産が増加 ・政策保有株式の時価上昇に伴い、投資有価証券及び有価証券評価差額金が増加 単位 : 百万円
項目 流動資産 固定資産 流動負債 固定負債 純資産 総資産 Copyright ©TACHIKAWA CORPORATION
2025年 12月末
2026年 9月末
41,228
38,045
(60.9%)
(56.1%)
26,506
29,829
(39.1%)
(43.9%)
8,669
6,836
(12.8%)
(10.1%)
2,712
3,233
(4.0%)
(4.8%)
56,353
57,805
(83.2%)
(85.2%)
67,735
67,875
(100.0%)
(100.0%)
増減
主な増減要因
△3,182
現預金△2,195、売上債権△2,082、棚卸資産+558
+3,323
有形固定資産+1,252(支店建設用土地、札幌製作所建設) 投資有価証券+2,048(株価上昇、社債購入)
△1,832
支払債務△1,072
+520 +1,452
利益剰余金+377(利益計上、前期末配当及び当期中間配当) 有価証券評価差額金+1,073
+140 8
2026年12月期第3四半期 キャッシュ・フロー計算書 ・営業活動によるキャッシュ・フローは堅調に増加 ・現預金は支店建設用の土地や、札幌製作所移転計画の建設費用の支払、社債購入、配当金の支払により減少 単位 : 百万円
項目
2025年 3Q
2026年 3Q
営業活動による キャッシュ・フロー
+3,469
+3,681 ●営業活動
投資活動による キャッシュ・フロー
△3,066
△3,226
財務活動による キャッシュ・フロー
△1,087
△2,064
現金及び現金同等物の 増減額
△695
△1,595
●投資活動 ・有形固定資産の取得△2,624(支店建設用土地、札幌製作所建設) ・無形固定資産の取得△411 ・投資有価証券の取得△996(社債購入) ・定期預金+599
13,519
●財務活動 ・配当金の支払△2,008(前期末配当及び当期中間配当)
現金及び現金同等物の 期末残高 Copyright ©TACHIKAWA CORPORATION
14,281
主な増減要因
・税金等調整前利益+3,610 ・売上債権の減少+2,060 ・棚卸資産の増加△552 ・法人税の支払△1,694
9
- 2026年12月期
Copyright ©TACHIKAWA CORPORATION
業績予想
10
業績予想(連結) 2026年第3四半期累計期間の業績は好調に推移するも、中東情勢の緊迫化により供給面での不安定さから、 調達コストに影響が生じており、原材料価格の高騰に対しては販売価格の改定を順次実施 連結業績予想については、現時点において2026年2月10日に公表した予想を据え置き 単位:百万円
連結業績
2024年
2025年
2026年 業績予想
前年比
売上高
41,407
42,623
43,500
102.0%
営業利益
4,361
4,411
4,500
102.0%
10.5%
10.3%
10.3%
4,376
4,629
4,700
10.6%
10.9%
10.8%
2,802
3,239
3,280
6.8%
7.6%
7.5%
利益率 経常利益
利益率 当期純利益 利益率 Copyright ©TACHIKAWA CORPORATION
101.5%
101.2%
11
業績の進捗状況(連結) 【業績の進捗】業績は堅調に推移しており、年初予想の達成を見据えている。 (今後、状況の変化により連結業績予想を修正する必要が生じた場合は、速やかに公表)
売上高
32,845百万円
営業利益
3,449百万円
経常利益
3,631百万円
進捗率
75.5% 進捗率
76.6% 進捗率
77.3% 進捗率
2,387百万円
当期純利益
0% Copyright ©TACHIKAWA CORPORATION
25%
2026年業績予想
72.8% 50%
75%
43,500百万円
4,500百万円
4,700百万円
3,280百万円
100%
12
株主還元の基本方針 単位:百万円
3500
配当額
自己株式取得額
中期経営計画2028
1株当たり配当
3000
140円
120円
2500
120円
中期経営計画2025
100円
2000
1000
36円
60円
46円
40円
500
20円
0
0円 2023年
累進配当の継続 業績の成長に伴い配当を維 持・増配する「累進配当」を 実施 増配ペースは状況を見ながら 検討 Copyright ©TACHIKAWA CORPORATION
DOE4%
80円
70円
1500
160円
2024年
2025年
2026年
2027年
2028年
DOE基準の導入 (下限4.0%)
1株120円以上の 年間配当をコミット
機動的な 自己株式取得の検討
純資産配当率(DOE)4.0% を下限に設定 業績変動に左右されない、強 固で安定的な配当基盤を実施
2026年度は、左記方針に 基づき1株当たり年間120円 の配当を実施予定
資本効率向上と1株当たり 利益(EPS)上昇のため、 自社株買いの柔軟かつ機動的 な実施を検討
13
将来見通し等に関する注意事項 本資料における当社グループの今後の計画、戦略等の将来見通しに関する記述は、 現時点で予測可能な合理的判断に基づいて作成されたものであり、 実際の業績は、今後様々な要因で異なる場合がございます。
〔東京証券取引所 プライム市場証券コード7989 〕 【お問合せ先】経理部 IR推進課 03-5484-6128 / [email protected] https://www.blind.co.jp Copyright ©TACHIKAWA CORPORATION
14














Prompts
Click prompts to add them under the company line, click again to take one out, then copy the result into your AI chat. Shared by Asian Century Stocks and Uncovered Thai Stocks. Thank you.
Tachikawa Corporation (ticker 7989), listed in Japan.
Copied
Company History
Name and ticker changes, and re-registrations under a new regulatory id. When a ticker stopped being used is not recorded, so former tickers are undated.
| Date | Change | Detail |
|---|---|---|
| Sep 30, 2024 | Acquired | Acquired Fuji Hensokuki Co., Ltd. (EDINET code E01697). Its filings from before the deal are on its own company page, not shown here. |
ETFs Holding Tachikawa Corporation
Exchange-traded funds whose newest published daily portfolio holds one of the company's listings, largest weight first.