EDINET提出書類 株式会社ニフコ(E02386) 有価証券報告書 【表紙】 【提出書類】 有価証券報告書 【根拠条文】 金融商品取引法第24条第1項 【提出先】 関東財務局長 【提出日】 2026年6月22日 【事業年度】 第74期(自 【会社名】 株式会社ニフコ 【英訳名】 NIFCO…
EDINET提出書類
株式会社ニフコ(E02386)
有価証券報告書
【表紙】
【提出書類】
有価証券報告書
【根拠条文】
金融商品取引法第24条第1項
【提出先】
関東財務局長
【提出日】
2026年6月22日
【事業年度】
第74期(自
【会社名】
株式会社ニフコ
【英訳名】
NIFCO INC.
【代表者の役職氏名】
代表取締役社長
【本店の所在の場所】
神奈川県横須賀市光の丘5番3号
【電話番号】
046(839)0225
【事務連絡者氏名】
財務経理本部長
【最寄りの連絡場所】
東京都港区芝5丁目36番7号
【電話番号】
03(5476)4853
【事務連絡者氏名】
財務経理本部長
【縦覧に供する場所】
株式会社東京証券取引所
(東京都中央区日本橋兜町2番1号)
2025年4月1日
柴尾
至
2026年3月31日)
雅春
最高財務責任者
楢原
三田ベルジュビル20階
最高財務責任者
1/152
稔
楢原
稔
EDINET提出書類
株式会社ニフコ(E02386)
有価証券報告書
第一部【企業情報】
第1【企業の概況】
1【主要な経営指標等の推移】
(1) 連結経営指標等
回次
第70期
第71期
第72期
第73期
第74期
決算年月
2022年3月
2023年3月
2024年3月
2025年3月
2026年3月
売上高
(百万円)
283,777
321,771
371,639
353,038
352,650
経常利益
(百万円)
33,602
37,876
49,665
52,147
51,275
親会社株主に帰属する当期
純利益
(百万円)
22,959
21,170
18,252
44,767
34,079
包括利益
(百万円)
33,180
33,527
30,491
54,199
40,048
純資産額
(百万円)
200,875
226,127
247,052
278,725
299,571
総資産額
(百万円)
333,068
359,150
380,405
379,816
393,590
1株当たり純資産額
(円)
1,978.36
2,237.06
2,455.97
2,888.37
3,183.40
1株当たり当期純利益金額
(円)
227.27
211.28
183.26
461.95
361.44
潜在株式調整後1株当たり
当期純利益金額
(円)
−
−
−
−
−
自己資本比率
(%)
59.5
62.2
64.1
72.4
75.3
自己資本利益率
(%)
12.3
10.0
7.8
17.3
11.9
株価収益率
(倍)
12.3
17.8
21.1
7.8
12.1
営業活動によるキャッ
シュ・フロー
(百万円)
31,743
37,261
47,257
54,217
47,163
投資活動によるキャッ
シュ・フロー
(百万円)
△9,479
△11,530
△8,135
△23,891
△18,130
財務活動によるキャッ
シュ・フロー
(百万円)
△13,516
△17,418
△26,024
△35,154
△31,355
現金及び現金同等物の期末
残高
(百万円)
109,992
122,233
142,024
141,097
141,659
10,193
10,169
10,226
9,041
8,886
(3,004)
(3,100)
(3,259)
(3,165)
(3,218)
従業員数
(人)
(外、平均臨時雇用者数)
(注)1.潜在株式調整後1株当たり当期純利益金額については、潜在株式が存在しないため記載しておりません。
2/152
EDINET提出書類
株式会社ニフコ(E02386)
有価証券報告書
(2) 提出会社の経営指標等
回次
第70期
第71期
第72期
第73期
第74期
決算年月
2022年3月
2023年3月
2024年3月
2025年3月
2026年3月
売上高
(百万円)
83,365
86,391
98,691
96,197
99,084
経常利益
(百万円)
18,617
22,389
31,013
24,069
32,639
当期純利益
(百万円)
16,629
18,674
2,633
28,395
28,549
資本金
(百万円)
7,290
7,290
7,290
7,290
7,290
発行済株式総数
(千株)
107,508
107,508
100,257
100,257
100,232
純資産額
(百万円)
115,575
126,926
121,612
126,409
137,937
総資産額
(百万円)
191,152
202,483
187,605
187,209
188,573
(円)
1,153.75
1,270.14
1,225.62
1,327.86
1,481.19
62.00
64.00
64.00
75.00
110.00
(31.00)
(31.00)
(32.00)
(35.00)
(40.00)
1株当たり純資産額
1株当たり配当額
(内、1株当たり中間配当
額)
(円)
1株当たり当期純利益金額
(円)
164.62
186.37
26.44
293.01
302.79
潜在株式調整後1株当たり
当期純利益金額
(円)
−
−
−
−
−
自己資本比率
(%)
60.5
62.7
64.8
67.5
73.1
自己資本利益率
(%)
14.8
15.4
2.1
22.9
21.6
株価収益率
(倍)
17.0
20.1
146.0
12.2
14.5
配当性向
(%)
37.7
34.3
242.1
25.6
36.3
1,375
1,361
1,363
1,383
1,412
(411)
(383)
(354)
(347)
(365)
従業員数
(人)
(外、平均臨時雇用者数)
株主総利回り
(%)
70.7
96.1
100.4
95.3
118.1
(比較指標:配当込み
TOPIX)
(%)
(102.0)
(107.9)
(152.5)
(150.2)
(202.2)
最高株価
(円)
4,370
3,775
4,442
3,997
5,562
最低株価
(円)
2,608
2,484
3,382
2,930
3,068
(注)1.潜在株式調整後1株当たり当期純利益金額については、潜在株式が存在しないため記載しておりません。
2.最高株価及び最低株価は、2022年4月4日より東京証券取引所プライム市場におけるものであり、それ以前
については東京証券取引所市場第一部におけるものであります。
3. 2026年3月期の期末配当につきましては、2026年5月14日に発表したとおり、1株当たりの配当金70円を予
定しており、2026年6月24日開催の定時株主総会の議案として、付議する予定です。
3/152
EDINET提出書類
株式会社ニフコ(E02386)
有価証券報告書
2【沿革】
実質上の存続会社について
当社(1946年10月設立、旧商号江東企業株式会社、株式の額面金額50円)は、「株式会社ニフコ(株式の額面金
額500円)」(1967年2月設立、工業用ファスナー(留具)の製造、販売を行ってきた。)と「日英物産株式会
社」(1953年5月設立、葉たばこ、雑豆等の輸入、工業用ファスナー(留具)の輸出入、販売を行ってきた。)が
1977年10月に合併するにあたり、両社の株式額面を500円から50円に変更するため、形式上の存続会社となり、両
社を吸収合併いたしました。
したがいまして、被合併会社のうち、売上並びに総資産において規模の優る株式会社ニフコ(株式の額面金額
500円)を実質上の存続会社として記載いたします。
当社は、日英物産株式会社と米国イリノイ・ツール・ワークス社(工業用ファスナーのメーカーで世界各国に子
会社、系列会社並びに提携会社を有している。)との合弁により1967年2月13日、設立されました。
1967年2月
日英物産株式会社と米国イリノイ・ツール・ワークス社は日本工業ファスナー株式会社(1970年
12月株式会社ニフコと商号変更)を資本金48,000千円をもって設立し、同時にイリノイ・ツー
ル・ワークス社と技術援助契約を締結する。
[なお、株式額面変更目的で、1977年10月に株式会社ニフコ(合併を前提に休眠会社江東企業株
式会社を1977年5月26日に株式会社ニフコと商号変更した株式の額面金額50円の形式的存続会
社)に吸収合併されたため、登記上の設立年月日は1946年10月8日となっている。]
1969年7月
大阪市西区に大阪営業所を設置する。
1976年12月
愛知県豊田市に名古屋工場を新設する。
1977年10月
日英物産株式会社を吸収合併する(株式の額面金額を500円から50円に変更)。
1978年5月
福岡県京都郡に北九州営業所を設置する。
1979年7月
東京証券取引所市場第2部に上場する。
1980年9月
神奈川県相模原市に相模原工場を新設竣工する。
1982年4月
栃木県河内郡に宇都宮事業所を新設竣工する。
1983年1月
大阪営業所を大阪府吹田市に移転する。
1983年5月
台湾台北市に合弁会社、台湾扣具工業股份有限公司を設立する。
1984年3月
東京証券取引所市場第1部に指定される。
1984年4月
静岡県浜松市に浜松出張所(現浜松営業所)を設置する。
1985年1月
韓国亀尾市に合弁会社、Korea Industrial Fastener Corporation(現Nifco Korea Inc.)を設立
する。
1986年11月
米国オハイオ州に合弁会社、ITW-Nifco Inc.を設立する。
1987年7月
中国香港に子会社、Nifco (HK) Ltd.を設立する。
1987年8月
広島市安佐南区に広島事業所(現広島営業所)を新設竣工する。
1988年11月
タイのバンコク市に合弁会社、Union Nifco Co., Ltd.を設立する。
1990年2月
山形県山形市に合弁会社、株式会社JTニフコ(現株式会社ニフコ山形)を設立する。
1990年3月
東京都港区に東京支社を設置する。
1990年7月
英国クリーブランド州でElta Plastics Ltd.(現Nifco U.K. Ltd.)を買収する。
1990年10月
マレーシアのセランゴール州に合弁会社、Nifco (Malaysia) SDN BHD.(現Nifco Manufacturing
(Malaysia) Sdn. Bhd.)を設立する。
1991年12月
熊本県菊池郡に合弁会社、株式会社九州JTニフコ(現株式会社ニフコ熊本)を設立する。
1995年7月
シンガポールに子会社、Nifco (Singapore) Pte. Ltd.を設立する。
1996年3月
中国上海市に子会社、上海利富高塑料制品有限公司を設立する。
1996年4月
米国オハイオ州に子会社、Nifco U.S. Corporation(現Nifco America Corporation)を設立す
1996年7月
る。
株式会社ジャパンタイムズ並びにシモンズ株式会社及びSimmons Bedding & Furniture (HK)
Limited の株式を取得し、子会社とする。
1997年12月
米国オハイオ州で合弁会社、ITW-Nifco Inc.の株式を取得し、Nifco U.S. Corporation(現Nifco
America Corporation)を存続会社として合併させる。
4/152
EDINET提出書類
株式会社ニフコ(E02386)
有価証券報告書
1999年5月
九州営業所を北九州市小倉北区に移転する。
2001年4月
スペインのアクリプラス・グループ4社(Nifco Products Espana, S.L.U.)を買収する。
2001年11月
2002年2月
中国広東省東莞市長安鎮に、台湾扣具工業股份有限公司との折半出資による子会社、台扣利富高
塑膠制品(東莞)有限公司を設立する。
中国広東省東莞市石龍鎮に子会社、東莞利富高塑料制品有限公司を設立する。
2002年6月
台湾の合弁会社である台湾扣具工業股份有限公司の株式を買増しして子会社とする。
2002年7月
タイのチョンブリ県に子会社、Nifco (Thailand) Co., Ltd.を設立する。
2004年11月
中国北京市の通州区に子会社、北京利富高塑料制品有限公司を設立する。
2005年1月
ベトナムのタイニン省に子会社、Kifco Vietnam Ltd.(現Nifco Vietnam Ltd.)を設立する。
2005年3月
合弁会社である株式会社JTニフコ(現株式会社ニフコ山形)及び株式会社九州JTニフコ(現株式
会社ニフコ熊本)の株式を、それぞれ買増しして子会社とする。
2006年2月
ポーランドのシフィドニツァ市に子会社、Nifco Poland Sp.z o.o.を設立する。
2007年3月
米国ケンタッキー州に子会社Nifco North America Inc.を設立する。
2007年6月
ドイツのエシュボルン市に子会社、Nifco Deutschland GmbH(Nifco KTS GmbH)を設立する。
2008年9月
タイの合弁会社であるUnion Nifco Co., Ltd.の株式を買増しして子会社とする。
2008年10月
米国アラバマ州に子会社、Nifco Korea USA Inc.を設立する。
2009年4月
2009年5月
2010年1月
2010年4月
子会社Nifco America Corporationが子会社Nifco North America Inc.を吸収合併する。
2010年6月
シモンズ株式会社が静岡県駿東郡に富士小山工場を新設竣工する。
中国天津市に子会社、利富高(天津)精密樹脂制品有限公司を設立する。
中国上海市に子会社、利富高企業管理(上海)有限公司を設立する。
インドのグルガオン市に子会社、Nifco India Private Ltd.を設立する。
2010年7月
インドのチェンナイ市に子会社、Nifco South India Manufacturing Private Ltd.を設立する。
2010年11月
中国湖北省鄂州市に子会社、利富高(湖北)精密樹脂制品有限公司を設立する。
2010年12月
ポーランドのジョルィ市に子会社、Nifco Korea Poland Sp.z o.o.を設立する。
2011年1月
中国江蘇省張家港市に子会社、利富高(江蘇)精密樹脂制品有限公司を設立する。
2011年5月
インドネシアのジャカルタ市に子会社、PT.Nifco Indonesiaを設立する。
2011年6月
中国江蘇省塩城市に子会社、利富高(塩城)精密樹脂制品有限公司を設立する。
2012年7月
メキシコのイラプアト市に子会社、Nifco Central Mexico S.de R.L.de C.V.を設立する。
2013年3月
神奈川県横須賀市にニフコ技術開発センターを新設竣工する。
2013年4月
ドイツのKTS社及びそのグループ会社を買収する。
2014年5月
2015年1月
2015年4月
2015年9月
2016年8月
2018年4月
2018年11月
2018年12月
2019年5月
2019年7月
ドイツのKTW社及びそのグループ会社を買収する。
本社を神奈川県横須賀市に移転する。
米国ジョージア州に子会社、Nifco KTW America Corporationを設立する。
中国重慶市に子会社、利富高(重慶)精密樹脂制品有限公司を設立する。
神奈川県横須賀市に防爆棟、実験棟を新設竣工する。
新たに企業理念、コーポレートロゴ、コーポレートスローガンを制定し、運用を開始する。
東京支社を東京都港区内で移転する。
東京都港区に子会社、株式会社ニフコ北関東を設立する。
子会社、株式会社ニフコ熊本が本社を熊本県菊池市に移転する。
子会社、Nifco KTW GmbHを存続会社とし、子会社、Nifco KTS GmbHを消滅会社とした吸収合併を
行い、存続会社の商号をNifco Germany GmbHへ変更する。
2019年12月
2021年6月
2022年4月
2022年12月
2026年1月
子会社、株式会社ニフコ北関東の本社を栃木県足利市に移転する。
監査等委員会設置会社へ移行する。
東京証券取引所プライム市場に移行する。
ドイツのゾーリンゲン市に子会社、Nifco Europe GmbHを設立する。
広島営業所を広島県広島市東区に移転する。
5/152
EDINET提出書類
株式会社ニフコ(E02386)
有価証券報告書
3【事業の内容】
当社グループは、当社及び連結子会社46社により構成されており、営んでいる主な事業内容と、当該事業における
位置付け及びセグメントとの関連は、次のとおりであります。
なお、次の2部門は、「第5
経理の状況
1.連結財務諸表等(1)連結財務諸表
注記事項」に掲げるセグメ
ントの区分と同一であります。
(合成樹脂成形品事業)
工業用プラスチック・ :
当社が合成樹脂成形製品及び金型の製造・販売を行っているほか、株式会社ニフコ山
ファスナー及びプラス
形、株式会社ニフコ熊本、株式会社ニフコ北関東等が合成樹脂成形製品及び金型の製造・
チック精密成形部品
販売を行っております。
金型
そのほか海外でNifco America Corporation、Nifco U.K. Ltd.、Nifco Korea Inc.、東
莞利富高塑料制品有限公司、台湾扣具工業股有限公司、Nifco (Thailand) Co.,Ltd.等が
合成樹脂成形製品及び金型の製造・販売を行っております。
これらのうち一部について、当社と子会社間で相互に仕入れ、販売しております。
(ベッド及び家具事業) :
シモンズ株式会社がベッドの製造・販売及び家具の輸入・販売を行っております。
そのほか海外でSimmons Bedding & Furniture (HK) Limited等がベッド及び家具事業を
行っております。
6/152
EDINET提出書類
株式会社ニフコ(E02386)
有価証券報告書
事業の系統図は次のとおりであります。
連結子会社は次のとおりであります。
7/152
EDINET提出書類
株式会社ニフコ(E02386)
有価証券報告書
連結子会社
(1)
Nifco America Corporation
合成樹脂成形品の製造・販売
(2)
Nifco Korea USA Inc.
合成樹脂成形品の製造・販売
(3)
Nifco Central Mexico S.de R.L.de C.V.
合成樹脂成形品の製造・販売
(4)
Guadalupe Property & Assets, S.de R.L.de C.V.
合成樹脂成形品事業
(5)
Nifco Europe GmbH
合成樹脂成形品事業
(6)
Nifco U.K. Ltd.
合成樹脂成形品の製造・販売
(7)
Nifco Poland Sp.z o.o.
合成樹脂成形品の製造・販売
(8)
Nifco Korea Poland Sp.z o.o.
合成樹脂成形品の製造・販売
(9)
上海利富高塑料制品有限公司
合成樹脂成形品の販売
(10) 東莞利富高塑料制品有限公司
合成樹脂成形品の製造・販売
(11) 台扣利富高塑胶制品(東莞)有限公司
合成樹脂成形品の製造・販売
(12) 北京利富高塑料制品有限公司
合成樹脂成形品の販売
(13) 利富高(天津)精密樹脂制品有限公司
合成樹脂成形品の製造・販売
(14) 利富高(湖北)精密樹脂制品有限公司
合成樹脂成形品の製造・販売
(15) 利富高(江蘇)精密樹脂制品有限公司
合成樹脂成形品の製造・販売
(16) 利富高(塩城)精密樹脂制品有限公司
合成樹脂成形品の製造・販売
(17) Nifco (HK) Ltd.
合成樹脂成形品事業
(18) 台湾扣具工業股份有限公司
合成樹脂成形品の製造・販売
(19) Nifco Korea Inc.
合成樹脂成形品の製造・販売
(20) Nifco (Thailand) Co.,Ltd.
合成樹脂成形品の製造・販売
(21) Union Nifco Co., Ltd.
合成樹脂成形品の製造・販売
(22) Nifco Manufacturing (Malaysia) Sdn. Bhd.
合成樹脂成形品の製造・販売
(23) Nifco Vietnam Ltd.
合成樹脂成形品の製造・販売
(24) Nifco India Private Ltd.
合成樹脂成形品の製造・販売
(25) Nifco South India Manufacturing Private Ltd.
合成樹脂成形品の製造・販売
(26) PT.Nifco Indonesia
合成樹脂成形品の製造・販売
(27) 株式会社ニフコ山形
合成樹脂成形品の製造・販売
(28) 株式会社ニフコ熊本
合成樹脂成形品の製造・販売
(29) 株式会社ニフコ北関東
合成樹脂成形品の製造・販売
(30) シモンズ株式会社
ベッドの製造・販売、家具の輸入・販売
(31) Simmons Bedding & Furniture (HK) Limited
ベッド及び家具事業
(32) 上海席梦思床褥家具銷售有限公司
ベッド及び家具の販売
(33) 北京席梦思床褥家具有限公司
ベッド及び家具の販売
(34) 深圳席梦思床褥家具有限公司
ベッド及び家具の販売
(35) 席梦思床褥家具(蘇州)有限公司
ベッドの製造・販売
(36) Simmons (Southeast Asia)Private Limited
ベッド及び家具の販売
(37) 台湾席夢思股份有限公司
ベッド及び家具の販売
他9社
8/152
EDINET提出書類
株式会社ニフコ(E02386)
有価証券報告書
4【関係会社の状況】
(連結子会社)
資本金
主要な事業の内容
議決権
の所有
割合
(%)
Nifco America Corporation Ohio,
U.S.A.
(注)1、4
百万米ドル
3.5
合成樹脂成形品の製造・
販売
100
役員の兼任あり。
Nifco Korea USA Inc.
(注)3
百万米ドル
5.5
合成樹脂成形品の製造・
販売
100
(75)
役員の兼任あり。
Nifco Central Mexico S.de Guanajuato,
R.L.de C.V.(注)1、3
Mexico
百万メキシコ
ペソ
325.2
合成樹脂成形品の製造・
販売
100
(52.51)
Guadalupe Property &
Assets, S.de R.L.de C.V.
(注)1、3
Guadalupe,
Mexico
百万メキシコ
ペソ
268.2
合成樹脂成形品事業
100
(75)
役員の兼任あり。
Nifco Europe GmbH
(注)1
Solingen,
Germany
千ユーロ
30.0
合成樹脂成形品事業
100
役員の兼任あり。
Nifco U.K. Ltd.
(注)1
Stockton-on-Tees,
United Kingdom
百万英ポンド
14.5
合成樹脂成形品の製造・
販売
100
役員の兼任あり。
Nifco Poland Sp.z o.o.
(注)1、3
Swidnica,
Poland
百万ズロチ
9.0
合成樹脂成形品の製造・
販売
100
(100)
当社は運転資金等の貸付けを行っ
ております。
役員の兼任あり。
Nifco Korea Poland Sp.z
o.o.(注)1、3
Zory,
Poland
百万ズロチ
6.0
合成樹脂成形品の製造・
販売
100
(100)
役員の兼任あり。
上海利富高塑料制品
有限公司(注)3
中国
上海市
百万米ドル
3.0
合成樹脂成形品の販売
100
(100)
役員の兼任あり。
東莞利富高塑料制品
有限公司(注)1、3
中国
広東省
百万香港ドル
75.0
合成樹脂成形品の製造・
販売
90
(90)
役員の兼任あり。
台扣利富高塑膠制品
(東莞)有限公司(注)3
中国
広東省
百万米ドル
1.9
合成樹脂成形品の製造・
販売
100
(100)
役員の兼任なし。
北京利富高塑料制品
有限公司(注)1、3
中国
北京市
百万米ドル
14.5
合成樹脂成形品の販売
100
(100)
役員の兼任あり。
利富高(天津)精密樹脂制
品有限公司(注)1、3
中国
天津市
百万米ドル
18.5
合成樹脂成形品の製造・
販売
100
(100)
役員の兼任あり。
利富高(湖北)精密樹脂制
品有限公司(注)1、3
中国
湖北省
百万米ドル
10.0
合成樹脂成形品の製造・
販売
100
(100)
役員の兼任あり。
利富高(江蘇)精密樹脂制
品有限公司(注)1、3
中国
江蘇省
百万米ドル
15.6
合成樹脂成形品の製造・
販売
100
(100)
役員の兼任あり。
利富高(塩城)精密樹脂制
品有限公司(注)1、3
中国
江蘇省
百万米ドル
50.5
合成樹脂成形品の製造・
販売
100
(100)
役員の兼任あり。
Nifco (HK) Ltd.
(注)1
Hong Kong
百万香港ドル
200.0
合成樹脂成形品事業
100
役員の兼任あり。
台湾扣具工業股份
有限公司
台湾
桃園市
百万台湾ドル
150.0
合成樹脂成形品の製造・
販売
100
役員の兼任なし。
Nifco Korea Inc.
(注)1、4
Asan-si,
Korea
百万ウォン
34,400.0
合成樹脂成形品の製造・
販売
100
役員の兼任あり。
Nifco (Thailand) Co.,Ltd. Chonburi,
Thailand
(注)1
百万バーツ
320.0
合成樹脂成形品の製造・
販売
100
役員の兼任あり。
百万バーツ
100.0
合成樹脂成形品の製造・
販売
50
役員の兼任あり。
名称
Union Nifco Co., Ltd.
住所
Alabama,
U.S.A.
Bangpakong,
Thailand
9/152
関係内容
役員の兼任あり。
EDINET提出書類
株式会社ニフコ(E02386)
有価証券報告書
名称
住所
資本金
主要な事業の内容
議決権
の所有
割合
(%)
関係内容
Nifco Manufacturing
(Malaysia) Sdn. Bhd.
Selangor,
Malaysia
百万マレーシ
アリンギット
7.5
合成樹脂成形品の製造・
販売
100
役員の兼任あり。
Nifco Vietnam Ltd.
(注)3
Tay Ninh,
Vietnam
百万米ドル
2.4
合成樹脂成形品の製造・
販売
100
(75)
役員の兼任あり。
Nifco India Private Ltd.
(注)1
Haryana,
India
百万インド
ルピー
1,620.4
合成樹脂成形品の製造・
販売
100
当社は運転資金等の貸付けを行っ
ております。
役員の兼任あり。
Nifco South India
Manufacturing Private
Ltd.(注)1、3
Tamilnadu,
India
百万インド
ルピー
1,300.7
合成樹脂成形品の製造・
販売
100
(75)
役員の兼任あり。
PT.Nifco Indonesia
(注)1
Jawa Barat,
Indonesia
百万米ドル
18.8
合成樹脂成形品の製造・
販売
100
役員の兼任あり。
株式会社ニフコ山形
(注)1
山形県
山形市
百万円
300.0
合成樹脂成形品の製造・
販売
100
役員の兼任あり。
株式会社ニフコ熊本
(注)1
熊本県
菊池市
百万円
800.0
合成樹脂成形品の製造・
販売
100
当社は運転資金等の貸付けを行っ
ております。
役員の兼任あり。
株式会社
ニフコ北関東
栃木県
足利市
百万円
100.0
合成樹脂成形品の製造・
販売
100
当社は運転資金等の貸付けを行っ
ております。
役員の兼任あり。
シモンズ株式会社
東京都
港区
百万円
259.1
ベッドの製造・販売
家具の輸入・販売
99.9
役員の兼任あり。
Simmons Bedding &
Furniture (HK) Limited
(注)3
Hong Kong
百万香港ドル
10.0
ベッド及び家具事業
100
(100)
役員の兼任なし。
上海席梦思床褥家具銷售有
限公司(注)3
中国
上海市
百万米ドル
ベッド及び家具の販売
0.4
100
(100)
役員の兼任なし。
席梦思床褥家具(蘇州)有
限公司(注)1、3
中国
江蘇省
百万米ドル
25
ベッドの製造・販売
100
(100)
役員の兼任なし。
Simmons (Southeast Asia)
Private Limited
(注)3
Beach Road,
Singapore
百万シンガ
ポールドル
0.3
ベッド及び家具の販売
100
(100)
役員の兼任なし。
台湾席夢思股份有限公司
(注)3
台湾
台北市
百万台湾ドル
1.0
ベッド及び家具の販売
100
(100)
役員の兼任なし。
他11社
10/152
EDINET提出書類
株式会社ニフコ(E02386)
有価証券報告書
(注)1.特定子会社に該当しております。
2.上記連結子会社のうち、有価証券届出書又は有価証券報告書を提出している会社はありません。
3.「議決権の所有割合」の欄に記載されている(
)内は間接所有割合で内数となっております。
4.Nifco America Corporation及びNifco Korea Inc.については、売上高(連結会社相互間の内部売上高を除
く)の連結売上高に占める割合が10%を超えております。
Nifco America Corporation
主要な損益情報等
(1) 売上高
57,675百万円
(2) 経常利益
5,266百万円
(3) 当期純利益
4,192百万円
(4) 純資産額
26,793百万円
(5) 総資産額
34,906百万円
(1) 売上高
54,879百万円
(2) 経常利益
10,446百万円
Nifco Korea Inc.
主要な損益情報等
(3) 当期純利益
8,507百万円
(4) 純資産額
48,706百万円
(5) 総資産額
56,636百万円
11/152
EDINET提出書類
株式会社ニフコ(E02386)
有価証券報告書
第2【事業の状況】
1【経営方針、経営環境及び対処すべき課題等】
当社グループの経営方針、経営環境及び対処すべき課題等は、以下のとおりであります。
なお、文中の将来に関する事項は、当連結会計年度末現在において当社グループが判断したものであります。
(1) ニフコの企業理念
当社は、1967年の創業以来培ってきた「チャレンジ精神」と「創造性」をニフコスピリットの支柱として成長し
続けてきました。これまでの歴史を踏まえ、今後更なる成長ステージへ進む決意を込めて、当社のPurpose /
Mission / Valuesを以下のとおり制定しております。
社員一人ひとりが個々に持つ「My Purpose」を起点に、当社のValues(価値観)を通じて、Mission(使命)を
果たすことで、当社のPurpose(存在意義)の実現を図る、これがニフコグループの企業理念です。今後も、当社
は、ニフコらしさを追求しながら持続的に成長し、お客様、取引先、従業員、株主、投資家、地域社会など全ての
ステークホルダーから信頼され続ける企業であり続けることを目指します。
(2) 長期ビジョン(NIFCO GROUP VISION 2035)
当社グループは、工業用ファスナーを起点として、自動車の内装・外装・先進運転支援システム(ADAS)部品、電
動車(xEV)のパワートレイン関連部品、二輪関連部品を中心に、住宅・家電・スポーツなど非Mobility製品向けも
含めた、各種エンジニアリングプラスチック製品をグローバルに製造・販売しております。これらの製品は軽い、
錆びない、扱いやすい、という特長により、加工性にも優れており、特に自動車などの製品のものづくりの現場に
おける作業負担を軽くするだけでなく、その軽量化とコストダウンにも貢献しております。
このたび、当社は、2035年に向けた長期ビジョン(NIFCO GROUP VISION 2035)として「”アイデア”を”カタ
チ”にする会社」と定め、その到達像として、「世界のMobility社会をリードする”Great”Company」の実現を目
指します。本ビジョンは、独立系の自動車部品メーカーとして、これまで築き上げた顧客対応力、技術開発力をさ
らに磨き、変化の激しい自動車市場の中にあっても、Mobility事業の更なる成長を図る決意を示し、併せて、既存
事業から発展させた新規事業や非Mobility事業の成長を目指すものです。
また、当社は、2021年度より、ローリング型の3ヶ年中期経営計画を採用してまいりましたが、2026年度よりそ
の運営方針を見直しました。具体的には、2035年の長期ビジョンを起点としたバックキャスト型の経営計画体系へ
移行し、長期ビジョンの実現に向けて、3回の中期経営計画(フェーズ①〜③)を段階的に策定する方針としてい
ます。
このうち、フェーズ①を次期中期経営計画として位置づけ、3年後の到達目標を予め固定したうえで、当該目標
に対する具体的な施策を策定・実行する「固定型中期経営計画」へ転換しました。本移行により、中期経営計画の
位置づけをより明確化するとともに、目標達成に向けた経営陣の責任とコミットメントを一層強化することを意図
しております。
12/152
EDINET提出書類
株式会社ニフコ(E02386)
有価証券報告書
(3)
経営環境
現在、当社を取り巻く経営環境は、資源価格の高騰や地政学リスクの顕在化、環境規制の強化といった経済・社
会環境の変化に加え、当社の主要事業分野である自動車市場における電動化や自動運転をはじめとする技術進化に
加え、新興市場の拡大、新興自動車メーカーの台頭など、大きな構造変化が進展しております。さらに、顧客ニー
ズにおいても、機能や性能に加え、体験価値や快適性を重視する「モノからコトへの価値観シフト」が進展し、
ニーズの多様化が一層進んでおります。
このような経営環境の変化に対し、当社の主力製品及び事業領域は、環境負荷低減や安全性・快適性の向上と
いった市場ニーズとの親和性が高く、既にこれらの変化に適合した事業構造を有しています。
当社グループは、これまで培ってきた「気づく力」に基づく提案力と、高い技術力・開発力を強みとして、変化す
る市場環境を成長機会として捉えてきました。
今後も強固な経営基盤のもと、挑戦を続ける企業文化と人材の育成を通じて、環境・安全・快適性能といった普
遍的な価値を提供し続けることで、顧客ニーズへの適合を一層高め、顧客基盤の拡大及び自動車1台当たりの搭載
金額の最大化につなげ、持続的な成長の実現を目指してまいります。
(4) 次期中期経営計画(フェーズ①2026年度〜2028年度)と重要課題
2035年の長期ビジョンである「”アイデア”を”カタチ”にする会社」、その到達像として「世界のMobility社
会をリードする”Great”Company」の実現に向け、次期中期経営計画(フェーズ①2026年度〜2028年度)において
13/152
EDINET提出書類
株式会社ニフコ(E02386)
有価証券報告書
は、成長戦略及び資本政策を重点施策と位置付けるとともに、これらを支える経営基盤の強化に取り組むこととし
ており、以下を重要課題と捉えております。
①成長戦略:当社グループの成長戦略の中核は、既存Mobility事業の更なる拡大であります。
当社の強みであるエンジニアリング力と顧客密着型の提案営業を起点に、商品×顧客×地域の組み合わせを高度
化することで、事業の量的拡大と収益性の向上を同時に実現してまいります。具体的には、日系・韓国系自動車
メーカー向けにおいては、環境・安全・快適といった普遍的価値商品に加え、高級化・電動化を背景とした感性価
値商品の開発・市場投入を加速させることで、自動車1台あたりの搭載金額(原単位)の最大化を図ります。
さらに、日系・韓国系自動車メーカーとの共創により生み出された商品を、その他の自動車メーカーで展開可能
なグローバル戦略商品へと発展させ、グローバル市場での横展開を推進してまいります。加えて、中国・中資系自
動車メーカービジネスについては、「日系依存モデル」から「中国起点モデル」への転換を進め、中国市場におけ
る自律的な成長基盤の確立を図っております。中国R&Dセンター及び中国統括会社の設立を通じて、迅速な意思決
定と課題解決提案を可能とする中国自己完結型モデルを構築し、スピードと提案力を競争優位の源泉とした事業拡
大を進めてまいります。
また、インド市場においては、自動車需要の拡大を成長機会と捉え、生産体制の増強及び現地完結型の開発・設
計体制の強化を進めてまいります。インドにおける日系・韓国系自動車メーカービジネスの収益を伴った成長基盤
の発展に加え、インド系自動車メーカーとの取引拡大を通じて、「スピード」「提案力」「信頼性」を兼ね備えた
Tier1サプライヤーとしてのポジション確立を目指してまいります。
これらの既存Mobility事業の発展に加え、既存非Mobility事業の拡大及び、新規事業(次世代高度整備事業、
ICT事業等)については、既存事業で培った技術・顧客基盤を起点とした既存事業の発展領域として、段階的に育
成してまいります。当社グループは、既存事業の確実な成長を軸に、将来の成長エンジンとなる事業ポートフォリ
オの創出を進めてまいります。
②資本政策:資本政策においては、強固な財務基盤の維持を前提に、成長投資と株主還元の両立を進めてまいりま
す。まず、上述の成長戦略を支えるために、中国・中資系自動車メーカー向けビジネス、インド市場ビジネス強化
に向けた投資、戦略的優位性構築に向けたM&Aや事業提携のための投資、生産性向上に向けた設備投資などの戦略
的投資を実行いたします。さらに、資本効率を重視し、明確な指標を定めて事業運営を行います。また、自己資本
比率や現預金水準の健全化を図り、環境変化に対応可能な健全な財務基盤を維持してまいります。
③経営基盤強化:事業の持続的成長を支える経営基盤として、まず人的資本の強化を重要課題とし、「働きがい」
と「働きやすさ」を追求した基盤構築を進め、経営戦略と連動したグローバル人材育成、従業員エンゲージメント
向上、DE&I推進による組織の活性化を進めます。さらに、カーボンニュートラル(CN)/サーキュラーエコノミー
(CE)活動の推進や環境対応材料の開発・採用などの環境配慮経営の実践、解析・評価・分析を軸とした要素技術
の深化によるエンジニアリング力の強化、デジタル化の推進、ものづくり体制の強化、コーポレートガバナンス強
化を進めてまいります。
次期中期経営計画(フェーズ①
です。
2026年度〜2028年度)の最終年度における経営指標(数値)は以下のとおり
14/152
EDINET提出書類
株式会社ニフコ(E02386)
有価証券報告書
2028年度
2025年度実績
2035年度
目標
2025年度比
目標
売上高
3,526億円
4,000億円
+13.4%
5,000億円
営業利益
480億円
580億円
+20.5%
750億円
営業利益率
13.6%
14.5%
+0.9%pt
15%
当期純利益
340億円
400億円
+17.6%
500億円
ROE
11.9%
13.0%
+1.0%pt
16.0%
84%
87%
+3%pt
89%
1ドル=153円
1ドル=135円
従業員エンゲージメント
為替前提
1ドル=149.6円
(注)1.当期純利益は、親会社株主に帰属する当期純利益を指します。
2.従業員エンゲージメントは、隔年で実施するグローバル従業員エンゲージメントサーベイにおける「持
続可能なエンゲージメント」の好意的回答率を指します。
15/152
EDINET提出書類
株式会社ニフコ(E02386)
有価証券報告書
2【サステナビリティに関する考え方及び取組】
(1)サステナビリティに関する考え方
当社グループは、「小さな気づきと技術をつなぎ、心地よい生活と持続可能な社会を創造する」というパーパスの
もと社会課題や顧客の困りごとをチャンスと捉え、「提案力」「グローバル展開力」「品質対応力」を強みとして、
独創的かつ付加価値の高い製品を創り出します。また、環境・社会の変化を踏まえた価値提供の拡充により、社会課
題の解決と事業成長の好循環を創出し、長期ビジョンである「"アイデア"を"カタチ"にする会社」の実現を目指しま
す。更に、社会課題をチャンスと捉え、当社グループは、既存事業の進化に加え、未来を創る既存事業の発展(新規
事業の創出)を通じて持続可能な社会への貢献を図ります。当社のサステナビリティ経営は、事業戦略を起点として
財務戦略及びESG戦略を一体的に推進する枠組みのもとで推進されています。これら三位一体の戦略は、リスクと機
会を適切に管理する各種委員会を通じて統合的に運営されており、経営計画との整合を図りながら継続的に高度化を
進めています。
なお、文中の将来に関する事項は、提出日現在において当社グループが判断したものであります。
①サステナビリティに関するガバナンス
当社グループのサステナビリティに関するガバナンス体制において、リスクの管理はリスクマネジメント委員会
が、機会の管理はサステナビリティ委員会が担っています。サステナビリティ委員会はサステナビリティ全般に関
する機会について議論を行い、重要課題の統制及び取組状況の管理を行ったうえで、その結果を経営会議に報告・
提言します。リスクについては、リスクマネジメント委員会が総合的なリスク評価を行い、各主管組織の取組状況
等を経営会議に報告・提言します。経営会議で議論されたサステナビリティ全般の機会とリスクは、当社の各事業
部門及びグループ各社の経営計画に反映されます。2025年度のサステナビリティ委員会の開催状況については、
「第4 提出会社の状況 4.コーポレート・ガバナンスの状況等(1)コーポレート・ガバナンスの概要 ②企
業統治の体制の概要当該体制を採用する理由 イ.会社の機関の基本説明」をご参照ください。
2025年度のサステナビリティ委員会の構成員は、社内取締役、常勤監査等委員、本部長、事業部長、カンパニー
長、人事部長、法務室長、情報システム部長で構成されています。サステナビリティ委員会の委員長は、ESG推進
室長が務めます。
コーポレート・ガバナンスの体制図
16/152
EDINET提出書類
株式会社ニフコ(E02386)
有価証券報告書
②リスク及び機会の管理
当社グループのサステナビリティ関連のリスクについては、リスクマネジメント基本規程に定めるリスク類型の
枠組みの中に組み込まれており、全社リスクと一体的に管理しています。具体的には、対応を主管する各組織がリ
スクを識別・分析し、発生頻度と影響額の観点から評価を行った上で対応策を立案します。それらをもとにリスク
マネジメント委員会が総合的なリスク評価と対応策の決定を行い、進捗を経営会議に報告・提言します。リスク対
策の実行・運営は、リスクマネジメント委員会の指示のもと、主管する各組織にて行われます。
サステナビリティに関する機会については、サステナビリティ委員会が統制を行います。2025年度にマテリアリ
ティの改訂を行い、GRIやSASBなどの国際的なフレームワークを参照しつつ、社内の各本部長層の意見も踏まえ、
定性的な観点から、気候変動・人的資本を含むサステナビリティ全般の重要な機会の識別・評価・見直しを実施し
ました。今後もサステナビリティ委員会を通じてこれらの機会の管理を継続し、進捗を経営会議に報告・提言しま
す。機会に関する対策の実行及び運営は、サステナビリティ委員会の指示のもと、主管する各組織にて行われま
す。
③各重要課題の戦略及び目標と取組状況
[マテリアリティの特定]
当社グループは、サステナビリティ経営の基盤強化を目的として、2020年にマテリアリティ(重要課題)を特定
し、2025年度にその内容を改訂しました。
マテリアリティの特定にあたっては、GRI・SASBなどの国際的なサステナビリティ開示フレームワークを参照し
たロングリストを起点に、社会・環境への影響の観点(インパクトマテリアリティ)と財務への影響の観点(財務
マテリアリティ)の双方を踏まえて重要課題の絞り込みを行いました。その後、対応を主管する組織での検討を重
ね、取締役会の承認を経て2020年のマテリアリティが決定しました。
2025年度の改訂では、特定済みのマテリアリティ項目をベースとしつつ、事業環境の変化や社内各組織の取組状
況を踏まえ、サステナビリティ委員会メンバー(社内取締役、常勤監査等委員、各本部長・事業部長等)が参画
し、サブ課題の見直し、リスクと機会の再評価、中長期目標・数値目標(KPI)・主な取組みの追記・更新を行い
ました。
本マテリアリティは、中期経営計画の実行とNIFCO GROUP VISION 2035及びパーパスの実現、ならびに持続可能
な成長と社会的価値の創造を両立させていくことを目的としています。
各マテリアリティ項目にはリスク・機会のオーナー部署を社内設定しており、リスクについてはリスクマネジメ
ント委員会が、機会についてはサステナビリティ委員会が、目標達成に向けた計画及び進捗を定期的に委員会にて
モニタリングします。
当社グループのマテリアリティは以下のとおりです。なお、このうち財務的影響が特に大きいと判断した「気候
変動に関する取組」「人的資本に関する取組」及び「その他の重要課題」について、以降に戦略・目標・取組状況
を記載します。
17/152
EDINET提出書類
株式会社ニフコ(E02386)
有価証券報告書
2025年度 ニフコマテリアリティ
18/152
EDINET提出書類
株式会社ニフコ(E02386)
有価証券報告書
(2)気候変動に関する取組
当社グループは、マテリアリティの一つに「気候変動への対応」を掲げており、その副次的な課題として「化石
由来のCO2排出量削減」と「環境性能を向上させる製品の開発」を推進しております。そのため、国際的に推奨さ
れるガイダンスによるシナリオ分析を実施しています。その結果、当社グループの気候変動に関するリスクと機会
への中長期戦略として、カーボンニュートラルの実現に向けた取組の推進が重要であると認識しています。Scope1
(自社における直接排出)及びScope2(自社が購入・使用した電力、熱、蒸気などのエネルギー起源の間接排出)
のCO2排出量を指標とし、2050年にカーボンニュートラル実現を目指す「2050年カーボンニュートラル宣言」をし
ています。
①気候変動に関するガバナンス
気候変動に関するガバナンスは、ESG推進室が事務局を務めるサステナビリティ委員会において、主管する組織と
連携し、シナリオ分析、リスクと機会の抽出、カーボンニュートラルの実現に向けた取組についての協議を行ってい
ます。そしてESG推進室が事務局となり、エネルギーの使用の合理化及び非化石エネルギーへの転換等に関する法
律・地球温暖化対策の推進に関する法律に基づき、半期に1回、法令に対応する組織として環境推進委員会を開催
し、計画に基づく進捗を管理しています。
気候変動に関するリスクと機会は、サステナビリティ委員会にて議論され、取組状況を管理して、その結果を経営
会議に報告・提言します。経営会議で議論された気候変動に関する議案は、サステナビリティ委員会を通して、当社
の各事業部門及びグループ各社の経営計画に反映されます。
②カーボンニュートラルの実現に向けた戦略
国際的に推奨されるガイダンスによるシナリオ分析の手法で導かれる2021年から2040年までの環境の変化予測に対
して、当社は、気候変動に起因する事業リスク及び機会の分析・評価を行いました。その結果、当社グループの気候
変動に関するリスクへの中長期戦略として、カーボンニュートラルの実現に向けた取組を推進していくことが重要課
題であると認識しており、Scope1及びScope2のCO2排出量を指標とし、2050年にカーボンニュートラル実現を目指す
「2050年カーボンニュートラル宣言」をしています。シナリオ分析の概要は次のとおりです。
シナリオ分析の概要
対象範囲
グループ連結対象企業(ベッド及び家具事業を除く)
時間軸
現在〜2040年
1.地球の平均気温の上昇を産業革命以前の水準から1.5℃以内に抑えるシナリオ(1.5 ℃シ
ナリオ)
参照情報
・IEA※1 WEO2021 NZE、SDSシナリオ
・IPCC※2 第6次評価報告書第1作業部会報告書より
SSP1-1.9、SSP1-2.6
2.地球の平均気温が産業革命以前の水準から4℃程度上昇するシナリオ(4℃シナリオ)
参照情報
・IEA WEO2021 STEPSシナリオ
・IPCC 第6次評価報告書第1作業部会報告書より
シナリオ構築
SSP2-4.5、SSP3-7.9、SSP5-8.5
・A-PLAT 推進費S-8気候予測データ
RCP8.5
※1 IEA
International Energy Agency(国際エネルギー機関)。第1次石油危機後の1974年11月に、
石油を中心としたエネルギーの安全保障を目的としOECD(経済協力開発機構)の枠内に設立さ
れた機関。現在は持続可能なエネルギー供給を目指し、気候変動の分析や省エネルギー政策、
クリーンエネルギーの推進政策等に貢献。
※2 IPCC
Intergovernmental Panel on Climate Change(気候変動に関する政府間パネル)。各国政府
の気候変動に関する政策に科学的な基礎を与えることを目的として、1988年8月にWMO(世界
気象機関)とUNEP(国連環境計画)により設立された政府間組織。気候変動に関する最新の科
学的知見をまとめた報告書を作成。
<気候変動に関連して想定される事業環境の変化>
a 1.5℃シナリオ(気候変動への緩和)において想定される事業環境の変化
19/152
EDINET提出書類
株式会社ニフコ(E02386)
有価証券報告書
1.5℃シナリオでは、自然環境は2040年ごろに平均気温が現在より1℃程度上昇し、台風や低気圧の風雨は強ま
り、洪水の発生頻度は現在の2倍程度になると想定されています。その激甚化する風水害に対して政府の投資が増
え、CO2排出量削減に向けたより厳しい基準が企業に迫られるようになる可能性があると想定されています。世界的
に気候変動への対応が進むことにより、自動車は化石燃料を用いる内燃機関が減少し、電気エネルギーを使う自動車
へのシフトが進むとともに、これまでの自動車メーカー以外の新規参入企業の存在感が増していく可能性がありま
す。顧客からは、化石資源を用いる内燃機関用の商品の発注が減り、電気エネルギーを使う自動車に必要な部品の発
注が増えるとともに、環境負荷低減を前提に設計、製造された製品を求められることが多くなると考えられます。ま
た、自動車のエンドユーザーの環境意識の高まりから、車の自己所有からシェアリングへのシフトが起こり、世界の
自動車生産台数が減少する可能性があります。
調達、製造においては、炭素税の導入により原材料の調達価格が上がり、また顧客からの要請により再生プラス
チック、バイオマスプラスチックなどの原材料への転換が増えていく可能性があります。風水害の激甚化によるサプ
ライチェーン、製造施設などの被災の可能性が高くなり、その場合は、イレギュラーな対応や操業停止を余儀なくさ
れる事態が起こる可能性があります。
b
4℃シナリオ(気候変動への適応)において想定される事業環境の変化
4℃シナリオでは、自然環境は2040年ごろに平均気温が現在より2℃程度上昇し、台風や低気圧の風雨は強まり、洪
水の発生頻度は現在の4倍程度になると言われています。激甚化する風水害に対して政府の対策は強化される可能性
があると言われています。気温上昇により、熱中症搬送者数は現在の2倍程度に増加するとともに、これまで少な
かった蚊媒介の感染症なども増えていく可能性があります。
化石資源の価格及びエネルギー料金は上昇していく可能性があります。また、風水害の激甚化によるサプライ
チェーン、製造施設などの被災頻度が高くなり、その場合は、イレギュラーな対応や操業停止を余儀なくされる事態
が増加する可能性があります。
以上のシナリオ分析より当社グループの経営に影響を及ぼす可能性があると想定される市場リスク、市場/技術リ
スク、急性リスク、市場/製品/サービスの機会を抽出しました。カーボンニュートラルの実現の戦略として、これら
のリスク及び機会に対応する取組が、主管する各組織において、通常業務の中で様々な形で実施されています。それ
らのうち、重要なものを以下の「④リスク及び機会に対する取組及び指標と目標」に記載しています。
③気候変動に関するリスク及び機会の管理
ESG推進室が事務局となって主管する組織と連携し、1.5℃シナリオ及び4℃シナリオ下における環境の変化から、
発生する可能性のある事業リスクと機会を抽出し、推測される財務への影響度について検討を行いました。その結
果、当社グループの経営に影響を及ぼす可能性があると想定される市場リスク、市場/技術リスク、急性リスクを抽
出しました。一方、その他の組織においても、当社グループの損失危機を管理するリスクマネジメント委員会の指示
のもと、気候変動に関するリスクの発生頻度と影響額の評価や対応策立案等について分析・検討を行っています。リ
スクマネジメント委員会では、主管組織より報告された気候変動に関するリスクについて、総合的に評価し、管理し
ています。
また、気候変動の機会についても同時に、シナリオ分析を経て、ESG推進室が事務局を務めるサステナビリティ委
員会において、主管する組織と連携し市場/製品/サービスの機会を抽出し、対応を主管する組織において取組を行っ
ています。サステナビリティに関する機会は、サステナビリティ委員会にて特定され、取組状況を管理して、その結
果を経営会議に提言します。経営会議で議論されたサステナビリティに関する機会は、サステナビリティ委員会を通
して、当社の各事業部門及びグループ各社の経営計画に反映されます。
④気候変動のリスク及び機会に対する取組及び指標と目標
a 気候変動に関するリスク及び機会の重要な取組と指標及び目標
国際的に推奨されるガイダンスによるシナリオ分析の手法で導かれる2021年から2040年までの環境の変化予測に
対して、財務面及び非財務面の両面から影響度の大きい気候変動のリスク項目を絞りこみ、検討を行いました。市
場リスクでは、電気自動車の普及が進み、従来のエンジン周りの部品や給油口周りの部品など、ガソリン車特有の
構造に関する機能部品が徐々に少なくなる可能性や、異業種からの自動車業界への参入が増え、異業種に納入して
いたメガサプライヤーなどが新たに競争相手となることが、中長期的に予想されます。市場/技術リスクでは、CO2
排出量を抑えた代替製品の出現により既存及び新興の自動車メーカーでの当社グループの商圏が減少する可能性が
あります。急性リスクでは、暴風雨、雪、凍結等の気候の激甚化によりサプライチェーンの断絶が起こる可能性が
高まり、それによって引き起こされる材料調達不足による顧客への供給リスク回避のために、高価な材料購入及び
輸送費負担が増加する可能性があります。一方、市場/製品/サービスの機会として、CO2排出量削減を目的とした、
より軽量な車や、電動車、再生可能エネルギー使用の機会などが急拡大することにより、モーター、バッテリー、
電池(全固体電池含む)、ブレーキ周りなど、特有の機能部品の需要が拡大する可能性があると考えます。これら
のリスク及び機会の主な取組は、対応を主管する各組織において、通常業務の中に様々な形で対応が取られていま
す。これらの移行リスク及び物理的リスク、そして気候変動に伴う機会に関する全ての指標は、社内において定
20/152
EDINET提出書類
株式会社ニフコ(E02386)
有価証券報告書
め、既に実行中ですが、事業戦略における重要性を鑑み、現在は非公開としています。今後、公開も視野に入れ慎
重に検討していきます。
b
「2050年カーボンニュートラル宣言」を実現するための指標及び目標
当社は、気候変動に対する中長期戦略として「2050年カーボンニュートラル宣言」をしています。CO2排出量削減
に関する主たる指標としまして、Scope1とScope2を対象に、2030年に当社及び国内グループ会社において2020年比で
33%削減、2050年にカーボンニュートラルを目指して取組を進めています。
2024年度のScope1及びScope2の排出量は、それぞれ576t-CO2、17,854t-CO2(合計18,430t-CO2)となりました。な
お、本数値は当社及び国内グループ会社を対象としたものです。また、有報発行時点では2025年度の集計が完了して
いないため、本有報においては2024年度実績を使用しています。前年度(2023年度:合計19,874t-CO2)と比較して
削減となっており、省エネ活動の成果が反映されています。
名古屋工場においては、2025年10月に、当社サプライチェーンにおける連携のもと、取引先の物流センター屋上を
活用した再生可能エネルギーの供給を開始し、60Hz帯地域最大規模となる1.8MWの太陽光発電の自己託送及び余剰売
電を開始しています。これにより、既設設備と合わせてScope2を6.2%削減(1,049t-CO2相当)する効果を見込んで
います。今後も継続的に再生可能エネルギーの導入を進め、早期にカーボンニュートラル達成モデル工場となること
を目指しています。
また、ニフコ北関東においても、2025年10月よりオンサイト太陽光発電設備による自家消費を開始しました。引き
続きニフコグループ全体で再生可能エネルギー比率の向上に取り組んでいきます。
Scope3については、GHGプロトコルに基づき、主に発注金額を算出根拠として算定しています。2024年度の排出量
は289,255t-CO2となりました。なお、本数値は国内単体を対象としたものです。また、発注金額を基礎とした算定方
法の性質上、為替変動・資材価格・輸送費の変動により数値が影響を受けるため、実態のCO2排出量と乖離が生じる
可能性があります。算定精度については、重要関係会社との連携強化を通じて段階的に向上させていく予定です。
なお、2025年度のScope1・Scope2・Scope3の実績数値については、2026年度の秋頃に当社ホームページ「サステナ
ビリティ」にて公開予定です。
https://www.nifco.com/csr/environment/index.html
Scope1、Scope2推移グラフ(当社及
び国内グループ会社)
Scope3推移グラフ(提出会社)
現在、当社及び国内グループ会社のScope1及びScope2については、排出量を開示しています。これらの情報把握及
び開示は、CO2排出に関する規制強化や炭素税の導入により事業コストの上昇や、脱炭素化に向けた顧客及び取引先
からの期待の高まりに対し、当社及び国内グループ会社内で影響の大きい分野や工程を特定して事前に対策を講じる
ことや、再生可能エネルギーの導入や効率的な設備投資、新技術開発の必要性を具体化することで、競争優位性を維
持するための行動指針の策定につながります。これにより、持続可能な成長の基盤を強化するとともに、そして国内
という限定的な範囲であっても、積極的なデータ開示は環境配慮を重視する顧客や投資家の信頼を得る手段となり、
ビジネス機会の拡大につながるとともに将来的には連結会社全体への展開に資するものと認識しています。
なお、現時点で海外拠点からのデータについては、データ精度の観点から現状では正式開示に至っておりません
が、グローバルでのデータ精度向上と第三者保証に耐えうる水準の管理体制の整備を視野に入れ、2025年度より環境
21/152
EDINET提出書類
株式会社ニフコ(E02386)
有価証券報告書
データ管理システムの導入を開始しました。今後は段階的に導入拠点数を拡大し、将来的なグローバル全拠点での
データ一元管理を目指してまいります。
また、Scope3(サプライチェーン全体における温室効果ガス排出量)の算定については、サプライチェーン全体に
おけるデータの保有状況や管理方法にばらつきがあるため、現時点では統一的に把握・算定することが困難となって
います。そのため、当社のみのCO2排出量開示としています。今後は、重要関係会社との連携強化を行い、Scope3に
関するデータの整備及び開示を段階的に検討していきます。
気候変動のリスク及び機会の影響の可能性は様々ですが、当社は企業価値を最大化すべく、これらのガバナンス及
びリスク・機会管理によって、今後も取組を適切に実施してまいります。
(3)人的資本に関する取組
①人的資本に関する戦略
人的資本につきましては、ニフコグループのパーパス及び中長期計画を実現するための重要な経営資源と考えて
おり、当社中期経営計画 "NIFCO GLOCAL STRATEGY"の長期ビジョンに基づき、「"アイデア"を"カタチ"にする」人
材の創出を当社及びグループ会社の人材戦略の目標としております。
「"アイデア"を"カタチ"にする」人材を創出するためには、「多様な人材が持つ能力を最大限に開発し発揮させ
る、エンゲージメントの高い職場」が必要となりますので、当社グループの企業理念を浸透させた組織・人材の土
台の上に、「人材育成」「DE&I」「従業員エンゲージメント」の3つを重要な柱とし、それぞれにおいて活動計画
を策定し実行しております。
まず、当社人材の土台となるのは、当社の企業理念 Purpose / Mission / Values となります。当社の企業理念
体系の起点は、各従業員が個々に持つ「My Purpose(マイパーパス)」すなわち、個々人の価値観、人生観と会社
の「Purpose(存在意義)」の重なりです。これを定めることにより、従業員個人と会社のつながり(パーパス・
ファスニング)を意識し、自身の人生観や価値観を活かすキャリアを自律的に見つけ、エンゲージメントを高めな
がら主体的・自律的に学び成長することができると考え、各従業員がマイパーパスを策定するワークショップを
2024年度より全社で展開しております。
ニフコグループ
企業理念体系
「人材育成」は、当社グループの持続的成長を支える最も重要な課題(マテリアリティ)の一つであり、競争力
の源泉と捉えています。当社において、グローバルスケールで活躍できる人材の要件/行動指針は、当社のValues
に基づき、「チャレンジ、イノベーション、コミュニケーション、コラボレーション」のキーワードとともに、各
GradeのGrade定義や行動指針として明文化されています。こうした人材の育成を目的に、階層別、キャリア、自己
啓発、語学、選抜、eラーニングの6つのカテゴリーで構成された研修体系図を制定・運用しております。また、
従業員の自律的なキャリア形成を促すため、資格取得奨励制度や外部のeラーニング受講費用の補助金制度などに
より、自己啓発にも取組みやすい制度を整えています。社内での研修だけでなく、海外トレーニー制度や他社留学
など越境体験の機会も提供しています。更に、Global次世代経営者育成においては、定期的に策定する管理職部課
長層サクセッションプランとの整合を踏まえ対象者を選抜し、育成を進めております。
「多様性」は、ニフコのグローバル競争力を一層高めるための重要な経営戦略のひとつと考えています。多様な
人材の適所配置により、属性や価値観が異なる個々人から生まれる小さな気づきを生かし、ニフコの強みであるイ
ノベーションや新製品・新技術の開発につなげ創造的なコラボレーションを実現することで人材の多様性の確保・
推進に取り組んでいます。具体的には、「心理的安全性の高い職場作り」を目的とした各種研修の実施、DE&I推進
の専門部隊によるあらゆる属性の社員が働きやすい職場環境を構築するための様々な施策の企画・実行、更に、自
己申告や社内公募を通した社内異動により、各組織に多様な経験・スキルを持つ人材の適所配置に取り組んでいま
す。一方で、ニフコグループ企業行動憲章並びにニフコグループ人権方針に基づいた全社人権研修を行い、多様な
人材の活躍を阻害する人権リスクの低減にも努めています。
22/152
EDINET提出書類
株式会社ニフコ(E02386)
有価証券報告書
「従業員エンゲージメント」は、人材の定着率を高め、生産性・付加価値を最大化する中で重要な要素と考えま
す。まず、上述のパーパス・ファスニングにより、従業員個人と会社のつながりを固めた上で、各人が活き活きと
働くことができる職場環境を構築するため、人事制度や働き方の見直しを随時行っております。人事制度は、2024
年度に「ニフコ流JOB型人事制度」を導入(当社)、市場競争力を強化するためのGrade・評価・報酬制度の見直し
を行いました。また、働き方については、自由度を高めたフレックスタイム制度・休暇制度の拡充や、会社か自宅
のいずれかで働く場所を選べるようにテレワーク制度の導入など、働き方と休暇制度の充実を図ることで、高いエ
ンゲージメントを保ちながら、事業の持続的な発展に貢献できる職場作りを推進しております。また、この従業員
エンゲージメント向上のための各種施策は、隔年で実施するグローバル従業員エンゲージメントサーベイにおい
て、その効果を定期的に確認しております。
②人的資本に関するガバナンス
多様性に関する取組は管理本部DE&I推進プロジェクト室が、人材育成・エンゲージメントなどその他の人的資本
に関する取組は管理本部人事部が、それぞれ主管組織として行動計画の策定・実行しており、各領域の機会認識か
ら行動計画を定め運営しております。人的資本に関する重要事項は、社長以下執行役員と事業部長が出席し定期的
に開催される「人材委員会」に報告され、討議されております。また、人的資本におけるリスクについては、取締
役監査等委員及び全本部長から構成されるリスクマネジメント委員会にて、全社リスク管理の一環として管理さ
れ、それを補完する仕組みとして、内部通報制度を設け、従業員及び社外関係者から社内(取締役監査等委員)及
び社外(顧問弁護士)の窓口で直接通報を受けております。これらの人的資本に関する執行側の取組は、定期的に
取締役会に報告され討議されております。
なお、取締役層のサクセッションプランと次世代育成については、取締役会の諮問委員会である指名・報酬・ガ
バナンス委員会が管掌しており、委員会として次世代経営者の選抜・育成に積極的に関与する体制となっておりま
す。
③人的資本に関するリスク及び機会の管理
人的資本に関するリスクを含む全ての事業リスクは、リスクマネジメント委員会が一元的に管理・統制しており
ます。各リスク項目は、対応を主管する組織により、定期的に発生頻度と影響額の点数付けがなされ、それらの分
析をもとに、リスクマネジメント委員会が総合的なリスク評価を実施、その後、リスク主管組織による対応策の立
案と実行をリスクマネジメント委員会が管理する体制としております。
一方、人的資本に関する機会を含むマテリアリティの機会については、サステナビリティ委員会が一元的に管理・
統制しており、主管組織による各機会に対する行動計画の立案と実行をサステナビリティ委員会が管理する体制と
しています。
④人的資本に関する各取組と指標及び目標
a 人権侵害リスク低減に向けた取組
多様な人材を活かすためには、まず人権侵害リスクのない職場作りが重要です。ニフコグループは、関係法令
及び国際ルールを遵守するとともにその精神を尊重し、社会的良識を持って行動するため、2021年に「ニフコグ
ループ人権方針」を策定しております。この人権尊重の取組を更に進め、当社内にある人権侵害リスクの排除を
目指し、2024年度は国内全社で人権研修及びアンケート調査を実施、社内に存在する人権リスクを可視化、その
結果に基づき、2025年度はe-ラーニングによる人権研修を実施しました。今後、可視化されたリスクの低減に向
けた対策の策定・実行を進めるとともに、同様の活動をグローバルに展開し、全ての従業員が活き活きと働ける
職場の実現を進めます。
b
人材育成に向けた取組
多様な人材が持つ能力を最大限に開発し、「"アイデア"を"カタチ"にする」人材を創出することが最重要課題
であることを踏まえ、「チャレンジ、イノベーション、コミュニケーション、コラボレーション」のキーワード
により明示された人材要件・行動指針を満たすグローバル人材を育成するため、当社においては、階層別、キャ
リア、自己啓発、語学、選抜、eラーニングの6つのカテゴリーで構成された研修体系図を毎年期初に制定し、
年間を通して研修体系図に則り各研修を実行・運営しております。海外・社外での就業体験が視野を広げ視座を
引き上げる、という考えのもと、海外トレーニー制度や、他社留学などの越境体験の機会も提供しています。海
外トレーニー制度では、毎年日本から海外へ、海外から日本へトレーニーの送り出し・受け入れを実施していま
す。また、Global次世代経営者育成研修においては、管理職のサクセッションプランを踏まえて選抜された部長
層から一般職層のメンバーに対し、視野を広め視座を高めることを目的として、社外のリソースを使って育成を
進めております。同様の人材育成プログラムは、各子会社・拠点においても、個社のニーズに基づき策定・運営
されており、その状況については、グローバルHR会議等の場で共有されております。また、当社グループでは、
2020年より隔年でグローバルの従業員エンゲージメントサーベイを実施しており、人材育成の指標の一つとして
タレントマネジメント指数を管理していきます。
23/152
EDINET提出書類
株式会社ニフコ(E02386)
有価証券報告書
2025年度研修体系図
「タレントマネジメント」※ 指数(好意的な回答率)
指標
2024年度実績
取組・目標
提出会社
52%
2028年度目標58%に向けて活動をしております
グローバル※※
73%
今後グローバルでの指標管理に取組んでまいります
※「タレントマネジメント」は、WTWタワーズワトソン社のフレームワークで、当社の研修機会、優秀な人材の登
用や能力開発、成長の機会に関する複数の質問に対する回答で測られます。
※※「グローバル」とは「当社グループ」を指しております。
c
人材の多様性の確保に向けた取組
マテリアリティの副次課題として、多様な属性や価値観を持つ人材を確保し、あらゆる属性の社員が働きやす
い職場環境を構築するため、当社では、DE&Iの専門部隊が、「誰もが働きやすい心理的安全性の高い職場作り」
を目的とした、各種研修を実施しているほか、毎年様々な施策を企画・実行しています。2025年度には嘱託社
員、契約社員を含む全ての従業員を対象にアンコンシャス・バイアス研修(e-learning)を実施したほか、自動車
業界で管理職として活躍している女性技術者を招いての講演会や長期休職をテーマに座談会を開催しました。ま
た、LGBTQ+への理解促進として、2026年3月に東京支社でALLY交流会を初開催し、当事者を支援するALLY同士の
意見交換や学び合いの場を提供しました。多様な人材を適所配置し活躍の機会を推進することで多様な視点や経
験を持つ人材による新しいアイデアの創出や創造的なコラボレーションにつながります。
当社人材の多様性を示す指標としては、女性・外国籍・中途入社の在籍比率を管理しております。2026年3月
末時点では、下表のとおりです。
24/152
EDINET提出書類
株式会社ニフコ(E02386)
有価証券報告書
提出会社
多様性の状況
2026/3/31時点
取締役
女性
外国籍
中途入社
グローバル
人数
割合
人数
割合
―
―
2
25.0%
管理職
14
5.7%
247
22.0%
正社員
223
16.5%
3,806
42.6%
取締役
―
―
0
0.0%
管理職
12
4.9%
正社員
61
4.5%
取締役(社内)
―
―
管理職
89
36.2%
正社員
536
39.7%
―
―
―
―
上表の状況を踏まえ、当社における多様性の確保・推進が、当社の持続的成長においては最重要と認識してお
り、「管理職に占める女性労働者の割合」「男性労働者の育児休業取得率」「労働者の男女の賃金の差異」の3
点を、当社の継続的に監視すべき指標と定めております。これらの指標における2025年度実績と将来目標、今後
の取組は、下表のとおりとなっております。なお、「第4 提出会社の状況 5.従業員の状況等 (2)従業
員の状況 ④管理的地位にある労働者に占める女性労働者の割合、男性労働者の育児休業取得率及び労働者の男
女の賃金の額の差異 (b)国内グループ会社」において国内連結子会社における多様性に関する指標及び定義
を記載しています。
多様性の指標
提出会社
2025年度
実績
取組・目標
管理的地位にある
労働者に占める
女性労働者の割合
5.7%(14名)
※専門職も含む
各組織における高ポテンシャル人材を特定し、育成計画の策定と
フォローアップを定期的に実施しております。2025年度は全従業員
を対象とした「アンコンシャス・バイアス研修」を実施し誰もが活
躍できる環境の醸成に努めました。2030年度10%達成を目標とし、
これらの取組を今後も継続して行います。
男性労働者の
育児休業取得率
70.6%
定期的に全社員を対象とした座談会を実施し2030年度90%達成を目
標とし、引き続き職場の労働環境を整備してまいります。
58.9%
各Gradeの報酬テーブルに、男女による差はありません。詳細は、
「第4 提出会社の状況 5.従業員の状況等 (2)従業員の状
況 ④管理職に占める女性労働者の割合、男性労働者の育児休業取
得率及び労働者の男女の賃金の差異 (b)国内グループ会社」を
ご参照ください。引き続き、女性管理職比率の改善、全社残業削減
など、差異縮小につながる活動に注力いたします。
労働者の男女の
賃金の額の差異
d
社内環境整備に向けた取組
多様な人材が持てる能力を最大限に発揮できる職場環境作りを目指し、当社では、人事制度や働き方の見直し
を随時行っております。人事制度については、2024年度に「ニフコ流JOB型人事制度」を導入(当社)、各管理
職ポジションの役割を明確にし、年齢・経験に拘わらず、役割をこなせる人材を登用し役割に応じて処遇する制
度に改訂すると同時に、市場競争力を強化し優秀な人材の流出を抑制し外部からの登用を推進するため、報酬制
度・水準の見直しを行いました。グローバルにおいても、各国・地域において、十分な市場競争力を維持するた
めの報酬改訂を定期的に実施しております。働き方については、継続して総労働時間の削減に向けた取組を行
い、自由度を高めたフレックスタイム制度や会社か自宅のいずれかで働く場所を自分で選べるテレワーク制度を
ライン作業者等を除く社員に導入するなど、柔軟な働き方と休暇制度の拡充をグローバルに進め、高いエンゲー
ジメントを保ちながら、事業の持続的な発展に貢献できる職場作りを推進しております。これらの社内環境整備
については、各子会社・拠点も個社のニーズに基づき取組んでおり、グローバルHR会議等で相互把握・共有して
おります。
社内環境整備の指標
提出会社
総労働時間の削減に向けた取組
2025年度
実績
年間所定労働時間:1,898.75時間 (目標1,900時間以内)
残業時間:平均 25.78時間/月 (目標30時間以内支援社員除く)
※グローバル共通の指標は、有効性のあるものが特定できていないため、設定しておりません。
e
従業員エンゲージメント向上への取組
25/152
EDINET提出書類
株式会社ニフコ(E02386)
有価証券報告書
従業員のエンゲージメントは、人材の定着率を高め、当社の生産性・付加価値を最大化する中で重要な要素と
考えます。当社グループでは、2020年より隔年でグローバルの従業員エンゲージメントサーベイを実施し、各組
織における強み・弱みを定量的・客観的に把握した上で、従業員のエンゲージメントを高めるための施策を各組
織で策定・実行し、管理しています。
指標
「持続可能なエンゲージメント」※指数(好意的な回答率)
2022年度実績
2024年度実績
取組・目標
提出会社
65%
68%
各組織で、エンゲージメント向上に向けた施策を策
定・実行しています。2028年度目標72%に向けて、
引き続き活動を継続します。
グローバル
81%
84%
国内外の各子会社で、エンゲージメント向上に向け
た施策を策定・実行しています。2028年度目標87%
に向けて、引き続き活動を継続します。
※「持続可能なエンゲージメント」は、WTWタワーズワトソン社のフレームワークで、当社の経営目標に対する支
持、従業員としての誇り、仕事に対する意欲・やりがい・活力に関する複数の質問に対する回答で測られます。
(4)その他の重要課題に関する取組
マテリアリティにおける「その他の重要課題」について、以降に戦略・目標・取組状況を記載します。
[ガバナンスの強化]
・取締役会実効性の向上
当社は、取締役会実効性の向上のため、年に1回、取締役会の実効性に関する評価を実施しております。2025年
度は、2026年2月までの取締役会実効性に関するアンケートを実施し、分析・評価を行いました。その結果、前年
に続き、取締役会の構成・スキルセット、取締役会への情報共有や研修の機会提供については、高い評価を得まし
た。また、内部統制・リスク管理体制の整備・監督や、社外取締役と監査機関との連携、株主・投資家との関係構
築については、まだ十分とは言えないものの、前年より改善していると評価されました。取締役会の議題について
は、経営戦略及び経営計画に関する議論の機会が増加し、その質も向上しているとの評価がある一方で、環境・人
的資本などのサステナビリティ課題については、さらに議論を深化させることが必要と指摘されました。また、取
締役会資料の内容と提供のタイミングについては、引き続き改善を求める指摘がありました。これらの評価結果を
踏まえ、今後は取締役会の議題の見直し及び事務局機能の強化を通じて、取締役会の実効性向上に取り組んでいき
ます。
[リスクマネジメントの強化]
・情報セキュリティ対策の維持・向上
「リスクマネジメント強化」を実現するための戦略のひとつは「情報セキュリティ対策の維持・向上」への取組
です。サイバー攻撃やマルウェアの感染による情報セキュリティシステムの機能不全等が発生した場合、業務停止
等、顧客への供給停止、取引先からの信頼喪失、損害賠償の発生につながります。当社及び国内子会社では、情報
セキュリティリスクの低減を中長期目標として掲げ、情報セキュリティ訓練(インシデント訓練・標的型メール攻
撃訓練)年1回以上、情報セキュリティ教育年1回以上の実施を指標・目標として設定しております。発生時の行
動計画の実行性確認を目的として、共通セキュリティシステムの再構築や、標的型メール攻撃訓練、セキュリティ
インシデント訓練を実施しました。また、従業員に対して情報セキュリティ教育を実施し、社員へのセキュリティ
意識の向上に取り組んでいます。海外子会社についても、各社セキュリティシステムの構築と、従業員への情報セ
キュリティ教育を実施しております。情報セキュリティシステムの整備と訓練及び従業員に対する啓蒙活動を継続
することで、行動計画に即した迅速な対応と円滑な顧客応対を可能とします。今後もこれらの取組を通して、外部
からの攻撃や内部の脆弱性に対する強い防衛性と高い対応力を保持し、堅牢な情報セキュリティを確保してまいり
ます。
・コンプライアンスリスクの低減
コンプライアンス違反による不祥事を起因とした企業価値の損失、売上げの低下と対応コストの発生、社会的評
価の毀損といったリスクを防ぐため、当社グループはコンプライアンスリスク管理の強化を推進しており、重大コ
ンプライアンス違反発生ゼロを数値目標としております。
この目標の達成のため、2009年に制定したコンプライアンスマニュアルを、2025年度にも改訂を行い、コンプラ
イアンスに対する社員の意識の向上と、当社及び国内子会社のコンプライアンス研修に活用しています。また、コ
ンプライアンスマニュアルは複数の言語に翻訳された後に、海外子会社向けに展開されています。あわせて、内部
通報システムの実効性向上にも取組み、グループ全体でのコンプライアンス遵守体制の強化を図ってまいります。
[製品の安全性と品質の確保]
26/152
EDINET提出書類
株式会社ニフコ(E02386)
有価証券報告書
当社グループにおいて「製品の安全性と品質の確保」は重要な経営課題の一つであり、事業の持続的成長を支え
る基盤と位置づけています。不良品の発生は顧客の信用失墜・失注はもとより、ブランドイメージを低下させま
す。製品の禁止物質含有を見落とした場合は、製品の回収交換に留まらず、損害賠償などのリスクにつながりま
す。当社グループは品質リスクの低減を掲げ、2030年度における重要品質問題ゼロを数値目標としております。こ
れらのリスクに万全を期して対応する策として、専門性を有した人材の育成に加え、SOC管理システムを導入し、
開発プロセス及び変更管理での検証を徹底し製品の安全性を確保しております。これらに加え、主管組織において
より詳細な品質管理施策を実施しています。2024年度中国の拠点で導入を開始し、2025年度は、2026年稼働開始に
向け北米拠点でこのSOC管理システム導入を準備中です。今後順次、他の地域も展開を行います。近い将来に拡大
するリサイクル材の活用に対しては、これらの体制を活用し、開発プロセスから適切な検証を実施していきます。
また、有事に備え製品ごとのリコール保険の見直しを実施し、リスク対応体制の強化を図っています。
信頼性が高く、優れた製品を提供することは、「環境」「安全」「快適」の普遍的な商品戦略を目指す当社に
とって、顧客との長期的な関係構築及び競争優位性の確保に不可欠な要素です。今後も企業価値向上のために徹底
して製品の安全性と高い品質を確保してまいります。
[廃プラスチック量ゼロに向けた資源循環への取組推進]
①ガバナンス
廃プラスチック量ゼロに向けた資源循環への取組に関するガバナンスは、前記「①サステナビリティに関するガ
バナンス」に記載のとおりです。廃プラスチック削減・再生材活用に関するリスクはリスクマネジメント委員会
が、再生材を活用した製品開発等の機会はサステナビリティ委員会がそれぞれ管理し、取組状況を経営会議に報
告・提言しています。
②戦略
当社は、限りある資源を有効に活用し、廃棄物の発生を最小限に抑えることが、持続可能な社会の実現に不可欠
であると認識しています。この認識に基づき、当社はマテリアリティの一つとして「廃プラスチック量ゼロに向け
た資源循環への取組推進」を掲げ、欧州ELV指令(2035年)をはじめとする再生材使用義務に関する規制の強化、
原材料価格の変動リスクや廃棄物処理コストの上昇などのリスクに対応するとともに、再生材を活用した製品の市
場投入という事業機会を捉えるため、以下の取組を推進しています。
・製造・開発・設計段階での廃棄物最小化
製造及び品質工程の改善によって廃棄物の低減、廃棄物分別強化による有価物への転用を行っています。また、
成形機の洗浄工程で発生するパージダンゴの削減、成形工程における廃棄スプルーの削減など、製造段階での廃棄
物発生を抑制しています。開発・設計段階から製品ライフサイクル全体を通じた環境負荷低減に配慮した設計を推
進するとともに、顧客に対して環境配慮型製品の導入提案を積極的に行っています。
・サプライチェーン全体での資源循環強化
社内にとどまらず、取引先との連携を通じて廃棄物排出量の抑制、再資源化の推進、リサイクルの促進をサプラ
イチェーン全体で取り組んでいます。
・外部連携によるルール形成への参画
産官学連携(環境省・経済産業省)や自動車部品工業会との連携に加え、Sustainable Plastics Initiativeに
賛同し、業界全体でのサーキュラーエコノミー移行を主導しています。再生材使用に関する規則強化や顧客要請に
対し、適時適切な対応ができないことによる売上減少・調達コスト上昇リスクに対応するため非化石資源材料、リ
サイクルプラスチック材、天然資源(バイオマス)を利用した材料の活用推進と、再生材(含むバイオマスプラス
チック)を採用した製品の仕様を満たす製品形状と工法の開発に取り組んでいます。また、2024年度に公益財団法
人自動車リサイクル高度化財団(J-FAR)※の公募事業として採択された「XtoCarプロジェクト」において、製造
などを行う産業(動脈産業)と廃棄物のリサイクルや適正処理を行う産業(静脈産業)が連携し、非自動車由来の
廃プラスチックを自動車部品に再生する新しいリサイクルシステムの構築を目指して活動しています。将来的には
再生材を利用した自動車向け製品の量産化を目指し、2025年度には自動車に適用できる廃プラスチックの種類を1
種類の選定を完了しています。2026年度は、中型製品への適用及び、対応可能なプラスチック種類のさらなる拡大
を目標にしています。
③リスク及び機会の管理
廃プラスチック量削減・資源循環に関するリスク及び機会の管理は、前記「②リスク及び機会の管理」に記載の
とおりです。
④指標及び目標
27/152
EDINET提出書類
株式会社ニフコ(E02386)
有価証券報告書
廃プラスチック量ゼロに向けた資源循環への取組について、以下の指標及び目標を設定しています。
廃棄プラスチック量の削減については、事業特性に応じて以下のとおり目標を設定しています。合成樹脂事業の国
内単体及び国内グループ会社においては、製造及び品質ロスの低減、廃棄物分別強化による有価物への転用を通じ
て、2028年度までに2020年度比55%の削減を目標としています。また、連結子会社であるシモンズ株式会社(国
内・小山工場)においては、廃棄ウレタンの断熱材等の他社製品への転用を推進し、2030年度までに廃棄ウレタン
量を2025年度比50%削減することを目標としています。
再生材の品質・安全基準の確立については、2028年度中には再生材を使用した製品の市場投入を目指し、合成樹
脂事業の国内単体及び国内グループ会社を対象に、社内規程の策定及び再生材保証活動を推進していきます。2030
年度までに製品含有化学物質に関する法規違反ゼロを目標としています。
主材領域における再生材確保については、合成樹脂事業の国内単体及び国内グループ会社を対象に、必要樹脂量
の120%以上を常時確保することをリスク対応の観点から目標とするとともに、2030年のELV指令及び2035年のJAMA
CN/CE指針への対応を見据えた調達体制の整備を進めています。また、確保した再生材の利活用拡大を機会として
捉え、2028年度中の再生材を使用した製品の市場投入を目指しています。
廃棄プラスチック量の実績は以下のとおりです。有報発行時点では2025年度の集計が完了していないため、本有
報においては2024年度実績を使用しています。2025年度の実績数値については、2026年度の秋頃に当社ホームペー
ジ「サステナビリティ」にて公開予定です。
https://www.nifco.com/csr/environment/index.html
28/152
EDINET提出書類
株式会社ニフコ(E02386)
有価証券報告書
3【事業等のリスク】
有価証券報告書に記載した事業の状況、経理の状況等に関する事項のうち、経営者が連結会社の財政状態、経営成
績及びキャッシュ・フローの状況に重要な影響を与える可能性があると認識している主要なリスクは、以下のとおり
であります。
なお、文中の将来に関する事項は、当連結会計年度末現在において当社グループが判断したものであり、以下の記
載は当社グループのリスクを全て網羅するものではありません。
(1) リスク管理体制
当社グループは、事業の継続的・安定的発展を確保し、また、製品の品質と安全性の確保を最優先に、ステー
クホルダー、並びに社員に損害・損失を与える要因の除去・軽減に誠実に努めるようリスクマネジメントを実践
します。更に、社会全般において幅広く使用されている製品を供給する者としての責任を自覚し、製品を安定的
に供給することを社会的使命として、各種法令を遵守しています。
当社グループは、リスクマネジメント委員会を設置しています。同委員会は、当社グループのリスクマネジメ
ントを推進するため、総合的にリスク評価をしたうえで対応を主管する組織による課題・対応策を協議・承認
し、取締役会へ報告しています。
2025年度からは体制を見直し、各主管組織の取組状況等を経営会議に報告提言します。経営会議はリスク管理
の内容について、異議・意見がある場合は、リスクマネジメント委員会に指示を出し、同委員会にて再度対応策
を検討後、主管する各組織へ展開します。
(2) 主要なリスク
当社グループのリスクは、単独又は複数の主管する組織により、自然災害、市場環境などのリスク類型から、
リスクを放置した場合に発生する事象が与える当社グループへの損害・損失を想定し、(顧客への影響1〜4点
+社内グループへの影響1〜4点)×(発生頻度1〜4点)の数式から算出した影響度にて評価されています。
以下に挙げるリスクは、リスク評価が32点中12点以上の重要な影響を与える可能性があると認識している主要な
リスクです。
なお、当連結会計年度では、緊急対策が必要なリスクは発生しませんでした。
人材の流出リスク
リスクの内容
・雇用形態の多様化や社員の不満に対する対応の遅れなどの人事管理・労務管理
の失敗による企業価値の低下
・人材の流動が激化し、高い専門性や知識を有する人材の不足や流出による、開
発の遅延や品質の悪化及び顧客満足の低下
・若年層の“3K”離れや技能習得者の高齢化により、新規ビジネスへの対応の
難化
・従業員一人当たりの業務の増加、それに伴う離職率の増加、外部委託コストや
品質コストの増加、収益の圧迫
対応策及び取組
・人材育成・多様性・従業員エンゲージメントを柱とする人材戦略から行動計画
を策定し実行しています。詳細は、「人的資本に関するサステナビリティに関
する取組」をご確認ください。詳細は、「第2 事業の状況 2.サステナビ
リティに関する考え方及び取組 (3)人的資本に関する取組」に記載のとおり
です。
IT最新技術(AI、IoT)への対応遅れによるリスク
リスクの内容
・IT最新技術への対応の遅れによる販売力や競争力の低下
・有効なシステム開発や、最新技術のツールを活用するスキル不足
・業務改善、対応能力の低下による高コスト体質化
対応策及び取組
・国内のセキュリティシステムについて再構築を行いました。
・デジタル人材の育成を進め26名の人材育成を行いました。
・データレイクの構築を行い、外部ベンダーへの委託を自社対応に切り替えまし
た。
29/152
EDINET提出書類
株式会社ニフコ(E02386)
有価証券報告書
サイバー攻撃を含む情報セキュリティシステム(ソフト・ハード両方)の機能不全
リスクの内容
・外部からのサイバー攻撃を含む、システム停止による、業務停止、供給停止な
どにより、ステークホルダーからの信頼損失
対応策及び取組
・国内においてはセキュリティシステムの再構築を行いました。
・2023年度より基幹システムのバックアップシステムをクラウド上に構築しまし
たが、2024年12月に周辺システムのクラウド化を進めシステムの継続性を高め
ました。
・構築したセキュリティシステムについては、毎年1回インシデント訓練を通じ
て実効性を確認しています。
・従業員に対して情報セキュリティ教育と標的型メール攻撃訓練を毎年1回実施
しています。
原材料などの調達に関わるリスク
リスクの内容
・世界的な気候変動や災害、様々な社会情勢、材料生産に係わる設備の故障や事
故、品質上の問題などを起因とした材料調達と生産活動の遅延や不能による顧
客の生産活動の停止
・世界的な気候変動や不安定な政治情勢を起因とした、原材料高騰による利益の
低下
・原材料や購入部品への環境負荷物質含有などを要因とした法令違反
・原材料や購入部品については、購入先を分散しています。また、複数の代替材
対応策及び取組
候補の選定後に使用実績を作り、製品評価分析を行って、非常時の生産プロセ
スを構築しました。
・顧客へ見積提出時の原料価格境界値の設定や価格交渉を継続的に行っていま
す。
・ITシステムによる環境負荷物質管理を日本で構築しており、海外主要拠点へ水
平展開を実施しています。
新領域製品の受注拡大に伴うリスク
リスクの内容
・製品領域拡大に伴い、新技術・新工法・新材料を採用し、品質コストが増加す
ることによる利益の低下
・新領域製品の量産準備の不足、また、新領域の危険予知不足により、品質不具
合製品を流出させることによる、顧客満足度の低下及び信用失墜
対応策及び取組
・量産開始時点からの継続的な品質コストの監視と改善活動を実践しています。
・国際標準であるIATF16949に準拠した製品実現活動を実践する中で、節目管理
活動により、準備不足の解消、製品品質の向上を行っています。
競合先の増加によるリスク
リスクの内容
・異業種の自動車市場の参入による競合先の増加に伴う、受注価格の低下や失注
案件の増加
・顧客・業界動向の変化が加速する市場環境下の、従来のビジネススタイルへの
固執を要因とした、他社との差別化の失敗による受注価格の低下や失注案件の
増加
対応策及び取組
・技術戦略の方向性を明確にし、専門性を有した人材を確保するとともに、方向
性に合致した組織体制作りを行いました。
・価格競争力の強化推進として、集約生産を実施し、より効率の良い生産体制に
しました。
30/152
EDINET提出書類
株式会社ニフコ(E02386)
有価証券報告書
為替変動リスク
リスクの内容
・取引のグローバル化や顧客からの現地製品供給要請による当社グループの海外
売上比率の年々上昇、そのため海外子会社の現地通貨建てによる財務諸表の値
を本邦通貨に換算する際の為替レート変動が与える連結財務状況への影響
・原材料価格、電力費用や燃料費などが為替レートの影響を受けた際の、製造原
価の上昇
対応策及び取組
・海外子会社の輸出は僅かですが、特定の地域や国に偏在しないような拠点の展
開により、影響を最小限としています。
・原材料に関しては、製造原価の上昇を抑えるために代替材料への置き換え、顧
客との価格転嫁の交渉を行っています。
カントリーリスク
リスクの内容
対応策及び取組
・当社グループの海外拠点の所在国、地域において、政策・法律・税制の急激な
変更、予測できない政治、経済の不安定化、テロ・戦争・紛争の勃発、伝染病
の蔓延などの社会的混乱を要因とした、事業遂行の難化
・事業遂行の難化による、当社グループの業績及び財務状況の悪化とサプライ
ヤーチェーン分断の発生
・業績や財務への影響を最小限とするために、特定の地域や国に偏在しないよう
な拠点の展開をしています。
・グローバルで生産品の情報を管理し、代替品の生産・納入を行えるよう管理体
制の推進を行っています。
これらのリスクの他に、地震などの自然災害の発生が予想されるため、事業継続計画(BCP)として、発生時の被
害を最小化する設備の耐震化を進めており、全社員の安否を確認するシステムを導入するとともに、訓練を実施して
います。また、サプライチェーンを分断しないよう、代替原材料の選定や代替品生産などを含めた活動に取り組んで
います。
31/152
EDINET提出書類
株式会社ニフコ(E02386)
有価証券報告書
4【経営者による財政状態、経営成績及びキャッシュ・フローの状況の分析】
(1)経営成績等の状況の概要
当連結会計年度における当社グループ(当社、連結子会社及び持分法適用会社)の財政状態、経営成績及びキャッ
シュ・フロー(以下「経営成績等」という。)の状況の概要は次のとおりであります。
①財政状態及び経営成績の状況
当連結会計年度(以下、当期という)における我が国経済は、企業による積極的な設備投資を背景にリース関連を
中心とした改善が進んだほか、個人消費の回復を受けて消費関連分野を中心に底堅く推移し景気は緩やかな持ち直し
基調にあります。海外に目を転じますと、中国経済では、米国向け輸出の減少をアジア、EU、アフリカ向け輸出の拡
大が補完し外需は増勢を維持しているものの、内需面では個人消費及び投資の鈍化が続き、景気は足踏み状態となっ
ています。欧州経済については、防衛費を中心とする政府支出の拡大や堅調な個人消費を背景に、ユーロ圏全体で景
況の回復が見られます。一方、英国では雇用・所得環境の弱さが家計を圧迫し、内外需ともに低調な状況が継続して
おります。米国経済においては、非製造業が堅調に推移する一方、製造業の低迷が長期化しており景況感の二極化が
続いておりますが、AI関連需要が設備投資を下支えし景気の底堅さは維持されております。このように世界経済は持
ち直しの動きがみられる中、中東での軍事的緊張の高まりにより各国がエネルギー供給リスクに直面するなど、依然
として先行き不透明な状況にあります。
このような状況の中、当期の連結業績の売上高は、前期比0.1%減の3,526億5千万円となりました。営業利益は前
期比2.3%減の480億7千8百万円となりました。経常利益は前期比1.7%減の512億7千5百万円となり、親会社株主
に帰属する当期純利益は、前期比23.9%減の340億7千9百万円となりました。
資産合計は、前期比137億7千4百万円増加し、3,935億9千万円となりました。負債合計は、前期比70億7千2百
万円減少し、940億1千8百万円となりました。純資産合計については、前期比208億4千6百万円増加して、2,995
億7千1百万円となりました。その結果、自己資本比率は75.3%、1株当たり純資産は3,183円40銭となりました。
セグメントの経営成績を示すと次のとおりです。
各セグメントの売上高は、外部顧客に対するものであります。
合成樹脂成形品事業
合成樹脂成形品事業の売上高は前期比0.1%減の3,156億9千1百万円となりました。セグメント利益は、前期比
2.8%減の476億6千3百万円となりました。
ベッド及び家具事業
ベッド及び家具事業は、売上高は前期比0.4%減の369億5千8百万円となりました。セグメント利益につきまして
は、前期比0.1%増の59億7千万円となりました。
②キャッシュ・フローの状況
(営業活動によるキャッシュ・フロー)
営業活動によるキャッシュ・フローは、471億6千3百万円の資金の増加となり、前期が542億1千7百万円の資金
の増加であったことと比べて、70億5千4百万円の減少となりました。これは主に売上債権の増減額が減少したこと
や、仕入債務の増減額が減少したこと等によるものであります。
(投資活動によるキャッシュ・フロー)
投資活動によるキャッシュ・フローは、181億3千万円の資金の減少となり、前期が238億9千1百万円の資金の減
少であったことと比べて、57億6千万円の増加となりました。これは主に前年同期は連結範囲の変更を伴う子会社株
式の売却による支出があったことによるものであります。
(財務活動によるキャッシュ・フロー)
財務活動によるキャッシュ・フローは、313億5千5百万円の資金の減少となり、前期が351億5千4百万円の資金
の減少であったことと比べて、37億9千8百万円の増加となりました。これは主に長期借入金の返済が減少したこと
や、自己株式の取得が減少したこと等によるものであります。
以上の結果、現金及び現金同等物の当期末残高は、前期末と比較して5億6千2百万円増加し、1,416億5千9百
万円となりました。
32/152
EDINET提出書類
株式会社ニフコ(E02386)
有価証券報告書
③生産、受注及び販売の実績
a 生産実績
当連結会計年度の生産実績をセグメントごとに示すと次のとおりであります。
当連結会計年度
2025年4月1日
2026年3月31日)
前年同期比(%)
合成樹脂成形品事業(百万円)
211,237
99.6
ベッド及び家具事業(百万円)
13,561
99.4
224,799
99.6
セグメントの名称
(自
至
合計(百万円)
(注)セグメント間の取引については相殺消去しております。
b 商品仕入実績
当連結会計年度の商品仕入実績をセグメントごとに示すと次のとおりであります。
当連結会計年度
2025年4月1日
2026年3月31日)
前年同期比(%)
合成樹脂成形品事業(百万円)
20,702
123.6
ベッド及び家具事業(百万円)
2,905
91.0
23,608
118.4
セグメントの名称
(自
至
合計(百万円)
(注)セグメント間の取引については相殺消去しております。
c 受注実績
当社及び連結子会社は受注より出荷までの期間が極めて短いため、原則として一部の確定受注や過去の生産実績等
を参考とした見込生産によっております。
d 販売実績
当連結会計年度の販売実績をセグメントごとに示すと次のとおりであります。
当連結会計年度
2025年4月1日
2026年3月31日)
前年同期比(%)
合成樹脂成形品事業(百万円)
315,691
99.9
ベッド及び家具事業(百万円)
36,958
99.6
352,650
99.9
セグメントの名称
(自
至
合計(百万円)
(注)セグメント間の取引については相殺消去しております。
33/152
EDINET提出書類
株式会社ニフコ(E02386)
有価証券報告書
(2)経営者の視点による経営成績等の状況に関する分析・検討内容
経営者の視点による当社グループの経営成績等の状況に関する認識及び分析・検討内容は次のとおりであります。
なお、文中の将来に関する事項は、当連結会計年度末現在において判断したものであります。
①重要な会計上の見積り及び当該見積りに用いた仮定
当社の連結財務諸表は、わが国において一般に公正妥当と認められている会計基準に基づき作成されておりま
す。連結財務諸表の作成に当たって、決算日における資産、負債、偶発資産及び偶発債務並びに会計期間における
収益及び費用に影響を与えるような見積りや仮定を必要とします。結果として、見積り特有の不確実性があるた
め、これらの見積りと実績が異なる場合があります。当社は、重要な会計方針の適用における見積りや仮定は連結
財務諸表に重要な影響を与えると考えております。
a
棚卸資産
当社グループは、棚卸資産の推定される将来需要及び市場状況等に基づく収益性の悪化について、評価減を計
上しております。実際の将来需要又は市場状況等が見積りより悪化した場合、追加の評価減が必要となる可能性
があります。
b
投資の減損
当社グループは、長期的な取引関係の開拓・維持等のため特定の顧客の株式及び余資の運用としての株式等を
所有しております。これら株式等には価格変動性が高い市場価格のあるものと、市場価格等の算定が困難である
非公開会社が含まれております。当社グループは、原則として市場価格のあるものについては投資原価の下落率
が50%以上のもの、また市場価格のないものについては、それら会社の財政状態が悪化し純資産の下落率が50%
以上のものについて、それぞれ減損処理を行っております。また30%〜50%程度下落したものについては、金額
の重要性、回復可能性等を考慮し、必要と認められた額について減損処理を行っております。将来の市場悪化又
は投資先の業績不振により、現在の簿価に反映されていない損失又は簿価の回収不能が発生した場合、評価損の
計上が必要となる可能性があります。
c
退職給付費用
従業員退職給付費用及び債務は、数理計算上で設定される前提条件に基づいて算出されております。これらの
前提条件には、割引率、将来の給与水準、退職率、死亡率及び年金資産の収益率などが含まれます。親会社及び
一部の国内子会社の年金制度において、割引率は日本の国債の市場利回りをもとに退職給付の支払見込期間及び
支払見込期間ごとの金額を反映した単一の加重平均割引率を使用して算出しております。期待運用収益率は、年
金資産が投資されている資産の種類ごとの長期期待運用収益率の加重平均に基づいて計算されます。実際の結果
が前提条件と異なる場合、又は変更された場合、その影響額は累積され、将来にわたって規則的に認識されるた
め、一般的には将来期間において認識される費用及び債務に影響を及ぼします。近年の割引率の低下及び年金資
産の運用率の低下は、当社グループの年金費用に対して悪影響を及ぼします。未認識の数理計算上の差異及び制
度変更等による過去勤務費用にかかる償却は、年金費用の一部を構成しておりますが、前提条件の変化による影
響や実際の結果との違いの影響を規則的に費用認識したものであります。
d
有形固定資産の減損
当社グループは、自社利用の事業用資産については、事業所単位もしくは連結子会社単位で、賃貸用不動産、
遊休資産及び売却予定資産については、個別物件ごとにグルーピングを行っております。その上で、グルーピン
グごとに減損の兆候の有無を判定し、減損の兆候が識別された場合には、将来キャッシュ・フローを利用して減
損損失の計上の要否を検討しております。対象資産又は資産グループの業績が当初計画を下回り、回収可能価額
が減少し帳簿価額を下回る状況となった場合には、減損損失が発生し当社グループの業績に重要な影響を与える
可能性があります。
34/152
EDINET提出書類
株式会社ニフコ(E02386)
有価証券報告書
②当連結会計年度の経営成績等の状況に関する認識及び分析・検討内容
(1)当連結会計年度の経営成績等
当社グループの主要事業分野であります自動車関連市場につきましては、日本市場では、当期において対前年同
期比で、生産台数はやや下回る状況となりました。海外におきましては、対前年同期比で、欧州市場、韓国市場及
び北米市場では生産台数が下回った一方で、中国市場及びインド市場では上回る結果となっております。
このような事業環境のもと、当期の連結業績の売上高は、前期比0.1%減の3,526億5千万円となりました。利益
面では、管理可能経費の削減をはじめとした各種施策に積極的に取り組んだものの、物価及び人件費の上昇などの
影響を受け、営業利益は前期比2.3%減の480億7千8百万円となりました。また、経常利益につきましても前期比
1.7%減の512億7千5百万円となりました。特別損益につきましては、減損損失などを特別損失として11億1千5
百万円計上した一方、固定資産売却益を特別利益として11億9千6百万円計上いたしました。これらの結果、親会
社株主に帰属する当期純利益は、前期比23.9%減の340億7千9百万円となりました。
資産合計は、前期比137億7千4百万円増加し、3,935億9千万円となりました。主な増加要因としては、建物及
び構築物が73億3千6百万円、機械装置及び運搬具が26億4千9百万円、現金及び預金が23億8千9百万円それぞ
れ増加したことなどによるものであります。
負債合計は、前期比70億7千2百万円減少し、940億1千8百万円となりました。主な減少要因としては、未払
法人税等が31億2千1百万円増加したものの、支払手形及び買掛金が43億5千7百万円、1年内償還予定の社債が
100億円それぞれ減少したことなどによるものであります。
純資産合計は、前期比208億4千6百万円増加して、2,995億7千1百万円となりました。自己株式が93億円増加
したものの、利益剰余金が259億9千3百万円増加したこと、及び円安により為替換算調整勘定が39億8千8百万
円増加したことなどによるものであります。
以上の結果、自己資本比率は前期比2.9ポイント増加し、75.3%、1株当たり純資産は3,183円40銭となりまし
た。
(2)経営成績に重要な影響を与える要因
a
経済状況
当社グループでは、自動車メーカー、特に主要日系自動車メーカーに対する売上比率が高い水準にあります
が、これら日系自動車メーカー向けの製品の需要は、世界経済の動向、特に主要市場である日本をはじめ米国、
中国などの経済状況に影響を受け、当社グループの経営成績に重要な影響を及ぼす場合があります。
当連結会計年度において、日本は米国関税政策の影響は軽微でしたが、中国のレアアース輸出規制、天災、中
東情勢等の影響による減産および稼働停止が相次ぎ、挽回生産はあったものの生産台数は前年比同等となりまし
た。
b
原油及びナフサ価格の高騰
当社グループは、原油価格及びナフサ等の石油製品の価格が高騰し、その期間が長期に及ぶ場合には原材料価
格の上昇により、経営成績に影響が生じる可能性があります。
当連結会計年度においては、原材料価格の市況変動適用拡大の交渉を推進し、高騰分の価格転嫁を実現しまし
た。
c
取引先からの値引き要請
当社グループは、取引先からの価格値引き要請に対して生産コストの削減等の努力をしておりますが、予想以
上に値引き要請が強い場合、経営成績に重要な影響を受ける場合があります。
当連結会計年度においては、値引き要請に応じると同時に、金型保管費、エネルギー費や労務費高騰分の費用
請求を実施し、様々な方法で価格転嫁への取り組みを推進しました。
(3)資本の財源及び資金の流動性
当社グループの運転資金は、主に製品製造過程に供される原材料や部材の購入のほか、製造費用や販売費及び一般
管理費等の営業費用によるものであります。営業費用の主なものは、人件費、物流費、研究開発費であります。これ
らの必要資金は、利益の計上から生み出した内部資金により賄っております。
設備投資資金については、その投資に際し、投資採算及びキャッシュ・フローを重視し実施しております。これら
設備投資の資金は、原則として減価償却費及び利益の計上から生み出された内部資金の一部を充当することとしてお
りますが、国内、海外での積極的な設備投資については、状況に応じて社債発行及び外部借入で調達することとして
おります。
当社グループは、健全な財政状態、営業活動によりキャッシュ・フローを生み出す能力等により、運転資金及び通
常の設備投資資金を調達し、将来の成長のための投資及びM&A資金などについては、長期で低利な条件での調達を実
施しております。
これにより当社グループの調達手段の多様化及び低コストでの長期安定資金の調達が実現し、更に資本コストの引
き下げ効果及び、設備投資効果と相俟って、今後も財務体質は引き続き安定して推移するものと考えております。
35/152
EDINET提出書類
株式会社ニフコ(E02386)
有価証券報告書
(4)セグメントごとの経営成績等
a 合成樹脂成形品事業
〔国内自動車業界向け〕
国内の自動車生産につきましては、中国のレアアース輸出規制、天災、新型車の立上げ延期、中東情勢等による
減産および稼働停止が相次ぎ、当社売上もその影響を受け減収となりました。しかし、新車立上げに伴う金型売上
や電力料補填、材料費・労務費の価格転嫁等の貢献により、売上の通期合計は当初計画を上回る結果となりまし
た。
〔海外自動車業界向け〕
海外においては、韓国自動車メーカー向け事業は引き続き好調を維持しました。日系自動車メーカー向け事業
も、米国での追加関税の影響はあったものの、売上水準を維持しつつ、着実な増益を達成しました。そのほか、ア
セアンではインド、インドネシアを中心に堅調さを維持し、また効率化のためタイでの工場集約も実施しました。
一方で、中国においては、引き続き日系自動車メーカーの販売不振により苦戦を強いられ、前年比で減収減益の結
果となりましたが、最適化を実行し対計画比では増収増益を確保しました。欧州においても、英国での新車種販売
の後ろ倒しによる販売減もあり減収となりましたが、最適化を行い増益となりました。今後も北米、インドでの日
系および韓国自動車メーカー事業への設備投資を増強し、加えて1台当たりの搭載額の増加を行うことで更なる収
益力の向上を目指してまいります。
〔その他業界向け〕
住生活分野においては、当期住宅着工戸数が過去61年間で最低水準となり、当社グループが供給する住宅関連部
品の需要も大きく減少した結果、売上高は前年同期を下回る結果となりました。一方、スポーツ・アウトドア分野
におきましては、中国スポーツブランドへの当社製品の採用が拡大したほか、採算性の高い製品構成へのシフトが
進んだことから、利益面におきましても改善が見られ、当セグメントは増収増益となりました。
以上の結果、合成樹脂成形品事業は、売上高は前期比0.1%減の3,156億9千1百万円となりました。セグメント
利益につきましては、前期比2.8%減の476億6千3百万円となりました。
b ベッド及び家具事業
ベッド及び家具事業は、国内においてはホテル向けおよび輸出向けの売上が伸びたものの、販売店向け売上が苦
戦し、また 4月に横浜ギャラリーを開設したことによる家賃増加等の影響もあり、減収減益となりました。一
方、海外においては香港にて昨年度の廃棄分有料化対応によるホテル特需の反動が大きくホテル向け売上が大幅に
減少し、シンガポールにおいても卸売上が低調となりましたが、中国において2024年の8月に中央政府が打ち出し
た消費促進策が2025年9月まで継続されたことにより、卸・小売に加えてホテル向けも好調に推移し、昨年度設立
したタイ工場も操業安定化が進んだ結果、増収増益となりました。この結果、ベッド及び家具事業売上高は前期比
0.4%減の369億5千8百万円となりました。セグメント利益につきましては、前期比0.1%増の59億7千万円とな
りました。
36/152
EDINET提出書類
株式会社ニフコ(E02386)
有価証券報告書
(5)経営戦略等、経営上の目標の達成状況を判断するための客観的な指標等
当社は、2021年度より、ローリング型の3ヶ年中期経営計画を採用してまいりましたが、2026年度よりその運営方
針を見直しました。具体的には、「第一部企業の情報第2事業の状況 1経営方針、経営環境及び対処すべき課題
等」に記載しておりますとおり、2035年の長期ビジョンを起点としたバックキャスト型の経営計画体系へ移行し、長
期ビジョンの実現に向けて、3回の中期経営計画(フェーズ①〜③)を段階的に策定する方針としています。
このうち、フェーズ①を次期中期経営計画として位置づけ、3年後の到達目標を予め固定したうえで、当該目標に
対する具体的な施策を策定・実行する「固定型中期経営計画」へ移行しました。本移行により、中期経営計画の位置
づけをより明確化するとともに、目標達成に向けた経営陣の責任とコミットメントを一層強化することを意図してお
ります。
2028年度
2025年度実績
2035年度
目標
2025年度比
目標
売上高
3,526億円
4,000億円
+13.4%
5,000億円
営業利益
480億円
580億円
+20.5%
750億円
営業利益率
13.6%
14.5%
+0.9%pt
15%
当期純利益
340億円
400億円
+17.6%
500億円
ROE
11.9%
13.0%
+1.0%pt
16.0%
84%
87%
+3%pt
89%
1ドル=153円
1ドル=135円
従業員エンゲージメント
為替前提
1ドル=149.6円
(注)1.当期純利益は、親会社株主に帰属する当期純利益を指します。
(注)2.従業員エンゲージメントは、隔年で実施するグローバル従業員エンゲージメントサーベイにおける「持
続可能なエンゲージメント」の好意的回答率を指します。
37/152
EDINET提出書類
株式会社ニフコ(E02386)
有価証券報告書
5【重要な契約等】
(1)技術上の重要な契約
①
技術供与
提出会社
原始契約
年月日
契約締結先
1988年
11月23日
Union Nifco Co.,
Ltd.
タイ
プラスチック製バックル及びプラスチック
と金属からなるファスナーアッセンブリー
の製造技術
2027年12月31日まで
2004年
8月26日
台扣利富高塑膠制品
(東莞)有限公司
中国
固着機能等を有する樹脂製及び金属製の部
品・完成品、樹脂製部品と金属製部品との
複合品、バックル並びにこれらの部品及び
完成品等の金型等の製造技術
2027年6月30日まで
2005年
11月18日
北京利富高塑料制品
有限公司
中国
固着機能等を有する樹脂製及び金属製の部
品・完成品、樹脂製部品と金属製部品との
複合品、バックル並びにこれらの部品及び
完成品等の金型等の製造技術
2026年12月31日まで
2027年12月31日まで
国別
契約の内容
契約期間
2008年
11月1日
Nifco Vietnam Ltd.
ベトナム
工業用プラスチック製部品及びプラスチッ
ク以外の部品・材料を含む組立品、並びに
これらの部品及び完成品等の金型等の製造
技術
2012年
10月1日
Nifco South India
Manufacturing
Private Ltd.
インド
バックル・工業用プラスチック製部品及び
プラスチック以外の部品・材料を含む組立
品、並びにこれらの部品及び完成品等の金
型等の製造技術
2027年12月31日まで
2012年
10月1日
利富高(塩城)精密
樹脂制品有限公司
中国
固着機能等を有する樹脂製及び金属製の部
品・完成品、樹脂製部品と金属製部品との
複合品、バックル並びにこれらの部品及び
完成品等の金型等の製造技術
2026年12月31日まで
2013年
1月1日
Nifco Korea Poland
Sp.z o.o.
ポーラン
ド
工業用プラスチック製部品及びプラスチッ
ク以外の部品・材料を含む組立品の製造技
術
2027年12月31日まで
国別
契約の内容
契約期間
プラスチック製バックル及び工業用ファス
ナー(自動車、家電向)の中国での製造販
売事業に関する合弁契約
合弁会社(台扣利富高塑
膠制品(東莞)有限公
司)の存続期間中
契約の内容
契約期間
(2)経営上の重要な契約
①
提出会社
原始契約
年月日
2001年
8月23日
②
契約締結先
台湾扣具工業
股份有限公司
台湾
連結子会社
シモンズ株式会社
原始契約
年月日
契約締結先
1987年
6月30日
ドリームウェル・リ
ミテッド(旧シモン
ズ・ユーエスエー・
コーポレーション)
国別
米国
技術、許諾商標、特許、許諾製品の許諾地
域内での製造・販売等に関する権利及び許
諾製品の許諾地域内でのマーケティング・
輸入等に関する販売情報の使用に関する専
用実施権
38/152
会社の存続期間中
EDINET提出書類
株式会社ニフコ(E02386)
有価証券報告書
6【研究開発活動】
当連結会計年度における研究開発費の総額は、4,419百万円となっており、大部分は合成樹脂成形品事業で4,395百
万円であります。
当社グループとしては、各主力市場に向けた新製品開発の推進、並びに関連市場への積極的参入を図っておりま
す。専門的な商品群・自動車の領域毎の各商品開発部門と、開発のフロントローディング化、商品価値の向上及び高
品質化に不可欠なデジタル解析、評価分析及び要素開発を行う基盤技術部門の連携により、論理的な開発を行える体
制を整えています。その他の分野においては、商品のみならず、サービスを組み合わせた開発も進めております。
モノづくりにおいては、材料投入から顧客のライン投入までの工程全体の最適化を進める生産技術本部を強化し、
立上げ品質の向上や永久的な労働力不足対応に寄与する開発に注力しております。
ニフコの研究開発は、車両の価値を高める提案や人手不足・環境問題などの社会課題を解決する提案をグローバル
で連携して行っております。今後もお客様や社会からの期待に応えることでグローバルサプライヤーとして成長を続
けていき、持続可能な社会の実現に向けた開発を通じて、企業価値の向上を図ってまいります。
(1)合成樹脂成形品事業
①
②
自動車分野
:
その他
おります。「環境」においては、燃費向上に貢献する軽量化部品/空力関連部品及び先進環境
対応車に搭載するパワートレイン関連部品などを数多く開発・量産化しております。「安
全」においては、障害物検知センサー関連の量産品を深化/拡大させる開発、衝撃安全関連部
品の開発を進めております。「快適」においては、車室内の快適性を上げる遮音/吸音関連部
品の開発が進み、車両への搭載が増加しています。
100年に一度の大変革期において、当社グループは変化をチャンスと捉え、今まで培ってき
た強みを進化させ、普遍的な価値を持った商品を世界中のお客様に提供することに努めてお
ります。
: 2024年に横須賀市立の24校に試験導入された「熱中症対策システム」では熱中症で搬送さ
業界の普遍的要素である「環境」・「安全」・「快適」に関連する開発に資源を集中して
れる学生を大幅に減少させたことが評価され、全70校に正式導入されました。また熱中症対
策の義務化に対応した「企業版」では、物流や製造業を中心に2025年夏から試験販売を開始
しており、学校向け同様に高い評価をいただいております。
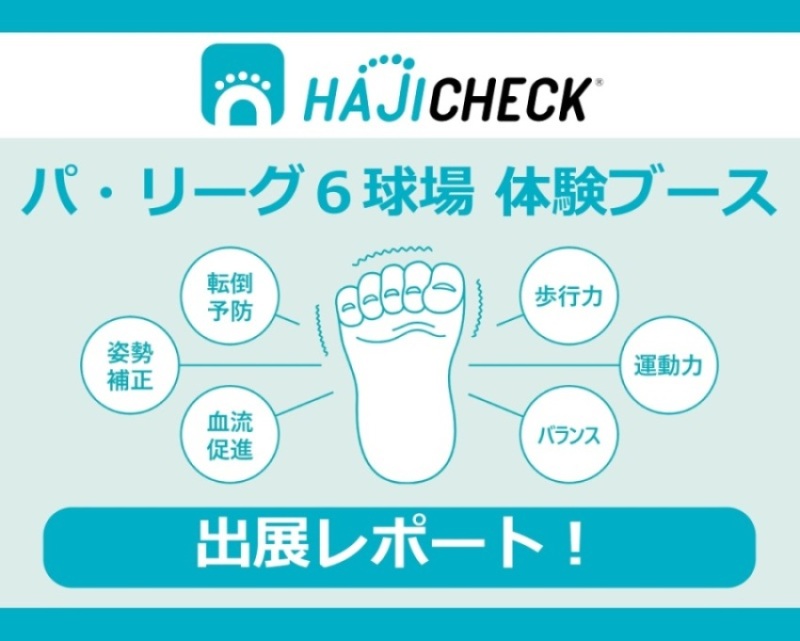
ウェルネス分野では、足把持力を可視化し転倒予防を促すHAJICHECK(JSA-S1027)を開発
し、保険業やケアサービスの企業様を中心に試験販売を開始しました。今後も「高齢化」
「労働力不足」「環境問題」という社会課題を解決する価値の創出と提供に努めてまいりま
す。
(2)ベッド及び家具事業
お客様への健康で快適な睡眠の提供のため、研究機関等専門家との科学的な分析と、感性や感覚を重視した商品
の開発を進めております。また、様々な機能、動きをコントロールできる多機能ベッドの開発、寝装品やリビング
空間への商品拡販、AIやデジタル技術を活用した豊かなライフ空間の提案にも力を入れております。
39/152
EDINET提出書類
株式会社ニフコ(E02386)
有価証券報告書
第3【設備の状況】
1【設備投資等の概要】
当社及び連結子会社では、当連結会計年度において、18,564百万円の設備投資(無形固定資産への投資含む)を行
いました。
合成樹脂成形品事業におきましては、日本では、国内自動車メーカーからの新規受注品に対応した金型設備や機械
装置等に日本地域合計で6,089百万円の投資を行いました。
北米では、韓国OEM向け事業を行う子会社の新工場の建設、新規の機械設備の導入などを中心に1,992百万円、北米
地域全体で4,125百万円の投資を行いました。
日本を除くアジア地域では、Nifco India Private Ltd.の新工場の建設、新規の機械設備の導入など全体で2,316
百万円等、アジア地域合計で7,123百万円の設備投資を行い、日系、非日系自動車メーカー、家電、OA、アパレル
メーカーの顧客に対しグローバルに高付加価値製品を生産、販売できる体制を築きました。
40/152
EDINET提出書類
株式会社ニフコ(E02386)
有価証券報告書
2【主要な設備の状況】
当社及び連結子会社における主要な設備は次のとおりであります。
(1) 提出会社
2026年3月31日現在
帳簿価額
事業所名
(所在地)
セグメ
ントの
名称
設備の内容
ニフコ技術開発
センター
(神奈川県
横須賀市)
合成樹
脂成形
品事業
本社
(神奈川県
横須賀市)
名古屋工場
(愛知県
豊田市)
従業
土地
ソフト
員数
金型
その他
合計
ウエア
(百万円)
(人)
(百万円)
(百万円) (百万円)
(百万円)
(面積㎡)
建物及
び構築
物
(百万
円)
機械装置及
び運搬具
(百万円)
研究開発施設
2,438
56
1,269
(13,721)
5
90
107
3,968
180
(25)
合成樹
脂成形
品事業
工業用プラス
チック・ファス
ナー技術開発設
備及び管理業務
施設
806
56
2,185
(29,413)
4
10
12
3,075
225
(45)
合成樹
脂成形
品事業
工業用プラス
チック・ファス
ナー生産設備
6,455
1,908
1,140
(33,297)
335
49
216
10,106
525
(164)
相模原工場
合成樹
(神奈川県
脂成形
相模原市中央区) 品事業
工業用プラス
チック・ファス
ナー生産設備
2,020
1,117
1,051
(15,890)
73
49
146
4,460
306
(98)
(注)1.帳簿価額のうち「その他」は工具、器具及び備品等であり、建設仮勘定を含んでおりません。
2.「従業員数」の欄に掲載されている(
)内は平均臨時雇用者数で外数となっております。
3.現在休止中の主要な設備はありません。
(2) 国内子会社
2026年3月31日現在
従業
員数
(人)
帳簿価額
事業所名
(所在地)
セグメント
の名称
設備の内容
シモンズ㈱
富士小山工場
(静岡県駿東
郡小山町)
ベッド及び
家具事業
家具製造設備
及び物流セン
ター
㈱ニフコ山形
山形県
山形市
合成樹脂成
形品事業
㈱ニフコ熊本
熊本県
菊池市他
合成樹脂成
形品事業
会社名
建物及び構
築物
(百万円)
機械装置及
び運搬具
(百万円)
土地
(百万円)
(面積㎡)
その他
(百万円)
合計
(百万円)
2,074
151
1,663
(56,442)
25
3,916
788
600
[767]
[-]
2,971
499
工業用プラス
チック・ファ
スナー生産設
備
工業用プラス
チック・ファ
スナー生産設
備
1,405
(56,384)
[1,405]
([56,384])
693
(86,176)
76
2,871
[57]
[2,230]
50
4,214
226
(-)
127
(240)
163
(184)
(注)1.帳簿価額のうち「その他」は工具、器具及び備品、金型、リース資産及びソフトウエアであり、建設仮勘定
を含んでおりません。
2.「従業員数」の欄に掲載されている(
)内は平均臨時雇用者数で外数となっております。
3.現在休止中の主要な設備はありません。
4.[ ]内の数字は提出会社から賃借中のものを内書きで表示しております。
41/152
EDINET提出書類
株式会社ニフコ(E02386)
有価証券報告書
(3) 在外子会社
2026年3月31日現在
帳簿価額
従業
員数
土地
建物及び 機械装置及
金型
その他
合計
(人)
構築物
び運搬具
(百万円)
(百万円) (百万円) (百万円)
(百万円) (百万円) (面積㎡)
会社名
事業所名
(所在地)
セグメン
トの名称
設備の内容
Nifco Korea
Inc.
Asan工場(本社)
他
(Asan-si,
Korea他)
合成樹脂
成形品事
業
工業用プラ
スチック・
ファスナー
生産設備及
び管理業務
施設
3,384
980
3,292
(123,178)
1,155
1,041
9,854
561
(187)
Nifco
America
Corporation
本社・Ohio工場
他
(Ohio, U.S.A.
他)
合成樹脂
成形品事
業
工業用プラ
スチック・
ファスナー
生産設備及
び管理業務
施設
3,848
1,926
404
(311,819)
42
1,337
7,559
1,113
(-)
Nifco
Korea Poland
sp. z o.o.
本社・工場他
(Zory,
Poland)
合成樹脂
成形品事
業
工業用プラ
スチック・
ファスナー
生産設備及
び管理業務
施設
3,486
2,503
412
(41,937)
119
39
6,561
543
(230)
(注)1.帳簿価額のうち「その他」は、工具、器具及び備品等であり、建設仮勘定を含んでおりません。
2.「従業員数」の欄に掲載されている(
)内は平均臨時雇用者数で外数となっております。
3.現在休止中の主要な設備はありません。
4.帳簿価額には、使用権資産の金額を含めております。
3【設備の新設、除却等の計画】
(1) 重要な設備の新設等
会社名
事業所名
所在地
セグメントの
名称
投資予定額
設備の内容
Nifco India
Haryana,
合成樹脂
新工場の
Private Ltd.
India
成形品事業
建設
資金調達
総額
既支払額
(百万円)
(百万円)
4,300
2,163
方法
着手及び完成年月
着手
完成
新株発行
及び
借入金
(2) 重要な設備の除却等
該当事項はありません。
42/152
2025.5
2027.7
EDINET提出書類
株式会社ニフコ(E02386)
有価証券報告書
第4【提出会社の状況】
1【株式等の状況】
(1)【株式の総数等】
①【株式の総数】
種類
発行可能株式総数(株)
普通株式
233,000,000
計
233,000,000
②【発行済株式】
種類
事業年度末現在発行数(株) 提出日現在発行数(株)
上場金融商品取引所名又は
(2026年3月31日)
(2026年6月22日)
登録認可金融商品取引業協会名
内容
普通株式
100,232,614
100,232,614
東京証券取引所
プライム市場
単元株式数
100株
計
100,232,614
100,232,614
−
−
(2)【新株予約権等の状況】
①【ストックオプション制度の内容】
該当事項はありません。
②【ライツプランの内容】
該当事項はありません。
③【その他の新株予約権等の状況】
(転換社債型新株予約権付社債の取得及び消却)
① 当社役員が保有している職務執行の対価として交付された新株予約権の状況(2026年3月31日現在)
該当事項はありません。
② 当事業年度中に職務執行の対価として使用人等に対し交付した新株予約権の状況
該当事項はありません。
③ その他の新株予約権等の状況
該当事項はありません。
(3)【行使価額修正条項付新株予約権付社債券等の行使状況等】
該当事項はありません。
43/152
EDINET提出書類
株式会社ニフコ(E02386)
有価証券報告書
(4)【発行済株式総数、資本金等の推移】
発行済株式
総数増減数
(株)
発行済株式
総数残高
(株)
資本金増減額
(百万円)
資本金残高
(百万円)
資本準備金
増減額
(百万円)
資本準備金
残高
(百万円)
2022年9月22日
(注)1
−
107,508,954
−
7,290
△11,500
151
2023年9月29日
(注)2
△7,251,901
100,257,053
−
7,290
−
151
2026年1月30日
(注)2
△24,439
100,232,614
−
7,290
−
151
年月日
(注)1
会社法第448条第1項の規定に基づき、資本準備金を減少し、その他資本剰余金へ振替たものであります。
(注)2
自己株式の消却による減少であります。
(5)【所有者別状況】
2026年3月31日現在
株式の状況(1単元の株式数100株)
区分
株主数(人)
所有株式数
(単元)
所有株式数の
割合(%)
政府及び
地方公共団体
金融機関
−
外国法人等
単元未満
株式の状況
(株)
金融商品
取引業者
その他の
法人
24
23
74
299
9
3,065
3,494
−
−
274,692
43,523
120,304
437,513
76
125,967
1,002,075
25,114
−
27.412
4.343
12.005
43.660
0.007
12.570
100.000
−
個人その他
個人以外
計
個人
(注)当期末現在の自己株式は6,854,524株であり、「個人その他」に68,545単元、「単元未満株式の状況」に24株含
まれております。自己株式には、2016年6月24日開催の株主総会決議により導入した「業績連動型株式報酬制
度」において設定された「役員報酬BIP信託」が保有する当社株式252,401株は含めておりません。
44/152
EDINET提出書類
株式会社ニフコ(E02386)
有価証券報告書
(6)【大株主の状況】
2026年3月31日現在
氏名又は名称
住所
日本マスタートラスト信託銀行株式会社東京都港区赤坂1−8−1
(信託口)
所有株式数
(千株)
発行済株式
(自己株式を
除く。)の総
数に対する所
有株式数の割
合(%)
12,885
13.79
10,343
11.07
200 WEST STREET NEW YORK,NY,USA
(常任代理人 ゴールドマン・サックス
(東京都港区虎ノ門2−6−1)
証券株式会社)
6,025
6.45
株式会社日本カストディ銀行(信託口)
東京都中央区晴海1−8−12
5,229
5.60
日本生命保険相互会社
東京都千代田区丸の内1−6−6
2,915
3.12
2,686
2.87
2,247
2.40
2,135
2.28
1,731
1.85
1,458
1.56
47,659
51.03
公益財団法人小笠原敏晶記念財団
東京都港区芝5−27−6
GOLDMAN, SACHS & CO. REG
STATE STREET BANK AND TRUST COMPANY
510312
(常任代理人
営業部)
株式会社みずほ銀行決済
STATE STREET BANK AND TRUST COMPANY
510311
(常任代理人
営業部)
株式会社みずほ銀行決済
P.O. BOX 351 BOSTON MASSACHUSETTS
02101 U.S.A.
(東京都港区港南2−15−1)
P.O. BOX 351 BOSTON MASSACHUSETTS
02101 U.S.A.
(東京都港区港南2−15−1)
第一生命保険株式会社
東京都千代田区有楽町1−13−1
THE BANK OF NEW YORK MELLON 140042
240 GREENWICH STREET, NEW YORK, NY
(常任代理人
営業部)
株式会社みずほ銀行決済 10286, U.S.A.
(東京都港区港南2−15−1)
STATE STREET BANK AND TRUST COMPANY
505001
(常任代理人
営業部)
株式会社みずほ銀行決済
計
ONE CONGRESS STREET, SUITE 1,
BOSTON, MASSACHUSETTS
(東京都港区港南2−15−1)
−
45/152
EDINET提出書類
株式会社ニフコ(E02386)
有価証券報告書
(注)1.所有株式数及び発行済株式総数に対する所有株式数の割合は、表示単位未満の端数を切り捨てて表示して
おります。
2.日本マスタートラスト信託銀行株式会社(信託口)及び株式会社日本カストディ銀行(信託口)の所有株式
は、全て信託業務に係る株式であります。
3.次のとおり大量保有報告書等が提出されておりますが、当社として2026年3月31日現在における実質所有株
式数の確認ができませんので、上記大株主の状況には含めておりません。
住所
保有
株券等の
数
(千株)
発行済株式
(自己株式
を除く。)
の総数に対
する所有株
式数の割合
(%)
異動日
報告書
提出日
東京都中央区
日本橋1−13−1
5,175
5.16
2026年
5月15日
2026年
5月22日
氏名又は名称
※野村證券株式会社
(注)上表中「氏名又は名称」欄の※につきましては、共同保有であるため、当該報告書の提出者の名称及
び住所を記載しております。
46/152
EDINET提出書類
株式会社ニフコ(E02386)
有価証券報告書
(7)【議決権の状況】
①【発行済株式】
2026年3月31日現在
区分
株式数(株)
議決権の数(個)
内容
無議決権株式
−
−
−
議決権制限株式(自己株式等)
−
−
−
議決権制限株式(その他)
−
−
−
完全議決権株式(自己株式等)
普通株式
6,854,500
−
−
完全議決権株式(その他)
普通株式
93,353,000
933,530
−
単元未満株式
普通株式
25,114
−
−
発行済株式総数
100,232,614
−
−
総株主の議決権
−
933,530
−
(注)1.「完全議決権株式(その他)」の欄には、役員報酬BIP信託口が保有する当社株式252,400株(議決権
2,524個)が含まれております。
2.「単元未満株式」の普通株式の欄には、自己株式が24株、役員報酬BIP信託口の当社株式1株が含まれて
おります。
②【自己株式等】
2026年3月31日現在
所有者の氏名又は名称
株式会社ニフコ
計
所有者の住所
自己名義所有
株式数(株)
他人名義所有
株式数(株)
所有株式数の
合計(株)
発行済株式総数
に対する所有株
式数の割合
(%)
神奈川県横須賀市
光の丘5番3号
6,854,500
−
6,854,500
6.83
6,854,500
−
6,854,500
6.83
−
(8)【役員・従業員株式所有制度の内容】
① 業績連動型株式報酬制度
当社は、2016年5月23日開催の取締役会において、2016年6月24日開催の第64回定時株主総会に、当社取締役
及び執行役員(社外取締役及び海外居住者を除く。以下「取締役等」)に対する新たな株式報酬制度(以下「本
制度」)の導入について付議することを決議し、同株主総会において承認可決されました。なお、当該決議時に
おける本制度の対象となる取締役の員数は4名、執行役員の員数は12名です。
当社は、取締役等を対象に、取締役等の報酬と当社の株式価値との連動性をより明確にし、中長期的な業績向
上と企業価値増大への貢献意欲を高めることを目的として、本制度を導入しておりましたが、本制度の対象期間
が2019年8月31日までであることから、2019年5月20日開催の取締役会において、本制度の継続及び一部改定に
ついて2019年6月21日開催の第67回定時株主総会に付議することを決議し、同株主総会において承認可決されま
した。なお、当該決議時における本制度の対象となる取締役の員数は4名、執行役員の員数は9名です。
当社は、監査等委員会設置会社へ移行することに伴い、2021年5月20日開催の取締役会において、現在の取締
役及び執行役員に対する本制度に係る報酬枠を廃止し、監査等委員でない取締役及び執行役員(社外取締役及び
海外居住者を除く。以下これらをあわせて「監査等委員でない取締役等」という。)に対して、本制度に基づく
報酬枠を改めて設定したことに加え、本制度を一部改定の上、継続することについて2021年6月24日開催の第69
回定時株主総会に付議することを決議し、同株主総会において承認可決されました。なお、当該決議時における
本制度の対象となる取締役の員数は3名、執行役員の員数は9名です。
当社は、監査等委員でない取締役等と株主とのより一層の価値共有を進めることを目的に、本制度の業績連動
指標や株式交付時期等について見直しを行い、2024年5月17日開催の取締役会において、本制度を一部改定の
上、継続することについて2024年6月20日開催の第72回定時株主総会に付議することを決議し、同株主総会にお
いて承認可決されました。なお、当該決議時における本制度の対象となる取締役の員数は2名、執行役員の員数
は10名です。
47/152
EDINET提出書類
株式会社ニフコ(E02386)
有価証券報告書
2024年6月20日開催の定時株主総会で承認可決された業績連動型株式報酬制度の概要
(1) 本制度の信託期間
本制度は、当社が拠出する監査等委員でない取締役等の報酬額を原資として当社株式が信託(以下「本信託」と
いう。)を通じて取得され、監査等委員でない取締役等に当社株式の交付が行われる株式報酬制度です。当社は、
中期経営計画と同一年数の事業年度(以下「対象期間」という。)を対象として、中期経営計画に掲げる業績指標
の目標値に対する達成度及び役位に応じて、監査等委員でない取締役等に対して役員報酬として当社株式の交付を
行います。本制度の改定後の当初の対象期間は、2025年3月期から2027年3月期の3事業年度とします。
(2) 本制度の対象者
本制度の対象者は、監査等委員でない取締役及び執行役員(社外取締役及び海外居住者を除く。以下「制度対象
者」という。)とします。
(3) 本信託に拠出する信託金の上限
当社は、対象期間ごとに、1事業年度あたりの信託金の上限額(400百万円)に、その時点の中期経営計画に対
応する年数を乗じた数に相当する金額を上限とする金員を、制度対象者への報酬として拠出します。なお、当該金
銭の上限は、信託期間内の本信託による株式取得資金及び信託報酬・信託費用の合算金額となります。本制度の改
定後の当初の対象期間においては、3事業年度分の制度対象者への報酬として1,200百万円を上限とする金銭を拠
出します。
本信託は、信託管理人の指図に従い、信託された金員を原資として当社株式を株式市場または当社(自己株式の
処分)から取得します。当社は、信託期間中、制度対象者に対するポイント(下記(4)のとおり。)の付与を行
い、本信託は制度対象者が受益者要件を充足した場合に当社株式の交付を行います。
なお、本信託の信託期間の満了時において、信託契約の変更及び追加信託を行うことにより、本信託を継続する
ことがあります。その場合、当社のその時点の中期経営計画に対応する年数と同一期間を本制度の新たな対象期間
とし、同一年数だけ本信託の信託期間を延長します。当社は、延長された信託期間ごとに、本株主総会で承認を受
けた範囲内で金員を追加拠出し、引き続き延長された信託期間中、制度対象者に対するポイントの付与を継続し、
本信託は、延長された信託期間中、当社株式の交付を継続します。ただし、かかる追加拠出を行う場合において、
延長する前の信託期間の末日に信託財産内に残存する当社株式(制度対象者に付与されたポイントに相当する当社
株式で交付が未了であるものを除く。)及び金銭(以下「残存株式等」という。)があるときは、残存株式等の金
額と追加拠出される信託金の合計額は、1事業年度あたりの信託金の上限額に対象期間の年数を乗じた数に相当す
る金額の範囲内とします。
また、信託期間の満了時に信託契約の変更及び追加信託を行わない場合には、それ以降、ポイントの付与は行われ
ません。ただし、当該時点で当社株式の交付が未了である制度対象者が在任している場合には、当社株式の交付が
完了するまで、最長で約2年間、本信託の信託期間を延長させることがあります。
(4) 制度対象者が取得する当社株式の数の算定方法及び上限
制度対象者に対して交付が行われる当社株式の数は、制度対象者に毎年付与されるポイント数に応じて決定され
ます。
原則として、信託期間中の毎年6月に、制度対象者には、役位に応じた「固定ポイント」及び業績に応じて変動
する「業績基礎ポイント」が付与されます。
「業績基礎ポイント」については、原則として当該ポイントが付与された時点の中期経営計画終了直後の6月
に、当該中期経営計画に掲げる業績目標の達成度に応じた業績連動係数を乗じることにより「業績連動ポイント」
が算出されます。なお、業績連動係数は、当該中期経営計画に掲げる業績指標(営業利益、ROIC及びTSR
等)の目標値に対する達成度に応じて決定し、0%から200%の範囲で変動します。
なお、1ポイントは当社株式1株とします。ただし、信託期間中に当社株式の株式分割・株式併合等のポイント
の調整を行うことが公正であると認められる事象が生じた場合、分割比率・併合比率等に応じて、1ポイントあた
りの当社株式数の調整がなされます。
制度対象者に付与される1事業年度あたりのポイントの総数の上限は160,000ポイントとします。このポイント
の上限は、上記の信託金の上限額を踏まえて、過去の株価等を参考に設定しています。本信託が取得する当社株式
の数(以下「取得株式数」という。)は、対象期間ごとに、かかる1事業年度あたりのポイントの総数の上限に当
該対象期間の年数を乗じた数に相当する株式数を上限とします。本制度の改定後の当初の対象期間における取得株
式数は480,000株を上限とします。
48/152
EDINET提出書類
株式会社ニフコ(E02386)
有価証券報告書
(5) 制度対象者に対する当社株式の交付の方法及び時期
① 固定ポイント部分
受益者要件を満たした制度対象者は、所定の受益者確定手続を行うことにより、原則として固定ポイントを付与
された後の一定の時期に、当該固定ポイントに対応する当社株式について交付を受けるものとします。
② 業績基礎ポイント部分
受益者要件を満たした制度対象者は、所定の受益者確定手続を行うことにより、原則として業績基礎ポイント付
与時点の中期経営計画が終了し業績連動ポイントが算出された後の一定の時期に、当該業績連動ポイントに対応す
る当社株式について交付を受けるものとします。
③ 譲渡制限契約の締結
上記①②の当社株式の交付にあたって、原則として、当社と制度対象者との間で、以下の内容を含む制度対象者
の退任時までを譲渡制限期間とする譲渡制限契約を締結するものとします。
(a) 制度対象者は、当社株式の交付を受けた日から退任する日までの間、譲渡、担保権の設定その他の処分をして
はならないこと
(b) 制度対象者の退任時に譲渡制限が解除されること
(c) 譲渡制限期間中に職務・社内規程の重大な違反や、会社の意思に反した自己都合退任等の一定の非違行為等が
あった場合には、当該制度対象者に交付された当社株式について、譲渡制限を解除せず、当社が無償で取得するこ
と
なお、譲渡制限の対象とする当社株式は、譲渡制限期間中の譲渡、担保権の設定その他の処分をすることができな
いよう、譲渡制限期間中は、制度対象者が証券会社に開設した専用口座で管理されます。
④ 改定前の本制度からの移行措置
改定前の本制度からの移行措置として、改定前の本制度に基づき制度対象者に既に付与されたポイント(すなわ
ち制度対象者の退任後に当該ポイントに相当する当社株式及び当社株式の換価処分金相当額の金銭の交付及び給付
を予定していたポイント)については、固定ポイント及び業績連動ポイントは2024年6月20日開催の定時株主総会
の終了後の一定の時期に、業績基礎ポイントは当該ポイントが業績連動ポイントに転換された後、速やかに当該ポ
イントに相当する当社株式を交付した上で、③に記載する内容を適用し、制度対象者の退任時までを譲渡制限期間
とする譲渡制限契約を締結しております。
2026年6月24日開催予定の定時株主総会の議案(決議事項)として、「監査等委員でない取締役等に対する株式報
酬制度の一部改定の件」を上程しており、当該決議が承認されますと、当社の株式報酬制度は、下記のとおりとな
る予定です。
1.改定後の本制度における報酬等の額及び内容等
(1) 本制度の概要
本制度は、当社が拠出する取締役等の報酬額を原資として当社株式が信託を通じて取得され、取締役等に当社株式
の交付(一定の事由が生じた場合には当社株式の換価処分金相当額の金銭の給付。以下同じ。)が行われる株式報
酬制度です。(詳細は下記(2)以降のとおり。)
当社は、中期経営計画と同一年数の事業年度(以下「対象期間」という。)を対象として、中期経営計画に掲げる
業績指標等の目標値に対する達成度及び役位に応じて、取締役等に対して役員報酬として当社株式の交付を行いま
す。ただし、新たに本制度の対象となる社外取締役については、非業績連動型の役員報酬として当社株式の交付を
行います。本制度の改定をご承認いただいた後の当初の対象期間(以下「改定後対象期間」という)は、2027年3
月期から2029年3月期の3事業年度とします。このため、改定前の本制度に基づき2025年3月期から開始している
対象期間(以下「改定前対象期間」という。)については、2026年3月期で終了するものとします。
49/152
EDINET提出書類
株式会社ニフコ(E02386)
有価証券報告書
※下線部分が主な改定箇所
① 本議案の対象となる当社株式の
交付の対象者
・監査等委員でない取締役(海外居住者を除く。)
・執行役員(海外居住者を除く。)
※新たに社外取締役を対象者に含めます。
② 本議案の対象となる当社株式が発行済株式の総数に与える影響
当社が拠出する金員の上限(下
記(2)のとおり。)
・400百万円(うち、社外取締役分10百万円)に対象期間の年数を乗じた金
額
・改定後対象期間である本事業年度から開始する3事業年度に対しての上限
は、合計1,200百万円(うち、社外取締役分30百万円)
取締役等が取得する当社株式の
数の上限および当社株式の取得方
法(下記(3)のとおり。)
・取締役等に付与される1事業年度あたりのポイントの総数の上限は160,000
ポイント(うち、社外取締役分4,000ポイント)
・1事業年度あたりのポイントの総数の上限の1ポイント=1株に換算され
た 株式数の、発行済株式総数(2026年3月31日時点。自己株式控除後)
に対する割合は約0.17%
・改定後対象期間である本事業年度から開始する3事業年度に対しての上限
は、合計480,000ポイント(うち、社外取締役分12,000ポイント)
・当社株式は、株式市場または当社(自己株式処分)から取得予定
③ 業績達成条件の内容(下記(3)
のとおり。)
・中期経営計画に掲げる業績指標(営業利益率、ROEもしくはROIC、TSR、お
よび従業員エンゲージメント等)の目標値に対する達成度に応じて、
0%〜200%の範囲で変動
※新たに対象となる社外取締役には、業績達成条件は付されません。
④ 取締役等に対する当社株式の交
付の時期(下記(4)のとお
り。)
・業績連動(業績基礎ポイント)部分:原則、中期経営計画期間終了後
・業績非連動(固定ポイント)部分:原則、各事業年度終了後
・業績連動部分、業績非連動部分ともに、当社株式の交付後、取締役等の退
任時までの譲渡制限を付ける
(参考)なお、当社の中期経営計画につきましては、2026年度より、中長期的な目標に対するコミットをより強化
するために、固定型3カ年計画に切り替えます。これを踏まえ、本制度における株式交付のイメージは、下図のと
おりとなります。
(2) 当社が拠出する金員の上限
当社は、対象期間ごとに、1事業年度あたりの信託金の上限額(400百万円。うち、社外取締役分10百万円)
に、その時点の中期経営計画に対応する年数を乗じた数に相当する金額を上限とする金員を、取締役等への報酬と
して拠出し、受益者要件を充足する取締役等を受益者とする信託(以下「本信託」という。)の設定または既存の
本信託の信託期間の延長を行います。なお、当該金銭の上限は、信託期間内の本信託による株式取得資金および信
託報酬・信託費用の合算金額となります。本制度の改定をご承認いただいた後の改定後対象期間については、3事
業年度分の取締役等への報酬として1,200百万円(うち、社外取締役分30百万円)を上限とする金銭を拠出しま
す。
50/152
EDINET提出書類
株式会社ニフコ(E02386)
有価証券報告書
本信託は、信託管理人の指図に従い、信託された金員を原資として当社株式を株式市場または当社(自己株式の
処分)から取得します。当社は、信託期間中、取締役等に対するポイント(下記(3)のとおり。)の付与を行
い、本信託は取締役等が受益者要件を充足した場合に当社株式の交付を行います。
なお、本信託の信託期間の満了時において、信託契約の変更および追加信託を行うことにより、本信託を継続す
ることがあります。その場合、当社のその時点の中期経営計画に対応する年数と同一期間を本制度の新たな対象期
間とし、同一年数だけ本信託の信託期間を延長します。当社は、延長された信託期間ごとに、本株主総会で承認を
受けた範囲内で金員を追加拠出し、引き続き延長された信託期間中、取締役等に対するポイントの付与を継続し、
本信託は、延長された信託期間中、当社株式の交付を継続します。ただし、かかる追加拠出を行う場合において、
延長する前の信託期間の末日に信託財産内に残存する当社株式(取締役等に付与されたポイントに相当する当社株
式で交付が未了であるものを除く。)および金銭(以下「残存株式等」という。)があるときは、残存株式等の金
額と追加拠出される信託金の合計額は、1事業年度あたりの信託金の上限額に対象期間の年数を乗じた数に相当す
る金額の範囲内とします。なお、既に設定している信託については、改定前の本制度における信託金の上限の範囲
内で金員を拠出し当社株式を取得済ですが、改定前対象期間を2026年3月期までに短縮することから、既存の信託
内に残存する当社株式(2026年3月期までのポイントとして取締役等に付与されたポイントに相当する当社株式で
交付が未了であるものを除く。)は、改定後対象期間に活用するものとします。
また、信託期間の満了時に信託契約の変更および追加信託を行わない場合には、それ以降、ポイントの付与は行
われません。ただし、当該時点で当社株式の交付が未了である取締役等が在任している場合には、当社株式の交付
が完了するまで、本信託の信託期間を延長させることがあります。
(3) 取締役等が取得する当社株式の数の算定方法および上限
取締役等に対して交付が行われる当社株式の数は、取締役等に毎年付与されるポイント数に応じて決定されま
す。
原則として、信託期間中の毎年6月に、取締役等には、役位に応じた「固定ポイント」および業績に応じて変動
する「業績基礎ポイント」が付与されます。なお、社外取締役については固定ポイントのみ付与され、業績基礎ポ
イントは付与されません。
「業績基礎ポイント」については、原則として当該ポイントが付与された時点の中期経営計画終了直後の6月
に、当該期間の累積ポイントに当該中期経営計画に掲げる業績目標の達成度に応じた業績連動係数を乗じることに
より「業績連動ポイント」が算出されます。なお、業績連動係数は、当該中期経営計画に掲げる業績指標(営業利
益率、ROEもしくはROIC、TSRおよび従業員エンゲージメント等)の目標値に対する達成度に応じて決定
し、0%から200%の範囲で変動します。
なお、1ポイントは当社株式1株とします。ただし、信託期間中に当社株式の株式分割・株式併合等のポイント
の調整を行うことが公正であると認められる事象が生じた場合、分割比率・併合比率等に応じて、1ポイントあた
りの当社株式数の調整がなされます。
取締役等に付与される1事業年度あたりのポイントの総数の上限は160,000ポイント(うち、社外取締役分4,000
ポイント)とします。このポイントの上限は、上記の信託金の上限額を踏まえて、過去の株価等を参考に設定して
います。本信託が取得する当社株式の数(以下「取得株式数」という。)は、対象期間ごとに、かかる1事業年度
あたりのポイントの総数の上限に当該対象期間の年数を乗じた数に相当する株式数を上限とします。改定後対象期
間における取得株式数は480,000株(うち、社外取締役分12,000株)を上限とします。
(4) 取締役等に対する当社株式の交付の方法および時期
① 固定ポイント部分
受益者要件を満たした取締役等は、所定の受益者確定手続を行うことにより、原則として固定ポイントを付与さ
れた後の一定の時期に、当該固定ポイントに対応する当社株式について交付を受けるものとします。
② 業績基礎ポイント部分
受益者要件を満たした取締役等は、所定の受益者確定手続を行うことにより、原則として業績基礎ポイント付与
時点の中期経営計画期間が終了し業績連動ポイントが算出された後の一定の時期に、当該業績連動ポイントに対応
する当社株式について交付を受けるものとします。
なお、受益者要件を満たす取締役等が死亡した場合には、その時点までに付与されている固定ポイントおよび業
績基礎ポイントに応じた当社株式について、そのすべてを本信託内で換価した上で、その換価処分金相当額の金銭
の給付を当該取締役等の相続人が受けるものとします。
③ 譲渡制限契約の締結
51/152
EDINET提出書類
株式会社ニフコ(E02386)
有価証券報告書
上記①②の当社株式の交付にあたって、原則として、当社と取締役等との間で、以下の内容を含む取締役等の退
任時までを譲渡制限期間とする譲渡制限契約を締結するものとします。
(a) 取締役等は、当社株式の交付を受けた日から退任する日までの間、譲渡、担保権の設定その他の処分をしては
ならないこと
(b) 取締役等の退任時に譲渡制限が解除すること
(c) 譲渡制限期間中に職務・社内規程の重大な違反や、会社の意思に反した自己都合退任等の一定の非違行為等が
あった場合には、当該取締役等に交付された当社株式について、譲渡制限を解除せず、当社が無償で取得すること
なお、譲渡制限の対象とする当社株式は、譲渡制限期間中の譲渡、担保権の設定その他の処分をすることができ
ないよう、譲渡制限期間中は、取締役等が証券会社に開設した専用口座で管理される予定です。
④付与済みポイントに対する改定前の本制度の適用
改定前の本制度に基づき取締役等に既に付与された2024年度分および2025年度分の業績連動ポイントについて
は、従前の制度内容に従い、それぞれ2026年度、2027年度の業績確定後に株式交付が行われるものとします。
(5) 報酬の没収等
重大な会計上の誤りや不正による決算の事後修正が取締役会において決議された場合、または在任期間中に取締
役会が重大な不適切行為があったと判断した場合には、取締役会が、指名・報酬・ガバナンス委員会の審議を経
て、株式報酬の支給を制限または返還を請求することがあります。
(6) 本信託内の当社株式に関する議決権
本信託内にある当社株式については、経営への中立性を確保するため、信託期間中、議決権は行使されないもの
とします。
(7) 本信託内の当社株式の剰余金配当の取扱い
本信託内の当社株式についての剰余金配当は、本信託が受領し、本信託の信託報酬・信託費用に充てられます。
信託報酬・信託費用に充てられた後、最終的に信託が終了する段階で残余が生じた場合には、取締役等のうち、本
信託の終了に際して、所定の受益者要件を満たして信託契約に基づき本信託の受益者となった者に対して給付され
ることになります。
(8) その他の本制度の内容
本制度に関するその他の内容については、本信託の設定、信託契約の変更および本信託への追加拠出の都度、取
締役会において定めます。
(参考)
なお、当社は、本議案が原案どおり承認可決されることを条件に、当社の一部の子会社の取締役についても本制
度の対象として同一の信託で管理する予定です。当該一部の子会社の取締役に係る報酬枠は本議案に係る報酬枠と
は別枠で、子会社における株主総会に付議する予定です。
②
従業員向け株式報酬制度
当社は、従業員の帰属意識の醸成と経営参画意識を持たせ、従業員の長期的な業績向上や株価上昇に対する意欲
や士気の高揚を図るとともに、中長期的な企業価値向上を図ることを目的として、当社の従業員に信託を通じて自
社の株式を交付する取引を行っております。
(1) 取引の概要
当社は、従業員を対象に、当社の中長期的な業績向上と企業価値増大への貢献意欲を高めることを目的として、
2018年8月27日に株式報酬制度(以下「本制度」という。)を導入いたしました。
本制度では、株式付与ESOP(Employee Stock Ownership Plan)信託(以下、「ESOP信託」という。)
と称される仕組みを採用しております。ESOP信託とは、米国のESOP制度を参考にした従業員インセンティ
ブ・プランであり、ESOP信託が取得した当社株式を、予め定める株式交付規程に基づき、一定の要件を充足す
る幹部従業員及び業績貢献度の高い従業員に交付するものです。なお、当該信託が取得する当社株式の総額の上限
は150百万円(信託報酬・信託費用を含む。)で、当社株式の取得資金は全額当社が拠出するため、従業員の負担
はありません。
ESOP信託の導入により、従業員は当社株式の株価上昇による経済的な利益を収受することができるため、株
価を意識した従業員の業務遂行を促すとともに、従業員の勤労意欲を高める効果が期待できます。また、ESOP
52/152
EDINET提出書類
株式会社ニフコ(E02386)
有価証券報告書
信託の信託財産に属する当社株式に係る議決権行使は、受益者候補である従業員の意思が反映される仕組みであ
り、従業員の経営参画を促す企業価値向上プランとして有効です。
(2) 信託に残存する自社の株式
信託に残存する自社株式を、信託における帳簿価額(付随費用の金額を除く。)により、純資産の部に自己株式
として計上しております。
53/152
EDINET提出書類
株式会社ニフコ(E02386)
有価証券報告書
2【自己株式の取得等の状況】
【株式の種類等】
会社法第155条第3号、会社法第155条第7号及び会社法第155条第13号に該当する普通株式
の取得
(1)【株主総会決議による取得の状況】
該当事項はありません。
(2)【取締役会決議による取得の状況】
会社法第155条第3号による取得
区分
株式数(株)
取締役会(2025年7月31日)での決議状況
(取得期間2025年8月1日〜2025年10月30日)
価額の総額(円)
1,500,000
5,000,000,000
−
−
当事業年度における取得自己株式
1,190,700
4,999,546,388
残存決議株式の総数及び価額の総額
309,300
453,612
20.62
0.00
当期間における取得自己株式
−
−
提出日現在の未行使割合(%)
20.62
0.00
当事業年度前における取得自己株式
当事業年度の末日現在の未行使割合(%)
区分
株式数(株)
取締役会(2025年10月31日)での決議状況
(取得期間2025年11月4日〜2026年1月28日)
価額の総額(円)
1,250,000
5,000,000,000
−
−
当事業年度における取得自己株式
1,057,200
4,999,540,493
残存決議株式の総数及び価額の総額
192,800
459,507
15.42
0.00
当期間における取得自己株式
−
−
提出日現在の未行使割合(%)
15.42
0.00
当事業年度前における取得自己株式
当事業年度の末日現在の未行使割合(%)
(3)【株主総会決議又は取締役会決議に基づかないものの内容】
会社法第155条第7号による取得
区分
株式数(株)
価額の総額(円)
当事業年度における取得自己株式
156
637,604
当期間における取得自己株式
−
−
(注) 1.当期間における取得自己株式には、2026年6月1日からこの有価証券報告書提出日までの単元未満株式の
買取による株式は含まれておりません。
2.取得自己株式数には、役員報酬BIP信託が取得した株式数は含めておりません。
会社法第155条第13号による取得
区分
株式数(株)
当事業年度における取得自己株式
当期間における取得自己株式
価額の総額(円)
24,439
79,210,438
−
−
(注) 1.株式付与ESOP信託の終了に伴う自己株式の無償取得であります。
54/152
EDINET提出書類
株式会社ニフコ(E02386)
有価証券報告書
(4)【取得自己株式の処理状況及び保有状況】
当事業年度
区分
引き受ける者の募集を行った取得自己株式
消却の処分を行った取得自己株式
合併、株式交換、株式交付、会社分割に係る
移転を行った取得自己株式
その他
(特別奨励金付与に伴う第三者割当による
自己株式処分)
その他
(単元未満株式の売渡請求)
保有自己株式数
当期間
株式数(株)
処分価額の総額
(円)
株式数(株)
処分価額の総額
(円)
−
−
−
−
24,439
79,210,481
−
−
−
−
−
−
98,250
335,916,750
−
−
−
−
−
−
6,854,524
−
6,854,524
−
(注)1.当期間における処理自己株式数には、2026年6月1日からこの有価証券報告書提出日までの単元未満株式の
売渡による株式は含まれておりません。
2.当期間における保有自己株式数には、2026年6月1日からこの有価証券報告書提出日までの単元未満株式の
買取及び売渡による株式は含まれておりません。
3.「第5 経理の状況」以下の自己株式数は、7,106,925株と表示しております。これは、当社と従業員持株
会信託口が一体であるとする会計処理に基づき、役員報酬BIP信託口が保有する当社株式252,401株を自
己株式に含めて計上しているためであります。
55/152
EDINET提出書類
株式会社ニフコ(E02386)
有価証券報告書
3【配当政策】
当社は、2025年9月より株主還元に関する基本方針を「総還元性向45%以上」から「配当性向30%以上、総還元
性向50%以上」に変更しております。生み出したキャッシュは投資と株主還元に活用してまいります。
当社は、中間配当と期末配当の年2回の剰余金の配当を行うことを基本方針としております。
これらの剰余金の配当の決定機関は、2021年6月24日開催の定時株主総会にて、「定款一部変更の件」が承認
可決されたことに伴い、「当会社は、剰余金の配当等、会社法第459条第1項各号に定める事項については、法令
に別段の定めのある場合を除き、取締役会の決議によって定めることができる。」旨を新たに定款に定めており
ますが、引き続き、中間配当については取締役会、期末配当については株主総会とする予定です。
2026年3月期の期末配当につきましては、2026年5月14日に発表したとおり、上記の基本方針に基づき、当社
を取り巻く経営環境や業績等を総合的に勘案し、1株当たりの配当金70円を予定しております。これにより、既
に実施しました中間配当40円を含め、1株当たりの年間配当金は110円となります。
内部留保資金の使途については、中期経営計画で設定した各目標達成のための投資等に充当することとしてお
ります。
なお、当事業年度に係る剰余金の配当は以下のとおりであります。
決議年月日
配当金の総額
(百万円)
1株当たり配当額
(円)
2025年10月31日
取締役会決議
3,792
40
2026年6月24日
定時株主総会決議
(予定)
6,536
70
(注)1.2025年10月31日開催の取締役会で決議された配当金の総額には、役員報酬BIP信託口に対する配当
金10百万円、2026年6月24日開催の株主総会で決議予定の配当金の総額には役員報酬BIP信託口に
対する配当金17百万円を含めて表示しております。
2.2025年10月31日開催の取締役会で決議された配当金の総額には、株式付与ESOP信託口に対する配
当金1百万円を含めて表示しております。
56/152
EDINET提出書類
株式会社ニフコ(E02386)
有価証券報告書
4【コーポレート・ガバナンスの状況等】
(1)【コーポレート・ガバナンスの概要】
① コーポレート・ガバナンスに関する基本的な考え方
当社は、1967年の創業以来培ってきた「チャレンジ精神」と「創造性」をニフコスピリットの支柱として成長し続
けてきました。これまでの歴史を踏まえ、今後更なる成長ステージへ進む決意を込めて、当社のPurpose / Mission
/ Valuesを以下のとおり制定しております。
社員一人ひとりが個々に持つ「My Purpose」を起点に、当社のValues(価値観)を通じて、Mission(使命)を果た
すことで、当社の Purpose(存在意義)の実現を図る、これがニフコグループの企業理念です。今後も、当社は、ニ
フコらしさを追求しながら持続的に成長し、お客様、取引先、株主、投資家、地域社会など全てのステークホルダー
から信頼され続ける企業であり続けることを目指します。
Purpose
(存在意義)
小さな気づきと技術をつなぎ、心地よい生活と持続可能な社会を創造する
Mission
(使命)
クリエイティブカンパニーとして感動を生み出す
Values
(価値観)
変革のためのチャレンジ
継続的なブレイクスルー
自由なコミュニケーション
創造的なコラボレーション
また、今後も引き続き、コンプライアンス遵守を徹底し、適切なリスクマネジメントを実践することによって、激
変する社会経済環境に柔軟かつ適正に対応していくことが必要であり、会社経営の基本方針をグローバルに徹底し実
践していくことも重要であると考えます。
当社は、上記の基本的な考え方に基づいてコーポレート・ガバナンスの充実を経営の優先課題と位置付け、グルー
プ経営の強化を図っていきます。
② 企業統治の体制の概要及び当該体制を採用する理由
当社の企業統治の体制は、以下のとおりです。
イ.会社の機関の基本説明
当社は、取締役の職務執行の監査等を担う監査等委員を取締役会の構成員とし、取締役会での議決権を付与する
ことで、取締役会の監査・監督機能を高め、コーポレート・ガバナンスの一層の強化を図るという観点から、2021
年6月24日付をもって監査役会設置会社から監査等委員会設置会社へ移行いたしました。
提出日(2026年6月22日)現在の取締役は8名(うち5名が社外取締役)であります。
取締役会は、当社の経営基本方針及び経営業務執行上の重要な事項を決定または承認し、取締役の業務執行を監
督いたします。また、子会社に関する経営戦略の策定等を通じて、当社グループの業績向上・成長のみならずコー
ポレート・ガバナンスの強化に努めております。
なお、取締役会は、原則として毎月1回定期開催するほか必要に応じて臨時に開催しており、2025年度は12回開
催しております。また、2025年度には監査等委員会を15回開催しております。
提出日(2026年6月22日)現在の取締役会は取締役8名で構成されており、その構成員は代表取締役社長柴尾
雅春、取締役福尾道宏、社外取締役野々垣好子、社外取締役米谷佳夫、社外取締役山畑聡、取締役監査等
委員矢内俊樹、社外取締役監査等委員松本光博、社外取締役監査等委員林いづみになります。取締役会の議
長は、当社取締役会規程に従い、代表取締役社長柴尾雅春が務めております。
提出日(2026年6月22日)現在の監査等委員会は監査等委員3名で構成されており、その構成員は取締役常勤監
査等委員矢内俊樹、社外取締役監査等委員松本光博、社外取締役監査等委員林いづみになります。
一方、取締役会付議事項ではない案件のうち比較的重要度の高い案件等につきましては、基本的に毎月1回開催
される経営会議(社内取締役、執行役員その他幹部社員で構成される)で審議・報告を行っております。
提出日(2026年6月22日)現在の経営会議は取締役3名、執行役員13名で構成されており、その構成員は代表取
締役社長柴尾雅春、取締役福尾道宏、取締役監査等委員矢内俊樹、執行役員小泉昌史、執行役員長岡昌
哉、執行役員村田憲彦、執行役員金京俊、執行役員 Joan Oliveras、執行役員佐野久実、執行役員
Michael Rodenberg、執行役員
横田賢、執行役員
坂田一臣、執行役員
廣瀬明彦、執行役員
杉山保、執行役
員一丸貴秀、執行役員司空翰になります。議題に応じて、海外の執行役員も出席しております。経営会議の議
長は、当社経営会議規程に従い、代表取締役社長柴尾雅春が務めております。
57/152
EDINET提出書類
株式会社ニフコ(E02386)
有価証券報告書
※当社は、2026年6月24日開催予定の定時株主総会の議案(決議事項)として「監査等委員でない取締役6名選
任の件」を提案しており、当該議案が承認可決された場合の取締役会の構成員は、後記「(2)役員の状況
①2.」のとおりであります。また、当該定時株主総会の直後に開催が予定されている取締役会の決議事項と
して「代表取締役選定の件」、「取締役の執行職兼務及び職務委嘱等確認の件」及び「取締役兼務ではない執
行役員の主な職務を確認する件」が付議される予定です。これらが承認可決された場合の経営会議は取締役4
名、執行役員10名で構成され、その構成員は代表取締役社長柴尾雅春、取締役福尾道宏、取締役司空
翰、取締役監査等委員矢内俊樹、執行役員長岡昌哉、執行役員金京俊、執行役員 Joan Oliveras、執
行役員
佐野久実、執行役員
Michael Rodenberg、執行役員
横田賢、執行役員
杉山保、執行役員
一丸
貴秀、執行役員楢原稔、執行役員飴野公也になります。2025年度と同様に、議題に応じて海外の執行役員
も出席し、経営会議の議長は、代表取締役社長柴尾雅春が務めてまいります。
当社では、執行役員制度をとることによって業務の迅速かつ円滑な執行を図っております。取締役会は代表取締
役や取締役の監督にとどまらず、執行役員の業務執行に対する監督機能も担っております。
更に、「取締役の職務の執行が法令及び定款に適合することを確保するための体制その他会社の業務の適正を確
保するための体制」(詳細は後述)を具体化するために、2007年度から取締役会の下に「リスクマネジメント委員
会」、「コンプライアンス委員会」、「情報セキュリティ委員会」を設置・運営し、2022年度には取締役会の諮問
委員会として「サステナビリティ委員会」を設置しました。2025年度は、「リスクマネジメント委員会」、「コン
プライアンス委員会」、「情報セキュリティ委員会」の3委員会を「リスクマネジメント委員会」に集約するとと
もに、取締役会の諮問機関として設置されていた「サステナビリティ委員会」を執行側へと移行しました。移行後
は「リスクマネジメント委員会」及び「サステナビリティ委員会」が取組状況を管理し、その結果を経営会議に報
告提言します。経営会議で議論された内容は、両委員会を通して、当社の各事業部門及びグループ各社の経営計画
に反映されます。この委員会の変更は「取締役の職務の執行が法令及び定款に適合することを確保するための体制
その他会社の業務の適正を確保するための体制」にも反映し、2025年5月19日開催の取締役会において決議いたし
ました。2025年度における開催回数は下記のとおりでした。
「リスクマネジメント委員会」(開催回数3回)
「サステナビリティ委員会」(同3回)
ロ.内部統制システムの状況
取締役の職務の執行が法令及び定款に適合することを確保するための体制その他会社の業務の適正を確保するた
めの体制について、取締役会で以下のとおり決議しております。
1.取締役と使用人の職務の執行が法令及び定款に適合することを確保するための体制
当社グループは、ニフコグループ企業行動憲章の下、法令等の遵守は当然のこととして、取締役と使用人が高
い倫理観をもって職務を執行する社内体制を構築する。当社グループは、ニフコグループ内部通報規程に基づき
「通報窓口」を設置し、コンプライアンス違反・社内規則違反・非倫理的行為のおそれがあると気づいた場合
は、社内・社外から「通報窓口」にて報告・相談を受け付ける。
2.取締役の職務執行に係る情報の保存及び管理に関する体制
文書管理規程を踏まえて、取締役の職務執行に係る意思決定過程及び職務執行の具体的状況等をいつでもレ
ビューできるよう当該情報の保存・管理体制を万全にする。
3.損失の危険の管理に関する規程その他の体制
リスクマネジメント基本規程に基づくリスクマネジメント委員会を中心に、当社グループの主要なリスクを抽
出・分析したうえで、各リスクの事前予防策を検討・実施するとともに、万一リスクが顕在化した場合でも損失
を極小化する事後対応体制を構築する。
4.取締役の職務執行が効率的に行なわれることを確保するための体制
取締役は、取締役会のほか、毎月開催される経営会議において経営上の重要案件を討議・決議し、適正な指示
を行うことによって、効率的に執行する。
取締役は、取締役による意思決定や方針・指示を組織の隅々まで伝達し、執行役員をはじめ幹部社員による職
務執行も一体的・効率的に行われる体制を構築する。
5.企業集団における業務の適正を確保するための体制
国内外の関連会社権限規程に基づき、企業集団に属する子会社の状況を正確に把握して適正に管理する。
また、毎月、業績に関する計数の報告だけでなく、顧客、製品等に関する定性的な報告を受ける。更に、必要
に応じて、当社取締役をはじめ幹部社員が海外を含む子会社に出向き、問題点の把握・解決に努める。
6.監査等委員会の職務を補助すべき取締役及び使用人に関する体制と当該使用人の取締役からの独立性に関する
事項、及び当該使用人に関する指示の実効性に関する事項
取締役会は、監査等委員会がスタッフを求めた場合、監査等委員会の要請を最大限尊重して、業務執行との調
整を行う。スタッフとして指名された使用人は、監査等委員会から指揮命令を受けた業務を優先して遂行すると
ともに、当該指揮命令を受けた業務に関し、取締役(監査等委員である取締役を除く。)の指揮命令は受けない
ものとする。
58/152
EDINET提出書類
株式会社ニフコ(E02386)
有価証券報告書
また、スタッフとして指名された使用人の人事異動及び人事評価については事前に監査等委員会の同意を得るこ
ととする。
7.取締役(監査等委員である取締役を除く。)及び使用人が監査等委員会に報告をするための体制
取締役会は、取締役及び使用人が重要事項については監査等委員会に報告すべき義務があることを周知徹底す
る。また、ニフコグループ内部通報規程に基づき設置された「通報窓口」が受領した通報内容については、当該
窓口から監査等委員会に報告される体制とする。
常勤監査等委員は、取締役会だけでなく経営会議等の執行部門の会議にも出席し、取締役及び幹部社員の職務
執行状況の報告を受ける。なお、常勤監査等委員は、決裁前の稟議書を全て閲覧し、当該稟議書の内容に関して
担当の取締役又は使用人に対し質問し報告を受ける体制をとる
8.監査等委員会の監査が実効的に行われることを確保するための体制
代表取締役をはじめとする取締役は監査等委員会と定期的な意見交換を行い、監査等委員会は内部監査部門と
定期的な協議を行う。さらに、監査等委員会及び内部監査部門は会計監査人と協議・検討を行い、また必要に応
じ国内外の子会社の監査部門と協議・意見交換を行う。
監査等委員の職務の執行に生ずる費用等は適正且つ速やかに処理されることとする。
ハ.現状のコーポレート・ガバナンス体制を選択している理由
当社は、取締役の職務執行の監査等を担う監査等委員を取締役会の構成員とし、取締役会での議決権を付与する
ことで、取締役会の監査・監督機能を高め、コーポレート・ガバナンスの一層の強化を図るという観点から、2021
年6月24日付をもって監査役会設置会社から監査等委員会設置会社へ移行いたしました。
また、当社は、経営戦略・財務/資本政策・グローバル事業・法務/リスクマネジメント・IT/DX 及びサステナビ
リティが、当社の持続的成長において重要な領域と捉えており、各領域において豊富な経験・スキルを持つ社外取
締役が、公正な立場から経営方針・業務執行を監督する体制としております。更に、公認会計士、弁護士として専
門的な知識・経験をもつ社外取締役監査等委員2名と社内事情に通じた常勤の社内取締役監査等委員が会計監査人
及び監査部と連携して監査を実施しております。
③
企業統治に関するその他の事項
イ.取締役会にて決議できる株主総会決議事項
当社は、剰余金の配当等、会社法第459条第1項各号に定める事項について、法令に別段の定めがある場合を除
き、株主総会の決議によらず取締役会の決議により定める旨定款に定めております。
これは、剰余金の配当等を取締役会の権限とすることにより、機動的な資本政策及び配当政策を図ることを目的
とするものであります。ただし、引き続き、剰余金の配当の決定機関は、中間配当は取締役会、期末配当は株主総
会とする方針です。
ロ.取締役の定数
当社の取締役は、監査等委員でない取締役8名以内、監査等委員である取締役3名以内とする旨を定款で定めて
おります。
ハ.取締役の選任の決議要件
当社は、取締役の選任決議について、議決権を行使することができる株主の議決権の3分の1以上を有する株主
が出席し、その議決権の過半数をもって行う旨を定款で定めております。
また、取締役の選任決議は累積投票によらない旨を定款で定めております。
ニ.株主総会の特別決議要件
当社は、会社法第309条第2項に定める決議は、議決権を行使することができる株主の議決権の3分の1以上を
有する株主が出席し、その議決権の3分の2以上をもって行う旨を定款で定めております。これは、株主総会にお
ける特別決議の定足数を緩和することにより、株主総会の円滑な運営を行うことを目的とするものであります。
59/152
EDINET提出書類
株式会社ニフコ(E02386)
有価証券報告書
ホ.責任限定契約の概要
当社は、取締役(業務執行取締役等であるものを除く。)との間で、会社法第423条第1項の賠償責任について
法令に定める要件に該当する場合には、賠償責任を限定する契約を締結することができる旨を定款で定めておりま
す。なお、当該契約に基づく賠償責任の限度額は、金2,000万円以上で予め定めた額と法令の定める最低責任限度
額とのいずれか高い額としております。当社は、この定款の規定により、取締役との間で、会社法第423条第1項
の賠償責任を限定する契約を締結しており、当該契約に基づく賠償責任の限度額は、2,000万円と法令の定める最
低責任限度額とのいずれか高い額となります。
ヘ.取締役の責任免除
当社は、会社法第426条第1項の規定により、取締役(取締役であった者を含む。)の会社法第423条第1項の責
任につき、善意でかつ重大な過失がない場合は、取締役会の決議によって、法令の定める限度額の範囲内で、その
責任を免除できる旨定款に定めております。これは、取締役が職務を遂行するにあたり、期待される役割を十分に
発揮できるようにするためであります。
ト.役員等賠償責任保険の内容の概要
当社は、会社法第430条の3第1項に規定する役員等賠償責任保険(D&O保険)契約を保険会社と締結してお
ります。当該保険契約の被保険者の範囲は当社取締役、執行役員及び管理職従業員並びに当社子会社の役員等であ
り、保険料については、全額当社及び上記子会社が負担しております。当該保険契約では、被保険者がその職務の
執行に関し責任を負うこと、または当該責任の追及に係る請求を受けることによって生ずることのある損害につい
て補填することとしております。
ただし、法令違反の行為であることを認識しながら行った行為に起因して生じた損害、違法に利益または便益を
得た場合に生じた損害は補填されないなど、一定の免責事由があります。
チ.取締役会の活動状況
当事業年度において、当社は、取締役会を基本的に月1回、計12回開催しており、個々の取締役の出席状況につ
いては次のとおりであります。
氏名
柴尾雅春
矢内俊樹
野々垣好子
米谷佳夫
松本光博
林 いづみ
福尾道宏
山畑聡
本多純二
出席回数
全12回中12回
全12回中12回
全12回中12回
全12回中12回
全12回中12回
全12回中12回
全9回中9回
全9回中9回
全3回中3回
安部
全3回中3回
真行
(注)本多純二及び安部真行は、2025年6月24日開催の定時株主総会の終結の時をもって退任し、福尾道宏及び山
畑聡は、同日の株主総会で取締役に就任しています。全回数の違いは、就任時期及び退任時期の違いによる
ものです。
取締役会においては、取締役会規程に基づく決議事項とともに、新規事業開発を含む中長期の成長戦略、全社及
び事業別・地域別の事業戦略、資本政策を含む財務面での戦略、持続的成長を支える人材戦略、環境に対する取組
などのサステナビリティ方針など、多岐にわたる討議を行っております。
また、年12回開催する取締役会のうち、1回は技術開発センターで開催し、それぞれ現場マネジメントとの討論
会を実施しているほか、海外視察の機会を設定し(2025年度は2回)、重要拠点の視察を通じて事業環境や現状を
理解することにより、取締役会での議論の深化を図っています。
60/152
EDINET提出書類
株式会社ニフコ(E02386)
有価証券報告書
リ.指名・報酬・ガバナンス委員会の概要及び活動状況
役員報酬制度の内容の独立性・客観性・透明性を高めるために、取締役会の諮問機関として、委員長及び委員の
過半数を独立社外取締役とする指名・報酬・ガバナンス委員会を2020年10月28日に設置しました。同委員会は、原
則として年4回以上実施することとしており、取締役の選解任基準やCEOの後継者計画、役員報酬の設計・水準や
個別の評価報酬について審議し、取締役会に対して助言・提言を行い、取締役会は、同委員会の答申を受けて、決
議を行っています。なお、社外からの客観的視点及び役員報酬制度に関する専門的知見を導入するため、指名・報
酬・ガバナンス委員会の起用した外部のコンサルタントの助言を受け、外部データ、経済環境、業界動向及び経営
状況等を勘案し、報酬水準及び報酬制度等について検討することとしています。
2025年度は、指名・報酬・ガバナンス委員会を10回実施し、役員体制、役員報酬設計やサクセッションプラン、
取締役の個別の報酬額について審議しました。指名・報酬・ガバナンス委員会の構成員及び出席状況については以
下のとおりです。
氏名
出席回数
柴尾雅春
全10回中10回
野々垣好子
全10回中10回
米谷佳夫
全10回中10回
山畑聡
全8回中8回
(注)全回数の違いは、就任時期の違いによるものです。
当社は、指名・報酬・ガバナンス委員会における審議を経て、2024年5月17日開催の取締役会において、2024年
度以降の役員指名ポリシーにつき決議いたしました。具体的な内容は以下のとおりです。
〔役員指名ポリシー〕
コーポレート・ガバナンスに関する基本的な考え方
当社は、1967年の創業以来培ってきた「チャレンジ精神」と「創造性」をニフコスピリットの支柱として成長し
続けてきました。これまでの歴史を踏まえ、今後更なる成長ステージへ進む決意を込めて、改めて、当社の
Purpose / Mission / Valuesを以下のとおり制定いたしました。
社員一人ひとりが個々に持つ「My Purpose」を起点に、当社のValues(価値観)を通じて、Mission(使命)を果
たすことで、当社の Purpose(存在意義)の実現を図る、これがニフコグループの企業理念です。今後も、当社
は、ニフコらしさを追求しながら持続的に成長し、お客様、取引先、従業員、株主、投資家、地域社会など全ての
ステークホルダーから信頼され続ける企業となることを目指します。
Purpose
(存在意義)
小さな気づきと技術をつなぎ、心地よい生活と持続可能な社会を創造する
Mission
(使命)
クリエイティブカンパニーとして感動を生み出す
Values
(価値観)
変革のためのチャレンジ
継続的なブレイクスルー
自由なコミュニケーション
創造的なコラボレーション
また、今後も引き続き、コンプライアンス遵守を徹底し、適切なリスクマネジメントを実践することによって、
激変する社会経済環境に柔軟かつ適正に対応していくことが必要であり、会社経営の基本方針をグローバルに徹底
し実践していくことも重要であると考えます。
当社は、上記の基本的な考え方に基づいてコーポレート・ガバナンスの充実を経営の優先課題と位置付け、グ
ループ経営の強化を図っていきます。
61/152
EDINET提出書類
株式会社ニフコ(E02386)
有価証券報告書
1.最高経営責任者(CEO)の人材要件
当社のCEOに求められる人材像は、ニフコの企業理念(Purpose, Mission, Values)を実現・体現できる人材で
す。上記のコーポレート・ガバナンスに関する基本的な考え方に基づき、CEOの人材要件(理念・価値観、コンピ
テンシー) を定めており、詳細は以下のとおりです。
項目
理念・価値観
コンピテンシー
内容
企業理念の体
現
ニフコの企業理念・風土に対する深い理解を持ち、自らの判断・言動をもっ
て体現している
倫理基準
自組織の利益のみを追うのではなく、企業の社会的責任に立脚し、社会に資
するための意思決定を行う
ビ ジ ョ ン ・戦市場やユーザーの将来像を洞察し、競争優位を生むビジネスモデルや戦略を
略の構築
構想して、重要な指標と優先順位を決定する
多様性の推進
文化や考え方が異なる相手を理解・尊重し、新たなアイデア・技術の創出に
向け、組織において多様な人材の協働を働きかけている
変革 リ ー ダ ー 関係者に対して変化・変革の必要性を説明し動機づけ、自ら変化を創造・牽
シップ
引して、新規事業の創生を含めた企業の持続的成長を推進する
ブ レ イ ク ス 世の中に新しい驚きを提供し続けてきたニフコの歴史に学び、新たな驚きと
ルー
喜びの創造に向けて既存の常識や枠組みを打ち破ることや、困難を乗り越え
ることに、粘り強く取り組んでいる
変化への対応
ビジネスを取り巻く最新情報を把握し、リスクとチャンスを鋭敏に見出し、
軌道修正や中止・撤退をタイムリーに決定し、実行する
組織 の 構築・戦略に適合した組織や仕組みを構築し、経営資源配分と権限委譲を通じて人
強化
材を育てる
人間力・人徳
誠実さや高潔さ、および情理を兼ね備えた度量の深さによって、「この人が
言うならやってみよう」と社内外の関係者から深く信頼されている
学習力・好奇多様な意見や情報を尊重し聞き入れ、様々な考え方・アイデアを検討する姿
勢をもち、新たな見方を創り出している
心
情熱・ こ だ わ 現状に満足せず、常に成長と目標達成に対する情熱とこだわりを持ち、様々
な打ち手を講じて徹底してやりきっている
り
2.選解任基準
経営陣幹部については、経営戦略等の立案に必要な事業環境や経営状況の理解及び取締役会が定めた経営戦略等
を、強いリーダーシップを発揮し迅速かつ適切に執行できる能力と経験(特に、グローバルな業務の経験)を重視
して選解任いたします。なお、CEOの選任にあたっては、上記のCEOの人材要件に基づき、指名・報酬・ガバナンス
委員会の助言・提言を踏まえて行います。
CEOの解任については、次に定める解任基準に該当する疑いを生じさせる行為があった場合は、速やかに指名・報
酬・ガバナンス委員会及び取締役会で審議を行うものとしております。
(1)不正、不当又は背信を疑われる行為があったとき
(2)会社法、関係法令に違反するなど、CEOとして不適格と認められたとき
(3)上記のCEOの人材要件を取り巻くビジネス環境に照らし、その資質に疑義が生じたとき
(4)職務遂行の過程又はその成果が不十分であり、かつ本人を引き続きCEOとしての職務におくことが不適当で
あると判断したとき
なお、指名・報酬・ガバナンス委員会は、毎年、上記のCEOの人材要件及び業績等に基づきCEOの評価を行い、CEO
の次年度以降の取組内容や本人の意欲を確認の上、次年度の再任について取締役会に答申いたします。
3.後継者計画
CEOの後継者計画は、上記のCEOの人材要件に基づき、指名・報酬・ガバナンス委員会にて審議します。具体的に
は、指名・報酬・ガバナンス委員会にて協議・策定した選定プロセスを基に、候補者プールの作成と更新、外部専
門家によるアセスメント、プール人材に対する育成のサイクルを定期的に回し、絞り込みを行います。取締役会
は、委員会による審議内容の報告を踏まえ、後継者計画が適格に運営されているかを監督します。
62/152
EDINET提出書類
株式会社ニフコ(E02386)
有価証券報告書
4.任期
監査等委員でない取締役(独立社外取締役を含む)の任期は1年間とします。また、その再任の是非を1年ごと
に判断します。監査等委員である取締役の任期は2年間とします。また、その再任の是非を2年ごとに判断しま
す。
5.決定プロセス
取締役の選解任基準や指名の決定プロセスの独立性・客観性・透明性を高めるために、取締役会の諮問機関とし
て、委員長及び委員の過半数を独立社外取締役とする指名・報酬委員会を2018年12月10日に設置しております。ま
た、今後のガバナンスに対する取組をより強化するために、2020年10月28日に指名・報酬・ガバナンス委員会に名
称を変更しております。指名・報酬・ガバナンス委員会は、原則として年4回以上実施することとしており、取締
役の選解任基準やCEOの後継者計画等につき審議し、取締役会に対して助言・提言を行います。
なお、社外からの客観的視点及び指名に関する専門的知見を導入するため、指名・報酬・ガバナンス委員会は、
外部データ、経済環境、業界動向及び経営状況等を勘案し、取締役の選解任基準やCEOの後継者計画等の内容につ
いて、外部のコンサルタント等の助言を受けることができます。
6.エンゲージメント方針
当社の取締役の選解任基準やCEOの後継者計画等の内容については、各種法令等に基づき作成・開示する有価証
券報告書、事業報告、コーポレート・ガバナンス報告書及び当社ウェブサイト等を通じ、当社株主に対し迅速に開
示します。また、機関投資家とのエンゲージメントについても、積極的に実施します。
ヌ.当社のコーポレート・ガバナンス体制
当社の2025年度のコーポレート・ガバナンス体制は以下のとおりになります。
63/152
EDINET提出書類
株式会社ニフコ(E02386)
有価証券報告書
(2)【役員の状況】
① 役員一覧
1.提出日(2026年6月22日)現在の当社の役員の状況は、以下のとおりです。
男性6名女性2名 (役員のうち女性の比率25%)
役職名
氏名
生年月日
略歴
任期
所有株式数
(株)
1985年4月当社入社
2010年4月 Nifco Deutschland GmbH社長
2015年6月当社執行役員Nifco America Corp.社長
2016年6月当社取締役常務執行役員最高マーケ
ティング責任者兼営業本部長
2019年6月当社取締役専務執行役員最高マーケ
代表取締役社長兼
CEO(最高経営責任者)
柴尾
雅春
ティング責任者兼営業本部長兼技術本
1961年12月14日生
部・プラットフォーム事業部管掌
(注)5
74,432
(12,233)
2020年6月当社代表取締役副社長兼営業本部長兼
COO(最高執行責任者)
2021年4月当社代表取締役社長兼COO(最高執行責
任者)
2023年6月当社代表取締役社長兼CEO(最高経営責
任者)(現)
1994年4月当社入社
2015年4月当社技術開発センター先進技術研究開
発部長
2018年1月当社技術開発センター長
2022年4月当社技術本部副本部長
取締役開発本部長兼
CTO(最高技術責任者) 兼
製造本部長兼
2024年4月当社執行役員開発本部長兼CTO(最高技
福尾
道宏
1971年9月24日生
(注)5
術責任者)
2025年4月当社執行役員開発本部長兼CTO(最高技
CPO(最高製造責任者)
9,917
(3,772)
術責任者)兼製造本部長兼CPO(最高製造
責任者)
2025年6月当社取締役開発本部長兼CTO(最高技術
責任者)兼製造本部長兼CPO(最高製造
責任者)(現)
1980年4月 ソニー㈱(現ソニーグループ㈱)入社
1992年9月 ソニーポーランド代表取締役社長
2009年4月 ソニー㈱(現ソニーグループ㈱)ビジ
ネス&プロフェッショナル事業本部企
画マーケティング部門長
2013年4月同社人事本部グローバルダイバーシ
社外取締役
野々垣
好子
ティダイレクター
1957年7月31日生
(注)5
2015年6月㈱ジョリーパスタ社外取締役
2019年6月当社社外取締役(現)
2020年6月㈱ジーエス・ユアサ
コーポレーショ
ン社外取締役(現)
2021年6月 サトーホールディングス㈱(現㈱サ
トー)社外取締役(現)
64/152
400
(−)
EDINET提出書類
株式会社ニフコ(E02386)
有価証券報告書
役職名
氏名
生年月日
略歴
任期
所有株式数
(株)
1985年4月三井物産㈱入社
2010年3月同社プロジェクト業務部長
2015年4月同社執行役員アジア・大洋州副本部長
2019年6月同社代表取締役常務執行役員
2020年4月同社代表取締役専務執行役員CDIO
社外取締役
米谷
佳夫
1962年4月11日生
2022年4月同社代表取締役副社長執行役員CDIO
(注)5
2023年4月同社取締役
400
(−)
2023年6月同社顧問
2024年6月当社社外取締役(現)
2024年9月㈱センシンロボティクス社外取締役(現)
2026年3月㈱ポーラ・オルビスホールディングス
社外取締役(現)
1984年4月飯野海運㈱入社
1988年1月 ヤマハ㈱入社
2009年8月同社経理・財務部長
2013年6月同社執行役員経営企画部長
2015年6月同社取締役上席執行役員業務本部長
社外取締役
山畑
聡
1960年12月3日生
2017年6月同社取締役常務執行役経営本部長兼
(注)5
業務本部長
−
(−)
2024年6月同社常務執行役 コーポレート本部長
2025年4月同社顧問(現)
2025年6月日鉄ソリューションズ㈱社外取締役(現)
2025年6月当社社外取締役(現)
1985年4月当社入社
2007年7月当社経営企画部長
2015年6月当社執行役員経営企画部長
2018年6月当社取締役常務執行役員経営企画部長
兼管理本部・財務本部管掌
取締役
(常勤監査等委員)
2019年6月当社取締役専務執行役員経営企画部長
矢内
俊樹
1961年7月16日生
兼管理本部・財務本部管掌
(注)6
2020年6月当社取締役専務執行役員経営企画部長
41,857
(−)
兼管理本部長兼CSO(最高戦略責任者)
兼CIO(最高情報責任者)兼財務本部管掌
2021年6月当社取締役専務執行役員兼CFO(最高財
務責任者)兼CSO(最高戦略責任者)
2025年6月当社取締役(常勤監査等委員)(現)
1992年10月青山監査法人入所
1996年4月公認会計士登録(現)
1999年10月公認会計士松本会計事務所(現フィン
ポート会計グループ)代表(現)
社外取締役
(監査等委員)
松本
光博
1969年5月7日生
2008年9月㈱鈴木社外監査役(現社外取締役監査
等委員)
(注)6
2,300
(−)
2014年8月㈱放電精密加工研究所社外監査役(社
外取締役監査等委員)
2019年6月当社社外監査役
2021年6月当社社外取締役(監査等委員)(現)
1986年4月名古屋地方検察庁検事
1987年3月弁護士登録(東京弁護士会所属)
2015年1月桜坂法律事務所設立
社外取締役
(監査等委員)
パートナー(現)
2019年8月㈱ウェザーニューズ社外監査役(現社
林
いづみ
外取締役)(現)
1958年8月20日生
2019年10月東京地方裁判所調停員(知財調停)(現)
(注)6
100
(−)
2020年4月国立大学法人一橋大学理事(現)
2020年6月日油㈱社外監査役(現社外取締役)(現)
2023年6月当社社外取締役(監査等委員)(現)
計
65/152
129,406
(16,005)
EDINET提出書類
株式会社ニフコ(E02386)
有価証券報告書
2.2026年6月24日開催予定の定時株主総会の議案(決議事項)として、「監査等委員でない取締役6名選任の
件」を上程しており、当該決議が承認されますと、当社の役員の状況及びその任期は、以下のとおりとなる予定で
す。なお、役員の役職等については、当該定時株主総会の直後に開催が予定される取締役会の決議事項の内容(役
職等)を含めて記載しています。
男性7名女性2名 (役員のうち女性の比率22%)
役職名
氏名
生年月日
略歴
任期
所有株式数
(株)
1985年4月当社入社
2010年4月 Nifco Deutschland GmbH社長
2015年6月当社執行役員Nifco America Corp.社長
2016年6月当社取締役常務執行役員最高マーケ
ティング責任者兼営業本部長
2019年6月当社取締役専務執行役員最高マーケ
代表取締役社長兼
CEO(最高経営責任者)
柴尾
雅春
ティング責任者兼営業本部長兼技術本
1961年12月14日生
部・プラットフォーム事業部管掌
(注)7
74,432
(12,233)
2020年6月当社代表取締役副社長兼営業本部長兼
COO(最高執行責任者)
2021年4月当社代表取締役社長兼COO(最高執行責
任者)
2023年6月当社代表取締役社長兼CEO(最高経営責
任者)(現)
1994年4月当社入社
2015年4月当社技術開発センター先進技術研究開
発部長
2018年1月当社技術開発センター長
2022年4月当社技術本部副本部長
2024年4月当社執行役員開発本部長兼CTO(最高技
取締役開発本部長兼
製造本部長兼
術責任者)
福尾
道宏
1971年9月24日生
2025年4月当社執行役員開発本部長兼CTO(最高技
生産技術本部長
(注)7
術責任者)兼製造本部長兼CPO(最高製造
9,917
(3,772)
責任者)
2025年6月当社取締役開発本部長兼CTO(最高技術
責任者)兼製造本部長兼CPO(最高製造
責任者)(現)
2026年6月当社取締役開発本部長兼製造本部長兼
生産技術本部長(予定)
1993年2月 ニフココリア入社
2016年4月同社執行役員理事蔚山工場長
2018年4月同社執行役員専務製造本部長兼品質
本部長
2024年4月同社副社長&COO
取締役
司空
翰
1967年1月15日生
2025年4月同社代表理事社長&CEO ニフココリア
グループ統括
2025年6月当社執行役員同社代表理事社長&CEO
ニフココリアグループ統括(現)
2026年6月当社取締役同社代表理事社長&CEO
ニフココリアグループ統括(予定)
66/152
(注)7
−
(−)
EDINET提出書類
株式会社ニフコ(E02386)
有価証券報告書
役職名
氏名
生年月日
略歴
任期
所有株式数
(株)
1985年4月三井物産㈱入社
2010年3月同社プロジェクト業務部長
2015年4月同社執行役員アジア・大洋州副本部長
2019年6月同社代表取締役常務執行役員
2020年4月同社代表取締役専務執行役員CDIO
社外取締役
米谷
佳夫
1962年4月11日生
2022年4月同社代表取締役副社長執行役員CDIO
2023年4月同社取締役
(注)7
400
(−)
2023年6月同社顧問
2024年6月当社社外取締役(現)
2024年9月㈱センシンロボティクス社外取締役(現)
2026年3月㈱ポーラ・オルビスホールディングス社
外取締役(現)
1984年4月飯野海運㈱入社
1988年1月 ヤマハ㈱入社
2009年8月同社経理・財務部長
2013年6月同社執行役員経営企画部長
2015年6月同社取締役上席執行役員業務本部長
社外取締役
山畑
聡
1960年12月3日生
2017年6月同社取締役常務執行役経営本部長兼
(注)7
業務本部長
−
(−)
2024年6月同社常務執行役 コーポレート本部長
2025年4月同社顧問(現)
2025年6月日鉄ソリューションズ㈱社外取締役(現)
2025年6月当社社外取締役(現)
1985年4月沖電気工業㈱入社
2017年4月同社執行役員統合営業本部第二営業
本部長
2020年4月同社常務執行役員 コンポーネント&プ
ラットフォーム事業本部 ビジネスコラ
−
ボレーション推進本部長
社外取締役
宮川
由香
1962年10月10日生
2021年4月 OKIクロステック㈱取締役常務執行役員
(注)7
(−)
(注)6
41,857
2022年6月 SBテクノロジー㈱社外取締役
2024年6月 TOPPANホールディングス㈱社外監査役
(現)
2025年6月㈱サンリツ社外取締役(監査等委員)
(現)
2026年6月当社社外取締役(予定)
1985年4月当社入社
2007年7月当社経営企画部長
2015年6月当社執行役員経営企画部長
2018年6月当社取締役常務執行役員経営企画部長
兼管理本部・財務本部管掌
取締役
(常勤監査等委員)
2019年6月当社取締役専務執行役員経営企画部長
矢内
俊樹
1961年7月16日生
兼管理本部・財務本部管掌
2020年6月当社取締役専務執行役員経営企画部長
兼管理本部長兼CSO(最高戦略責任者)
兼CIO(最高情報責任者)兼財務本部管掌
2021年6月当社取締役専務執行役員兼CFO(最高財
務責任者)兼CSO(最高戦略責任者)
2025年6月当社取締役(常勤監査等委員)(現)
67/152
(−)
EDINET提出書類
株式会社ニフコ(E02386)
有価証券報告書
役職名
氏名
生年月日
略歴
任期
所有株式数
(株)
1992年10月青山監査法人入所
1996年4月公認会計士登録(現)
1999年10月公認会計士松本会計事務所(現フィン
ポート会計グループ)代表(現)
社外取締役
(監査等委員)
松本
光博
1969年5月7日生
2008年9月㈱鈴木社外監査役(現社外取締役監査
等委員)
(注)6
2,300
(−)
2014年8月㈱放電精密加工研究所社外監査役(社
外取締役監査等委員)
2019年6月当社社外監査役
2021年6月当社社外取締役(監査等委員)(現)
1986年4月名古屋地方検察庁検事
1987年3月弁護士登録(東京弁護士会所属)
2015年1月桜坂法律事務所設立
社外取締役
(監査等委員)
パートナー(現)
2019年8月㈱ウェザーニューズ社外監査役(現社
林
いづみ
外取締役)(現)
1958年8月20日生
2019年10月東京地方裁判所調停員(知財調停)(現)
(注)6
100
(−)
2020年4月国立大学法人一橋大学理事(現)
2020年6月日油㈱社外監査役(現社外取締役)(現)
2023年6月当社社外取締役(監査等委員)(現)
計
129,006
(16,005)
(注)1.表内「所有株式数」の( )内は、対象者の株式報酬制度に基づく交付予定株式(2026年6月1日現在)であ
ります。
〔株式報酬制度に基づく交付予定株式のご説明〕
当社は、2016年度より、当社の取締役(社外取締役及び国外居住者を除く。以下同じ。)等を対象とする
株式報酬制度(以下「本制度」という。)を導入しております。本制度に基づき候補者に交付される株式に
は、(ア)業績に連動しない「非業績連動部分」、(イ)一定期間経過後の業績に連動する「業績連動部
分」がありますが、各候補者の本制度に基づく交付予定株式の数には、2026年6月1日時点の(ア)「非業
績連動部分」及び(イ)「業績連動部分」で業績が確定し付与されているポイントの合計数を記載していま
す(1ポイントあたり1株の計算)。なお、本制度に基づく交付予定株式にかかる議決権は、当該各候補者
に交付されるまでの間、行使されることはありません。
2.社外取締役野々垣好子、米谷佳夫及び山畑聡は、監査等委員でない社外取締役であります。社外取締役
松本光博及び林いづみは、監査等委員である社外取締役であります。2026年6月24日開催予定の定時株主総
会で、「監査等委員でない取締役6名選任の件」が承認可決された場合は、宮川由香は監査等委員でない社
外取締役となります。
3.社外取締役林いづみの戸籍上の氏名は、坂本いづみであります。
4.執行役員の体制は、提出日(2026年6月22日)現在において13名で構成されており、その構成員はLife
Solutions Company カンパニープレジデント 小泉昌史、グループ戦略室長長岡昌哉、ESG推進室長村
田憲彦、中国5拠点統括兼東莞利富高塑料製品有限公司総経理&CEO 金京俊、経営統括本部長兼 CFO
(最高財務責任者) 兼 CSO(最高戦略責任者) 兼欧州統括 Joan Oliveras、管理本部長佐野久実、北米統
括兼 Nifco America Corporation CEO 兼 Nifco Central Mexico CEO Michael Rodenberg、ASEAN統括兼
Nifco Thailand Co-CEO 横田賢、生産技術本部長坂田一臣、品質保証本部長兼 CQO(最高品質責任
者) 廣瀬明彦、営業本部長杉山保、プラットフォーム事業部長一丸貴秀、Nifco Korea グループ統括
兼 Nifco Korea INC.社長&CEO 司空翰であります。
2026年6月24日以降の体制は、10名で構成され、その構成員はグループ戦略室長長岡昌哉、中国5拠点
統括兼東莞利富高塑料製品有限公司総経理&CEO 金京俊、経営戦略本部長兼 CSO(最高戦略責任者) 兼
欧州統括 Joan Oliveras 、管理本部長兼 ESG 推進室長佐野久実、北米統括兼 Nifco America
Corporation CEO 兼 Nifco Central Mexico CEO Michael Rodenberg、ASEAN統括兼 Nifco Thailand CoCEO 横田賢、営業本部長杉山保、プラットフォーム事業部長一丸貴秀、財務経理本部長兼 CFO(最高
財務責任者) 楢原稔、ファスナー事業部長飴野公也となる予定です。
5.2025年6月24日開催の定時株主総会の終結の時から1年間
6.2025年6月24日開催の定時株主総会の終結の時から2年間
7.2026年6月24日開催の定時株主総会の終結の時から1年間
68/152
EDINET提出書類
株式会社ニフコ(E02386)
有価証券報告書
②
社外役員の状況
当社の提出日(2026年6月22日)現在の社外取締役(監査等委員である取締役を除く。)は3名、監査等委員
である社外取締役は2名であります。2026年6月24日開催予定の定時株主総会で、「監査等委員でない取締役6
名選任の件」が承認可決された場合に就任予定の社外取締役人数も同数となります。
当社と、野々垣好子、米谷佳夫、山畑聡、松本光博、林いづみとの間には、人的関係、資本的関係又は取引関
係その他の利害関係は特にありません。また、2026年6月24日開催予定の定時株主総会で、「監査等委員でない
取締役6名選任の件」が承認可決された場合に社外取締役に就任予定の宮川由香との間には、人的関係、資本的
関係又は取引関係その他の利害関係は特にありません。
2026年6月24日開催予定の定時株主総会で、「監査等委員でない取締役6名選任の件」が承認可決された場合
に就任予定の社外取締役の当社からの独立性に関しては、東京証券取引所の独立性に関する判断基準を参考にし
たうえで、各役員の個別事情を考慮して判断しております。その結果、社外取締役5名全員についてそれぞれ独
立性があると判断し、東京証券取引所にはその旨の独立役員届出書を提出しております。
提出日(2026年6月22日)現在の社外取締役は、取締役会では全員それぞれ一般株主の利益を意識した見解・
判断を示しております。そのように一般株主の利益を意識した見解を示すことのほかに、提出日(2026年6月22
日)現在において社外取締役である野々垣好子が果たすべき機能及び役割は、大手企業の事業部門における業務
経験や海外子会社の経営経験、更に上場他社における社外取締役の経験から、経営全般を監督するための幅広い
識見を有していることから、これらの豊富な経験と見識を活かし、当社のコーポレート・ガバナンスの質を向上
させることにあります。
また、提出日(2026年6月22日)現在及び2026年6月24日開催予定の定時株主総会で、「監査等委員でない取
締役6名選任の件」が承認可決された場合に就任予定の社外取締役である米谷佳夫が果たすべき機能及び役割
は、大手商社における国内外での業務、経営及びインキュベーションの経験から、長期的な視点で当社の経営全
般を監督するための幅広い見識を有していることから、これらの豊富な経験と見識を活かし、当社の持続的な成
長と企業価値の向上に貢献していただくことであります。
また、提出日(2026年6月22日)現在及び2026年6月24日開催予定の定時株主総会で、「監査等委員でない取
締役6名選任の件」が承認可決された場合に就任予定の社外取締役である山畑聡が果たすべき機能及び役割は、
大手企業の経理・財務部門及びコーポレート部門で培われた豊富な経験・見識を有していることから、主に財
務・資本政策やサステナビリティの分野で、当社の持続的な成長と企業価値向上に貢献していただくことであり
ます。
また、2026年6月24日開催予定の定時株主総会で、「監査等委員でない取締役6名選任の件」が承認可決され
た場合に就任予定の社外取締役である宮川由香が果たすべき機能及び役割は、大手企業の事業部門におけるグ
ローバルな業務経験、更に上場他社における社外取締役の経験から、経営全般を監督するための幅広い見識を有
していることから、これらの豊富な経験と見識を活かし、当社の持続的な成長と企業価値向上に貢献していただ
くことであります。
一方、提出日(2026年6月22日)現在において監査等委員である社外取締役の松本光博が果たすべき機能及び
役割は、同氏が公認会計士として培った企業経営を監査する豊富な知識と経験を有していることから、特に会計
に重点を置いた監査を行うことにより、一般株主を意識した見解を示すことにあります。
また、提出日(2026年6月22日)現在において監査等委員である社外取締役の林いづみが果たすべき機能及び
役割は、同氏が弁護士として内外の法律に精通し、様々な社外取締役としての経験を有していることから、特に
コンプライアンスに重点を置いた監査を行うことにより、グローバルな視点での当社のコーポレート・ガバナン
スの質を向上させることにあります。
③
社外取締役による監督又は監査と内部監査、監査等委員会の監査及び会計監査との相互連携並びに内部統制部
門との関係
提出日(2026年6月22日)現在における社外取締役による監督、監査の状況は以下のとおりであります。
社外取締役(監査等委員である取締役を除く。)は、取締役会の審議を通じて取締役を監督するにとどまら
ず、監査等委員である社外取締役との間でそれぞれが有する情報を共有し意見交換するとともに、内部監査部門
への意見聴取、更には必要に応じて会計監査人との連携を図っております。
一方、監査等委員である社外取締役は、取締役会の審議を通じて取締役を監査するだけでなく、取締役会とは
別に各取締役に個別に業務執行状況を聴取し内部監査部門とも定期的な協議を行っております。更に必要に応じ
て、監査等委員である社外取締役は、会計監査人と協議・検討を行い、国内外の子会社の監査部門とも協議・意
見交換を行う機会を設けております。
なお、2026年6月24日開催予定の定時株主総会で、「監査等委員でない取締役6名選任の件」が承認可決され
た場合も、同様に連携を図っていく予定です。
69/152
EDINET提出書類
株式会社ニフコ(E02386)
有価証券報告書
(3)【監査の状況】
①
監査等委員会監査の状況
a.監査等委員会監査の組織、人員及び手続
・監査等委員会は、社内出身の常勤監査等委員である取締役1名と非常勤監査等委員である社外取締役2名の合計
3名で構成しております。
・常勤監査等委員である矢内俊樹は、当社において主に経営企画部門に携わり、経営企画部長として経営戦略の策
定や、CFO(最高財務責任者)として当社の財務戦略・資本政策・IR活動全般を統括するなど、多様な経験、知
識、専門性等を有しております。
・監査等委員である社外取締役松本光博は、公認会計士の資格を有しており、財務及び会計に関する専門的知見
に基づき、財務及び会計に関する幅広い助言・提言を行っております。
・監査等委員である社外取締役林いづみは、弁護士の資格を有しており、法務に関する専門的知見に基づき、法
務・リスクマネジメントに関する幅広い助言・提言を行っております。
・監査等委員会の補助体制としては、内部監査部門のスタッフ3名(有価証券報告書提出日現在)が監査等委員の
職務遂行の補助を行っております。
・監査等委員会は、当社の健全で持続的な成長及び社会的信頼に応える良質な企業統治体制の確立に努めるため、
監査等委員会が定めた監査等委員会監査基準に沿って、監査方針及び監査計画を策定し、業務の分担等に従って
監査活動を行っております。
・常勤監査等委員は、取締役会・経営会議等の重要な会議への出席、経営トップとの経営全般にわたるディスカッ
ション、重要な決裁書類の閲覧、主要な関係会社への監査の実施、リスクマネジメント委員会、サステナビリ
ティ委員会への参加、会計監査人との連携監査、内部監査部門との適宜情報交換会の実施など情報収集に努め、
日常の監査業務を行っております。
・監査等委員である社外取締役につきましては、法務、財務、会計等の各分野における豊富な経験や高い識見に基
づき、取締役会、監査等委員会等において、独立した立場から意見を述べております。また経営トップとの経営
全般にわたるディスカッションや主要な関係会社への監査の実施、会計監査人からの報告聴取、内部監査部門か
ら適宜報告聴取などの監査活動を行っております。
b.監査等委員会の活動状況
(ア)監査等委員会の開催頻度。個々の監査等委員の出席状況
・監査等委員会は原則として月1回を基本としており必要に応じて随時開催しております。
当事業年度は監査等委員会を15回開催しております。個々の監査等委員の出席状況については次のとおりです。
(第74期:2025年4月1日から2026年3月31日まで)
区
分
氏
名
監査等委員会出席状況
常勤監査等委員
矢内
俊樹
全9回中9回(100%)
常勤監査等委員
本多
純二
全6回中6回(100%)
社外監査等委員
松本
光博
全15回中15回(100%)
社外監査等委員
林
いづみ
全15回中15回(100%)
(注)本多純二は2025年6月の株主総会で退任し、矢内俊樹は同日の株主総会で新たに監査等委員に選任されてお
ります。
(イ)監査等委員会の具体的な検討内容
a. 監査等委員会の監査計画決定
b. 取締役(監査等委員除く)の選任等に関する意見形成、監査等委員の選出・報酬に関する内容
c. 事業報告書・監査報告書の内容検討
d. 内部統制の構築・運用状況の確認
e. 第三者割当による自己株式処分の処分価額の妥当性
f. 会計監査人の監査の相当性評価
・監査計画と監査報酬の妥当性並びに品質管理体制
・監査の方法及び監査結果
・監査上の主要な検討事項(KAM)に関する協議
g. サスティナビリティ関連の地球温暖化への取り組みに関する討議
70/152
EDINET提出書類
株式会社ニフコ(E02386)
有価証券報告書
(ウ)常勤監査等委員の活動状況
常勤監査等委員の活動として、監査等委員会にて策定された監査方針・監査計画に基づき、非常勤の監査等委員
とともに監査活動を行っております。主要な活動の内容は次のとおりであります。
・重要な会議(取締役会、経営会議等)への出席及び意見陳述の実施
・重要な書類(各種会議議事録、主要決裁文書等)の閲覧
・会計監査人の監査計画、期中レビュー結果報告、監査結果報告等の聴取の実施
・代表取締役との意見交換(社外監査等委員も含む)の実施
・会計監査人とのミーティング(社外監査等委員も含む)の実施
・内部監査部門(監査部)の内部監査計画、実績等の聴取
・主要関係会社の業務・財産の状況監査(社外監査等委員も含む)の実施並びに取締役会への報告
・各種委員会への参加(コンプライアンス委員会、リスクマネジメント委員会、情報セキュリティ委員会)
・指名・報酬・ガバナンス委員会へのオブザーバーとして参加
・日常的な監査業務の中で重要情報として必要な情報に関しては、社外監査等委員へ報告し情報共有
②
内部監査の状況
当社は、代表取締役直属の組織をして独立性を確保した監査部(監査部長1名、監査部員6名)を設置しておりま
す。監査部門は取締役会で承認された年間の監査計画に従い、当社の業務全般について適正かつ効率的に遂行されて
いるか否かを監査しております。監査部は代表取締役のみならず、取締役会及び監査等委員会にも監査の報告を行い
情報共有、連携を実施するなど監査の実効性を確保しております。
(監査等委員会と会計監査人との連携状況)
監査等委員会は、期末において会計監査人から会計監査及び内部統制監査の手続き及び結果の概要について報告を
受け、意見交換を行うほか期中においても会計監査人の監査計画、監査の状況等の報告を受け、リスク認識や内部統
制等について意見交換を行うなど効率的な会計監査及び内部統制監査の遂行について協議をしております。また監査
上の主要な検討事項(KAM)についても会計監査人と情報共有及び意見交換しております。
(監査等委員会と内部監査部門の連携状況)
常勤監査等委員は、効率的な監査の遂行のため監査部との連携を密に情報交換を行うほか、監査部の月次報告を受
けております。また監査部長は、内部監査の実施状況やリスク認識などについても代表取締役及び監査等委員会に適
宜報告しております。
(内部監査部門と会計監査人との連携状況)
監査部は、会計監査人と監査の実施状況や内部統制の状況及びリスク評価に関し意見交換を行い、緊密な連携をし
ております。
(監査等委員会、内部監査部門及び会計監査人の連携)
毎年、監査等委員会の監査計画、内部監査部の監査計画及び会計監査人の監査計画について情報共有を行い意見交
換を行うなど効率的な監査体制の維持に努めております。
③
会計監査の状況
a.監査法人の名称
有限責任監査法人トーマツ
b.継続監査期間
1年間
c.業務を執行した公認会計士
東海林雅人
伊藤惣悟
d.監査業務に係る補助者の構成
当社の会計監査業務に係る補助者は、公認会計士15名、その他53名であります。
e.監査法人の選定方針と理由
会社法の規定に基づき、会計監査人の再任、不再任に係る決定は、監査等委員会が行っております。「会計監査
人の選解任等に関する運用規則」を定め、毎年、実務手順に沿って再任・不再任の手続きを進め、評価基準に基づ
きその適否を総合的に判断しております。
71/152
EDINET提出書類
株式会社ニフコ(E02386)
有価証券報告書
具体的には、監査等委員会において、会計監査人に対して、独立性・品質管理体制・監査品質・監査体制、コ
ミュニケーション、監査報酬等の観点からインタビューを実施し、評価いたしました。また、監査等委員会による
財務・経理部門や内部監査部門から会計監査人に対する評価、再任に関する意見等の聴取も行いました。
f.監査等委員及び監査等委員会による監査法人の評価
監査等委員会は、会計監査人について、その独立性及び専門性、監査品質、監査活動の状況、監査報酬水準、監
査報告の相当性等を対象項目として評価し、2025年度(第74期)における会計監査人は有限責任監査法人トーマツ
が会計監査人として適切、妥当であると判断しました。
g.監査法人の異動
当社の会計監査人は次のとおり異動しております。
第73期(自2024年4月1日至2025年3月31日)有限責任 あずさ監査法人
第74期(自2025年4月1日
至2026年3月31日)有限責任監査法人トーマツ
なお、臨時報告書(2025年5月8日)に記載した事項は次のとおりです。
(1)当該異動に係る監査公認会計士等の名称
①選任する監査公認会計士等の名称
有限責任監査法人トーマツ
②退任する監査公認会計士等の名称
有限責任 あずさ監査法人
(2)当該異動の年月日
2025年6月24日
(3)退任する監査公認会計士等が監査公認会計士等となった年月日
1985年
(4)退任する監査公認会計士等が直近3年間に作成した監査報告書等における意見等に関する事項
該当事項はありません。
(5)当該異動の決定又は当該異動に至った理由及び経緯
当社の会計監査人である有限責任あずさ監査法人は、2025年6月24日開催予定の第73期定時株主総会終結
の時をもって任期満了となりました。同監査法人については、会計監査が適切かつ妥当に行われることを確
保する体制を十分に備えておりますが、継続監査年数を踏まえ、同会計監査人を含め複数の監査法人を対象
として検討してまいりました結果、新たな会計監査人として、有限責任監査法人トーマツを選任する議案の
内容を決定したものであります。
(6)上記(5)の理由及び経緯に対する意見
①退任する監査公認会計士等の意見
特段の意見はない旨の回答を得ております。
②監査等委員会の意見
監査等委員会の検討経緯と結果に則った内容であり、妥当であると判断しています。
72/152
EDINET提出書類
株式会社ニフコ(E02386)
有価証券報告書
④
監査報酬の内容等
a.監査公認会計士等に対する報酬
前連結会計年度
区分
監査証明業務に基づく
報酬(百万円)
当連結会計年度
非監査業務に基づく
報酬(百万円)
監査証明業務に基づく
報酬(百万円)
非監査業務に基づく
報酬(百万円)
提出会社
99
−
89
−
連結子会社
18
−
18
−
118
−
107
−
計
b.監査公認会計士等と同一のネットワークに対する報酬(a.を除く)
前連結会計年度
区分
監査証明業務に基づく
報酬(百万円)
当連結会計年度
非監査業務に基づく
報酬(百万円)
監査証明業務に基づく
報酬(百万円)
非監査業務に基づく
報酬(百万円)
提出会社
−
8
−
0
連結子会社
159
21
94
63
159
29
94
63
計
前連結会計年度は有限責任あずさ監査法人に対して支払った報酬の内容を記載しており、当社及び当社の連結子会
社が当社監査公認会計士等と同一のネットワークに属しているKPMGに対し支払った非監査業務に基づく報酬の内容
は、主に税務申告書の作成及びアドバイザリー費用であります。
当連結会計年度は有限責任監査法人トーマツに対して支払った報酬の内容を記載しており、当社及び当社の連結子
会社が当社監査公認会計士等と同一のネットワークに属しているDeloitte Touche Tohmatsuに対し支払った非監査業
務に基づく報酬の内容は、主に税務申告書の作成及びアドバイザリー費用であります。
c.その他の重要な監査証明業務に基づく報酬の内容
該当事項はありません。
d.監査報酬の決定方針
監査日数等諸条件を勘案した上で定めております。
e.監査等委員会が会計監査人の報酬等に同意した理由
監査等委員会は、会計監査人の監査計画の内容及び監査時間の見積りの相当性、会計監査の職務遂行状況につい
て検討を実施し、過去の報酬額の推移や同業他社の報酬水準の比較も踏まえ、会社から提示された金額は妥当であ
ると判断し、同意いたしました。
73/152
EDINET提出書類
株式会社ニフコ(E02386)
有価証券報告書
(4)【役員の報酬等】
① 役員の報酬等の額又はその算定方法の決定に係る事項
当社は、2026年5月14日開催の取締役会において、2026年度以降の役員報酬ポリシーにつき決議いたしました。具体
的な内容は以下のとおりです。
〔役員報酬ポリシー〕
1.コーポレート・ガバナンスに関する基本的な考え方
当社は、1967年の創業以来培ってきた「チャレンジ精神」と「創造性」をニフコスピリットの支柱として成長し続
けてきました。これまでの歴史を踏まえ、今後更なる成長ステージへ進む決意を込めて、当社のPurpose /
Mission / Valuesを以下のとおり制定しております。
社員一人ひとりが個々に持つ「My Purpose」を起点に、当社のValues(価値観)を通じて、Mission(使命)を果
たすことで、当社の Purpose(存在意義)の実現を図る、これがニフコグループの企業理念です。今後も、当社は、
ニフコらしさを追求しながら持続的に成長し、お客様、取引先、株主、投資家、地域社会など全てのステークホル
ダーから信頼され続ける企業であり続けることを目指します。
Purpose
(存在意義)
小さな気づきと技術をつなぎ、心地よい生活と持続可能な社会を創造する
Mission
(使命)
クリエイティブカンパニーとして感動を生み出す
Values
(価値観)
変革のためのチャレンジ
継続的なブレイクスルー
自由なコミュニケーション
創造的なコラボレーション
また、今後も引き続き、コンプライアンス遵守を徹底し、適切なリスクマネジメントを実践することによって、激
変する社会経済環境に柔軟かつ適正に対応していくことが必要であり、会社経営の基本方針をグローバルに徹底し実
践していくことも重要であると考えます。
当社は、上記の基本的な考え方に基づいてコーポレート・ガバナンスの充実を経営の優先課題と位置付け、グルー
プ経営の強化を図っていきます。
2.役員報酬の基本方針
当社の取締役及び執行役員の報酬(以下「役員報酬」という)は、コーポレート・ガバナンスの基本的な考え方を
もとに、以下を基本方針とします。
(1)「小さな気づきと技術をつなぎ、心地よい生活と持続可能な社会を創造する」という当社のPurpose実現に資
するものであること
(2)独立性・客観性・透明性の高い報酬制度とし、従業員、お客様、株主等のステークホルダーに対する説明責任
を果たし得る内容であること
(3)当社の従業員が魅力的であると感じるような役員報酬制度であること
3.報酬水準
役員報酬の水準は、当社の経営環境及び外部のデータベース等による同業他社や同規模の主要企業を定期的に調
査・分析した上で、上記の役員報酬の基本方針に基づき決定しています。
74/152
EDINET提出書類
株式会社ニフコ(E02386)
有価証券報告書
4.報酬構成
(1)報酬構成比率
代表取締役社長CEOの報酬構成比率は、基本報酬45%、賞与21%、株式報酬34%です。賞与及び株式報酬の比
率が総報酬に占める割合の過半数を占める設計としています。
独立社外取締役の報酬は、これまで「基本報酬」のみとしておりましたが、株主の皆様との一層の価値共有を
進めることを目的として、2026年度より、監査等委員でない社外取締役について、固定型(非業績連動型)の
「株式報酬」を付加いたします。監査等委員でない社外取締役の報酬構成は、「基本報酬」及び「株式報酬」で
す。なお、監査等委員である取締役の報酬は、引き続き「基本報酬」のみといたします。
(2)各報酬項目の概要
①基本報酬
職責の大きさに応じて役位ごとに金額を決定し、優秀な人材を確保するための役割に応じた報酬として、月額
固定報酬として支給します。
②賞与(年次インセンティブ)
単年度の会社業績向上に対するインセンティブとして、当社グループの連結業績に対するインセンティブ付与
を目的として支給します。稼ぐ力を強化するため連結売上高、連結営業利益を評価指標とし、執行取締役及び
執行役員については定性評価も採り入れております。支給額は、基準額に対して原則 0%〜200%の範囲で変動
します。
各指標の評価割合は、以下のとおりです。
指標
社長CEO
執行取締役
執行役員
連結売上高
25%
20%
15%
連結営業利益
75%
60%
55%
定性評価
0%
20%
30%
※目標値は、各事業年度の年初に取締役会決議を経て公表する連結財務指標を使用します。
※海外執行役員の評価には、担当する地域の業績も含みます。
各指標の目標値と連動係数は、以下のとおりです。
目標値
連動係数
連結売上高
各事業年度の年初に取締役会決議を経て公表する連結財務指標
0〜2.0の範囲で変動
連結営業利益
同上
0〜2.0の範囲で変動
各役員の管掌領域により個別に設定し、指名・報酬・ガバナン
ス委員会にて目標及び評価については諮問の上、決定
0〜2.0の範囲で変動
定性評価
③株式報酬(中長期インセンティブ) ※執行取締役・執行役員
中長期的な業績向上と企業価値向上への貢献意欲度を一層高めること及び株主の皆様との一層の価値共有を進
めることを目的として、当社株式を交付します。株式報酬のうち、50%は業績連動部分、50%は非業績連動部分
により構成されます。
「株式報酬」は、2024年度より、信託の仕組みを利用して、退任時までを譲渡制限期間とする「譲渡制限付き株
式」を付与する方式(「RS信託制度」)を採用しており、これまで以上に株主の皆様との価値共有ができる制度
といたしました。なお、中期経営計画につきましては、2026年度より、中長期的な目標に対するコミットをより
強化する固定型3カ年計画に切り替わります。これを踏まえ、株式報酬の業績連動部分の業績評価時期も、各3
カ年計画終了時点に変更いたします。
④株式報酬 ※監査等委員でない独立社外取締役
株主の皆様との一層の価値共有を進めることを目的として、2026年度より、監査等委員でない社外取締役につ
いて、「株式報酬」を付加いたします。この株式報酬は、信託の仕組みを利用し、退任時までを譲渡制限期間と
する「譲渡制限付き株式」を付与する方式(「RS信託制度」)を採用、全額を非業績連動とします。
執行取締役・執行役員株式報酬(中長期インセンティブ)算定式
[毎年6月1日に付与されるポイント]
(評価対象事業年度が中期経営計画の最終年度の場合)
下記 a.により決定される固定ポイント+下記 b.により決定される業績連動ポイント
(評価対象事業年度が中期経営計画の最終年度でない場合)
下記 a.により決定される固定ポイント
75/152
EDINET提出書類
株式会社ニフコ(E02386)
有価証券報告書
a.固定ポイント(非業績連動部分)
固定ポイント※1=株式報酬基準額※2×50%÷本信託内の会社株式の平均取得単価※3
b.業績連動ポイント(業績連動部分)
業績基礎ポイント※1=株式報酬基準額※2×50%÷本信託内の会社株式の平均取得単価※3
業績連動ポイント※1=業績基礎ポイントの累積値×業績連動係数※4
※1
※2
1ポイント未満を切り上げるものとする。
株式報酬基準額は、下表のとおりとする。
なお、各制度対象者の役位は基準日の属する年の3月31日時点の役位に基づくものとし、兼務の場合は
上位の役位ポイントを適用するものとする。
役位
株式報酬基準額(円)
社長CEO
41,500,000
取締役
14,000,000 ※5
※3
信託内の会社株式の平均取得単価は、信託契約の変更及び追加信託を行うことにより、本信託の信託期
間を延長した場合には、延長後に本信託が取得した会社株式の平均取得単価とする。なお、平均取得単
価は3,354円とし、小数点第1位を四捨五入したものとする。
※4
業績連動係数は、別表1-2に定めるものとする。なお、中計期間の途中など業績連動係数算定前に別表3
に定める株式交付条件に該当する場合は、業績連動係数は算定せず、業績基礎ポイントの累積値に相当
する会社株式またはその売却代金を交付または給付するものとする。
※5
独立社外取締役を委員長とし、独立社外取締役が過半を構成する指名・報酬・ガバナンス委員会にて、
役割に応じて期初に設定され、取締役会で決議されるものとする。
(別表1-2)業績連動係数
業績連動係数=係数(営業利益率3年累計)×40%+係数(ROEもしくはROIC)×30%+係数(TSR)×20%+
係数(従業員エンゲージメント)×10%
業績連動係数は、それぞれ以下のとおりとする。
いずれの係数についても、小数点以下第5位を切り捨てとする。
・係数(営業利益率 3年累計)
中長期経営計画における目標達成率に応じて、以下のとおり定める。
目標達成率
係数(営業利益3年累計)
目標達成率<50%
0.0
50%≦目標達成率<100%
目標達成率と同値とする
100%≦目標達成率
1.00+1.5×(目標達成率-1.0)※
※上限は2.0とする
・係数(ROE/ROIC)
1.00+0.15×(中長期経営計画最終年度における実績値%−中長期経営計画当初の目標値(パーセントポイ
ント差))
(上限:2.0、下限:0.0)
※社長CEO、取締役(社外取締役を除く)、コーポレート系執行役員についてはROE、事業系執行役員について
はROICを指標とする
・係数(TSR)
TOPIXとの比較結果に応じて、以下のとおり定める。
対TOPIX比※1
係数(TSR)
対TOPIX比<50%
0.0
76/152
EDINET提出書類
株式会社ニフコ(E02386)
有価証券報告書
50%≦対TOPIX比<100%
(対TOPIX比-0.5)×2.0
100%≦対TOPIX比
1.00+2.5×(対TOPIX比-1.0)※2
※1
TSRの対TOPIX(配当込み)比は、中計開始年度の前営業日(3月末日)終値と中計終了年度最終日(3月
末日)終値との比較で実施し、TOPIXのTSRについては配当込みの指数を使用する
(例)2026年度〜2028年度の中計期間の場合、2026年3月末日及び2029年3月末日TSRにて判定
※2
上限は2.0とする
・係数(従業員エンゲージメント)
中長期経営計画における実績値-目標値の結果に応じて、以下のとおり定める。
実績値-目標値
係数(従業員エンゲージメント)
実績値-目標値<-5pts
0.0
-5pts ≦実績値-目標値<0pts
1.00+0.1×(実績値pts-目標値pts)
0pts≦実績値-目標値
1.00+0.15×(実績値pts-目標値pts)
※1
隔年で実施されるグローバル従業員エンゲージメントサーベイの 「持続可能なエンゲージメント指数」
を使用する
※2 上限は2.0とする
2028年度の目標値は、以下のとおりです。
2028年度
目標値
売上高
4,000億円
営業利益
580億円
営業利益率
14.5%
当期純利益
400億円
ROE
13.0%
従業員エンゲージメント
+3%pt(2025年比)
1ドル=153円
為替前提
(別表2)
1ポイントあたり1株とする。
ただし、会社株式について株式分割・株式併合等が生じた場合には、会社株式の分割比率・併合比率等に応じ
て、1ポイントの会社株式数を調整する。
77/152
EDINET提出書類
株式会社ニフコ(E02386)
有価証券報告書
(別表3)
本制度の株式交付条件は、以下のいずれかに該当する場合とする。
① 固定ポイントが付与された場合または業績基礎ポイントが業績連動ポイントに転換された場合かつ以下
②〜⑤に該当しない場合
② 制度対象者が取締役等を退任し、当会社を退社することが見込まれる場合
③ 制度対象者が海外居住者となることで、制度対象者ではなくなる場合
④ 制度対象者が在任中に死亡した場合
⑤ 本制度を廃止する場合
但し、①の場合は当該固定ポイントまたは当該業績連動ポイントについてのみ株式交付条件を満たし、②
乃至⑤の場合は、制度対象者の有する全てのポイントについて株式交付条件を満たすものとする。
(3)報酬の没収等(クローバック・マルス)
重大な会計上の誤りや不正による決算の事後修正が取締役会において決議された場合、または在任期間中に取
締役会が重大な不適切行為があったと判断した場合には、取締役会が、指名・報酬・ガバナンス委員会の審議を
経て、賞与及び株式報酬の支給を制限または返還を請求することがあります。
5.自社株保有ガイドライン
取締役及び執行役員を対象に、株主の皆様の視点に立った業績向上や株価上昇の意識をさらに高めるため、自社株
保有の促進を図るものとします。
6.決定プロセス
役員報酬制度の内容の独立性・客観性・透明性を高めるために、取締役会の諮問機関として、委員長及び委員の過
半数を独立社外取締役とする指名・報酬委員会を2018年12月10日に設置しております。また、今後のガバナンスに対
する取組をより強化するために、2020年10月28日に指名・報酬・ガバナンス委員会に名称を変更しております。指
名・報酬・ガバナンス委員会は、原則として年4回以上実施することとしており、個人別の報酬額や定性評価につい
ても審議し、取締役会に対して助言・提言を行っています。取締役の個人別の報酬額については、指名・報酬・ガバ
ナンス委員会の答申を受けて、取締役会で決議しております。
なお、社外からの客観的視点及び指名に関する専門的知見を導入するため、指名・報酬・ガバナンス委員会は、外
部データ、経済環境、業界動向及び経営状況等を勘案し、報酬水準
報酬制度等について、外部のコンサルタント等の助言を受けております。当事業年度の取締役会及び指名・報酬・ガ
バナンス委員会の活動状況は、「4コーポレート・ガバナンスの状況等(1)コーポレート・ガバナンスの概要 ③
企業統治に関するその他の事項 リ.指名・報酬・ガバナンス委員会の概要及び活動状況」をご参照ください。
7.エンゲージメント方針
当社の役員報酬制度の内容については、各種法令等に基づき作成・開示する有価証券報告書、事業報告、コーポ
レート・ガバナンス報告書及び当社ウェブサイト等を通じ、当社株主に対し迅速に開示します。また、機関投資家と
のエンゲージメントについても、積極的に実施します。
78/152
EDINET提出書類
株式会社ニフコ(E02386)
有価証券報告書
② 役員区分ごとの報酬等の総額、報酬等の種類別の総額及び対象となる役員の員数
役
員
区
分
報酬等の総額
(百万円)
報酬等の種類別の総額(百万円)
固定報酬
業績連動報酬
退職慰労金
左記のうち、
非金銭報酬等
対象となる
役員の員数
(人)
取締役(監査等委員及
び社外取締役を除く)
198
77
121
−
79
3
取締役(監査等委員)
(社外取締役を除く)
43
35
8
−
−
2
70
70
−
−
−
6
311
182
129
−
79
11
社
外
役
員
合
計
(注)1.当事業年度末時点における在籍人員は、取締役8名(うち社外取締役は5名)、監査等委員3名(うち社外
取締役監査等委員は2名)であります。
2.監査等委員でない取締役の報酬限度額は、2021年6月24日開催の第69回定時株主総会において年額460百万
円以内(うち社外取締役60百万円以内)と決議いただいております。当該株主総会終結時点の監査等委員で
ない取締役の員数は、6名(うち、社外取締役は3名)です。また、金銭報酬とは別枠で、2024年6月20日
開催の第72回定時株主総会において、取締役及び執行役員(社外取締役及び海外居住者を除く。)に対する
信託を用いた業績連動型株式報酬制度について、その限度額は1事業年度あたり400百万円以内で決議いた
だいており、同株主総会終結直後の当該制度の対象となる取締役は2名、執行役員は10名です。
3.監査等委員である取締役の報酬限度額は、2021年6月24日開催の第69回定時株主総会において年額90百万円
以内と決議いただいております。当該株主総会終了時点の監査等委員である取締役の員数は、3名です。
4.業績連動報酬等にかかる業績指標は連結売上高、連結営業利益であり、その実績は「第2事業の状況4.経
営者による財政状態、経営成績及びキャッシュ・フローの状況の分析」のとおりであります。また当該指標
を選択した理由は本業の稼ぐ力を強化するという観点からであります。詳細は当社ホームページの 2026 年
度「役員指名ポリシー及び役員報酬ポリシーに関するお知らせ」をご参照ください。
(https://www.nifco.com/csr/governance/pdf/2026NominationPolicies.pdf)
③ 連結報酬等の総額が1億円以上である者の連結報酬等の総額
氏名
柴尾
雅春
報酬等の種類別の総額(百万円)
連結報酬等
の総額
(百万円)
役員区
分
会社区分
113
取締役
提出会社
固定報酬
50
79/152
業績連動報酬
退職慰労金
左記のうち、
非金銭報酬等
63
−
39
EDINET提出書類
株式会社ニフコ(E02386)
有価証券報告書
(5)【株式の保有状況】
①
投資株式の区分の基準及び考え方
当社は、原則として保有目的が純投資目的である投資株式を保有いたしません。
純投資目的以外の目的である投資株式の区分については、取引関係の維持・強化や新規分野開発及び企業提携を深
めるなど当社の企業価値向上につながると判断される場合のみ保有します。
②
保有目的が純投資目的以外の目的である投資株式
a.保有方針及び保有の合理性を検証する方法並びに個別銘柄の保有の適否に関する取締役会等における検証の内容
当社は、前項のとおり取引関係の維持・強化や新規分野開発及び企業提携を深めるなど当社の企業価値向上につ
ながると判断される場合のみ保有します。
当社は、「コーポレートガバナンスに関する基本方針」に基づき、取締役会において保有するリターンとリスク
を勘案し、保有の適否を検証し保有に合理性のない株式について売却を進めております。2015年3月末時点で、22
銘柄61億円を保有しておりましたが、その縮減の結果、2026年3月末時点で保有している政策保有株式はありませ
ん。
b.銘柄数及び貸借対照表計上額
銘柄数
(銘柄)
貸借対照表計上額の
合計額(百万円)
非上場株式
13
262
非上場株式以外の株式
(当事業年度において株式数が増加した銘柄)
該当事項はありません。
(当事業年度において株式数が減少した銘柄)
銘柄数
(銘柄)
株式数の減少に係る売却
価額の合計額(百万円)
非上場株式
1
24
非上場株式以外の株式
1
0
80/152
EDINET提出書類
株式会社ニフコ(E02386)
有価証券報告書
c.特定投資株式及びみなし保有株式の銘柄ごとの株式数、貸借対照表計上額等に関する情報
特定投資株式
銘柄
当事業年度
前事業年度
株式数(千株)
株式数(千株)
貸借対照表計上額
(百万円)
貸借対照表計上額
(百万円)
0
0
本田技研工業株式会社
保有目的、業務提携等の概要、
定量的な保有効果
及び株式数が増加した理由
当社の株式の
保有の有無
無
なお、みなし保有株式については、該当はありません。また、定量的な保有効果については記載が困難であります。
「-」は、当該銘柄を保有していないことを示しています。
d.保有目的が純投資目的である投資株式の前事業年度及び当事業年度における貸借対照表計上額の合計額並びに
当事業年度における受取配当金、売却損益及び評価損益の合計額
該当事項はありません。
81/152
EDINET提出書類
株式会社ニフコ(E02386)
有価証券報告書
5【従業員の状況等】
(1)【人材戦略に関する基本方針等】
人的資本につきまして、当社は、ニフコグループのパーパス及び中長期計画を実現するための重要な経営資
源と考えており、当社中期経営計画 "NIFCO GLOCAL STRATEGY"の長期ビジョンに基づき、「"アイデア"を"カタ
チ"にする」人材の創出を当社及びグループ会社の人材戦略の目標としております。
「"アイデア"を"カタチ"にする」人材を創出するためには、「多様な人材が持つ能力を最大限に開発し発揮
させる、エンゲージメントの高い職場」が必要となりますので、当社グループの企業理念を浸透させた組織・
人材の土台の上に、「人材育成」「DE&I」「従業員エンゲージメント」の3つを重要な柱とし、それぞれにお
いて活動計画を策定し実行しております。企業理念を浸透させるための取組及び「人材育成」「DE&I」「従業
員エンゲージメント」の3つの柱それぞれの取組の詳細については、「第2 事業の状況 2 サステナビリ
ティに関する考え方及び取組 (3)人的資本に関する取組」を参照ください。
なお従業員報酬の決定方針は、日本及び各国における市場の報酬水準を定期的に精査し、個々の役割の大き
さに応じて市場競争力のある水準となるよう定めています。
(2)【従業員の状況】
① 連結会社の状況
2026年3月31日現在
セグメントの名称
従業員数(人)
7,754 (2,938)
合成樹脂成形品事業
ベッド及び家具事業
961
(280)
全社(共通)
171
(−)
8,886 (3,218)
合計
(注)1.従業員数は就業人員(当社グループからグループ外への出向者を除き、グループ外から当社グループへの出
向者を含むほか、常用パートを含んでおります。)であり、臨時雇用者数(パートタイマー、人材派遣会社
からの派遣社員、アルバイトを含み、常用パートは除いております。)は(
)内に年間の平均人数を外数
で記載しております。
なお、上記のほか関連会社等へ出向している従業員が14名おります。
2.全社(共通)として、記載されている従業員数は、管理部門に所属しているものであります。
② 提出会社の状況
2026年3月31日現在
従業員数(人)
1,412
平均年令(才)
42.5
(365)
平均勤続年数(年) 平均年間給与(円)
16.5
セグメントの名称
平均年間給与の
対前事業年度増減率
(%)
7,463,337
5.2
従業員数(人)
合成樹脂成形品事業
1,241
(365)
ベッド及び家具事業
−
(−)
全社(共通)
171
(−)
1,412
(365)
合計
(注)1.従業員数は就業人員(当社から社外への出向者を除き、社外から当社への出向者を含むほか、常用パートを
含んでおります。)であり、臨時雇用者数(パートタイマー、人材派遣会社からの派遣社員、アルバイトを
含み、常用パートは除いております。)は(
)内に年間の平均人数を外数で記載しております。
なお、上記のほか関連会社等へ出向している従業員が14名おります。
2.平均年間給与は、賞与及び基準外賃金を含んでおります。
3.全社(共通)として、記載されている従業員数は、管理部門に所属しているものであります。
③ 労働組合の状況
82/152
EDINET提出書類
株式会社ニフコ(E02386)
有価証券報告書
労働組合は結成されておりません。
④ 管理的地位にある労働者に占める女性労働者の割合、男性労働者の育児休業取得率及び労働者の男女の賃金の
額
の差異
(a)提出会社
当事業年度
管理的地位に
ある労働者に 男性労働者の
占める女性労育児休業取得
働者の割合
率(%)
(%)
(注)2.
(注)1.
5.7
70.6
労働者の男女の賃金の額の差異(%)
(注)3.
全労働者
正規雇用労働
者
パート・有期
労働者
65.7
45.4
58.9
補足説明
(注)4.
(注)1.管理的地位にある労働者に占める女性労働者の割合(%)は、「女性の職業生活における活躍の推進に関
する法律」(平成27年法律第64号)の規定に基づき算出したものであります。
但し、管理的地位にある労働者の定義は、弊社基準の算出として管理職級の専門職を含んでおります。ま
た、2024年4月に導入した新人事制度により、管理職への登用準備が完了している準管理職層を除く実績値
へ変更しております。
2.男性労働者の育児休業取得率(%)は、「育児休業、介護休業等育児又は家族介護を行う労働者の福祉に
関する法律」(平成3年法律第76号)の規定に基づき、「育児休業、介護休業等育児又は家族介護を行う
労働者の福祉に関する法律施行規則」(平成3年労働省令第25号)第71条の6第1号における育児休業等
の取得割合を算出したものであります。
3.労働者の男女の賃金の額の差異は、「女性の職業生活における活躍の推進に関する法律」(平成27年法律
第64号)の規定に基づき算出したものであります。(厚労省基準)
管理職比率などに差異があることで1名当たり賃金に男女差がありますが、制度(人事体系、報酬、評
価、人材育成)において性別による処遇差はありません。
4.年収格差の基準は厚労省基準とし、支援社員無期フルタイムは正規雇用に含んでおります。
<労働者の男女の賃金の額の差異についての補足説明>
株式会社ニフコにおける労働者の男女の賃金の額の差異(全労働者の58.9%、正規雇用労働者の65.7%)
については、正規雇用労働者には支援社員無期フルタイムが、有期・パートには嘱託定年再雇用者(割合
として男性が多い)が含まれており、これが影響しているため、以下に支援社員無期フルタイムを除いた
正規社員の一般職(非管理職)の男女基本給月額の差異について記載します。当社は等級Gradeごとに賃金
水準を設定しており、同一等級の基本給は下表のとおり男女ほぼ同等であります。
一般職
女性平均基本給/
男性平均基本給
G05
99.5%
G04
96.8%
G03
100.7
%
G02
101.0
%
G01
97.3%
※一般社員には5つの等級(G01〜G05)があります。
83/152
EDINET提出書類
株式会社ニフコ(E02386)
有価証券報告書
(b)国内グループ会社
当事業年度
管理的地位にあ
る労働者に占め
る女性労働者の
割合(%)
(注)1.
男性労働者の育
児休業取得率
(%)
(注)2.
㈱ニフコ山形
0.0
㈱ニフコ熊本
シモンズ㈱
名称
労働者の男女の賃金の額の差異(%)
(注)3.
補足説明
全労働者
うち正規雇
用労働者
うち
パート・有
期労働者
100.0
46.4
79.4
62.8
(注)4.
0.0
90.0
44.1
74.1
59.9
(注)4.
7.8
33.3
79.9
79.8
38.5
(注)4.
(注)1.管理的地位にある労働者に占める女性労働者の割合(%)は、「女性の職業生活における活躍の推進に関
する法律」(平成27年法律第64号)の規定に基づき算出したものであります。
2.男性労働者の育児休業取得率(%)は、「育児休業、介護休業等育児又は家族介護を行う労働者の福祉に
関する法律」(平成3年法律第76号)の規定に基づき、「育児休業、介護休業等育児又は家族介護を行う
労働者の福祉に関する法律施行規則」(平成3年労働省令第25号)第71条の6第1号における育児休業等
の取得割合を算出したものであります。
3.労働者の男女の賃金の額の差異は、「女性の職業生活における活躍の推進に関する法律」(平成27年法律
第64号)の規定に基づき算出したものであります。(厚労省基準)
4.年収格差の基準は厚労省基準とし、支援社員無期フルタイムは正規雇用に含んでおります。
⑤ 従業員及び役員持株会制度
当社は、従業員の経営参画意識醸成や資産形成意欲を高めることを目的に、1979年より従業員持株会制度を導入
しております。2011年からは対象を国内グループ会社の従業員まで拡大して運用しております。
各社の奨励金率と加入資格者に対する加入者率は下表のとおりです。
2026年3月31日現在
奨励金率
加入資格者に対する
加入者率
㈱ニフコ
15%
88.4%
㈱ニフコ山形
10%
85.2%
㈱ニフコ熊本
10%
89.5%
㈱ニフコ北関東
10%
71.4%
シモンズ㈱
15%
96.5%
また、当社は、中長期的な業績向上と企業価値向上に対する役員の貢献意欲を高め、株主との一層の価値共有を
進めることを目的として、1991年より役員持株会制度を導入しております。2011年からは、対象を国内グループ会
社の役員まで拡大して運用しております。
2025年度(2025年4月〜2026年3月)の従業員及び役員持株会での取得株式は、243,160株です。
なお、当社は2022年から2025年まで従業員持株会員に対し、特別奨励金スキームによる株式付与を4回実施いた
しました。上記の取得株式数は本スキームによる2025年の付与株式数 98,250 株を含みます。
⑥ 使用人その他の従業員のみを対象とした役員・従業員株式所有制度の内容
当社は、使用人その他の従業員のみを対象とした役員・従業員株式所有制度を導入しております。当該役員・従
業員株式所有制度の内容については、「1 株式等の状況(8)役員・従業員株式所有制度の内容」に記載してお
ります。
84/152
EDINET提出書類
株式会社ニフコ(E02386)
有価証券報告書
第5【経理の状況】
1.連結財務諸表及び財務諸表の作成方法について
(1)当社の連結財務諸表は、「連結財務諸表の用語、様式及び作成方法に関する規則」(1976年大蔵省令第28号)に
基づいて作成しております。
(2)当社の財務諸表は、「財務諸表等の用語、様式及び作成方法に関する規則」(1963年大蔵省令第59号。以下「財
務諸表等規則」という。)に基づいて作成しております。
また、当社は、特例財務諸表提出会社に該当し、財務諸表等規則第127条の規定により財務諸表を作成しており
ます。
2.監査証明について
当社は金融商品取引法第193条の2第1項の規定に基づき、連結会計年度(2025年4月1日から2026年3月31日
まで)の連結財務諸表及び事業年度(2025年4月1日から2026年3月31日まで)の財務諸表について、有限責任監
査法人トーマツにより監査を受けております。
3.連結財務諸表等の適正性を確保するための特段の取組について
当社は、連結財務諸表等の適正性を確保するための特段の取組を行っております。具体的には、会計基準等の内
容を適切に把握し、会計基準等の変更等について的確に対応することができる体制を整備するため、公益財団法人
財務会計基準機構へ加入し、適正な情報を入手しております。
当社グループは、連結財務諸表の企業間の比較可能性を考慮し、日本基準を採用しておりますが、将来のIFRS適
用に備えての体制の整備、会計処理方針やその適用時期について検討を進めております。
85/152
EDINET提出書類
株式会社ニフコ(E02386)
有価証券報告書
1【連結財務諸表等】
(1)【連結財務諸表】
①【連結貸借対照表】
(単位:百万円)
前連結会計年度
(2025年3月31日)
資産の部
流動資産
現金及び預金
受取手形
電子記録債権
売掛金
契約資産
有価証券
商品及び製品
仕掛品
原材料及び貯蔵品
その他
貸倒引当金
流動資産合計
固定資産
有形固定資産
建物及び構築物
減価償却累計額
建物及び構築物(純額)
機械装置及び運搬具
減価償却累計額
機械装置及び運搬具(純額)
工具、器具及び備品
減価償却累計額
工具、器具及び備品(純額)
金型
減価償却累計額
金型(純額)
土地
リース資産
減価償却累計額
リース資産(純額)
建設仮勘定
その他
有形固定資産合計
無形固定資産
投資その他の資産
投資有価証券
繰延税金資産
退職給付に係る資産
その他
貸倒引当金
投資その他の資産合計
固定資産合計
資産合計
146,232
1,129
6,807
52,214
477
1,349
26,204
2,983
10,039
12,405
△279
259,565
86/152
当連結会計年度
(2026年3月31日)
148,622
1,458
6,806
51,750
482
1,343
28,011
3,444
11,276
13,138
△283
266,051
80,447
92,399
※1 △35,278
※1 △39,893
45,169
80,835
※1 △62,707
52,505
87,087
※1 △66,309
18,128
28,267
※1 △24,406
20,777
28,754
※1 △24,395
3,860
89,700
※1 △85,231
4,358
89,851
※1 △85,348
4,468
20,808
93
※1 △55
4,503
22,130
118
※1 △71
38
11,766
3,445
107,685
2,194
47
6,484
4,694
115,503
2,024
※2 684
※2 426
3,332
3,470
2,883
△0
10,370
120,250
379,816
2,099
3,992
3,491
△0
10,011
127,538
393,590
EDINET提出書類
株式会社ニフコ(E02386)
有価証券報告書
(単位:百万円)
前連結会計年度
(2025年3月31日)
負債の部
流動負債
支払手形及び買掛金
1年内償還予定の社債
短期借入金
1年内返済予定の長期借入金
未払金
未払法人税等
契約負債
賞与引当金
その他
流動負債合計
固定負債
社債
長期借入金
繰延税金負債
退職給付に係る負債
その他
固定負債合計
負債合計
純資産の部
株主資本
資本金
資本剰余金
利益剰余金
自己株式
株主資本合計
その他の包括利益累計額
その他有価証券評価差額金
繰延ヘッジ損益
為替換算調整勘定
退職給付に係る調整累計額
その他の包括利益累計額合計
非支配株主持分
純資産合計
負債純資産合計
87/152
当連結会計年度
(2026年3月31日)
26,284
10,000
199
60
6,053
3,439
5,035
3,531
12,620
67,223
21,926
−
−
60
6,469
6,560
5,704
3,766
12,634
57,122
25,000
225
3,669
1,760
3,211
33,867
101,090
25,000
165
6,202
1,767
3,761
36,895
94,018
7,290
−
253,466
△18,588
242,168
7,290
−
279,460
△27,888
258,861
6
△7
32,886
△85
32,799
3,757
278,725
379,816
62
−
36,874
658
37,595
3,115
299,571
393,590
EDINET提出書類
株式会社ニフコ(E02386)
有価証券報告書
②【連結損益及び包括利益計算書】
(単位:百万円)
前連結会計年度
(自 2024年4月1日
至 2025年3月31日)
売上高
売上原価
売上総利益
販売費及び一般管理費
荷造運搬費
広告宣伝費
報酬及び給料手当
従業員賞与
賞与引当金繰入額
退職給付費用
その他の人件費
賃借料
旅費及び交通費
減価償却費
研究開発費
その他
販売費及び一般管理費合計
営業利益
営業外収益
受取利息
投資有価証券評価益
為替差益
その他
営業外収益合計
営業外費用
支払利息
過年度関税等
事業構造改善費用
その他
営業外費用合計
経常利益
88/152
当連結会計年度
(自 2025年4月1日
至 2026年3月31日)
353,038
352,650
※1 245,838
※1 245,155
107,200
107,494
10,127
1,696
15,681
2,793
1,633
1,020
5,643
2,209
1,192
3,012
※1 2,008
10,981
58,000
49,200
10,520
1,801
15,877
2,645
1,732
1,166
5,401
2,321
1,209
2,963
※1 2,133
11,643
59,416
48,078
1,900
116
745
879
3,642
1,521
−
1,834
683
4,039
262
103
92
237
695
52,147
276
−
98
466
842
51,275
EDINET提出書類
株式会社ニフコ(E02386)
有価証券報告書
(単位:百万円)
前連結会計年度
(自 2024年4月1日
至 2025年3月31日)
特別利益
固定資産売却益
投資有価証券売却益
受取保険金
※2 26
※2 1,196
※3 1,729
−
−
−
1,196
※4 878
※5 498
事業譲渡損失引当金戻入益
特別利益合計
特別損失
減損損失
固定資産除売却損
投資有価証券評価損
投資有価証券売却損
和解金
3,133
為替換算調整勘定取崩損
特別損失合計
税金等調整前当期純利益
法人税、住民税及び事業税
法人税等調整額
法人税等合計
当期純利益
(内訳)
親会社株主に帰属する当期純利益
非支配株主に帰属する当期純利益
その他の包括利益
その他有価証券評価差額金
繰延ヘッジ損益
為替換算調整勘定
退職給付に係る調整額
その他の包括利益合計
包括利益
(内訳)
親会社株主に係る包括利益
非支配株主に係る包括利益
89/152
当連結会計年度
(自 2025年4月1日
至 2026年3月31日)
−
※7 159
※8 10
※6 857
−
※10 621
※11 164
※9 23
※7 234
−
955
54,324
11,834
△3,318
8,516
45,808
−
−
1,115
51,356
13,542
2,642
16,184
35,171
44,767
1,040
34,079
1,091
△2,022
14
10,167
231
※12 8,391
56
7
4,060
752
※12 4,877
54,199
40,048
52,861
1,338
38,875
1,172
EDINET提出書類
株式会社ニフコ(E02386)
有価証券報告書
③【連結株主資本等変動計算書】
前連結会計年度(自 2024年4月1日
至
2025年3月31日)
(単位:百万円)
株主資本
資本金
当期首残高
資本剰余金
利益剰余金
7,290
−
自己株式
215,302
株主資本合計
△3,608
218,983
当期変動額
剰余金の配当
△6,598
△6,598
親会社株主に帰属する当期
純利益
44,767
44,767
6
6
土地再評価差額金の取崩
自己株式の取得
自己株式の処分
△16,632
△16,632
1,652
1,641
△10
自己株式の消却
−
利益剰余金から資本剰余金
への振替
10
△10
−
連結子会社株式の取得によ
る持分の増減
−
株主資本以外の項目の当期
変動額(純額)
−
当期変動額合計
当期末残高
−
−
38,164
△14,979
23,184
7,290
−
253,466
△18,588
242,168
その他の包括利益累計額
当期首残高
その他有価
証券評価差
額金
繰延ヘッジ
損益
土地再評価
差額金
2,028
△21
6
その他の包
為替換算調退職給付に係
括利益累計
整勘定
る調整累計額
額合計
23,019
△320
24,712
非支配株主
持分
純資産合計
3,356
247,052
当期変動額
剰余金の配当
△6,598
親会社株主に帰属する当期
純利益
44,767
土地再評価差額金の取崩
△6
△6
−
自己株式の取得
△16,632
自己株式の処分
1,641
自己株式の消却
−
利益剰余金から資本剰余金
への振替
−
連結子会社株式の取得によ
る持分の増減
−
株主資本以外の項目の当期
変動額(純額)
当期変動額合計
当期末残高
△2,022
14
−
9,866
234
8,093
401
8,494
△2,022
14
△6
9,866
234
8,087
401
31,673
6
△7
−
32,886
△85
32,799
3,757
278,725
90/152
EDINET提出書類
株式会社ニフコ(E02386)
有価証券報告書
当連結会計年度(自
2025年4月1日
至
2026年3月31日)
(単位:百万円)
株主資本
資本金
当期首残高
資本剰余金
利益剰余金
7,290
−
自己株式
253,466
株主資本合計
△18,588
242,168
当期変動額
剰余金の配当
△7,614
△7,614
親会社株主に帰属する当期
純利益
34,079
34,079
土地再評価差額金の取崩
−
自己株式の取得
△9,999
△9,999
自己株式の処分
△27
619
592
自己株式の消却
△79
79
−
利益剰余金から資本剰余金
への振替
471
連結子会社株式の取得によ
る持分の増減
△364
△471
−
△364
株主資本以外の項目の当期
変動額(純額)
−
当期変動額合計
当期末残高
−
−
25,993
△9,300
16,692
7,290
−
279,460
△27,888
258,861
その他の包括利益累計額
当期首残高
その他有価
証券評価差
額金
繰延ヘッジ
損益
土地再評価
差額金
6
△7
−
その他の包
為替換算調退職給付に係
括利益累計
整勘定
る調整累計額
額合計
32,886
△85
32,799
非支配株主
持分
純資産合計
3,757
278,725
当期変動額
剰余金の配当
△7,614
親会社株主に帰属する当期
純利益
34,079
土地再評価差額金の取崩
−
自己株式の取得
△9,999
自己株式の処分
592
自己株式の消却
−
利益剰余金から資本剰余金
への振替
−
連結子会社株式の取得によ
る持分の増減
△364
株主資本以外の項目の当期
変動額(純額)
56
7
−
3,988
744
4,795
△642
4,153
当期変動額合計
56
7
−
3,988
744
4,795
△642
20,846
当期末残高
62
−
−
36,874
658
37,595
3,115
299,571
91/152
EDINET提出書類
株式会社ニフコ(E02386)
有価証券報告書
④【連結キャッシュ・フロー計算書】
(単位:百万円)
前連結会計年度
(自 2024年4月1日
至 2025年3月31日)
営業活動によるキャッシュ・フロー
税金等調整前当期純利益
減損損失
減価償却費
受取保険金
和解金
貸倒引当金の増減額(△は減少)
賞与引当金の増減額(△は減少)
退職給付に係る負債の増減額(△は減少)
退職給付に係る資産の増減額(△は増加)
事業譲渡損失引当金の増減額(△は減少)
受取利息及び受取配当金
支払利息
為替差損益(△は益)
固定資産除売却損益(△は益)
投資有価証券売却損益(△は益)
投資有価証券評価損益(△は益)
為替換算調整勘定取崩損
売上債権の増減額(△は増加)
棚卸資産の増減額(△は増加)
その他の資産の増減額(△は増加)
仕入債務の増減額(△は減少)
未払又は未収消費税等の増減額
その他の負債の増減額(△は減少)
その他
小計
利息及び配当金の受取額
利息の支払額
保険金の受取額
法人税等の支払額又は還付額(△は支払)
営業活動によるキャッシュ・フロー
投資活動によるキャッシュ・フロー
定期預金の預入による支出
定期預金の払戻による収入
有価証券の取得による支出
有価証券の売却及び償還による収入
固定資産の取得による支出
固定資産の売却による収入
投資有価証券の取得による支出
投資有価証券の売却による収入
連結の範囲の変更を伴う子会社株式の売却による
支出
その他
投資活動によるキャッシュ・フロー
92/152
当連結会計年度
(自 2025年4月1日
至 2026年3月31日)
54,324
−
13,007
△878
621
△21
562
189
△654
△498
△2,014
262
49
133
△1,729
△106
164
6,569
△1,999
784
△117
△2,300
△176
757
66,927
2,060
△271
878
△15,376
54,217
51,356
857
12,567
−
−
△1
199
1,071
△532
−
△1,524
276
△2,119
△961
23
−
−
1,152
△3,042
△43
△4,991
553
492
741
56,077
1,501
△273
−
△10,142
47,163
△13,403
15,748
−
0
△18,185
76
△159
3,239
△14,380
12,859
△91
−
△19,019
2,341
△2
291
※2 △11,128
−
△78
△23,891
△129
△18,130
EDINET提出書類
株式会社ニフコ(E02386)
有価証券報告書
(単位:百万円)
前連結会計年度
(自 2024年4月1日
至 2025年3月31日)
財務活動によるキャッシュ・フロー
短期借入金の返済による支出
リース債務の返済による支出
長期借入金の返済による支出
社債の償還による支出
連結の範囲の変更を伴わない子会社株式の取得に
よる支出
自己株式の売却による収入
自己株式の取得による支出
子会社の自己株式の取得による支出
配当金の支払額
非支配株主への配当金の支払額
財務活動によるキャッシュ・フロー
現金及び現金同等物に係る換算差額
現金及び現金同等物の増減額(△は減少)
現金及び現金同等物の期首残高
現金及び現金同等物の期末残高
93/152
当連結会計年度
(自 2025年4月1日
至 2026年3月31日)
△281
△1,841
△10,075
−
△197
△1,851
△60
△10,000
−
△400
1,026
△16,632
−
△6,597
△754
△35,154
3,902
△926
142,024
※1 141,097
367
△9,999
△363
△7,611
△1,239
△31,355
2,885
562
141,097
※1 141,659
EDINET提出書類
株式会社ニフコ(E02386)
有価証券報告書
【注記事項】
(連結財務諸表作成のための基本となる重要な事項)
1.連結の範囲に関する事項
(1) 連結子会社の数 46社
主要な連結子会社名は「第1 企業の概況 4 関係会社の状況」に記載しているため、記載を省略して
おります。
(2) 非連結子会社の名称及び連結の範囲から除いた理由
Breezeway Capital Inc.
非連結子会社は小規模であり、総資産、売上高、当期純損益(持分に見合う額)及び利益剰余金(持分に
見合う額)等は、いずれも連結財務諸表に及ぼす影響が軽微であり、かつ、全体としても重要性がないた
め、連結の範囲から除外しております。
2.持分法の適用に関する事項
持分法を適用していない非連結子会社(Breezeway Capital Inc.)は、当期純損益(持分に見合う額)及
び利益剰余金(持分に見合う額)等からみて、持分法の対象から除いても連結財務諸表に及ぼす影響が軽微
であり、かつ、全体としても重要性がないため持分法の適用範囲から除外しております。
3.連結子会社の事業年度等に関する事項
決算日が連結決算日(3月31日)と異なる子会社は次のとおりであります。
12月31日が決算日の会社
Nifco America Corporation
Nifco Korea USA Inc.
Nifco U.K. Ltd.
Nifco Poland Sp.z o.o.
上海利富高塑料制品有限公司
東莞利富高塑料制品有限公司
台扣利富高塑胶制品(東莞)有限公司
北京利富高塑料制品有限公司
Nifco (HK) Ltd.
台湾扣具工業股份有限公司
Nifco Korea Inc.
Nifco (Thailand) Co.,Ltd.
Union Nifco Co., Ltd.
Nifco Manufacturing (Malaysia) Sdn. Bhd.
Nifco Vietnam Ltd.
Simmons Bedding & Furniture (HK) Ltd.
その他24社
連結財務諸表の作成に当たっては、同決算日現在の財務諸表を使用しております。ただし、2026年1月1
日から連結決算日2026年3月31日までの期間に発生した重要な取引については、連結上必要な調整を行って
おります。
94/152
EDINET提出書類
株式会社ニフコ(E02386)
有価証券報告書
4.会計方針に関する事項
(1) 重要な資産の評価基準及び評価方法
①
有価証券
イ.満期保有目的の債券
償却原価法(定額法)によっております。
ロ.その他有価証券
市場価格のない株式等以外のもの
時価法(評価差額は全部純資産直入法により処理し、売却原価は主として移動平均法により算定)に
よっております。
市場価格のない株式等
主として移動平均法による原価法によっております。
② デリバティブ
時価法によっております。
③ 棚卸資産
商品・製品・仕掛品・原材料及び貯蔵品
主として総平均法による原価法(貸借対照表価額については収益性の低下に基づく簿価切下げの方
法)によっております。
(2) 重要な減価償却資産の減価償却の方法
①
有形固定資産(リース資産を除く)
当社及び国内の子会社については定額法で、海外子会社については主として定額法を採用しております。
なお、主な耐用年数は次のとおりであります。
建物及び構築物
2〜50年
機械装置及び運搬具
2〜20年
工具、器具及び備品
1〜20年
金型
1〜11年
②
無形固定資産(リース資産を除く)
経済的耐用年数に基づいて償却しております。
なお、自社利用のソフトウエアについては、社内における利用可能期間(5年)に基づく定額法によ
り償却を行っております。
③ リース資産
リース期間を耐用年数とし、残存価額を零とする定額法を採用しております。
(3) 重要な引当金の計上基準
①
貸倒引当金
売上債権、貸付金等の貸倒損失に備えるため、一般債権については貸倒実績率により、貸倒懸念債権等
特定の債権については個別に回収可能性を勘案し、回収不能見込額を計上しております。
② 賞与引当金
当社及び一部の連結子会社については、従業員に対して支給する賞与の支出に充てるため、支給見込額
に基づき計上しております。
95/152
EDINET提出書類
株式会社ニフコ(E02386)
有価証券報告書
(4) 退職給付に係る会計処理の方法
退職給付債務の算定に当たり、退職給付見込額を当連結会計年度末までの期間に帰属させる方法につい
ては、主に給付算定式基準によっております。
過去勤務費用は、その発生時の従業員の平均残存勤務期間以内の一定の年数による定額法により、発生
連結会計年度から費用処理しておりますが、一部の連結子会社については、発生年度に即時費用処理して
おります。
数理計算上の差異は、各連結会計年度の発生時における従業員の平均残存勤務期間以内の一定の年数
(10年)による定額法により、発生連結会計年度から費用処理しておりますが、一部の連結子会社につい
ては、発生年度に即時償却、又は、翌連結会計年度から5年から10年の定額法で費用処理しております。
未認識数理計算上の差異及び未認識過去勤務費用については、税効果を調整の上、純資産の部における
その他の包括利益累計額の退職給付に係る調整累計額に計上しております。
なお、一部の連結子会社は、退職給付に係る負債及び退職給付費用の計算に、退職給付に係る期末自己
都合要支給額等を退職給付債務とする方法を用いた簡便法を採用しております。
(5) 重要な収益及び費用の計上基準
当社および連結子会社の顧客との契約から生じる収益に関する主要な事業における主な履行義務の内容
及び当該履行義務を充足する通常の時点(収益を認識する通常の時点)は以下のとおりであります。
①合成樹脂成形品事業
合成樹脂成形品事業においては、主に工業用プラスチック・ファスナー及びプラスチック精密成形部品
等の製造及び販売を行っており、自動車や家電業界で用いられる部品を顧客に提供しております。
これらの製品の販売については顧客との販売契約に基づき、顧客に製品を納入することを履行義務とし
て識別しており、原則として製品の引渡時点において顧客が当該製品に対する支配を獲得し、履行義務が
一時点で充足されると判断していることから、製品の引渡し時点で収益を認識しております。取引価格が
配分された履行義務は、独立して販売しております。
取引価格の算定については、顧客との契約において約束された対価から値引き額等を控除した金額で収
益を認識しております。
これらの約束した対価の額に重要な金融要素は含まれていないため調整しておりません。履行義務に対
する対価は、顧客に履行義務を充足する時点と顧客の支払条件により概ね1年以内に受領しております。
なお、買戻し契約に該当する有償支給取引については、金融取引として有償支給先に残存する支給品に
ついて棚卸資産を認識するとともに、有償支給先に残存する支給品の期末棚卸高相当額について「その他
流動負債」を認識しております。
②ベッド及び家具事業
ベッド及び家具事業においては、ベッドの製造・販売及び寝装品・家具の仕入・販売を行っており、量
販店・専門店・百貨店やホテル等に供給しています。
これらの製品・商品の販売については顧客との販売契約に基づき、顧客に製品・商品を納入することを
履行義務として識別しており、原則として製品・商品の引渡時点において顧客が当該製品・商品に対する
支配を獲得し、履行義務が一時点で充足されると判断していることから、製品・商品の引渡し時点で収益
を認識しております。取引価格の履行義務は、通常、それぞれを独立して販売しております。
取引価格の算定については、一部の顧客との契約において約束された対価から販売促進費等を控除した
金額で収益を認識しております。
これらの約束した対価の額に重要な金融要素は含まれていないため調整しておりません。履行義務に対
する対価は、顧客に履行義務を充足する時点と顧客の支払条件により概ね1年以内に受領しております。
なお、一部の有償支給取引については、金融取引として、有償支給先に残存する支給品について棚卸資
産を引き続き認識するとともに有償支給先に残存する支給品の期末棚卸高相当額について「その他流動負
債」を認識しております。
(6) 重要な外貨建の資産又は負債の本邦通貨への換算の基準
外貨建金銭債権債務は、決算日の直物為替相場により円貨に換算し、換算差額は損益として処理してお
ります。なお、在外子会社等の資産及び負債は決算日の直物為替相場、収益及び費用は期中平均相場によ
り円貨に換算し、換算差額は非支配株主持分及び純資産の部における為替換算調整勘定に含めて計上して
おります。
(7) 重要なヘッジ会計の方法
①
ヘッジ会計の方法
繰延ヘッジ処理を採用しております。また、為替変動リスクのヘッジについて振当処理の要件を充た
している場合には振当処理を、金利スワップについて特例処理の条件を充たしている場合には、特例処
理を採用しております。
② ヘッジ手段とヘッジ対象
当連結会計年度にヘッジ会計を適用したヘッジ手段とヘッジ対象は以下のとおりであります。
ヘッジ手段・・・通貨スワップ、金利スワップ
ヘッジ対象・・・貸付金
96/152
EDINET提出書類
株式会社ニフコ(E02386)
有価証券報告書
③
ヘッジ方針
当社は、主に内規である「デリバティブ取引取扱規程」に基づき、為替変動リスク、金利変動リスク
をヘッジしております。なお、連結子会社は国内子会社・関連会社運営権限規程及び海外子会社・関連
会社運営権限規程に従い、当社の承認を得て行っております。
④ ヘッジ有効性評価の方法
「金融商品会計に関する実務指針」(日本公認会計士協会)の規定に基づき、有効性の評価を行ってお
ります。
ただし、ヘッジ会計処理として金融商品会計基準等に定める特例処理又は振当処理を行う取引につい
ては、ヘッジ有効性の評価は省略しております。
(8) 連結キャッシュ・フロー計算書における資金の範囲
手許現金、随時引き出し可能な預金及び容易に換金可能であり、かつ、価値の変動について僅少なリス
クしか負わない取得日から3か月以内に償還期限の到来する短期投資からなっております。
(重要な会計上の見積り)
該当事項はありません。
97/152
EDINET提出書類
株式会社ニフコ(E02386)
有価証券報告書
(会計方針の変更)
該当事項はありません。
(未適用の会計基準等)
・「リースに関する会計基準」(企業会計基準第34号 2024年9月13日企業会計基準委員会)
・「リースに関する会計基準の適用指針」(企業会計基準適用指針第33号 2024年9月13日企業会計基準委
員会) 等
(1)概要
企業会計基準委員会において、日本基準を国際的に整合性のあるものとする取組みの一環として、借手の全
てのリースについて資産及び負債を認識するリースに関する会計基準の開発に向けて、国際的な会計基準を踏
まえた検討が行われ、基本的な方針として、IFRS第16号の単一の会計処理モデルを基礎とするものの、IFRS第
16号の全ての定めを採り入れるのではなく、主要な定めのみを採り入れることにより、簡素で利便性が高く、
かつ、IFRS第16号の定めを個別財務諸表に用いても、基本的に修正が不要となることを目指したリース会計基
準等が公表されました。
借手の会計処理として、借手のリースの費用配分の方法については、IFRS第16号と同様に、リースがファイ
ナンス・リースであるか、オペレーティング・リースであるかにかかわらず、全てのリースについて使用権資
産に係る減価償却費及びリース負債に係る利息相当額を計上する単一の会計処理モデルが適用されます。
(2)適用予定日
2028年3月期の期首から適用します。
(3)当該会計基準等の適用による影響
「リースに関する会計基準」等の適用による連結財務諸表に与える影響額については、現時点で評価中であ
ります。
(表示方法の変更)
該当事項はありません。
(追加情報)
(役員向け株式報酬制度)
当社は、取締役等を対象に、当社の中長期的な業績向上と企業価値増大への貢献意欲を高めることを目的と
して、2016年8月22日に株式報酬制度(以下「本制度」という。)を導入いたしました。本制度の対象期間が
2019年8月31日までであることから、2019年5月20日開催の取締役会において、本制度の継続及び一部改定に
ついて2019年6月21日開催の第67回定時株主総会に付議することを決議し、同株主総会において承認可決され
ました。
当社は、監査等委員会設置会社へ移行することに伴い、2021年5月20日開催の取締役会において、当時の取
締役および執行役員に対する本制度に係る報酬枠を廃止し、監査等委員でない取締役および執行役員(社外取
締役および海外居住者を除く。)に対して、本制度に基づく報酬枠を改めて設定することに加え、本制度を一
部改定の上、継続することについて2021年6月24日開催の第69回定時株主総会に付議することを決議し、同株
主総会において承認可決されました。
当社は、株式報酬について、2016年度より、信託の仕組みを利用して、各対象者の在任中にポイントを付与
し退任時に保有ポイント数に相当する当社株式を交付する方式を採用していましたが、2024年5月17日開催の
取締役会において、これを2024年度より、信託の仕組みを利用して、在任中に各対象者に付与されたポイント
数に相当する譲渡制限付き株式を交付する方式に変更することについて2024年6月20日開催の第72回定時株主
総会に付議することを決議し、同株主総会において承認可決されました。
(1)取引の概要
本制度では、役員報酬BIP(Board Incentive Plan)信託(以下「BIP信託」という。)と称される仕組みを
採用します。BIP信託とは、米国の業績連動型株式報酬(Performance Share)制度および譲渡制限付株式報酬
(Restricted Stock)制度を参考にした役員に対するインセンティブ・プランであります。2024年度に実施さ
れた本制度の一部改定前におきましては、BIP信託が取得した当社株式および当社株式の換価処分金相当額の
金銭を役位や業績目標の達成度等に応じて、原則として取締役等の退任時に交付および給付するものであり、
98/152
EDINET提出書類
株式会社ニフコ(E02386)
有価証券報告書
本制度の改定後におきましては、BIP信託が取得した当社株式を役位や業績目標の達成度等に応じて、原則と
して取締役等の在任中に交付し、取締役等の退任時まで譲渡制限を付けるものであります。
なお、信託内にある当社株式については、経営への中立性を確保するため、信託期間中、議決権を行使しな
いものとしております。
(2)信託に残存する自社の株式
信託に残存する自社株式を、信託における帳簿価額(付随費用の金額を除く。)により、純資産の部に自己
株式として計上しております。当該自己株式の帳簿価額及び株式数は、前連結会計年度1,020百万円、304,393
株であり、当連結会計年度846百万円、252,401株であります。
99/152
EDINET提出書類
株式会社ニフコ(E02386)
有価証券報告書
(従業員向け株式報酬制度)
当社は、従業員を対象に、当社の中長期的な業績向上と企業価値増大への貢献意欲を高めることを目的とし
て、2018年8月27日に株式報酬制度(以下「本制度」という。)を導入いたしました。
(1)取引の概要
本制度では、株式付与ESOP(Employee Stock Ownership Plan)信託(以下、「ESOP信託」とい
う。)と称される仕組みを採用しております。ESOP信託とは、米国のESOP制度を参考にした従業員イン
センティブ・プランであり、ESOP信託が取得した当社株式を、予め定める株式交付規程に基づき、一定の要
件を充足する幹部従業員及び業績貢献度の高い従業員に交付するものです。
なお、当該信託が取得する当社株式の取得資金は全額当社が拠出するため、従業員の負担はありません。
ESOP信託の導入により、従業員は当社株式の株価上昇による経済的な利益を収受することができるため、
株価を意識した従業員の業務遂行を促すとともに、従業員の勤労意欲を高める効果が期待できます。また、ES
OP信託の信託財産に属する当社株式に係る議決権行使は、受益者候補である従業員の意思が反映される仕組み
であり、従業員の経営参画を促す企業価値向上プランとして有効です。
(2)信託に残存する自社の株式
信託に残存する自社株式を、信託における帳簿価額(付随費用の金額を除く。)により、純資産の部に自己
株式として計上しております。当該自己株式の帳簿価額及び株式数は、前連結会計年度161百万円、49,739株
であり、当連結会計年度の該当事項はありません。
※1
(連結貸借対照表関係)
有形固定資産の減価償却累計額には、減損損失累計額を含めて表示しております。
※2
関連会社に対するものは、次のとおりであります。
前連結会計年度
(2025年3月31日)
投資有価証券(株式)
54百万円
100/152
当連結会計年度
(2026年3月31日)
54百万円
EDINET提出書類
株式会社ニフコ(E02386)
有価証券報告書
※1
(連結損益及び包括利益計算書関係)
当期製造費用及び一般管理費に含まれる研究開発費は次のとおりであります。
前連結会計年度
2024年4月1日
2025年3月31日)
(自
至
当連結会計年度
2025年4月1日
2026年3月31日)
(自
至
当期製造費用
2,407百万円
2,285百万円
一般管理費
2,008
2,133
合計
4,415
4,419
※2
固定資産売却益
前連結会計年度(自
2024年4月1日
至
2025年3月31日)
主なものは、建物及び構築物の売却によるものであります。
当連結会計年度(自
2025年4月1日
至
2026年3月31日)
主なものは、土地・建物及び構築物の売却によるものであります。
※3
投資有価証券売却益
前連結会計年度(自
2024年4月1日
至
2025年3月31日)
政策保有株式の保有方針に基づいて売却したものであります。
当連結会計年度(自
2025年4月1日
至
2026年3月31日)
至
2025年3月31日)
該当事項はありません。
※4
受取保険金
前連結会計年度(自
2024年4月1日
2014年9月に海外連結子会社であるNifco Korea Poland Sp.z o.o.において発生した火災事故に係る保険金の
受領額であります。
当連結会計年度(自
2025年4月1日
至
2026年3月31日)
至
2025年3月31日)
該当事項はありません。
※5
事業譲渡損失引当金戻入益
前連結会計年度(自 2024年4月1日
連結子会社であったNifco Germany GmbH、及びNifco KTW America Corporation等の事業譲渡が2024年4月15
日をもって完了しました。
譲渡に伴う関連費用として見積計上した事業譲渡損失引当金について、当該費用が確定したことにより、見込
額との差額を事業譲渡損失引当金戻入益として計上したものであります。
当連結会計年度(自
2025年4月1日
至
2026年3月31日)
該当事項はありません。
101/152
EDINET提出書類
株式会社ニフコ(E02386)
有価証券報告書
※6
減損損失
前連結会計年度(自
2024年4月1日
至
2025年3月31日)
至
2026年3月31日)
該当事項はありません。
当連結会計年度(自
2025年4月1日
当社グループは以下の資産及び資産グループについて減損損失を計上しました。
場所
用途
種類
減損損失額
株式会社ニフコ
神奈川県横須賀市
事業用資産
建物及び構築物
497百万円
株式会社ニフコ
広島県広島市
事業用資産
建物及び構築物
360百万円
神奈川県横須賀市の一部の事業用資産は、当社取締役会での移転決議に伴い帳簿価額を回収可能価額まで減額
し、当該減少額を減損損失として計上しております。
なお、回収可能価額は正味売却価額により測定しており、第三者による査定価格により算定しております。
広島県広島市の事業用資産は、広島営業所の移転に伴い旧広島営業所の事業用資産を売却予定であることか
ら、当該資産について帳簿価額を回収可能価額まで減額し、当該減少額を減損損失として計上しております。
なお、回収可能価額は正味売却価額により測定しており、第三者による査定価格により算定しております。
※7
固定資産除売却損
前連結会計年度(自
2024年4月1日
至
2025年3月31日)
主なものは、建物及び構築物、金型等の処分によるものであります。
当連結会計年度(自
2025年4月1日
至
2026年3月31日)
主なものは、建物及び構築物、金型等の処分によるものであります。
※8
投資有価証券評価損
前連結会計年度(自
2024年4月1日
至
2025年3月31日)
当社が保有する投資有価証券の一部について、取得価額に比べて評価が著しく下落したため、減損処理による
投資有価証券評価損10百万円を計上しております。
当連結会計年度(自
2025年4月1日
至
2026年3月31日)
至
2025年3月31日)
至
2026年3月31日)
該当事項はありません。
※9
投資有価証券売却損
前連結会計年度(自
2024年4月1日
該当事項はありません。
当連結会計年度(自
2025年4月1日
政策保有株式の保有方針に基づいて売却したものであります。
※10
和解金
前連結会計年度(自
2024年4月1日
至
2025年3月31日)
前連結会計期間において係争中であった訴訟案件について、2025年2月26日に原告との間で和解が成立し損失
額が確定したことから和解金として計上したものであります。
当連結会計年度(自
2025年4月1日
至
2026年3月31日)
該当事項はありません。
102/152
EDINET提出書類
株式会社ニフコ(E02386)
有価証券報告書
※11
為替換算調整勘定取崩損
前連結会計年度(自 2024年4月1日至 2025年3月31日)
連結子会社であったメキシコ現地法人の清算結了に伴い、為替換算調整勘定を取り崩したことによるものであ
ります。
当連結会計年度(自 2025年4月1日
該当事項はありません。
※12
至
2026年3月31日)
その他の包括利益に係る組替調整額並びに法人税等及び税効果額
前連結会計年度
(自 2024年4月1日
至 2025年3月31日)
当連結会計年度
2025年4月1日
2026年3月31日)
(自
至
その他有価証券評価差額金:
当期発生額
△1,181百万円
80百万円
組替調整額
△1,729
△0
法人税等及び税効果額
△2,911
889
80
△24
その他有価証券評価差額金
△2,022
56
法人税等及び税効果調整前
繰延ヘッジ損益:
当期発生額
72百万円
組替調整額
81百万円
△54
△74
法人税等及び税効果額
18
△4
7
−
繰延ヘッジ損益
14
7
12,571百万円
△2,402
4,933百万円
−
10,169
4,933
△2
△872
10,167
4,060
法人税等及び税効果調整前
為替換算調整勘定:
当期発生額
組替調整額
法人税等及び税効果調整前
法人税等及び税効果額
為替換算調整勘定
退職給付に係る調整額:
当期発生額
151百万円
985百万円
組替調整額
214
111
法人税等及び税効果額
366
△134
1,097
△344
退職給付に係る調整額
231
752
8,391
4,877
法人税等及び税効果調整前
その他の包括利益合計
103/152
EDINET提出書類
株式会社ニフコ(E02386)
有価証券報告書
(連結株主資本等変動計算書関係)
前連結会計年度(自2024年4月1日至2025年3月31日)
1.発行済株式の種類及び総数並びに自己株式の種類及び株式数に関する事項
当連結会計年度期
首株式数(株)
当連結会計年度増
加株式数(株)
当連結会計年度減
少株式数(株)
当連結会計年度末
株式数(株)
普通株式(注)1
100,257,053
−
−
100,257,053
合計
100,257,053
−
−
100,257,053
普通株式(注)1,2,3,4
1,031,017
4,515,570
487,737
5,058,850
合計
1,031,017
4,515,570
487,737
5,058,850
発行済株式
自己株式
(注)1.当連結会計年度期首の株式数には、役員報酬BIP信託口が保有する当社株式377,810株、株式付与ESOP
信託口が保有する当社株式49,739株を含めて記載しております。
2.普通株式の自己株式数の増加4,515,570株は、取締役会決議に基づく自己株式の市場買付取引による増加
4,346,700株、役員報酬BIP信託口による当社株式の取得による増加168,500株、単元未満株式の買取によ
る増加370株であります。
3.普通株式の自己株式数の減少487,737株は、取締役会決議に基づく従業員持株会に対する自己株式の処分
77,320株、役員報酬BIP信託口への当社株式の譲渡による減少168,500株、役員報酬BIP信託口からの株
式給付による減少241,917株であります。
4.当連結会計年度末の株式数には、役員報酬BIP信託口が保有する当社株式304,393株及び株式付与ESOP
信託口が保有する当社株式49,739株を含めて記載しております。
2.配当に関する事項
(1) 配当金支払額
(決議)
2024年6月20日
定時株主総会
株式の種類
配当金の総額
(百万円)
1株当たり配当
額(円)
3,188
32
普通株式
基準日
効力発生日
2024年3月31日
2024年6月21日
2024年10月31日
普通株式
3,410
35
2024年9月30日
2024年11月25日
取締役会
(注)1.2024年6月20日定時株主総会決議の配当金の総額には、役員報酬BIP信託口に対する配当金の金額12百万
円、株式付与ESOP信託口に対する配当金1百万円を含めております。
2.2024年10月31日取締役会決議の配当金の総額には、役員報酬BIP信託口に対する配当金の金額4百万円、
株式付与ESOP信託口に対する配当金の金額1百万円を含めております。
(2) 基準日が当連結会計年度に属する配当のうち、配当の効力発生日が翌連結会計年度となるもの
(決議)
2025年6月24日
定時株主総会
株式の種類
普通株式
配当金の総額
(百万円)
配当の原資
3,822
利益剰余金
1株当たり配
当額(円)
40
基準日
効力発生日
2025年3月31日
2025年6月25日
(注)配当金の総額には、役員報酬BIP信託口に対する配当金の金額12百万円、株式付与ESOP信託口に対する配
当金の金額1百万円を含めております。
104/152
EDINET提出書類
株式会社ニフコ(E02386)
有価証券報告書
当連結会計年度(自2025年4月1日至2026年3月31日)
1.発行済株式の種類及び総数並びに自己株式の種類及び株式数に関する事項
当連結会計年度期
首株式数(株)
当連結会計年度増
加株式数(株)
当連結会計年度減
少株式数(株)
当連結会計年度末
株式数(株)
100,257,053
−
24,439
100,232,614
合計
100,257,053
−
24,439
100,232,614
普通株式(注)1,3,4,5
5,058,850
2,248,056
199,981
7,106,925
合計
5,058,850
2,248,056
199,981
7,106,925
発行済株式
普通株式(注)1,2
自己株式
(注)1.当連結会計年度期首の株式数には、役員報酬BIP信託口が保有する当社株式304,393株、株式付与ESOP
信託口が保有する当社株式49,739株を含めて記載しております。
2.普通株式の発行済株式数の減少24,439株は、株式付与ESOP信託口の終了に伴い、同信託から無償取得し
た当社株式を消却したことによる減少であります。
3.普通株式の自己株式数の増加2,248,056株は、取締役会決議に基づく自己株式の市場買付取引による増加
2,247,900株、単元未満株式の買取による増加156株であります。
4.普通株式の自己株式数の減少199,981株は、取締役会決議に基づく従業員持株会に対する自己株式の処分
98,250株、取締役会決議に基づく株式付与ESOP信託口の自己株式の消却による減少24,439株、株式付与
ESOP信託口からの株式給付による減少25,300株、役員報酬BIP信託口からの株式給付による減少
51,992株であります。
5.当連結会計年度末の株式数には、役員報酬BIP信託口が保有する当社株式252,401株を含めて記載しており
ます。なお、2025年12月をもって、株式付与ESOP信託口は終了しております。
2.配当に関する事項
(1) 配当金支払額
(決議)
2025年6月24日
定時株主総会
株式の種類
配当金の総額
(百万円)
1株当たり配当
額(円)
3,822
40
普通株式
基準日
効力発生日
2025年3月31日
2025年6月25日
2025年10月31日
普通株式
3,792
40
2025年9月30日
2025年11月28日
取締役会
(注)1.2025年6月24日定時株主総会決議の配当金の総額には、役員報酬BIP信託口に対する配当金の金額12百万
円、株式付与ESOP信託口に対する配当金1百万円を含めております。
2.2025年10月31日取締役会決議の配当金の総額には、役員報酬BIP信託口に対する配当金の金額10百万円、
株式付与ESOP信託口に対する配当金の金額1百万円を含めております。
(2) 基準日が当連結会計年度に属する配当のうち、配当の効力発生日が翌連結会計年度となるもの
2026年6月24日開催の定時株主総会の議案として、次のとおり付議する予定です。
(決議)
2026年6月24日
定時株主総会
株式の種類
普通株式
配当金の総額
(百万円)
配当の原資
6,536
利益剰余金
1株当たり配
当額(円)
70
基準日
効力発生日
2026年3月31日
2026年6月25日
(注)配当金の総額には、役員報酬BIP信託口に対する配当金の金額17百万円を含めております。
105/152
EDINET提出書類
株式会社ニフコ(E02386)
有価証券報告書
(連結キャッシュ・フロー計算書関係)
※1 現金及び現金同等物の期末残高と連結貸借対照表に掲記されている科目の金額との関係
前連結会計年度
2024年4月1日
2025年3月31日)
(自
至
当連結会計年度
2025年4月1日
2026年3月31日)
(自
至
現金及び預金勘定
146,232百万円
148,622百万円
預入期間が3か月を超える定期預金
△6,476
△8,202
3か月以内の短期投資である有価証券
1,340
1,239
141,097
141,659
現金及び現金同等物
※2.前連結会計年度に株式の売却により連結子会社でなくなった会社の資産及び負債の主な内訳は次のとおりで
あります。
Nifco Germany GmbH
流動資産
固定資産
流動負債
14,986百万円
33百万円
△5,169百万円
固定負債
△2,325百万円
Nifco KTW America Corporation
流動資産
7,133百万円
固定資産
11百万円
流動負債
固定負債
△15,428百万円
△787百万円
なお、上記流動資産に含まれる現金及び現金同等物から株式売却に関連して増減した現金及び現金同等物を加味
した11,128百万円を「連結の範囲の変更を伴う子会社株式の売却による支出」として表示しております。
(リース取引関係)
(借主側)
オペレーティング・リース取引
オペレーティング・リース取引のうち解約不能のものに係る未経過リース料
(単位:百万円)
前連結会計年度
(2025年3月31日)
1年内
1年超
合計
当連結会計年度
(2026年3月31日)
24
27
52
106/152
366
144
510
EDINET提出書類
株式会社ニフコ(E02386)
有価証券報告書
(金融商品関係)
1.金融商品の状況に関する事項
(1)金融商品に対する取組方針
当社グループは、主に設備投資で必要な資金の一部を銀行借入、社債の発行により調達しております。資金運
用については、流動性が要求される資金は、決済性預金を中心に運用し、また、中長期での運用が可能な資金
は、債券や定期性預金にて運用しております。デリバティブは、後述するリスクを回避するために利用してお
り、投機的な取引は行わない方針であります。
(2)金融商品の内容及びそのリスク
営業債権である受取手形、電子記録債権、並びに売掛金は、顧客の信用リスクに晒されております。また、海
外で事業を行うにあたり生じる外貨建ての営業債権は、為替の変動リスクに晒されております。
有価証券及び投資有価証券は、主に満期保有目的の債券、国債、業務上の関係を有する企業の株式、及び投資
事業組合等出資金であり、債券や上場株式は、市場価格の変動リスクに晒されております。
営業債務である支払手形及び買掛金、並びに未払金は、そのほとんどが1年以内の支払期日であります。ま
た、一部外貨建てのものについては、為替の変動リスクに晒されております。
借入金及び社債は、主に設備投資に係る資金調達を目的としたものであり、償還日は最長で決算日後3年であ
ります。このうち一部は、金利の変動リスクに晒されておりますが、デリバティブ取引(通貨スワップ取引、金利
スワップ取引)を利用してヘッジしております。
デリバティブ取引は、主に外貨建ての債権債務に係る為替の変動リスクに対するヘッジを目的とした通貨オプ
ション取引、通貨スワップ取引、為替予約取引、借入金に係る支払金利の変動リスクに対するヘッジを目的とし
た金利スワップ取引であります。なお、ヘッジ会計に関するヘッジ手段とヘッジ対象、ヘッジ方針、ヘッジの有
効性の評価方法等については、前述の連結財務諸表作成のための基本となる重要な事項「4.会計方針に関する
事項 (7)重要なヘッジ会計の方法」をご参照ください。
(3)金融商品に係るリスク管理体制
① 信用リスク(取引先の契約不履行等に係るリスク)の管理
当社は、営業債権等について、各事業部門における営業管理担当が主要な取引先の状況を定期的にモニタリン
グし、取引相手ごとに期日及び残高を管理するとともに、財務状況等の悪化等による回収懸念の早期把握や軽減
を図っております。連結子会社についても、当社と同様の管理を行っております。
デリバティブ取引については、信用リスクを軽減するために、取引相手先を高格付を有する金融機関に限定し
ております。
② 市場リスク(為替や金利等の変動リスク)の管理
当社は、主に外貨建て債権債務に係る将来の為替レートの変動リスクに対して、外貨建て債権債務の残高の範
囲内で通貨スワップ取引、為替予約取引を利用しております。また、借入金に係る支払金利の変動リスクを抑制
するために、金利スワップ取引を利用しております。
有価証券及び投資有価証券については、定期的に時価や発行体(取引先企業)の財務状況等を把握し、また、
満期保有目的の債券以外のものについては、市況や取引先企業との関係を勘案して保有状況を継続的に見直して
おります。
デリバティブ取引の執行・管理については、「デリバティブ取引取扱規程」に基づき、資金担当部門が決裁担
当者の承認を得て行っております。
なお、連結子会社についても、当社と同様の管理を行っております。
③ 資金調達に係る流動性リスク(支払期日に支払いを実行できなくなるリスク)の管理
当社は、各部署からの報告に基づき担当部署が適時に資金繰計画を作成・更新するとともに、手許流動性の維
持などにより流動性リスクを管理しております。連結子会社についても、当社と同様の管理を行っております。
(4)金融商品の時価等に関する事項についての補足説明
金融商品の時価の算定においては変動要因を織り込んでいるため、異なる前提条件等を採用することにより、
当該価額が変動することがあります。また、「デリバティブ取引関係」注記におけるデリバティブ取引に関する
契約額等については、その金額自体がデリバティブ取引に係る市場リスクを示すものではありません。
107/152
EDINET提出書類
株式会社ニフコ(E02386)
有価証券報告書
2.金融商品の時価等に関する事項
連結貸借対照表計上額、時価及びこれらの差額については、次のとおりであります。現金及び短期間で決済され
る金融商品については、時価が帳簿価額に一致又は近似するものであることから、記載を省略しております。
前連結会計年度(2025年3月31日)
連結貸借対照表計上額
(百万円)
(1)売掛金
時価(百万円)
差額(百万円)
52,214
52,207
△7
1,343
1,343
0
575
575
−
資産計
54,134
54,126
△7
(1) 社債
35,000
33,721
△1,278
285
275
△9
35,285
33,997
△1,287
86
86
−
(2)有価証券及び投資有価証券(*1)
①満期保有目的の債券
②その他有価証券
(2) 長期借入金(1年内返済を含む)
負債計
デリバティブ取引(*2)
当連結会計年度(2026年3月31日)
連結貸借対照表計上額
(百万円)
(1)売掛金
時価(百万円)
差額(百万円)
51,750
51,742
△8
1,337
1,336
△0
167
167
−
資産計
53,255
53,246
△8
(1) 社債
25,000
23,639
△1,360
225
216
△8
25,225
23,855
△1,369
−
−
−
(2)有価証券及び投資有価証券(*1)
①満期保有目的の債券
②その他有価証券
(2) 長期借入金(1年内返済を含む)
負債計
デリバティブ取引(*2)
(*1) 市場価格のない株式等は、「(2) 有価証券及び投資有価証券」には含まれておりません。当該金融商品の連結
貸借対照表計上額は以下のとおりであります。
区分
前連結会計年度(百万円)
非上場株式
投資事業組合等出資金
合計
当連結会計年度(百万円)
114
264
0
0
114
264
(*2) デリバティブ取引によって生じた正味の債権・債務は純額で表示しております。
108/152
EDINET提出書類
株式会社ニフコ(E02386)
有価証券報告書
(注)1.金銭債権及び満期のある有価証券の連結決算日後の償還予定額
前連結会計年度(2025年3月31日)
1年超
1年以内
5年以内
(百万円)
(百万円)
現金及び預金
5年超
10年以内
(百万円)
10年超
(百万円)
146,232
−
−
−
受取手形
1,129
−
−
−
電子記録債権
6,807
−
−
−
売掛金
51,700
514
−
−
1,340
2
−
−
−
−
−
−
(1) 国債・地方債等
−
−
−
−
(2) 債券(社債)
−
−
−
−
(3) その他
−
−
−
−
207,211
517
−
−
有価証券及び投資有価証券
満期保有目的の債券
(1) 国債・地方債等
(2) その他
その他有価証券のうち満期
があるもの
合計
当連結会計年度(2026年3月31日)
1年超
5年以内
(百万円)
1年以内
(百万円)
現金及び預金
5年超
10年以内
(百万円)
10年超
(百万円)
148,622
−
−
−
受取手形
1,458
−
−
−
電子記録債権
6,806
−
−
−
売掛金
51,355
394
−
−
1,334
2
−
−
−
−
−
−
(1) 国債・地方債等
−
−
−
−
(2) 債券(社債)
−
−
−
−
(3) その他
−
−
−
−
209,578
397
−
−
有価証券及び投資有価証券
満期保有目的の債券
(1) 国債・地方債等
(2) その他
その他有価証券のうち満期
があるもの
合計
109/152
EDINET提出書類
株式会社ニフコ(E02386)
有価証券報告書
(注)2.短期借入金、社債、長期借入金の連結決算日後の返済予定額
前連結会計年度 (2025年3月31日)
1年以内
(百万円)
短期借入金
1年超
2年以内
(百万円)
2年超
3年以内
(百万円)
3年超
4年以内
(百万円)
4年超
5年以内
(百万円)
5年超
(百万円)
199
−
−
−
−
−
10,000
−
−
10,000
15,000
−
長期借入金
60
60
60
60
45
−
合計
10,259
60
60
10,060
15,045
−
当連結会計年度
(2026年3月31日)
社債
1年以内
(百万円)
1年超
2年以内
(百万円)
2年超
3年以内
(百万円)
3年超
4年以内
(百万円)
4年超
5年以内
(百万円)
5年超
(百万円)
短期借入金
−
−
−
−
−
−
社債
−
−
10,000
15,000
−
−
長期借入金
60
60
60
45
−
−
合計
60
60
10,060
15,045
−
−
110/152
EDINET提出書類
株式会社ニフコ(E02386)
有価証券報告書
3.金融商品の時価のレベルごとの内訳等に関する事項
金融商品の時価を、時価の算定に係るインプットの観察可能性及び重要性に応じて、以下3つのレベルに
分類しております。
レベル1の時価:観察可能な時価の算定に係るインプットのうち、活発な市場において形成される当該時価
の算定の対象となる資産または負債に関する相場価格により算定した時価
レベル2の時価:観察可能な時価の算定に係るインプットのうち、レベル1のインプット以外の時価の算定
に係るインプットを用いて算定した時価
レベル3の時価:観察できない時価の算定に係るインプットを使用して算定した時価
時価の算定に重要な影響を与えるインプットを複数使用している場合には、それらのインプットがそれぞれ
属するレベルのうち、時価の算定における優先順位が最も低いレベルに時価を分類しております。
(1)時価で連結貸借対照表に計上している金融商品
前連結会計年度(2025年3月31日)
時価(百万円)
区分
レベル1
レベル2
レベル3
合計
有価証券及び投資有価証券
その他有価証券
株式
72
−
−
72
その他
−
328
173
502
通貨関連
−
86
−
86
金利関連
−
−
−
−
72
415
173
661
通貨関連
−
−
−
−
金利関連
−
−
−
−
−
−
−
−
デリバティブ取引
資産計
デリバティブ取引
負債計
111/152
EDINET提出書類
株式会社ニフコ(E02386)
有価証券報告書
当連結会計年度(2026年3月31日)
時価(百万円)
区分
レベル1
レベル2
レベル3
合計
有価証券及び投資有価証券
その他有価証券
株式
156
−
−
156
その他
−
11
−
11
通貨関連
−
−
−
−
金利関連
−
−
−
−
156
11
−
167
通貨関連
−
−
−
−
金利関連
−
−
−
−
−
−
−
−
デリバティブ取引
資産計
デリバティブ取引
負債計
(2)時価で連結貸借対照表に計上している金融商品以外の金融商品
前連結会計年度(2025年3月31日)
時価(百万円)
区分
レベル1
売掛金
レベル2
レベル3
合計
−
52,207
−
52,207
−
1,343
−
1,343
−
53,551
−
53,551
社債
−
33,721
−
33,721
長期借入金
−
275
−
275
−
33,997
−
33,997
有価証券及び投資有価証券
満期保有目的の債券
国債・地方債等
資産計
負債計
112/152
EDINET提出書類
株式会社ニフコ(E02386)
有価証券報告書
当連結会計年度(2026年3月31日)
時価(百万円)
区分
レベル1
売掛金
レベル2
レベル3
合計
−
51,742
−
51,742
−
1,336
−
1,336
−
53,078
−
53,078
社債
−
23,639
−
23,639
長期借入金
−
216
−
216
−
23,855
−
23,855
有価証券及び投資有価証券
満期保有目的の債券
国債・地方債等
資産計
負債計
(注) 時価の算定に用いた評価技法及び時価の算定に係るインプットの説明
売掛金
売掛金の時価は、一定の期間ごとに区分した債権ごとに、債権額と満期までの期間及び信用リスクを加味した利率
で割り引いた現在価値により算定しており、レベル2の時価に分類しております。
有価証券及び投資有価証券
その他有価証券
上場株式は相場価格を用いて評価しており、活発な市場で取引されているため、その時価をレベル1の時価に分類し
ております。一方で、その他のうち、時価レベル2に分類されるものは市場での取引頻度が低く、活発な市場におけ
る相場価格とは認められないため、その時価をレベル2の時価に分類しております。
満期保有目的の債券
当社が保有している国債・地方債等は市場での取引頻度が低く、活発な市場における相場価格とは認められないた
め、その時価をレベル2の時価に分類しております。
デリバティブ取引
通貨スワップの時価は、金利や為替レート等観察可能なインプットを用いて割引現在価値法により算定しており、レ
ベル2の時価に分類しております。
社債
当社の発行する社債の時価は、元利金の合計額を当該社債の残存期間及び信用リスクを加味した利率で割り引いた現
在価値により算定しており、レベル2の時価に分類しております。
長期借入金
長期借入金の時価は、元利金の合計額を当該借入の残存期間及び信用リスクを加味した利率で割り引いた現在価値に
より算定しており、レベル2の時価に分類しております。
113/152
EDINET提出書類
株式会社ニフコ(E02386)
有価証券報告書
(有価証券関係)
1.満期保有目的の債券
前連結会計年度(2025年3月31日)
種類
時価が連結貸借対照表
計上額を超えるもの
連結貸借対照表計上
額(百万円)
差額(百万円)
(1) 国債・地方債等
−
−
−
(2) 社債
−
−
−
(3) その他
−
−
−
−
−
−
1,343
1,343
−
(2) 社債
−
−
−
(3) その他
−
−
−
1,343
1,343
−
1,343
1,343
−
小計
(1) 国債・地方債等
時価が連結貸借対照表
計上額を超えないもの
時価(百万円)
小計
合計
当連結会計年度(2026年3月31日)
種類
時価が連結貸借対照表
計上額を超えるもの
連結貸借対照表計上
額(百万円)
差額(百万円)
(1) 国債・地方債等
3
3
0
(2) 社債
−
−
−
(3) その他
−
−
−
3
3
0
1,334
1,333
△0
(2) 社債
−
−
−
(3) その他
−
−
−
1,334
1,333
△0
1,337
1,336
△0
小計
(1) 国債・地方債等
時価が連結貸借対照表
計上額を超えないもの
時価(百万円)
小計
合計
114/152
EDINET提出書類
株式会社ニフコ(E02386)
有価証券報告書
2.その他有価証券
前連結会計年度(2025年3月31日)
連結貸借対照表計上
額(百万円)
取得原価(百万円)
63
13
50
① 国債・地方債等
−
−
−
② 社債
−
−
−
③ その他
−
−
−
(3) その他
328
−
328
392
13
378
9
9
−
① 国債・地方債等
−
−
−
② 社債
−
−
−
③ その他
−
−
−
(3) その他
173
173
−
183
183
−
575
196
378
種類
(1) 株式
差額(百万円)
(2) 債券
連結貸借対照表計上額
が取得原価を超えるも
の
小計
(1) 株式
(2) 債券
連結貸借対照表計上額
が取得原価を超えない
もの
小計
合計
(注)市場価格のない株式等の非上場株式(連結貸借対照表計上額 114百万円)及び投資事業組合等出資金(連結貸借
対照表計上額 0百万円)については、上表の「2.その他有価証券」には含めておりません。
115/152
EDINET提出書類
株式会社ニフコ(E02386)
有価証券報告書
当連結会計年度(2026年3月31日)
連結貸借対照表計上
額(百万円)
取得原価(百万円)
147
15
132
① 国債・地方債等
−
−
−
② 社債
−
−
−
③ その他
−
−
−
(3) その他
11
−
11
159
15
143
8
8
−
① 国債・地方債等
−
−
−
② 社債
−
−
−
③ その他
−
−
−
(3) その他
−
−
−
8
8
−
167
24
143
種類
(1) 株式
差額(百万円)
(2) 債券
連結貸借対照表計上額
が取得原価を超えるも
の
小計
(1) 株式
(2) 債券
連結貸借対照表計上額
が取得原価を超えない
もの
小計
合計
(注)市場価格のない株式等の非上場株式(連結貸借対照表計上額 264百万円)及び投資事業組合等出資金(連結貸借
対照表計上額 0百万円)については、上表の「2.その他有価証券」には含めておりません。
3.売却したその他有価証券
前連結会計年度(自 2024年4月1日
種類
至
2025年3月31日)
売却額(百万円)
売却益の合計額(百万円)
売却損の合計額(百万円)
株式
2,901
1,729
−
合計
2,901
1,729
−
売却益の合計額(百万円)
売却損の合計額(百万円)
当連結会計年度(自
2025年4月1日
至
種類
売却額(百万円)
2026年3月31日)
株式
0
−
△23
合計
0
−
△23
4.減損処理を行った有価証券
前連結会計年度(2025年3月31日)
当連結会計年度において、投資有価証券について、10百万円減損処理を行っております。
なお、減損処理にあたっては、期末における時価が取得原価に比べ50%以上下落した場合には全て減損処理を行
い、30〜50%程度下落した場合には、回復可能性等を考慮して必要と認められた額について減損処理を行ってお
ります。
当連結会計年度(2026年3月31日)
当連結会計年度において、有価証券について減損処理は行っていません。
116/152
EDINET提出書類
株式会社ニフコ(E02386)
有価証券報告書
(デリバティブ取引関係)
1. ヘッジ会計が適用されていないデリバティブ取引
(1)通貨関連
前連結会計年度(2025年3月31日)
該当事項はありません。
当連結会計年度(2026年3月31日)
該当事項はありません。
(2)金利関連
前連結会計年度(2025年3月31日)
該当事項はありません。
当連結会計年度(2026年3月31日)
該当事項はありません。
2. ヘッジ会計が適用されているデリバティブ取引
(1)通貨関連
前連結会計年度(2025年3月31日)
ヘッジ会計の方法
取引の種類
主なヘッジ対象
契約額等の
契約額等
うち1年超
(百万円)
(百万円)
時価
(百万円)
通貨スワップ取引
原則的処理方法
韓国ウォン受取・中国元支払
合計
貸付金
422
−
86
422
−
86
(注) 時価の算定方法
金利や為替レート等観察可能なインプットを用いて割引現在価値法により算定しております。
当連結会計年度(2026年3月31日)
該当事項はありません。
(2)金利関連
前連結会計年度(2025年3月31日)
該当事項はありません。
当連結会計年度(2026年3月31日)
該当事項はありません。
117/152
EDINET提出書類
株式会社ニフコ(E02386)
有価証券報告書
(退職給付関係)
1.採用している退職給付制度の概要
当社及び連結子会社は、従業員の退職給付に充てるため、積立型、非積立型の確定給付制度及び確定拠出制
度を採用しております。
なお、一部の連結子会社は、退職給付に係る期末自己都合要支給額等を退職給付債務とする方法を用いた簡
便法により退職給付に係る負債及び退職給付費用を計算しております。
2.確定給付制度
(1)退職給付債務の期首残高と期末残高の調整表(簡便法を適用した制度を除く。)
前連結会計年度
当連結会計年度
(自 2024年4月1日
(自 2025年4月1日
至 2025年3月31日)
至 2026年3月31日)
退職給付債務の期首残高
17,948百万円
17,702百万円
勤務費用
1,047
1,055
利息費用
438
509
数理計算上の差異の発生額
△954
△767
退職給付の支払額
△864
△986
為替換算調整額
168
305
その他
△82
231
退職給付債務の期末残高
17,702
18,051
(2)年金資産の期首残高と期末残高の調整表(簡便法を適用した制度を除く。)
前連結会計年度
当連結会計年度
(自 2024年4月1日
(自 2025年4月1日
至 2025年3月31日)
至 2026年3月31日)
年金資産の期首残高
19,330百万円
19,900百万円
期待運用収益
683
654
数理計算上の差異の発生額
△798
217
事業主からの拠出額
1,497
645
退職給付の支払額
△849
△922
為替換算調整額
117
294
その他
△80
−
年金資産の期末残高
19,900
20,791
(3)簡便法を適用した制度の、退職給付に係る負債の期首残高と期末残高の調整表
前連結会計年度
当連結会計年度
(自 2024年4月1日
(自 2025年4月1日
至 2025年3月31日)
至 2026年3月31日)
退職給付に係る負債の期首残高
438百万円
483百万円
退職給付費用
98
57
退職給付の支払額
△53
△34
為替換算調整額
−
2
その他
5
退職給付に係る負債の期末残高
483
514
(4)退職給付債務及び年金資産の期末残高と連結貸借対照表に計上された退職給付に係る負債及び退職給付に
係る資産の調整表
前連結会計年度
当連結会計年度
(2025年3月31日)
(2026年3月31日)
積立型制度の退職給付債務
17,183百万円
17,433百万円
年金資産
△19,900
△20,791
△2,717
△3,357
非積立型制度の退職給付債務
1,007
1,132
連結貸借対照表に計上された負債と資産の純額
△1,710
△2,225
退職給付に係る負債
退職給付に係る資産
連結貸借対照表に計上された負債と資産の純額
(注)簡便法を適用した制度を含みます。
1,760
△3,470
△1,710
118/152
1,767
△3,992
△2,225
EDINET提出書類
株式会社ニフコ(E02386)
有価証券報告書
(5)退職給付費用及びその内訳項目の金額
勤務費用
利息費用
期待運用収益
数理計算上の差異の費用処理額
簡便法で計算した退職給付費用
その他
確定給付制度に係る退職給付費用
前連結会計年度
(自 2024年4月1日
至 2025年3月31日)
1,047百万円
438
△683
214
98
92
1,208
当連結会計年度
2025年4月1日
2026年3月31日)
1,055百万円
509
△654
111
57
349
1,429
(自
至
(6)退職給付に係る調整額
退職給付に係る調整額に計上した項目(法人税等及び税効果控除前)の内訳は次のとおりであります。
前連結会計年度
当連結会計年度
(自 2024年4月1日
(自 2025年4月1日
至 2025年3月31日)
至 2026年3月31日)
数理計算上の差異
△366百万円
△1,097百万円
合計
△366
△1,097
(7)退職給付に係る調整累計額
退職給付に係る調整累計額に計上した項目(法人税等及び税効果控除前)の内訳は次のとおりであります。
前連結会計年度
当連結会計年度
(2025年3月31日)
(2026年3月31日)
未認識数理計算上の差異
△71百万円
△1,155百万円
合計
△71
△1,155
(8)年金資産に関する事項
① 年金資産の主な内訳
年金資産合計に対する主な分類ごとの比率は、次のとおりであります。
前連結会計年度
(2025年3月31日)
債券
43%
株式
18
一般勘定
25
オルタナティブ
7
その他
7
合計
100
(注)オルタナティブは、主にヘッジファンドへの投資であります。
当連結会計年度
(2026年3月31日)
40%
22
24
7
7
100
② 長期期待運用収益率の設定方法
年金資産の長期期待運用収益率を決定するため、現在及び予想される年金資産の配分と、年金資産を構成する
多様な資産からの現在及び将来期待される長期の収益率を考慮しております。
(9)数理計算上の計算基礎に関する事項
主要な数理計算上の計算基礎(加重平均で表わしております。)
前連結会計年度
(2025年3月31日)
割引率
2.9%
長期期待運用収益率
3.5%
当連結会計年度
(2026年3月31日)
3.4%
3.3%
3.確定拠出制度
当社及び連結子会社の確定拠出制度への要拠出額は、前連結会計年度1,002百万円、当連結会計年度1,159百
万円であります。
119/152
EDINET提出書類
株式会社ニフコ(E02386)
有価証券報告書
(税効果会計関係)
1.繰延税金資産及び繰延税金負債の発生の主な原因別の内訳
前連結会計年度
(2025年3月31日)
当連結会計年度
(2026年3月31日)
未払事業税
50百万円
275百万円
賞与引当金
856
925
棚卸資産評価損
232
172
貸倒引当金
19
14
退職給付に係る負債
761
678
減損損失
708
983
1,556
1,355
減価償却費
489
528
棚卸資産に係る未実現利益
694
821
7,107
4,008
(繰延税金資産)
税務上の繰越欠損金
清算予定子会社の投資等に係る税効果
その他
4,539
3,341
小計
17,013
13,103
△11,374
△8,926
同一納税主体における繰延税金負債との相殺額
繰延税金資産小計
5,638
4,177
評価性引当額小計
△2,306
△2,077
繰延税金資産合計
3,332
2,099
△41
△42
△1,284
△1,251
△79
△37
海外子会社の未分配利益に係る税効果
△10,987
△10,745
減価償却費
△1,109
△709
その他
△1,541
△2,342
小計
△15,044
△15,128
11,374
8,926
△3,669
△6,202
△337
△4,102
(繰延税金負債)
その他有価証券評価差額金
固定資産圧縮積立金
特別償却準備金
同一納税主体における繰延税金資産との相殺額
繰延税金負債合計
繰延税金資産(負債)の純額
120/152
EDINET提出書類
株式会社ニフコ(E02386)
有価証券報告書
2.法定実効税率と税効果会計適用後の法人税等の負担率との間に重要な差異があるときの、当該差異の原因となった
主要な項目別の内訳
前連結会計年度
(2025年3月31日)
法定実効税率
30.6%
当連結会計年度
(2026年3月31日)
30.6%
(調整)
交際費等永久に損金に算入されない項目
1.9
受取配当金等永久に益金に算入されない項目
△3.9
海外子会社の税率差によるもの
△8.1
海外子会社の未分配利益に係る税効果
8.2
試験研究費等の税額控除
△1.3
評価性引当額の増減による影響
△9.1
その他
△2.6
税効果会計適用後の法人税等の負担率
15.7
121/152
法定実効税率と税効果会計
適用後の法人税等の負担率と
の間の差異が法定実効税率の
100分の5以下であるため注
記を省略しております。
EDINET提出書類
株式会社ニフコ(E02386)
有価証券報告書
(収益認識関係)
1.顧客との契約から生じる収益を分解した情報
顧客との契約から生じる収益を分解した情報は、「注記事項(セグメント情報等)」に記載のとおりであり
ます。
2.顧客との契約から生じる収益を理解するための基礎となる情報
「連結財務諸表作成のための基本となる重要な事項」4.会計方針に関する事項の「(5)重要な収益及び費
用の計上基準」に記載のとおりであります。
3.顧客との契約に基づく履行義務の充足と当該契約から生じるキャッシュ・フローとの関係並びに当連結会計
年度末において存在する顧客との契約から翌連結会計年度以降に認識すると見込まれる収益の金額及び時期に関
する情報
1.契約資産及び契約負債の残高等
(単位:百万円)
前連結会計年度当連結会計年度
顧客との契約から生じた債権(期首残高)
67,275
60,152
顧客との契約から生じた債権(期末残高)
60,152
60,015
契約資産(期首残高)
1,171
477
契約資産(期末残高)
477
482
契約負債(期首残高)
4,899
5,035
契約負債(期末残高)
5,035
5,704
契約資産は、販売契約について期末日時点で完了しておりますが未請求の顧客に対する製品・商品の納入に係
る対価に対する当社及び連結子会社の権利に関するものであります。契約資産は、当社及び連結子会社の権利が
無条件になった時点で顧客との契約で生じた債権に振替られます。契約負債は、主に、販売契約における顧客か
ら受け取った前受金に関するものであります。契約負債は、主に収益の認識に伴い取り崩されます。
前連結会計年度に認識された収益の額のうち期首現在の契約負債残高に含まれていた額は、4,286百万円であ
ります。
また、前連結会計年度において、契約資産が693百万円減少した主な理由は、新規契約による増加が、顧客と
の契約から生じた債権への振替による減少を下回ったことによるものであります。また、前連結会計年度におい
て、契約負債が136百万円増加した主な理由は、前受金の受け取りによる増加が、収益認識による減少を上回っ
たことによるものであります。
当連結会計年度に認識された収益の額のうち期首現在の契約負債残高に含まれていた額は、3,385百万円であ
ります。
また、当連結会計年度において、契約資産が4百万円増加した主な理由は、新規契約による増加が、顧客との
契約から生じた債権への振替による減少を上回ったことによるものであります。また、当連結会計年度におい
て、契約負債が669百万円増加した主な理由は、前受金の受け取りによる増加が、収益認識による減少を上回っ
たことによるものであります。
2.残存履行義務に配分した取引価格
前連結会計年度における未充足の履行義務は、2025年3月31日時点で13,364百万円であります。当該履行義務
は、主に合成樹脂成形品事業の製品の製造及び販売に関するものであり、期末日後1年以内に約83%収益として
認識され、ほとんど全てが2年以内に認識されるものと見込まれています。
当連結会計年度における未充足の履行義務は、2026年3月31日時点で19,187百万円であります。当該履行義務
は、主に合成樹脂成形品事業の製品の製造及び販売に関するものであり、期末日後1年以内に約95%収益として
認識され、ほとんど全てが2年以内に認識されるものと見込まれています。
122/152
EDINET提出書類
株式会社ニフコ(E02386)
有価証券報告書
(セグメント情報等)
【セグメント情報】
1.報告セグメントの概要
当社の報告セグメントは、当社の構成単位のうち、分離された財務情報が入手可能であり、取締役会
が、経営資源の配分の決定及び業績を評価するために、定期的に検討を行う対象となっているものであり
ます。
当社は、製品の種類・性質により、「合成樹脂成形品事業」、「ベッド及び家具事業」の2つの報告セ
グメントとしております。
各報告セグメントに属する主要製品・サービスは以下のとおりであります。
(1) 合成樹脂成形品事業…工業用プラスチック・ファスナー、プラスチック精密成形部品等
(2) ベッド及び家具事業…各種ベッド、リクライニングチェアー等
2.報告セグメントごとの売上高、利益又は損失、資産、負債その他の項目の金額の算定方法
報告されている事業セグメントの会計処理の方法は、「連結財務諸表作成のための基本となる重要な事
項」における記載と概ね同一であります。
報告セグメントの利益又は損失は、営業利益又は営業損失であります。
セグメント間の内部収益は市場実勢価格に基づいております。
3.報告セグメントごとの売上高、利益又は損失、資産、負債その他の項目の金額に関する情報及び収益の
分解情報
前連結会計年度(自2024年4月1日至2025年3月31日)
(単位:百万円)
報告セグメント
合成樹脂
成形品事業
ベッド及び
家具事業
調整額
(注1)
(注3)
(注4)
合計
連結財務諸表
計上額
(注2)
売上高
顧客との契約から生じる収益
315,942
37,096
353,038
−
353,038
−
−
−
−
−
315,942
37,096
353,038
−
353,038
−
−
−
−
−
315,942
37,096
353,038
−
353,038
セグメント利益又は損失(△)
49,016
5,967
54,984
△5,783
49,200
セグメント資産
260,920
46,705
307,626
72,189
379,816
減価償却費
11,068
1,872
12,940
66
13,007
有形固定資産及び無形固定資産の
増加額
18,811
706
19,517
216
19,734
その他の収益
外部顧客への売上高
セグメント間の内部売上高
又は振替高
計
その他の項目
(注)1.セグメント利益又は損失の調整額△5,783百万円は、全社費用であります。全社費用は、主に報告セグメン
トに帰属しない一般管理費であります。
2.セグメント利益又は損失は、連結損益及び包括利益計算書の営業利益と調整を行っております。
3.セグメント資産の調整額72,189百万円は、各報告セグメントに配分していない全社資産72,271百万円及びセ
グメント間取引消去△81百万円が含まれております。
4.有形固定資産及び無形固定資産の増加額の調整額216百万円は、各報告セグメントに配分していない全社資
産の設備投資額であります。
123/152
EDINET提出書類
株式会社ニフコ(E02386)
有価証券報告書
当連結会計年度(自2025年4月1日
至2026年3月31日)
(単位:百万円)
報告セグメント
合成樹脂
成形品事業
ベッド及び
家具事業
調整額
(注1)
(注3)
(注4)
合計
連結財務諸表
計上額
(注2)
売上高
顧客との契約から生じる収益
315,691
36,958
352,650
−
352,650
−
−
−
−
−
315,691
36,958
352,650
−
352,650
−
−
−
−
−
315,691
36,958
352,650
−
352,650
セグメント利益又は損失(△)
47,663
5,970
53,634
△5,556
48,078
セグメント資産
269,904
48,286
318,190
75,399
393,590
減価償却費
10,581
1,839
12,421
145
12,567
有形固定資産及び無形固定資産の
増加額
17,791
732
18,523
41
18,564
その他の収益
外部顧客への売上高
セグメント間の内部売上高
又は振替高
計
その他の項目
(注)1.セグメント利益又は損失の調整額△5,556百万円は、全社費用であります。全社費用は、主に報告セグメン
トに帰属しない一般管理費であります。
2.セグメント利益又は損失は、連結損益及び包括利益計算書の営業利益と調整を行っております。
3.セグメント資産の調整額75,399百万円は、各報告セグメントに配分していない全社資産75,493百万円及びセ
グメント間取引消去△93百万円が含まれております。
4.有形固定資産及び無形固定資産の増加額の調整額41百万円は、各報告セグメントに配分していない全社資産
の設備投資額であります。
124/152
EDINET提出書類
株式会社ニフコ(E02386)
有価証券報告書
【関連情報】
前連結会計年度(自2024年4月1日至2025年3月31日)
1.製品及びサービスごとの情報
セグメント情報に同様の情報を開示しているため、記載を省略しております。
2.地域ごとの情報
(1) 売上高
(単位:百万円)
アジア
(注2)
日本
中国
韓国
104,747
41,308
44,827
アメリカ
39,833
北米
(注3)
71,719
欧州
19,956
その他
28,908
1,737
合計
353,038
(注)1.売上高は顧客の所在地を基礎とし、国又は地域に分類しております。
2.アジアの数値は中国及び韓国の売上高を含んでおりません。
3.北米の数値はアメリカの売上高を含んでおりません。
(2) 有形固定資産
(単位:百万円)
日本
中国
39,611
アジア
(注1)
韓国
11,226
9,448
北米
(注2)
アメリカ
14,512
11,579
欧州
9,819
合計
11,487
107,685
(注)1.アジアの数値は中国及び韓国の有形固定資産を含んでおりません。
2.北米の数値はアメリカの有形固定資産を含んでおりません。
3.主要な顧客ごとの情報
売上高の10%以上を占める単一の外部顧客が存在しないため、記載していません。
当連結会計年度(自2025年4月1日至2026年3月31日)
1.製品及びサービスごとの情報
セグメント情報に同様の情報を開示しているため、記載を省略しております。
2.地域ごとの情報
(1) 売上高
(単位:百万円)
アジア
(注2)
日本
中国
韓国
106,959
40,223
41,228
アメリカ
41,476
北米
(注3)
72,261
欧州
19,865
その他
29,030
1,606
合計
352,650
(注)1.売上高は顧客の所在地を基礎とし、国又は地域に分類しております。
2.アジアの数値は中国及び韓国の売上高を含んでおりません。
3.北米の数値はアメリカの売上高を含んでおりません。
(2) 有形固定資産
(単位:百万円)
日本
40,053
中国
11,520
韓国
9,883
アジア
(注1)
17,494
アメリカ
13,404
北米
(注2)
10,752
欧州
12,393
(注)1.アジアの数値は中国及び韓国の有形固定資産を含んでおりません。
2.北米の数値はアメリカの有形固定資産を含んでおりません。
3.主要な顧客ごとの情報
売上高の10%以上を占める単一の外部顧客が存在しないため、記載していません。
125/152
合計
115,503
EDINET提出書類
株式会社ニフコ(E02386)
有価証券報告書
【報告セグメントごとの固定資産の減損損失に関する情報】
前連結会計年度(自2024年4月1日至2025年3月31日)
該当事項はありません。
当連結会計年度(自2025年4月1日
至2026年3月31日)
(単位:百万円)
合成樹脂
成形品事業
減損損失
857
ベッド及び
家具事業
−
消去又は
全社
合計
−
【報告セグメントごとののれんの償却額及び未償却残高に関する情報】
前連結会計年度(自2024年4月1日至2025年3月31日)
該当事項はありません。
当連結会計年度(自2025年4月1日
至2026年3月31日)
該当事項はありません。
【報告セグメントごとの負ののれん発生益に関する情報】
該当事項はありません。
126/152
857
EDINET提出書類
株式会社ニフコ(E02386)
有価証券報告書
【関連当事者情報】
前連結会計年度(自2024年4月1日
至2025年3月31日)
該当事項はありません。
当連結会計年度(自2025年4月1日
至2026年3月31日)
該当事項はありません。
(1株当たり情報)
前連結会計年度
(自 2024年4月1日
至 2025年3月31日)
1株当たり純資産額
1株当たり当期純利益金額
当連結会計年度
2025年4月1日
2026年3月31日)
(自
至
2,888.37円
3,183.40円
461.95円
361.44円
(注)1.潜在株式調整後1株当たり当期純利益金額については、潜在株式が存在しないため記載しておりません。
2.1株当たり当期純利益金額の算定上の基礎は、以下のとおりであります。
前連結会計年度
(自 2024年4月1日
至 2025年3月31日)
当連結会計年度
2025年4月1日
2026年3月31日)
(自
至
1株当たり当期純利益金額
親会社株主に帰属する当期純利益金額
(百万円)
44,767
34,079
普通株主に帰属しない金額(百万円)
−
−
普通株式に係る親会社株主に帰属する当期純利
益金額(百万円)
44,767
34,079
期中平均株式数(千株)
96,910
94,289
(注)3.株主資本において自己株式として計上されている信託に残存する自社の株式は、1株当たり当期純利益金額の
算定上、期中平均株式数の計算において控除する自己株式に含めており、また、1株当たり純資産額の算定
上、期末発行済株式総数から控除する自己株式数に含めております。
1株当たり当期純利益金額の算定上、控除した当該自己株式の期中平均株式数
前連結会計年度
331,817株、当連結会計年度
301,882株
1株当たり純資産額の算定上、控除した当該自己株式の期末株式数
前連結会計年度
354,132株、当連結会計年度
252,401株
4.当社は2026年10月1日付で普通株式1株につき2株の株式分割を予定しております。当連結会計年度の期首に
当該株式分割が行われたと仮定した場合の1株当たり純資産額は1,591円70銭、1株当たり当期純利益は180円
72銭となります。
127/152
EDINET提出書類
株式会社ニフコ(E02386)
有価証券報告書
(重要な後発事象)
(株式分割および株式分割に伴う定款の一部変更)
当社は、下記のとおり2026年5月14日開催の取締役会の決議に基づき、2026年10月1日を効力発生日として、以下のと
おり株式分割を実施いたします。
1.株式分割
(1)株式分割の目的
株式分割を実施し、当社株式の投資単位当たりの金額を引き下げることにより、投資家の皆様がより投資しやすい環境
を整え、投資家層の拡大および当社株式の流動性向上を図ることを目的としております。
(2)株式分割の概要
①分割の方法
2026年9月30日を基準日として、同日の最終の株主名簿に記載または記録された株主の所有する普通株式1株につき、
2株の割合をもって分割いたします。
②分割により増加する株式数
株式分割前の発行済株式総数
株式分割により増加する株式数
株式分割後の発行済株式総数
株式分割後の発行可能株式総数
100,232,614 株
100,232,614 株
200,465,228 株
466,000,000 株
(3)日程
基準日公告日
基準日
効力発生日
2026年9月15日(予定)
2026年9月30日
2026年10月1日
(4)1株当たり情報に及ぼす影響
1株当たり情報に及ぼす影響は(1株当たり情報)に記載しております。
2.株式分割に伴う定款の一部変更
(1)定款変更の理由
上記の株式分割に伴い、会社法第184条第2項の規定に基づき、2026年10月1日を効力発生日として、当社定款の一部
を変更いたします。
(2)定款変更の内容
現行定款
(発行可能株式総数)
第 5 条当会社の発行可能株式総数は、
2億3,300万株とする。
変更後
(発行可能株式総数)
第 5 条当会社の発行可能株式総数は、
4億6,600万株とする。
(3)定款変更の日程
取締役会決議日
定款変更の効力発生日
2026年5月14日
2026年10月1日
3.資本金額の変更
今回の株式分割に際して、資本金の額の変更はございません。
4.配当について
今回の株式分割は、2026年10月1日を効力発生日としておりますため、配当基準日を2026年9月30日とする2027年3
月期の中間配当につきましては、株式分割前の当社普通株式が対象となります。
128/152
EDINET提出書類
株式会社ニフコ(E02386)
有価証券報告書
⑤【連結附属明細表】
【社債明細表】
会社名
銘柄
発行年月日
株式会社ニフコ
第5回無担保社債
株式会社ニフコ
第6回無担保社債
−
合計
2018年
5月18日
2019年
9月11日
−
(注)1. 「当期首残高」及び「当期末残高」欄の[
当期首残高
(百万円)
当期末残高
(百万円)
利率(%)
担保
10,000
10,000
0.385
なし
15,000
15,000
0.28
なし
25,000
[−]
25,000
[−]
−
−
償還期限
2028年
5月8日
2029年
9月11日
−
]書きは、1年以内に償還が予定されている金額で内数と
なっております。
2. 連結決算日後5年間の償還予定額は以下のとおりであります。
1年以内
(百万円)
−
1年超2年以内
(百万円)
2年超3年以内
(百万円)
3年超4年以内
(百万円)
4年超5年以内
(百万円)
−
10,000
15,000
−
129/152
EDINET提出書類
株式会社ニフコ(E02386)
有価証券報告書
【借入金等明細表】
当期首残高
(百万円)
当期末残高
(百万円)
平均利率
(%)
短期借入金
199
−
−
−
1年内返済予定の長期借入金
60
60
1.10
−
1年内返済予定のリース債務
1,642
2,042
2.85
−
長期借入金(1年内返済予定のものを除く。)
225
165
1.10
2027年〜2030年
リース債務(1年内返済予定のものを除く。)
1,681
2,522
2.75
2027年〜2031年
3,807
4,789
−
−
区分
合計
返済期限
(注)1.「平均利率」については、借入金等の期末残高に対する加重平均利率を記載しております。
2.リース債務の平均利率については、リース料総額に含まれる利息相当額を控除する前の金額でリース債務を
連結貸借対照表に計上しているものを除いて算定しております。
3.長期借入金及びリース債務(1年内返済予定のものを除く。)の連結決算日後5年間の返済予定額は以下の
とおりであります。
区分
1年超2年以内
(百万円)
2年超3年以内
(百万円)
3年超4年以内
(百万円)
4年超5年以内
(百万円)
長期借入金
60
60
45
−
リース債務
1,776
445
229
70
【資産除去債務明細表】
当連結会計年度期首及び当連結会計年度末における資産除去債務の金額が、当連結会計年度期首及び当連結会
計年度末における負債及び純資産の合計額の100分の1以下であるため、連結財務諸表規則第92条の2の規定に
より記載を省略しております。
(2)【その他】
当連結会計年度における四半期情報等
(累計期間)
第1四半期
中間連結会計期間
第3四半期
当連結会計年度
売上高(百万円)
85,541
173,113
262,332
352,650
税金等調整前中間(当期)
(四半期)純利益金額(百万
円)
13,680
26,276
40,090
51,356
親会社株主に帰属する中間
(当期)(四半期)純利益金
額(百万円)
9,831
18,486
28,539
34,079
1株当たり中間(当期)(四
半期)純利益金額(円)
103.28
194.52
301.56
361.44
(会計期間)
1株当たり四半期純利益金額
(円)
第1四半期
第2四半期
103.28
91.18
第3四半期
107.04
第4四半期
59.45
(注)当社は、第1四半期及び第3四半期について金融商品取引所の定める規則により四半期に係る財務情報を作成して
おりますが、当該四半期に係る財務情報に対する期中レビューは受けておりません。
130/152
EDINET提出書類
株式会社ニフコ(E02386)
有価証券報告書
2【財務諸表等】
(1)【財務諸表】
①【貸借対照表】
(単位:百万円)
前事業年度
(2025年3月31日)
資産の部
流動資産
現金及び預金
受取手形
売掛金
電子記録債権
商品及び製品
仕掛品
原材料及び貯蔵品
関係会社短期貸付金
未収入金
その他
貸倒引当金
流動資産合計
固定資産
有形固定資産
建物
構築物
機械及び装置
車両運搬具
工具、器具及び備品
金型
土地
建設仮勘定
その他
有形固定資産合計
無形固定資産
ソフトウエア
その他
無形固定資産合計
投資その他の資産
投資有価証券
関係会社株式
関係会社長期貸付金
長期未収入金
繰延税金資産
前払年金費用
その他
貸倒引当金
投資その他の資産合計
固定資産合計
資産合計
131/152
当事業年度
(2026年3月31日)
59,196
102
※1 17,977
4,111
7,012
635
454
350
※1 2,696
3,013
△18
95,531
60,912
4
※1 18,021
4,145
5,971
685
470
−
※1 2,657
977
△18
93,826
14,118
692
2,957
6
634
479
8,731
2,246
1
29,868
15,332
653
3,374
11
568
640
7,609
2,180
16
30,388
448
174
622
588
51
640
286
48,312
3,957
76
6,962
1,746
310
△466
61,186
91,678
187,209
262
48,715
5,215
57
7,635
1,954
297
△420
63,718
94,747
188,573
EDINET提出書類
株式会社ニフコ(E02386)
有価証券報告書
(単位:百万円)
前事業年度
(2025年3月31日)
負債の部
流動負債
買掛金
電子記録債務
未払金
未払費用
未払法人税等
預り金
賞与引当金
設備関係電子記録債務
設備関係未払金
1年内償還予定の社債
その他
流動負債合計
固定負債
社債
関係会社長期借入金
長期未払金
未払役員退職慰労金
資産除去債務
株式給付引当金
役員株式給付引当金
その他
固定負債合計
負債合計
純資産の部
株主資本
資本金
資本剰余金
資本準備金
資本剰余金合計
利益剰余金
利益準備金
その他利益剰余金
固定資産圧縮特別勘定積立金
別途積立金
繰越利益剰余金
利益剰余金合計
自己株式
株主資本合計
評価・換算差額等
その他有価証券評価差額金
評価・換算差額等合計
純資産合計
負債純資産合計
当事業年度
(2026年3月31日)
※1 6,929
4,248
※1 2,109
445
13
※1 80
2,287
309
※1 645
10,000
※1 250
132/152
※1 7,231
−
※1 2,543
431
3,531
※1 84
2,227
−
※1 471
−
※1 31
27,319
16,552
25,000
747
7,074
1
75
102
343
136
33,481
60,800
25,000
799
7,702
−
75
−
334
172
34,083
50,636
7,290
7,290
151
151
151
151
1,793
1,793
1,929
44,700
89,133
137,556
△18,588
126,409
1,860
44,700
110,031
158,384
△27,888
137,937
0
0
126,409
187,209
−
−
137,937
188,573
EDINET提出書類
株式会社ニフコ(E02386)
有価証券報告書
②【損益計算書】
(単位:百万円)
(自
至
前事業年度
2024年4月1日
2025年3月31日)
売上高
売上原価
売上総利益
販売費及び一般管理費
営業利益
営業外収益
受取利息及び受取配当金
為替差益
貸倒引当金戻入額
その他
営業外収益合計
営業外費用
支払利息
支払手数料
為替差損
不動産賃貸原価
その他
営業外費用合計
経常利益
特別利益
固定資産売却益
投資有価証券売却益
特別利益合計
特別損失
減損損失
固定資産除売却損
投資有価証券評価損
投資有価証券売却損
特別損失合計
税引前当期純利益
法人税、住民税及び事業税
法人税等調整額
法人税等合計
当期純利益
133/152
(自
至
当事業年度
2025年4月1日
2026年3月31日)
※1 96,197
※1 99,084
67,712
28,484
※2 18,517
70,527
28,556
※2 18,635
9,967
9,921
14,414
−
44
495
14,954
20,935
2,030
46
406
23,418
161
17
161
468
42
852
24,069
118
77
−
472
30
699
32,639
−
※3 1,139
※4 1,729
1,729
−
1,139
−
※5 857
※6 77
※6 171
※7 10
−
−
87
25,710
925
△3,610
△2,684
28,395
※8 23
1,052
32,726
4,849
△673
4,176
28,549
EDINET提出書類
株式会社ニフコ(E02386)
有価証券報告書
③【株主資本等変動計算書】
前事業年度(自 2024年4月1日
至
2025年3月31日)
(単位:百万円)
株主資本
資本剰余金
資本金
当期首残高
利益剰余金
その他利益剰余金
その他資本
資本準備金
剰余金
7,290
151
−
資本剰余
利益準備金
金合計
151
1,793
固定資産
圧縮特別別途積立金
勘定積立金
2,025
44,700
繰越利益
剰余金
利益剰余
金合計
67,252
115,770
剰余金の配当
△6,598
△6,598
当期純利益
28,395
28,395
当期変動額
固定資産圧縮特別
勘定積立金の取崩
△70
70
−
税率変更に伴う固
定資産圧縮特別積
立金の取崩
△25
25
−
△10
△10
自己株式の取得
自己株式の処分
△10
△10
10
10
自己株式の消却
利益剰余金から資
本剰余金への振替
株主資本以外の項
目の当期変動額
(純額)
当期変動額合計
当期末残高
−
−
−
−
−
△95
−
21,881
21,786
7,290
151
−
151
1,793
1,929
44,700
89,133
137,556
株主資本
当期首残高
評価・換算差額等
自己株式
株主資本
合計
その他有
価証券評
価差額金
△3,608
119,603
2,009
評価・換純資産合計
算差額等
合計
2,009
121,612
当期変動額
剰余金の配当
△6,598
△6,598
当期純利益
28,395
28,395
固定資産圧縮特別
勘定積立金の取崩
−
−
税率変更に伴う固
定資産圧縮特別積
立金の取崩
−
−
自己株式の取得
△16,632
△16,632
△16,632
自己株式の処分
1,652
1,641
1,641
自己株式の消却
−
−
利益剰余金から資
本剰余金への振替
−
−
株主資本以外の項
目の当期変動額
(純額)
−
△2,009
△2,009
△2,009
当期変動額合計
△14,979
6,806
△2,009
△2,009
4,796
当期末残高
△18,588
126,409
0
0
126,409
134/152
EDINET提出書類
株式会社ニフコ(E02386)
有価証券報告書
当事業年度(自
2025年4月1日
至
2026年3月31日)
(単位:百万円)
株主資本
資本剰余金
資本金
当期首残高
利益剰余金
その他利益剰余金
その他資本
資本準備金
剰余金
7,290
151
−
資本剰余
利益準備金
金合計
151
1,793
固定資産
圧縮特別別途積立金
勘定積立金
1,929
44,700
繰越利益
剰余金
利益剰余
金合計
89,133
137,556
剰余金の配当
△7,614
△7,614
当期純利益
28,549
28,549
当期変動額
固定資産圧縮特別
勘定積立金の取崩
△69
69
自己株式の取得
自己株式の処分
△27
△27
自己株式の消却
△79
△79
106
106
利益剰余金から資
本剰余金への振替
株主資本以外の項
目の当期変動額
(純額)
当期変動額合計
当期末残高
△106
−
−
−
−
−
△69
−
20,897
20,828
7,290
151
−
151
1,793
1,860
44,700
110,031
158,384
株主資本
当期首残高
△106
評価・換算差額等
自己株式
株主資本
合計
その他有
価証券評
価差額金
△18,588
126,409
0
評価・換純資産合計
算差額等
合計
0
126,409
当期変動額
剰余金の配当
△7,614
△7,614
当期純利益
28,549
28,549
−
−
固定資産圧縮特別
勘定積立金の取崩
自己株式の取得
△9,999
△9,999
△9,999
自己株式の処分
619
592
592
自己株式の消却
79
−
−
利益剰余金から資
本剰余金への振替
−
−
株主資本以外の項
目の当期変動額
(純額)
−
△0
△0
△0
当期変動額合計
△9,300
11,527
△0
△0
11,527
当期末残高
△27,888
137,937
−
−
137,937
135/152
EDINET提出書類
株式会社ニフコ(E02386)
有価証券報告書
【注記事項】
(重要な会計方針)
1.資産の評価基準及び評価方法
(1) 有価証券の評価基準及び評価方法
① 満期保有目的の債券
償却原価法(定額法)によっております。
② 子会社株式及び関連会社株式
移動平均法による原価法によっております。
③ その他有価証券
・市場価格のない株式等以外のもの
事業年度末の市場価格等に基づく時価法(評価差額は全部純資産直入法により処理し、売却原価は移動
平均法により算定)によっております。
・市場価格のない株式等
移動平均法による原価法によっております。
(2) デリバティブ等の評価基準及び評価方法
デリバティブ
時価法によっております。
(3) 棚卸資産の評価基準及び評価方法
商品、製品、仕掛品、原材料及び貯蔵品
総平均法による原価法(貸借対照表価額については収益性の低下に基づく簿価切下げの方法)によって
おります。
2.固定資産の減価償却の方法
(1) 有形固定資産(リース資産を除く)
定額法によっております。
なお、主な耐用年数は以下のとおりであります。
建物
38年〜50年
機械及び装置
5年〜10年
工具、器具及び備品
2年〜15年
金型
2年
(2) 無形固定資産
① 自社利用のソフトウェア
社内における利用可能期間(5年)に基づく定額法によっております。
② その他の無形固定資産
定額法によっております。
(3) リース資産
リース期間を耐用年数とし、残存価額を零とする定額法を採用しております。
3.引当金の計上基準
(1) 貸倒引当金
売上債権、貸付金等の貸倒れによる損失に備えるため、一般債権については貸倒実績率により、貸倒懸念
債権等特定の債権については個別に回収可能性を勘案し、回収不能見込額を計上しております。
(2) 賞与引当金
従業員に対して支給する賞与の支出に充てるため、支給見込額に基づき計上しております。
(3) 退職給付引当金
従業員の退職給付に備えるため、当事業年度の末日における退職給付債務及び年金資産の見込額に基づき
計上しております。
退職給付債務の算定にあたり、退職給付見込額を当事業年度末までの期間に帰属させる方法については、
給付算定式基準によっております。
数理計算上の差異は、その発生時の従業員の平均残存勤務期間以内の一定の年数(10年)による定額法に
より発生年度から費用処理しております。
(4) 株式給付引当金
従業員への当社株式の給付に備えるため、当事業年度末に係る要給付額を見積計上しております。
(5) 役員株式給付引当金
役員への株式給付報酬の支給に備えるため、内規に基づき当事業年度末に係る要支給額を見積計上してお
ります。
136/152
EDINET提出書類
株式会社ニフコ(E02386)
有価証券報告書
4.収益及び費用の計上基準
当社は、主に工業用プラスチック・ファスナー及びプラスチック精密成形部品等の製造及び販売を行ってお
り、自動車や家電業界で用いられる部品を顧客に提供しております。
これらの製品の販売については顧客との販売契約に基づき、顧客に製品を納入することを履行義務として識
別しており、原則として製品の引渡時点において顧客が当該製品に対する支配を獲得し、履行義務が一時点で
充足されると判断していることから、製品の引渡し時点で収益を認識しております。取引価格が配分された履
行義務は、独立して販売しております。
取引価格の算定については、顧客との契約において約束された対価から値引き額等を控除した金額で収益を
認識しております。
これらの約束した対価の額に重要な金融要素は含まれていないため調整しておりません。履行義務に対する
対価は、顧客に履行義務を充足する時点と顧客の支払条件により概ね1年以内に受領しております。
5.その他財務諸表作成のための基礎となる事項
(1) ヘッジ会計の方法
① ヘッジ会計の方法
繰延ヘッジ処理を採用しております。また、為替変動リスクのヘッジについて振当処理の要件を充た
している場合には振当処理を、金利スワップについて特例処理の条件を充たしている場合には、特例処
理を採用しております。
② ヘッジ手段とヘッジ対象
当事業年度にヘッジ会計を適用したヘッジ対象はありません。
③ ヘッジ方針
当社は、主に内規である「デリバティブ取引取扱規程」に基づき、為替変動リスク、金利変動リスク
をヘッジしております。
④ ヘッジ有効性評価の方法
「金融商品会計に関する実務指針」(企業会計基準委員会)の規定に基づき、有効性の評価を行ってお
ります。
ただし、ヘッジ会計処理として金融商品会計基準等に定める特例処理または振当処理を行う取引にお
いては、ヘッジ有効性の評価は省略しております。
(2) 退職給付に係る会計処理の方法
財務諸表において、未認識数理計算上の差異の貸借対照表における取扱いが連結財務諸表と異なってお
ります。個別貸借対照表上、退職給付債務に未認識数理計算上の差異を加減した額から、年金資産の額を
控除した額を退職給付引当金に計上しております。
(重要な会計上の見積り)
該当事項はありません。
(会計方針の変更)
該当事項はありません。
(表示方法の変更)
(貸借対照表)
前事業年度において、「投資その他の資産」の「その他」に含めていた「前払年金費用」は金額的重要性が増
したため、当事業年度より独立掲記することとしております。この表示方法の変更を反映させるため、前事業
年度の財務諸表の組替えを行っております。
この結果、前事業年度の貸借対照表において、「投資その他の資産」の「その他」に表示していた2,057百万
円は、「前払年金費用」1,746百万円、「その他」310百万円として組み替えております。
(損益計算書)
前事業年度において、「営業外費用」の「その他」に含めていた「支払手数料」は、金額的重要性が増したた
め、当事業年度より独立掲記しております。
この結果、前事業年度の損益計算書において、「営業外費用」の「その他」60百万円は、「支払手数料」17百
万円及び「その他」42百万円に組替えております。
137/152
EDINET提出書類
株式会社ニフコ(E02386)
有価証券報告書
(追加情報)
1.役員向け株式報酬制度
連結財務諸表「注記事項
おります。
2.従業員向け株式報酬制度
連結財務諸表「注記事項
ております。
追加情報
(役員向け株式報酬制度)」に記載しているため、注記を省略して
追加情報
(従業員向け株式報酬制度)」に記載しているため、注記を省略し
(貸借対照表関係)
※ 関係会社に対する金銭債権、債務(区分表示したものは除く)は次のとおりであります。
前事業年度
(2025年3月31日)
短期金銭債権
短期金銭債務
長期金銭債務
当事業年度
(2026年3月31日)
3,153百万円
1,507
7,074
4,085百万円
1,364
7,702
(損益計算書関係)
※1 関係会社との取引高は、次のとおりであります。
(自
至
前事業年度
2024年4月1日
2025年3月31日)
(自
至
当事業年度
2025年4月1日
2026年3月31日)
営業取引による取引高
営業収益
営業費用
営業取引以外の取引高
11,408百万円
7,935
14,079
11,780百万円
8,109
20,791
※2
販売費に属する費用のおおよその割合は前事業年度27%、当事業年度28%、一般管理費に属する費用のお
およその割合は前事業年度73%、当事業年度72%であります。
販売費及び一般管理費のうち主要な費目及び金額は次のとおりであります。
(自
至
荷造運搬費
※3
前事業年度
2024年4月1日
2025年3月31日)
(自
至
当事業年度
2025年4月1日
2026年3月31日)
報酬及び給料手当
4,971百万円
3,170
5,195百万円
3,047
賞与引当金繰入額
1,028
1,075
減価償却費
449
350
支払手数料
1,797
1,648
固定資産売却益
前事業年度(自 2024年4月1日
至
2025年3月31日)
至
2026年3月31日)
該当事項はありません。
当事業年度(自
2025年4月1日
固定資産売却益は土地の売却によるものであります。
※4
投資有価証券売却益
前事業年度(自 2024年4月1日至 2025年3月31日)
投資有価証券の売却益1,729百万円は主にトヨタ自動車株式の売却に係るものであります。
当事業年度(自 2025年4月1日
該当事項はありません。
至
2026年3月31日)
138/152
EDINET提出書類
株式会社ニフコ(E02386)
有価証券報告書
※5
減損損失
前事業年度(自
2024年4月1日
至
2025年3月31日)
該当事項はありません。
当事業年度(自 2025年4月1日至 2026年3月31日)
連結財務諸表「注記事項(連結損益及び包括利益計算書関係)※6
記載しているため、注記を省略しております。
固定資産除売却損
前事業年度(自 2024年4月1日
減損損失」に同一の内容を
※6
至
2025年3月31日)
主なものは、金型の処分等によるものであります。
当事業年度(自
2025年4月1日
至
2026年3月31日)
主なものは、金型の処分等によるものであります。
※7
投資有価証券評価損
前事業年度(自 2024年4月1日至 2025年3月31日)
連結財務諸表「注記事項(連結損益及び包括利益計算書関係)※8
内容を記載しているため、注記を省略しております。
当事業年度(自
2025年4月1日
至
2026年3月31日)
至
2025年3月31日)
至
2026年3月31日)
投資有価証券評価損」に同一の
該当事項はありません。
※8
投資有価証券売却損
前事業年度(自 2024年4月1日
該当事項はありません。
当事業年度(自
2025年4月1日
投資有価証券の売却損23百万円は非上場株式1銘柄の売却に係るものであります。
(有価証券関係)
前事業年度(2025年3月31日現在)
子会社株式(貸借対照表計上額
48,312百万円)は、市場価格のない株式等のため、記載しておりません。
当事業年度(2026年3月31日現在)
子会社株式(貸借対照表計上額
48,715百万円)は、市場価格のない株式等のため、記載しておりません。
139/152
EDINET提出書類
株式会社ニフコ(E02386)
有価証券報告書
(税効果会計関係)
1.繰延税金資産及び繰延税金負債の発生の主な原因別の内訳
前事業年度
(2025年3月31日)
(繰延税金資産)
未払事業税
-百万円
金型評価損
8
賞与引当金
699
関係会社株式評価損
7,336
貸倒引当金
152
その他
537
繰延税金資産小計
8,734
将来減算一時差異等の合計に係る
評価性引当額
△250
繰延税金資産合計
8,484
(繰延税金負債)
固定資産圧縮特別勘定積立金
△886
その他有価証券評価差額金
△0
前払年金費用
△549
その他
△85
繰延税金負債合計
△1,521
繰延税金資産(負債)の純額
6,962
当事業年度
(2026年3月31日)
233百万円
61
700
7,336
138
928
9,399
△250
9,149
△854
△0
△616
△42
△1,513
7,635
2.法定実効税率と税効果会計適用後の法人税等の負担率との間の差異の原因となった主な項目別の内訳
前事業年度
当事業年度
(2025年3月31日)
(2026年3月31日)
法定実効税率
30.6%
30.6%
(調整)
受取配当金等永久に益金に算入されない項目
△15.7
△18.2
特定外国子会社等に係る課税対象金額
0.2
住民税均等割
0.1
0.1
試験研究費等の特別税額控除
△1.0
△1.6
外国子会社配当源泉税
2.0
2.5
評価性引当額の増減
△26.9
納付したとみなされる控除対象外国法人税額
△0.1
△0.2
税率変更による繰延税金資産の増額修正
△0.7
過年度に係る法人税等の修正
△0.5
その他
1.1
△0.1
税効果会計適用後の法人税等の負担率
△10.4
12.7
(収益認識関係)
顧客との契約から生じる収益を理解するための基礎となる情報は、連結財務諸表「注記事項
に記載しているため、注記を省略しております。
収益認識関係」
(重要な後発事象)
株式分割および株式分割に伴う定款の一部変更
連結財務諸表「注記事項重要な後発事象 (株式分割および株式分割に伴う定款の一部変更)」に
記載しているため、注記を省略しております。
140/152
EDINET提出書類
株式会社ニフコ(E02386)
有価証券報告書
④【附属明細表】
【有形固定資産等明細表】
(単位:百万円)
区分
資産の種類
当期首残高
建物
構築物
機械及び装置
有
当期増加額
当期減少額
14,118
3,029
692
360
2,957
1,384
6
車両運搬具
当期償却額
841
当期末残高
減価償却累計額
及び減損損失累
計額
974
15,332
12,239
70
653
1,035
164
802
3,374
9,388
8
0
2
11
25
(494)
328
(251)
形
固
工具、器具及び備品
634
336
113
289
568
9,009
定
金型
479
664
9
492
640
58,558
土地
8,731
7,609
111
建設仮勘定
2,246
4,401
4,467
2,180
1
17
1
16
20
計
29,868
10,201
2,634
30,388
90,389
ソフトウエア
448
293
3
149
588
その他
174
151
274
0
51
622
445
277
150
640
資
産
その他
無
形
固
定
資
産
計
1,122
(111)
7,047
(857)
(注)1.当期増加額のうち、主なものは次のとおりであります。
建設仮勘定
:金型の購入及び製作、建物及び構築物の工
事
1,732百万円
2.当期減少額のうち、主なものは次のとおりであります。
建設仮勘定
3.当期減少額欄の(
:事業の用に供した建物及び構築物
2,517百万円
)内は内書きで減損損失の計上額であります。
【引当金明細表】
(単位:百万円)
科
目
当期首残高
当期増加額
当期減少額
当期末残高
貸倒引当金
484
0
46
438
賞与引当金
2,287
2,227
2,287
2,227
株式給付引当金
102
102
役員株式給付引当金
343
408
417
334
(2)【主な資産及び負債の内容】
連結財務諸表を作成しているため、記載を省略しております。
(3)【その他】
該当事項はありません。
141/152
EDINET提出書類
株式会社ニフコ(E02386)
有価証券報告書
第6【提出会社の株式事務の概要】
事業年度
4月1日から3月31日まで
定時株主総会
6月中
基準日
3月31日
剰余金の配当の基準日
9月30日
3月31日
1単元の株式数
100株
単元未満株式の買取・買増
取扱場所
(特別口座)
東京都千代田区丸の内一丁目3番3号
みずほ信託銀行株式会社本店証券代行部
株主名簿管理人
(特別口座)
東京都千代田区丸の内一丁目3番3号
みずほ信託銀行株式会社
取次所
買取・買増手数料
──────
無料
公告掲載方法
当会社の公告方法は、電子公告とする。ただし、事故その他やむを得ない
事由によって電子公告による公告をすることができない場合は、日本経済
新聞に掲載して行う。
公告掲載URL https://www.nifco.com/
株主に対する特典
該当事項はありません。
142/152
EDINET提出書類
株式会社ニフコ(E02386)
有価証券報告書
第7【提出会社の参考情報】
1【提出会社の親会社等の情報】
当社は、親会社等はありません。
2【その他の参考情報】
当事業年度の開始日から有価証券報告書提出日までの間に、次の書類を提出しております。
(1) 有価証券報告書及びその添付書類並びに確認書
事業年度(第73期)(自
2024年4月1日
至
2025年3月31日)2025年6月23日関東財務局長に提出
(2) 内部統制報告書及びその添付書類
2025年6月23日関東財務局長に提出
(3) 半期報告書及び確認書
(第74期中)(自
2025年4月1日
至
2025年9月30日)2025年11月12日関東財務局長に提出
(4) 臨時報告書
2025年5月8日関東財務局長に提出
企業内容等の開示に関する内閣府令第19条第2項第9号の4(会計監査人の異動)に基づく臨時報告書でありま
す。
2025年6月30日関東財務局長に提出
企業内容等の開示に関する内閣府令第19条第2項第9号の2(株主総会における議決権行使の結果)に基づく臨時
報告書であります。
2026年4月17日関東財務局長に提出
企業内容等の開示に関する内閣府令第19条第2項第12号(連結子会社からの配当金の受領)に基づく臨時報告書で
あります。
(5) 有価証券届出書(参照方式)及びその添付書類
2025年5月19日関東財務局長に提出
(6) 訂正有価証券届出書
2025年6月23日関東財務局長に提出
2025年6月30日関東財務局長に提出
(7) 自己株券買付状況報告書
報告期間(自
報告期間(自
報告期間(自
報告期間(自
報告期間(自
報告期間(自
報告期間(自
2025年7月1日
2025年8月1日
2025年9月1日
2025年10月1日
2025年11月1日
2025年12月1日
2026年1月1日
至
至
至
至
至
至
至
2025年7月31日)2025年8月6日関東財務局長に提出
2025年8月31日)2025年9月9日関東財務局長に提出
2025年9月30日)2025年10月10日関東財務局長に提出
2025年10月31日)2025年11月12日関東財務局長に提出
2025年11月30日)2025年12月10日関東財務局長に提出
2025年12月31日)2026年1月9日関東財務局長に提出
2026年1月31日)2026年2月10日関東財務局長に提出
143/152
EDINET提出書類
株式会社ニフコ(E02386)
有価証券報告書
第二部【提出会社の保証会社等の情報】
該当事項はありません。
144/152
EDINET提出書類
株式会社ニフコ(E02386)
有価証券報告書
独立監査人の監査報告書及び内部統制監査報告書
2026年6月22日
株式会社ニフコ
取締役会
御中
有限責任監査法人トーマツ
東京事務所
指定有限責任社員
業務執行社員
公認会計士
東海林
雅
人
指定有限責任社員
業務執行社員
公認会計士
伊
惣
悟
藤
<連結財務諸表監査>
監査意見
当監査法人は、金融商品取引法第193条の2第1項の規定に基づく監査証明を行うため、「経理の状況」に掲げられて
いる株式会社ニフコの2025年4月1日から2026年3月31日までの連結会計年度の連結財務諸表、すなわち、連結貸借対照
表、連結損益及び包括利益計算書、連結株主資本等変動計算書、連結キャッシュ・フロー計算書、連結財務諸表作成のた
めの基本となる重要な事項、その他の注記及び連結附属明細表について監査を行った。
当監査法人は、上記の連結財務諸表が、我が国において一般に公正妥当と認められる企業会計の基準に準拠して、株式
会社ニフコ及び連結子会社の2026年3月31日現在の財政状態並びに同日をもって終了する連結会計年度の経営成績及び
キャッシュ・フローの状況を、全ての重要な点において適正に表示しているものと認める。
監査意見の根拠
当監査法人は、我が国において一般に公正妥当と認められる監査の基準に準拠して監査を行った。監査の基準における
当監査法人の責任は、「連結財務諸表監査における監査人の責任」に記載されている。当監査法人は、我が国における職
業倫理に関する規定(社会的影響度の高い事業体の財務諸表監査に適用される規定を含む。)に従って、会社及び連結子
会社から独立しており、また、監査人としてのその他の倫理上の責任を果たしている。当監査法人は、意見表明の基礎と
なる十分かつ適切な監査証拠を入手したと判断している。
145/152
EDINET提出書類
株式会社ニフコ(E02386)
有価証券報告書
監査上の主要な検討事項
監査上の主要な検討事項とは、当連結会計年度の連結財務諸表の監査において、監査人が職業的専門家として特に重要
であると判断した事項である。監査上の主要な検討事項は、連結財務諸表全体に対する監査の実施過程及び監査意見の形
成において対応した事項であり、当監査法人は、当該事項に対して個別に意見を表明するものではない。
収益認識(手作業による売上高の期間帰属の適切性)
監査上の主要な検討事項の内容及び決定理由
監査上の対応
・株式会社ニフコの当連結損益計算書に計上されている売
上高は352,650百万円である。注記事項「(連結財務諸
表作成のための基本となる重要な事項)4.会計方針に
関する事項(5)重要な収益及び費用の計上基準」に記載
のとおり、株式会社ニフコ及び連結子会社では、顧客と
の販売契約に基づき、顧客に製品等を納入することを履
行義務としており、原則として製品等の引渡時点におい
て支配が顧客に移転し履行義務が充足されると判断して
いることから、当時点において収益を認識している。株
式会社ニフコ及び連結子会社の売上高は、主に営業シス
テム内において自動で受注処理や出荷・受渡処理が実施
され、会計システムへ自動連携されることによって売上
が計上される仕組みとなっている。一方で、一部の売上
については、営業システムでの自動処理や会計システム
への自動連係によらず、営業システムまたは会計システ
ムに手入力することで売上計上がされている。
売上高は経営者及び財務諸表利用者が重視する指標の一
つであり、財務諸表項目の中でも特に重要である。また、
この手作業による処理は収益認識のタイミングを誤るリス
クが相対的に高いと考えられる。
以上から、当監査法人は株式会社ニフコ及び連結子会社
の手入力による売上高に関する期間帰属の適切性を監査上
の主要な検討事項に該当すると判断した。
当監査法人は、株式会社ニフコ及び主要な連結子会社の
手入力による売上高に関する期間帰属の適切性を検討する
ため、主に以下の監査手続を実施した(連結子会社の監査
人に指示して実施した監査手続を含む)。
(1)内部統制の評価
販売プロセスに関連する一連の内部統制を理解す
るとともに、内部統制の整備及び運用状況の有効性
を評価した。評価に当たっては、必要に応じて当監
査法人内のIT専門家を関与させ特に以下の内部統制
の検証を実施した。
・営業システム及び会計システムのユーザーアクセ
ス管理、システム変更管理、システム運用管理等
のIT全般統制
・営業システムと会計システムの整合性の確認
・得意先の支払明細・検収データ等との照合
・仕訳入力伝票の承認
(2)取引の詳細テスト
手入力による売上計上の期間帰属の適切性を検討
するために以下の手続を実施した。
・営業システム及び会計システムに手入力で入力さ
れた売上高を抽出し、期末日前の売上について、
検収データ等の関連証憑と照合や取引実態の合理
性を検討した。
・期末日後の返品・値引状況を確認し、当連結会計
年度の売上の取消として処理すべき重要な取引の
有無を検討した。
その他の記載内容
その他の記載内容は、有価証券報告書に含まれる情報のうち、連結財務諸表及び財務諸表並びにこれらの監査報告書以
外の情報である。経営者の責任は、その他の記載内容を作成し開示することにある。また、監査等委員会の責任は、その
他の記載内容の報告プロセスの整備及び運用における取締役の職務の執行を監視することにある。
当監査法人の連結財務諸表に対する監査意見の対象にはその他の記載内容は含まれておらず、当監査法人はその他の記
載内容に対して意見を表明するものではない。
連結財務諸表監査における当監査法人の責任は、その他の記載内容を通読し、通読の過程において、その他の記載内容
と連結財務諸表又は当監査法人が監査の過程で得た知識との間に重要な相違があるかどうか検討すること、また、そのよ
うな重要な相違以外にその他の記載内容に重要な誤りの兆候があるかどうか注意を払うことにある。
当監査法人は、実施した作業に基づき、その他の記載内容に重要な誤りがあると判断した場合には、その事実を報告す
ることが求められている。
その他の記載内容に関して、当監査法人が報告すべき事項はない。
146/152
EDINET提出書類
株式会社ニフコ(E02386)
有価証券報告書
連結財務諸表に対する経営者及び監査等委員会の責任
経営者の責任は、我が国において一般に公正妥当と認められる企業会計の基準に準拠して連結財務諸表を作成し適正に
表示することにある。これには、不正又は誤謬による重要な虚偽表示のない連結財務諸表を作成し適正に表示するために
経営者が必要と判断した内部統制を整備及び運用することが含まれる。
連結財務諸表を作成するに当たり、経営者は、継続企業の前提に基づき連結財務諸表を作成することが適切であるかど
うかを評価し、我が国において一般に公正妥当と認められる企業会計の基準に基づいて継続企業に関する事項を開示する
必要がある場合には当該事項を開示する責任がある。
監査等委員会の責任は、財務報告プロセスの整備及び運用における取締役の職務の執行を監視することにある。
連結財務諸表監査における監査人の責任
監査人の責任は、監査人が実施した監査に基づいて、全体としての連結財務諸表に不正又は誤謬による重要な虚偽表示
がないかどうかについて合理的な保証を得て、監査報告書において独立の立場から連結財務諸表に対する意見を表明する
ことにある。虚偽表示は、不正又は誤謬により発生する可能性があり、個別に又は集計すると、連結財務諸表の利用者の
意思決定に影響を与えると合理的に見込まれる場合に、重要性があると判断される。
監査人は、我が国において一般に公正妥当と認められる監査の基準に従って、監査の過程を通じて、職業的専門家とし
ての判断を行い、職業的懐疑心を保持して以下を実施する。
・不正又は誤謬による重要な虚偽表示リスクを識別し、評価する。また、重要な虚偽表示リスクに対応した監査手続を立
案し、実施する。監査手続の選択及び適用は監査人の判断による。さらに、意見表明の基礎となる十分かつ適切な監査
証拠を入手する。
・連結財務諸表監査の目的は、内部統制の有効性について意見表明するためのものではないが、監査人は、リスク評価の
実施に際して、状況に応じた適切な監査手続を立案するために、監査に関連する内部統制を検討する。
・経営者が採用した会計方針及びその適用方法の適切性、並びに経営者によって行われた会計上の見積りの合理性及び関
連する注記事項の妥当性を評価する。
・経営者が継続企業を前提として連結財務諸表を作成することが適切であるかどうか、また、入手した監査証拠に基づ
き、継続企業の前提に重要な疑義を生じさせるような事象又は状況に関して重要な不確実性が認められるかどうか結論
付ける。継続企業の前提に関する重要な不確実性が認められる場合は、監査報告書において連結財務諸表の注記事項に
注意を喚起すること、又は重要な不確実性に関する連結財務諸表の注記事項が適切でない場合は、連結財務諸表に対し
て除外事項付意見を表明することが求められている。監査人の結論は、監査報告書日までに入手した監査証拠に基づい
ているが、将来の事象や状況により、企業は継続企業として存続できなくなる可能性がある。
・連結財務諸表の表示及び注記事項が、我が国において一般に公正妥当と認められる企業会計の基準に準拠しているかど
うかとともに、関連する注記事項を含めた連結財務諸表の表示、構成及び内容、並びに連結財務諸表が基礎となる取引
や会計事象を適正に表示しているかどうかを評価する。
・連結財務諸表に対する意見表明の基礎となる、会社及び連結子会社の財務情報に関する十分かつ適切な監査証拠を入手
するために、連結財務諸表の監査を計画し実施する。監査人は、連結財務諸表の監査に関する指揮、監督及び査閲に関
して責任がある。監査人は、単独で監査意見に対して責任を負う。
監査人は、監査等委員会に対して、計画した監査の範囲とその実施時期、監査の実施過程で識別した内部統制の重要な
不備を含む監査上の重要な発見事項、及び監査の基準で求められているその他の事項について報告を行う。
監査人は、監査等委員会に対して、独立性についての我が国における職業倫理に関する規定を遵守したこと、並びに監
査人の独立性に影響を与えると合理的に考えられる事項、及び阻害要因を除去するための対応策を講じている場合又は阻
害要因を許容可能な水準にまで軽減するためのセーフガードを適用している場合はその内容について報告を行う。
監査人は、監査等委員会と協議した事項のうち、当連結会計年度の連結財務諸表の監査で特に重要であると判断した事
項を監査上の主要な検討事項と決定し、監査報告書において記載する。ただし、法令等により当該事項の公表が禁止され
ている場合や、極めて限定的ではあるが、監査報告書において報告することにより生じる不利益が公共の利益を上回ると
合理的に見込まれるため、監査人が報告すべきでないと判断した場合は、当該事項を記載しない。
147/152
EDINET提出書類
株式会社ニフコ(E02386)
有価証券報告書
<内部統制監査>
監査意見
当監査法人は、金融商品取引法第193条の2第2項の規定に基づく監査証明を行うため、株式会社ニフコの2026年3月
31日現在の内部統制報告書について監査を行った。
当監査法人は、株式会社ニフコが2026年3月31日現在の財務報告に係る内部統制は有効であると表示した上記の内部統
制報告書が、我が国において一般に公正妥当と認められる財務報告に係る内部統制の評価の基準に準拠して、財務報告に
係る内部統制の評価結果について、全ての重要な点において適正に表示しているものと認める。
監査意見の根拠
当監査法人は、我が国において一般に公正妥当と認められる財務報告に係る内部統制の監査の基準に準拠して内部統制
監査を行った。財務報告に係る内部統制の監査の基準における当監査法人の責任は、「内部統制監査における監査人の責
任」に記載されている。当監査法人は、我が国における職業倫理に関する規定(社会的影響度の高い事業体の財務諸表監
査に適用される規定を含む。)に従って、会社及び連結子会社から独立しており、また、監査人としてのその他の倫理上
の責任を果たしている。当監査法人は、意見表明の基礎となる十分かつ適切な監査証拠を入手したと判断している。
内部統制報告書に対する経営者及び監査等委員会の責任
経営者の責任は、財務報告に係る内部統制を整備及び運用し、我が国において一般に公正妥当と認められる財務報告に
係る内部統制の評価の基準に準拠して内部統制報告書を作成し適正に表示することにある。
監査等委員会の責任は、財務報告に係る内部統制の整備及び運用状況を監視、検証することにある。
なお、財務報告に係る内部統制により財務報告の虚偽の記載を完全には防止又は発見することができない可能性があ
る。
内部統制監査における監査人の責任
監査人の責任は、監査人が実施した内部統制監査に基づいて、内部統制報告書に重要な虚偽表示がないかどうかについ
て合理的な保証を得て、内部統制監査報告書において独立の立場から内部統制報告書に対する意見を表明することにあ
る。
監査人は、我が国において一般に公正妥当と認められる財務報告に係る内部統制の監査の基準に従って、監査の過程を
通じて、職業的専門家としての判断を行い、職業的懐疑心を保持して以下を実施する。
・内部統制報告書における財務報告に係る内部統制の評価結果について監査証拠を入手するための監査手続を実施する。
内部統制監査の監査手続は、監査人の判断により、財務報告の信頼性に及ぼす影響の重要性に基づいて選択及び適用さ
れる。
・財務報告に係る内部統制の評価範囲、評価手続及び評価結果について経営者が行った記載を含め、全体としての内部統
制報告書の表示を検討する。
・内部統制報告書における財務報告に係る内部統制の評価結果に関する十分かつ適切な監査証拠を入手するために、内部
統制の監査を計画し実施する。監査人は、内部統制報告書の監査に関する指揮、監督及び査閲に関して責任がある。監
査人は、単独で監査意見に対して責任を負う。
監査人は、監査等委員会に対して、計画した内部統制監査の範囲とその実施時期、内部統制監査の実施結果、識別した
内部統制の開示すべき重要な不備、その是正結果、及び内部統制の監査の基準で求められているその他の事項について報
告を行う。
監査人は、監査等委員会に対して、独立性についての我が国における職業倫理に関する規定を遵守したこと、並びに監
査人の独立性に影響を与えると合理的に考えられる事項、及び阻害要因を除去するための対応策を講じている場合又は阻
害要因を許容可能な水準にまで軽減するためのセーフガードを適用している場合はその内容について報告を行う。
148/152
EDINET提出書類
株式会社ニフコ(E02386)
有価証券報告書
<報酬関連情報>
当監査法人及び当監査法人と同一のネットワークに属する者に対する、会社及び子会社の監査証明業務に基づく報酬及
び非監査業務に基づく報酬の額は、「提出会社の状況」に含まれるコーポレート・ガバナンスの状況等 (3)【監査の状
況】に記載されている。
利害関係
会社及び連結子会社と当監査法人又は業務執行社員との間には、公認会計士法の規定により記載すべき利害関係はな
い。
以
1)上記の監査報告書の原本は当社(有価証券報告書提出会社)が別途保管しております。
2)XBRLデータは監査の対象には含まれておりません。
149/152
上
EDINET提出書類
株式会社ニフコ(E02386)
有価証券報告書
独立監査人の監査報告書
2026年6月22日
株式会社ニフコ
取締役会御中
有限責任監査法人トーマツ
東京事務所
指定有限責任社員
業務執行社員
公認会計士
東海林
雅
人
指定有限責任社員
業務執行社員
公認会計士
伊
惣
悟
藤
<財務諸表監査>
監査意見
当監査法人は、金融商品取引法第193条の2第1項の規定に基づく監査証明を行うため、「経理の状況」に掲げられて
いる株式会社ニフコの2025年4月1日から2026年3月31日までの第74期事業年度の財務諸表、すなわち、貸借対照表、損
益計算書、株主資本等変動計算書、重要な会計方針、その他の注記及び附属明細表について監査を行った。
当監査法人は、上記の財務諸表が、我が国において一般に公正妥当と認められる企業会計の基準に準拠して、株式会社
ニフコの2026年3月31日現在の財政状態及び同日をもって終了する事業年度の経営成績を、全ての重要な点において適正
に表示しているものと認める。
監査意見の根拠
当監査法人は、我が国において一般に公正妥当と認められる監査の基準に準拠して監査を行った。監査の基準における
当監査法人の責任は、「財務諸表監査における監査人の責任」に記載されている。当監査法人は、我が国における職業倫
理に関する規定(社会的影響度の高い事業体の財務諸表監査に適用される規定を含む。)に従って、会社から独立してお
り、また、監査人としてのその他の倫理上の責任を果たしている。当監査法人は、意見表明の基礎となる十分かつ適切な
監査証拠を入手したと判断している。
150/152
EDINET提出書類
株式会社ニフコ(E02386)
有価証券報告書
監査上の主要な検討事項
監査上の主要な検討事項とは、当事業年度の財務諸表の監査において、監査人が職業的専門家として特に重要であると
判断した事項である。監査上の主要な検討事項は、財務諸表全体に対する監査の実施過程及び監査意見の形成において対
応した事項であり、当監査法人は、当該事項に対して個別に意見を表明するものではない。
収益認識(手作業による売上高の期間帰属の適切性)
1
連結財務諸表の監査報告書に記載されている監査上の主要な検討事項(収益認識(手作業による売上高の期間帰
属の適切性)と実質的に同一内容であるため、記載を省略している。
その他の記載内容
その他の記載内容は、有価証券報告書に含まれる情報のうち、連結財務諸表及び財務諸表並びにこれらの監査報告書以
外の情報である。経営者の責任は、その他の記載内容を作成し開示することにある。また、監査等委員会の責任は、その
他の記載内容の報告プロセスの整備及び運用における取締役の職務の執行を監視することにある。
当監査法人の財務諸表に対する監査意見の対象にはその他の記載内容は含まれておらず、当監査法人はその他の記載内
容に対して意見を表明するものではない。
財務諸表監査における当監査法人の責任は、その他の記載内容を通読し、通読の過程において、その他の記載内容と財
務諸表又は当監査法人が監査の過程で得た知識との間に重要な相違があるかどうか検討すること、また、そのような重要
な相違以外にその他の記載内容に重要な誤りの兆候があるかどうか注意を払うことにある。
当監査法人は、実施した作業に基づき、その他の記載内容に重要な誤りがあると判断した場合には、その事実を報告す
ることが求められている。
その他の記載内容に関して、当監査法人が報告すべき事項はない。
財務諸表に対する経営者及び監査等委員会の責任
経営者の責任は、我が国において一般に公正妥当と認められる企業会計の基準に準拠して財務諸表を作成し適正に表示
することにある。これには、不正又は誤謬による重要な虚偽表示のない財務諸表を作成し適正に表示するために経営者が
必要と判断した内部統制を整備及び運用することが含まれる。
財務諸表を作成するに当たり、経営者は、継続企業の前提に基づき財務諸表を作成することが適切であるかどうかを評
価し、我が国において一般に公正妥当と認められる企業会計の基準に基づいて継続企業に関する事項を開示する必要があ
る場合には当該事項を開示する責任がある。
監査等委員会の責任は、財務報告プロセスの整備及び運用における取締役の職務の執行を監視することにある。
151/152
EDINET提出書類
株式会社ニフコ(E02386)
有価証券報告書
財務諸表監査における監査人の責任
監査人の責任は、監査人が実施した監査に基づいて、全体としての財務諸表に不正又は誤謬による重要な虚偽表示がな
いかどうかについて合理的な保証を得て、監査報告書において独立の立場から財務諸表に対する意見を表明することにあ
る。虚偽表示は、不正又は誤謬により発生する可能性があり、個別に又は集計すると、財務諸表の利用者の意思決定に影
響を与えると合理的に見込まれる場合に、重要性があると判断される。
監査人は、我が国において一般に公正妥当と認められる監査の基準に従って、監査の過程を通じて、職業的専門家とし
ての判断を行い、職業的懐疑心を保持して以下を実施する。
・不正又は誤謬による重要な虚偽表示リスクを識別し、評価する。また、重要な虚偽表示リスクに対応した監査手続を立
案し、実施する。監査手続の選択及び適用は監査人の判断による。さらに、意見表明の基礎となる十分かつ適切な監査
証拠を入手する。
・財務諸表監査の目的は、内部統制の有効性について意見表明するためのものではないが、監査人は、リスク評価の実施
に際して、状況に応じた適切な監査手続を立案するために、監査に関連する内部統制を検討する。
・経営者が採用した会計方針及びその適用方法の適切性、並びに経営者によって行われた会計上の見積りの合理性及び関
連する注記事項の妥当性を評価する。
・経営者が継続企業を前提として財務諸表を作成することが適切であるかどうか、また、入手した監査証拠に基づき、継
続企業の前提に重要な疑義を生じさせるような事象又は状況に関して重要な不確実性が認められるかどうか結論付け
る。継続企業の前提に関する重要な不確実性が認められる場合は、監査報告書において財務諸表の注記事項に注意を喚
起すること、又は重要な不確実性に関する財務諸表の注記事項が適切でない場合は、財務諸表に対して除外事項付意見
を表明することが求められている。監査人の結論は、監査報告書日までに入手した監査証拠に基づいているが、将来の
事象や状況により、企業は継続企業として存続できなくなる可能性がある。
・財務諸表の表示及び注記事項が、我が国において一般に公正妥当と認められる企業会計の基準に準拠しているかどうか
とともに、関連する注記事項を含めた財務諸表の表示、構成及び内容、並びに財務諸表が基礎となる取引や会計事象を
適正に表示しているかどうかを評価する。
監査人は、監査等委員会に対して、計画した監査の範囲とその実施時期、監査の実施過程で識別した内部統制の重要な
不備を含む監査上の重要な発見事項、及び監査の基準で求められているその他の事項について報告を行う。
監査人は、監査等委員会に対して、独立性についての我が国における職業倫理に関する規定を遵守したこと、並びに監
査人の独立性に影響を与えると合理的に考えられる事項、及び阻害要因を除去するための対応策を講じている場合又は阻
害要因を許容可能な水準にまで軽減するためのセーフガードを適用している場合はその内容について報告を行う。
監査人は、監査等委員会と協議した事項のうち、当事業年度の財務諸表の監査で特に重要であると判断した事項を監査
上の主要な検討事項と決定し、監査報告書において記載する。ただし、法令等により当該事項の公表が禁止されている場
合や、極めて限定的ではあるが、監査報告書において報告することにより生じる不利益が公共の利益を上回ると合理的に
見込まれるため、監査人が報告すべきでないと判断した場合は、当該事項を記載しない。
<報酬関連情報>
報酬関連情報は、連結財務諸表の監査報告書に記載されている。
利害関係
会社と当監査法人又は業務執行社員との間には、公認会計士法の規定により記載すべき利害関係はない。
以
1)上記の監査報告書の原本は当社(有価証券報告書提出会社)が別途保管しております。
2)XBRLデータは監査の対象には含まれておりません。
152/152
上