Note: This document has been translated from the Japanese original for reference purposes only. In the event of any discrepancy between this translated document and the Japanese original, the original shall prevail. Consolidated Financial Results for…
Note: This document has been translated from the Japanese original for reference purposes only. In the event of any discrepancy
between this translated document and the Japanese original, the original shall prevail.
Consolidated Financial Results for the Three Months Ended June 30, 2026
(Based on Japanese GAAP)
August 7, 2026
Company name:
NAKABAYASHI CO., LTD.
Stock exchange listings: Tokyo
Stock code:
7987
URL: https://www.nakabayashi.co.jp/
Representative:
President and Representative Director
Kazuyoshi Nakabayashi
Inquiries:
Director, Senior Executive Officer and
General Manager of Administration
Division
Shunsuke Nagai
Scheduled date to commence dividend payments:
–
Preparation of supplementary material on financial results:
No
Holding of financial results meeting:
No
TEL 06-6943-5555
(Amounts less than one million yen are rounded down)
- Consolidated financial results for the three months ended June 30, 2026 (from April 1, 2026 to June 30,
(1) Consolidated operating results (cumulative)
Net sales
Three months ended
Percentages indicate year-on-year changes
Operating profit
Millions of yen
% Millions of yen
Profit attributable to
owners of parent
Ordinary profit
% Millions of yen
% Millions of yen
%
June 30, 2026
14,092
(1.0)
527
(5.1)
652
(3.0)
445
(24.1)
June 30, 2025
14,235
1.0
555
479.9
672
154.4
587
288.6
(Note) Comprehensive income:
Three months ended June 30, 2026:
Three months ended June 30, 2025:
Earnings per share
Three months ended
¥772 million
¥399 million
[93.3%]
[86.5%]
Diluted earnings
per share
Yen
Yen
June 30, 2026
16.43
–
June 30, 2025
21.38
–
(2) Consolidated financial position
Total assets
As of
Net assets
Equity ratio
Millions of yen
Millions of yen
June 30, 2026
52,552
31,397
59.4
March 31, 2026
54,080
30,950
56.9
(Reference) Equity: As of June 30, 2026:
As of March 31, 2026:
¥31,223 million
¥30,785 million
%
- Cash dividends
Annual dividends per share
1st quarter-end
2nd quarter-end
Yen
Year ended March 31,
2026
Year ending March 31,
2027
3rd quarter-end
Yen
–
Fiscal year-end
Yen
Total
Yen
Yen
10.00
–
12.00
22.00
10.00
–
12.00
22.00
–
Year ending March 31,
2027 (Forecast)
(Note) Revisions of dividend forecasts from recently announced figures: No
- Forecast of consolidated financial results for the year ending March 31, 2027 (from April 1, 2026 to
March 31, 2027)
Net sales
Percentages indicate year-on-year changes
Profit attributable to
Earnings
Ordinary profit
owners of parent
per share
Operating profit
Millions of
yen
%
Millions of
yen
%
Millions of
yen
%
Millions of
yen
%
Yen
Six months ending
September 30, 2026
29,000
2.8
1,300
27.5
1,400
16.0
700
205.4
25.81
Full year
66,000
7.1
3,300
14.8
3,650
13.4
1,950
0.8
71.89
(Note) Revisions of forecasts of financial results from recently announced figures: No
Notes
(1) Significant changes in the scope of consolidation during the three months ended June 30, 2026:
Newly included: - companies (Company name)
Excluded:
No
(2) Application of special accounting methods for preparing quarterly consolidated financial statements: No
(3) Changes in accounting policies, changes in accounting estimates, and restatement of prior period financial
statements
Changes in accounting policies due to revisions to accounting standards and other regulations:
No
Changes in accounting policies due to other reasons:
No
Changes in accounting estimates:
No
Restatement of prior period financial statements:
No
(4) Number of issued shares (common shares)
Total number of issued shares at the end of the period (including treasury shares)
As of June 30, 2026
28,794,294 shares As of March 31, 2026
28,794,294 shares
Number of treasury shares at the end of the period
As of June 30, 2026
1,670,173 shares As of March 31, 2026
1,670,173 shares
Average number of shares during the period (cumulative from the beginning of the fiscal year)
Three months ended June 30, 2026
27,124,121 shares Three months ended June 30, 2025
27,465,266 shares
- Review of the Japanese-language originals of the attached quarterly consolidated financial statements by
certified public accountants or an auditing firm: No
- Explanation and other special notes concerning the appropriate use of business performance forecasts
(Cautionary Statement with Respect to Forward-Looking Statements)
The earnings forecasts and other forward-looking statements herein are based on information currently
available to the Company and on certain assumptions deemed to be reasonable. These statements do not purport
that the Company pledges to realize such statements. For the assumptions underlying the earnings forecasts and
cautions concerning the earnings forecasts, please refer to “1. Overview of Operating Results, (3) Explanation
of Consolidated Earnings Forecasts and Other Forward-Looking Information” on page 4 of the Accompanying
Materials.
○ Accompanying Materials – Contents
- Overview of Operating Results ........................................................................................................................... 2
(1) Overview of Operating Results for the Period under Review....................................................................... 2
(2) Overview of Financial Position for the Period under Review ...................................................................... 3
(3) Explanation of Consolidated Earnings Forecasts and Other Forward-Looking Information ....................... 4
- Quarterly Consolidated Financial Statements and Major Notes ......................................................................... 5
(1) Quarterly Consolidated Balance Sheets ........................................................................................................ 5
(2) Quarterly Consolidated Statements of Income and Quarterly Consolidated Statements of
Comprehensive Income ................................................................................................................................ 7
(3) Notes to Quarterly Consolidated Financial Statements ................................................................................ 9
(Notes on Segment Information) .................................................................................................................. 9
(Notes on Significant Changes in the Amount of Shareholders’ Equity) .................................................... 10
(Notes on the Going Concern Assumption) ................................................................................................ 10
(Notes on Quarterly Consolidated Statements of Cash Flows)................................................................... 10
- Overview of Operating Results
(1) Overview of Operating Results for the Period under Review
During the first three months under review, the Japanese economy continued its gradual recovery, supported
by steady capital investment, an improvement in the employment and income environment, and inbound
tourism demand. On the other hand, uncertainty in the economic outlook continues due to the slowdown in the
Chinese economy and trends in trade policy, the U.S. tariff policy, increased geopolitical risks primarily
concerning Ukraine and the Middle East leading to fluctuations in resource prices, and rising import prices
driven by the further weakening of the yen. Going forward, the economic outlook is likely to be determined
by whether wage growth consistently exceeds inflation and leads to an expansion of personal consumption.
The business environment surrounding the Company group (the “Group”) requires us to adapt to major
changes in lifestyles and corporate activities. Under the purpose of “It’s for SMILE,” the Group is striving to
enhance its corporate value by creating valuable products and services that are appropriate for an age of 100year lifespans.
Under these circumstances, in May 2024 we formulated our fourth medium-term management plan (from
April 1, 2024 to March 31, 2027), “Go on going.” In this plan, based on the three basic policies of “reinforce
earning capacity,” “promote growth potential,” and “improve shareholder value,” we will work to achieve it
mainly by promoting DX, creating product services that capture changing consumption trends, and optimizing
the allocation of management resources. In regard to promoting DX, in particular, tangible synergy effects
have begun to emerge, such as the streamlining and enhancement of sales activities leading to new orders, as a
result of utilizing digital technologies in each business.
During the three months under review, we worked to reduce manufacturing costs through the consolidation of
manufacturing operations at NAKABAYASHI FACTORY CO., LTD. In terms of order intake, although there
was a decrease in sales and profits due to the reactionary effect of projects with a large surge in demand from
the previous fiscal year, the Group continued to focus on selecting projects with an emphasis on profitability
and profit margins. Furthermore, in product sales, we made efforts to absorb cost increases due to the
weakening yen and other factors by developing new products and revising sales prices. As a result, net sales
amounted to ¥14,092 million, operating profit was ¥527 million, ordinary profit was ¥652 million, and profit
attributable to owners of parent was ¥445 million.
The Group’s operating results for the three months under review are as follows.
Net sales
¥14,092 million (Down 1.0% year on year)
Operating profit
¥527 million (Down 5.1% year on year)
Ordinary profit
¥652 million (Down 3.0% year on year)
Profit attributable to owners of parent
¥445 million (Down 24.1% year on year)
Operating results by segment are as follows.
(i) Business Process Solutions Business
In BPO services, although there was a decrease in the value of orders received due to intensified bidding
competition, we made efforts to acquire new orders through continuous proposal-based projects, shareholder
benefit services (handling everything from application acceptance to product delivery), highly profitable web
production-related projects, and expanded sales of scanning services.
In the area of pocket notebooks, envelopes, and general printed materials, overall net sales and profit
decreased despite orders for highly creative products with a high gross margin as well as price revisions.
Seal-related and label-related products performed well due to increased sales of labels and improved profit
margins resulting from productivity improvements.
In the library solutions, we undertake highly profitable designated management (library management)
projects. While orders for binding-related business have decreased, we are seeing improved profit margins due
to a revision of sales prices.
For graduation album-related products, profitability showed an improving trend as a result of the integration
of manufacturing departments implemented in past fiscal years.
Consequently, net sales in this business amounted to ¥6,497 million (down 6.7% year on year), and operating
profit amounted to ¥158 million (down 21.8% year on year).
(ii) Consumer Communications Business
In product sales, net sales remained strong due to factors such as an increase in large OEM orders, product
introductions accompanying the opening of new large stores, and an increase in the number of new products
listed on the web. Although net sales of existing staple products at home improvement stores decreased, sales
of new products such as the “NAKAMERA Series” and the “Quick Lamy A3 Pro” laminator performed well,
resulting in increased revenue. However, due to rising procurement costs, profits fell below the same period of
the previous year.
In shredder sales, sales of new personal shredder models performed well. In addition to increased sales of
large shredders, the revision of sales prices for consumables and the provision of maintenance services also
remained strong.
Sales of e-commerce related products performed well, and profitability improved through more efficient site
operations. In the office furniture field, net sales increased due to an improvement in the repeat rate and sales
per customer, but profits decreased due to rising costs caused by high prices. The e-commerce development of
own products expanded steadily.
In the stuffed toys business, we are promoting the expansion of sales channels to Europe, the U.S., Southeast
Asia, and the Middle East, while also focusing on our existing markets in Hong Kong and China.
Consequently, net sales in this business amounted to ¥7,242 million (up 4.1% year on year), and operating
profit amounted to ¥367 million (down 15.6% year on year).
(iii) Energy Business
Wooden biomass power generation achieved stable operation and increased revenue and profits due to an
increase in the procurement of woodchips. Solar power generation performed well.
Consequently, net sales in this business amounted to ¥337 million (up 13.2% year on year), while operating
profit amounted to ¥25 million (operating loss of ¥25 million in the same period of the previous fiscal year).
(iv) Others
The Vegetable Plant Business and the Garlic Farm Business, etc. posted net sales of ¥14 million (down 29.4%
year on year) and operating loss of ¥3 million (operating profit of ¥7 million in the same period of the
previous fiscal year).
(2) Overview of Financial Position for the Period under Review
(Assets)
Current assets decreased by ¥1,801 million from the end of the previous fiscal year to ¥26,178 million. This
was mainly due to decreases of ¥2,327 million in notes and accounts receivable - trade and ¥1,013 million in
cash and deposits, despite an increase of ¥866 million in merchandise and finished goods.
Non-current assets increased by ¥273 million from the end of the previous fiscal year to ¥26,373 million. This
was mainly due to a decrease of ¥134 million in machinery, equipment and vehicles despite an increase of
¥416 million in investment securities.
As a result, total assets as of June 30, 2026 decreased by ¥1,527 million from the end of the previous fiscal
year to ¥52,552 million.
(Liabilities)
Current liabilities increased by ¥504 million from the end of the previous fiscal year to ¥13,770 million. This
was mainly due to decreases of ¥494 million in accounts payable - other and ¥479 million in income taxes
payable despite an increase of ¥1,623 million in short-term borrowings.
Non-current liabilities decreased by ¥2,479 million from the end of the previous fiscal year to ¥7,384 million.
This was mainly due to a decrease of ¥2,689 million in long-term borrowings, despite an increase of ¥243
million in deferred tax liabilities.
As a result, total liabilities as of June 30, 2026 decreased by ¥1,974 million from the end of the previous fiscal
year to ¥21,155 million.
(Net assets)
Total net assets increased by ¥446 million from the end of the previous fiscal year to ¥31,397 million. This
was mainly due to increases of ¥282 million in valuation difference on available-for-sale securities and ¥120
million in retained earnings.
As a result, the equity ratio was 59.4%, up 2.5 percentage points from the end of the previous fiscal year.
(3) Explanation of Consolidated Earnings Forecasts and Other Forward-Looking Information
We have not changed our earnings forecasts since the announcement we made on May 8, 2026.
- Quarterly Consolidated Financial Statements and Major Notes
(1) Quarterly Consolidated Balance Sheets
(Millions of yen)
As of March 31, 2026
Assets
Current assets
Cash and deposits
Notes and accounts receivable - trade
Merchandise and finished goods
Work in process
Raw materials and supplies
Other
Allowance for doubtful accounts
Total current assets
Non-current assets
Property, plant and equipment
Buildings and structures, net
Machinery, equipment and vehicles, net
Land
Construction in progress
Other, net
Total property, plant and equipment
Intangible assets
Other
Total intangible assets
Investments and other assets
Investment securities
Retirement benefit asset
Deferred tax assets
Other
Allowance for doubtful accounts
Total investments and other assets
Total non-current assets
Total assets
As of June 30, 2026
6,796
9,423
6,515
1,121
1,816
2,308
(1)
27,980
5,782
7,096
7,381
1,537
2,090
2,292
(1)
26,178
6,275
3,313
8,970
29
200
18,790
6,190
3,179
8,970
36
214
18,590
204
204
187
187
3,756
2,364
230
762
(9)
7,104
26,100
54,080
4,172
2,382
218
829
(8)
7,594
26,373
52,552
(Millions of yen)
As of March 31, 2026
Liabilities
Current liabilities
Notes and accounts payable - trade
Short-term borrowings
Accounts payable - other
Accrued expenses
Income taxes payable
Provision for bonuses
Other
Total current liabilities
Non-current liabilities
Long-term borrowings
Retirement benefit liability
Deferred tax liabilities
Other
Total non-current liabilities
Total liabilities
Net assets
Shareholders’ equity
Share capital
Capital surplus
Retained earnings
Treasury shares
Total shareholders’ equity
Accumulated other comprehensive income
Valuation difference on available-for-sale securities
Deferred gains or losses on hedges
Foreign currency translation adjustment
Remeasurements of defined benefit plans
Total accumulated other comprehensive income
Non-controlling interests
Total net assets
Total liabilities and net assets
As of June 30, 2026
3,216
4,250
2,409
395
612
669
1,711
13,265
3,200
5,874
1,914
397
132
400
1,850
13,770
6,362
2,522
390
587
9,863
23,129
3,673
2,513
633
563
7,384
21,155
6,666
8,944
13,398
(865)
28,143
6,666
8,944
13,518
(865)
28,264
1,560
28
62
989
2,641
165
30,950
54,080
1,843
80
75
960
2,959
174
31,397
52,552
(2) Quarterly Consolidated Statements of Income and Quarterly Consolidated Statements of
Comprehensive Income
Quarterly Consolidated Statements of Income
(Millions of yen)
Three months ended
June 30, 2025
Net sales
Cost of sales
Gross profit
Selling, general and administrative expenses
Operating profit
Non-operating income
Rental income
Dividend income
Insurance claim income
Other
Total non-operating income
Non-operating expenses
Interest expenses
Miscellaneous expenses of assets for rent
Other
Total non-operating expenses
Ordinary profit
Extraordinary income
Gain on sale of non-current assets
Gain on reversal of foreign currency translation
Total extraordinary income
Extraordinary losses
Loss on disposal of non-current assets
Loss on sale of investment securities
Total extraordinary losses
Profit before income taxes
Income taxes - current
Income taxes - deferred
Total income taxes
Profit
Profit (loss) attributable to non-controlling interests
Profit attributable to owners of parent
Three months ended
June 30, 2026
14,235
10,421
3,813
3,258
555
14,092
10,292
3,800
3,273
527
38
49
45
38
172
32
51
43
37
165
26
9
20
55
672
24
10
6
40
652
37
174
211
0
–
0
0
0
0
883
111
195
307
576
(10)
587
1
–
1
650
84
111
196
454
8
445
Quarterly Consolidated Statements of Comprehensive Income
(Millions of yen)
Three months ended
June 30, 2025
Profit
Other comprehensive income
Valuation difference on available-for-sale securities
Deferred gains or losses on hedges
Foreign currency translation adjustment
Remeasurements of defined benefit plans, net of tax
Total other comprehensive income
Comprehensive income
Comprehensive income attributable to
Comprehensive income attributable to owners of parent
Comprehensive income attributable to non-controlling
interests
Three months ended
June 30, 2026
576
454
63
(52)
(183)
(4)
(176)
399
282
51
12
(29)
317
772
410
763
(10)
8
(3) Notes to Quarterly Consolidated Financial Statements
(Notes on Segment Information)
Three months ended June 30, 2025 (April 1, 2025 to June 30, 2025)
- Information Concerning Monetary Amounts for Net Sales, and Profit or Loss by Reportable Segment
Reportable segment
Consumer
Business Process
Communications
Solutions Business
Business
Energy Business
Total
Others
(Note) 1
Total
Adjusted
amount
(Note) 2
(Millions of yen)
Amount on
quarterly
consolidated
statements of
income
(Note) 3
Net sales
Net sales to external
customers
Inter-segment net sales or
transfers
Total
Segment profit (loss)
Notes
6,962
6,954
297
14,214
20
14,235
–
14,235
350
173
–
524
2
527
(527)
–
7,313
7,128
297
14,739
23
14,762
(527)
14,235
202
435
(25)
613
7
620
(64)
555
-
The “Others” category is business segments not included in the reportable segments, including the Vegetable Plant
Business and the Garlic Farm Business.
-
Adjusted amount of (¥64 million) for segment profit (loss) includes inter-segment transaction eliminations of ¥30
million, an adjustment of ¥6 million for inventories, and company-wide expenses of (¥101 million) that are not allocated
to reportable segments. Company-wide expenses are primarily selling, general and administrative expenses that do not
belong to reportable segments.
-
Segment profit (loss) is adjusted for operating profit on the quarterly consolidated statements of income.
-
Impairment Losses on Non-current Assets or Goodwill, etc. by Reportable Segment
Not applicable.
Three months ended June 30, 2026 (April 1, 2026 to June 30, 2026)
- Information Concerning Monetary Amounts for Net Sales, and Profit or Loss by Reportable Segment
(Millions of yen)
Amount on
quarterly
consolidated
statements of
income
(Note) 3
Reportable segment
Consumer
Business Process
Communications
Solutions Business
Business
Energy Business
Total
Others
(Note) 1
Total
Adjusted
amount
(Note) 2
Net sales
Net sales to external
customers
6,497
7,242
337
14,077
14
14,092
–
14,092
Inter-segment net sales or
transfers
363
95
–
459
2
461
(461)
–
Total
6,861
7,338
337
14,537
16
14,553
(461)
14,092
158
367
25
552
(3)
548
(21)
527
Segment profit (loss)
Notes
-
The “Others” category is business segments not included in the reportable segments, including the Vegetable Plant
Business and the Garlic Farm Business.
-
Adjusted amount of (¥21 million) for segment profit (loss) includes inter-segment transaction eliminations of ¥54
million, an adjustment of ¥0 million for inventories, and company-wide expenses of (¥77 million) that are not allocated
to reportable segments. Company-wide expenses are primarily selling, general and administrative expenses that do not
belong to reportable segments.
-
Segment profit (loss) is adjusted for operating profit on the quarterly consolidated statements of income.
-
Impairment Losses on Non-current Assets or Goodwill, etc. by Reportable Segment
Not applicable.
(Notes on Significant Changes in the Amount of Shareholders’ Equity)
Not applicable.
(Notes on the Going Concern Assumption)
Not applicable.
(Notes on Quarterly Consolidated Statements of Cash Flows)
Quarterly consolidated statements of cash flows for the three months under review are not prepared.
In addition, the amounts of depreciation (including amortization related to intangible assets) for the first three
months of the current and previous fiscal years are as stated below.
(Millions of yen)
Three months ended
June 30, 2025
Depreciation
382
Three months ended
June 30, 2026
326





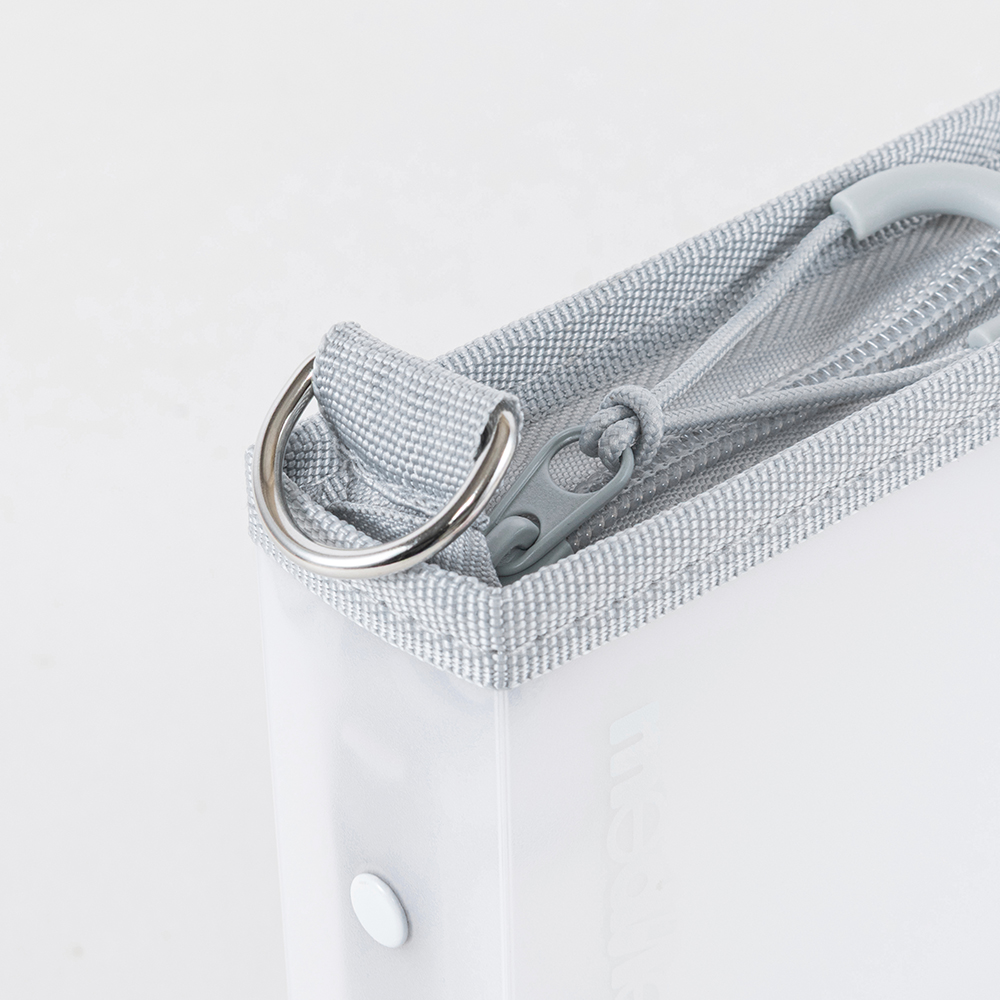
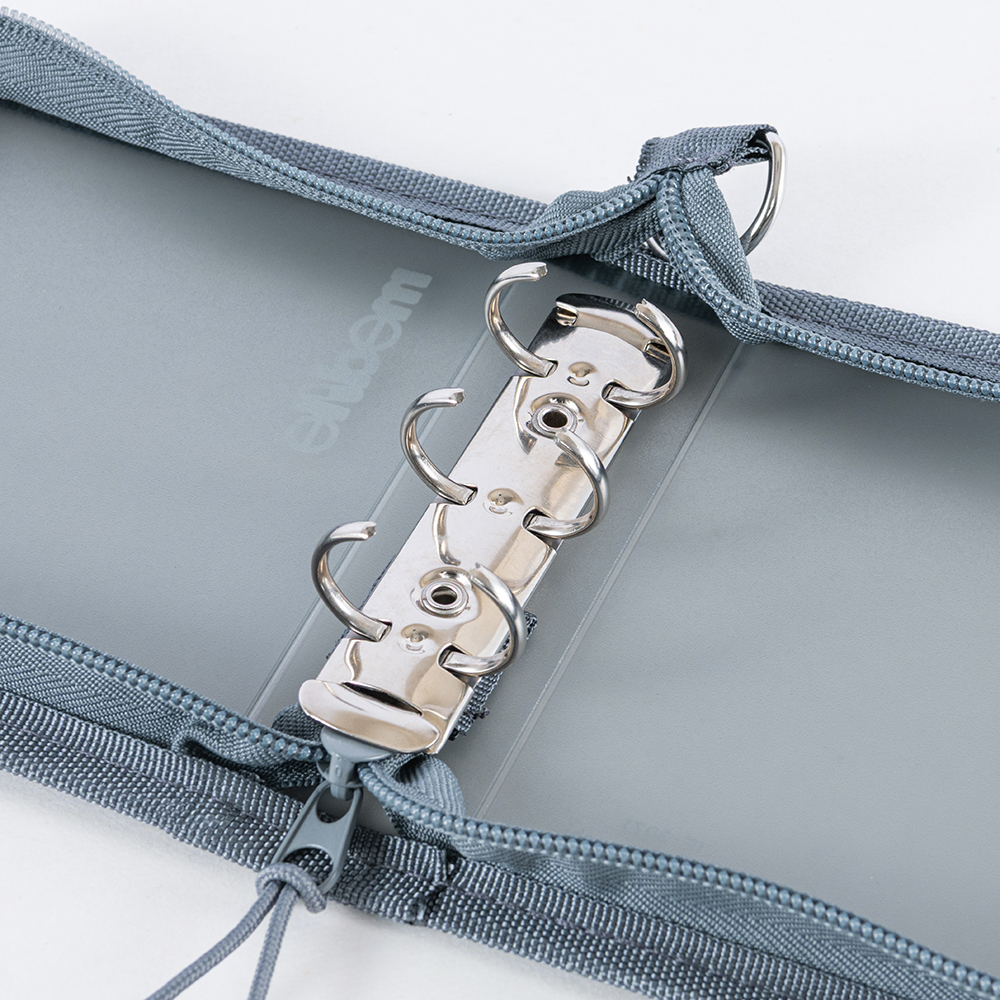
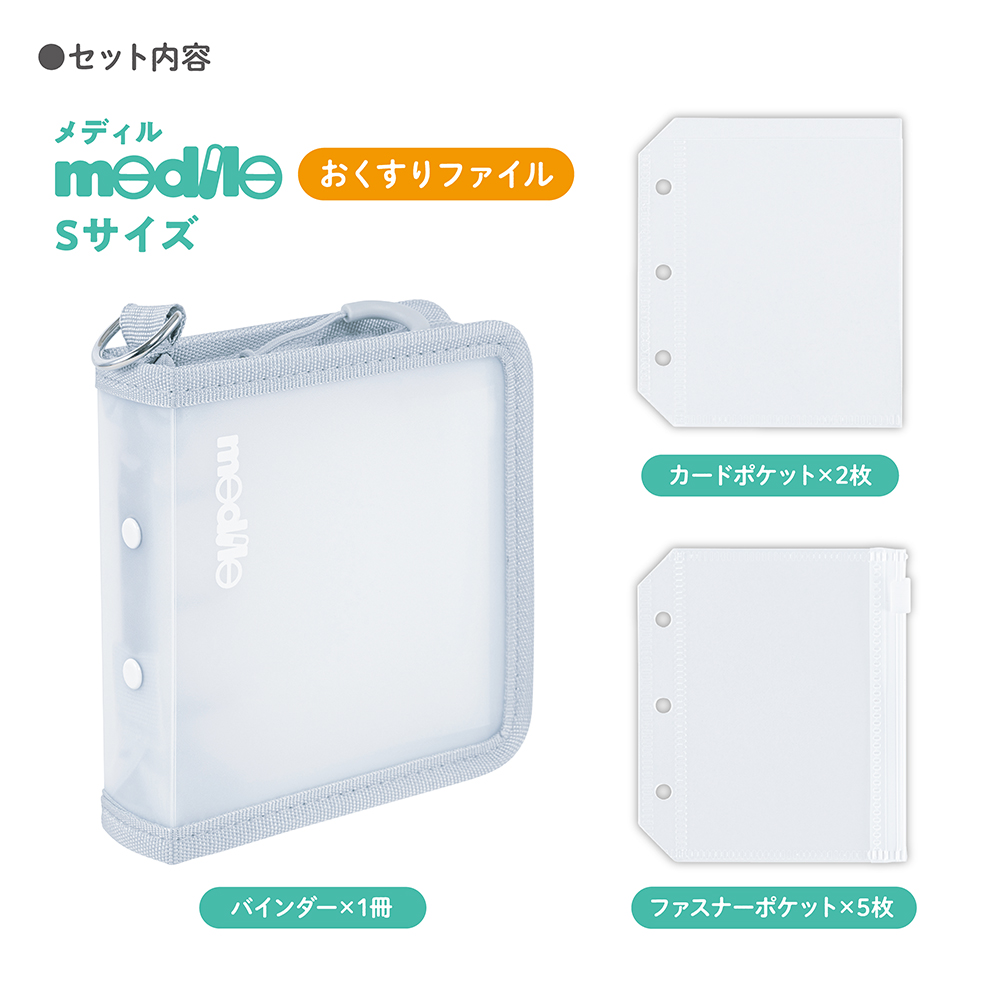
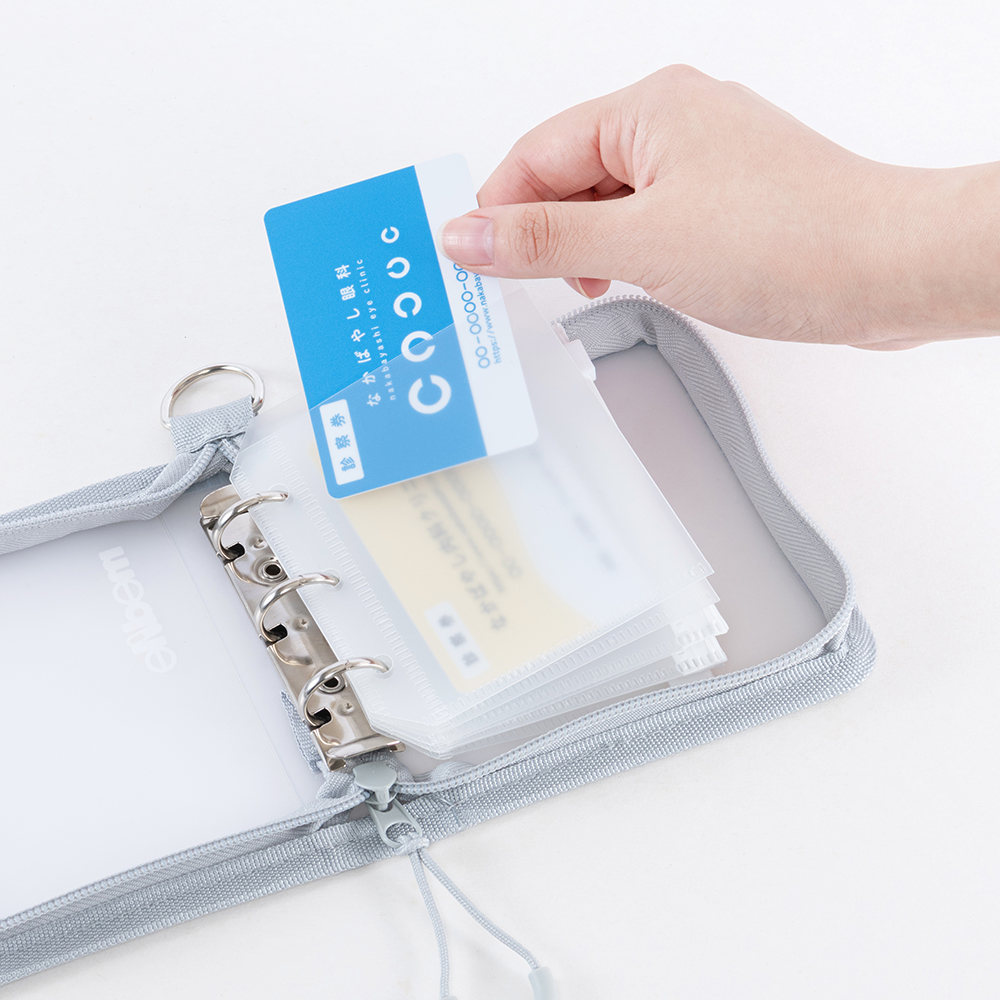





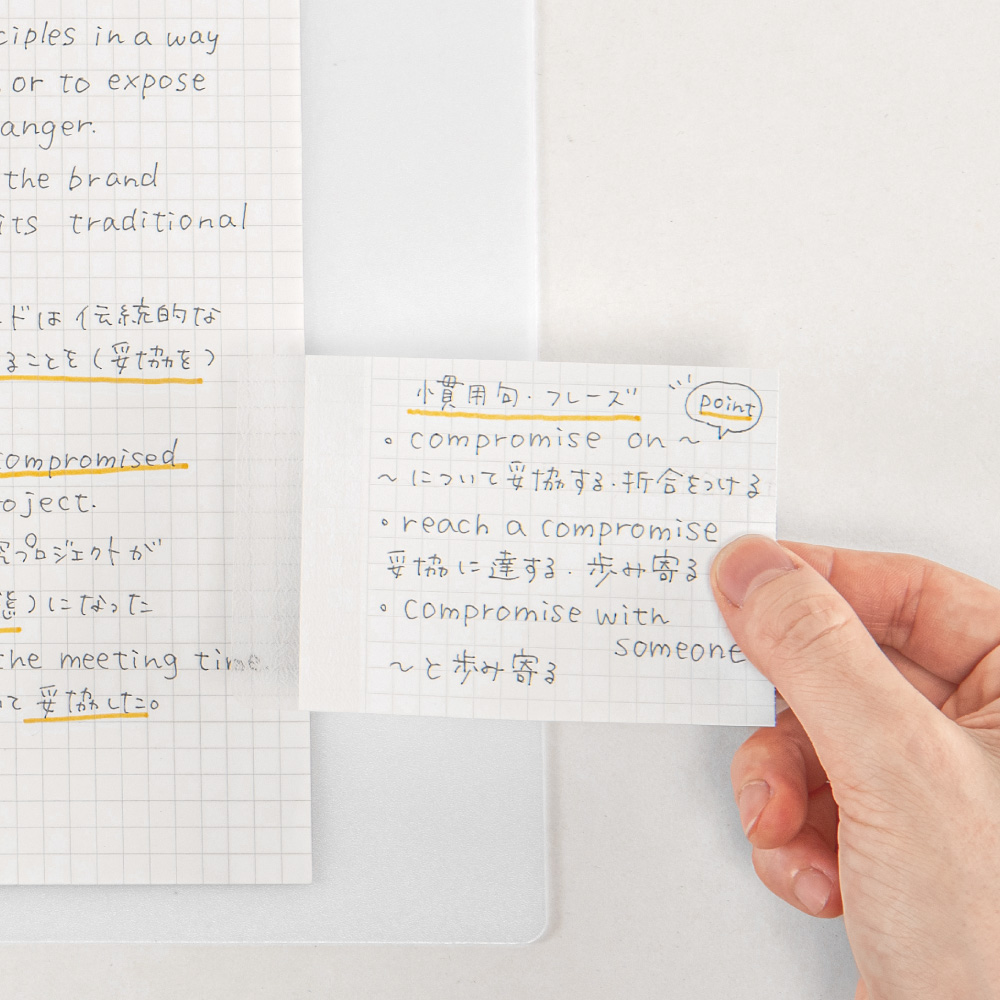















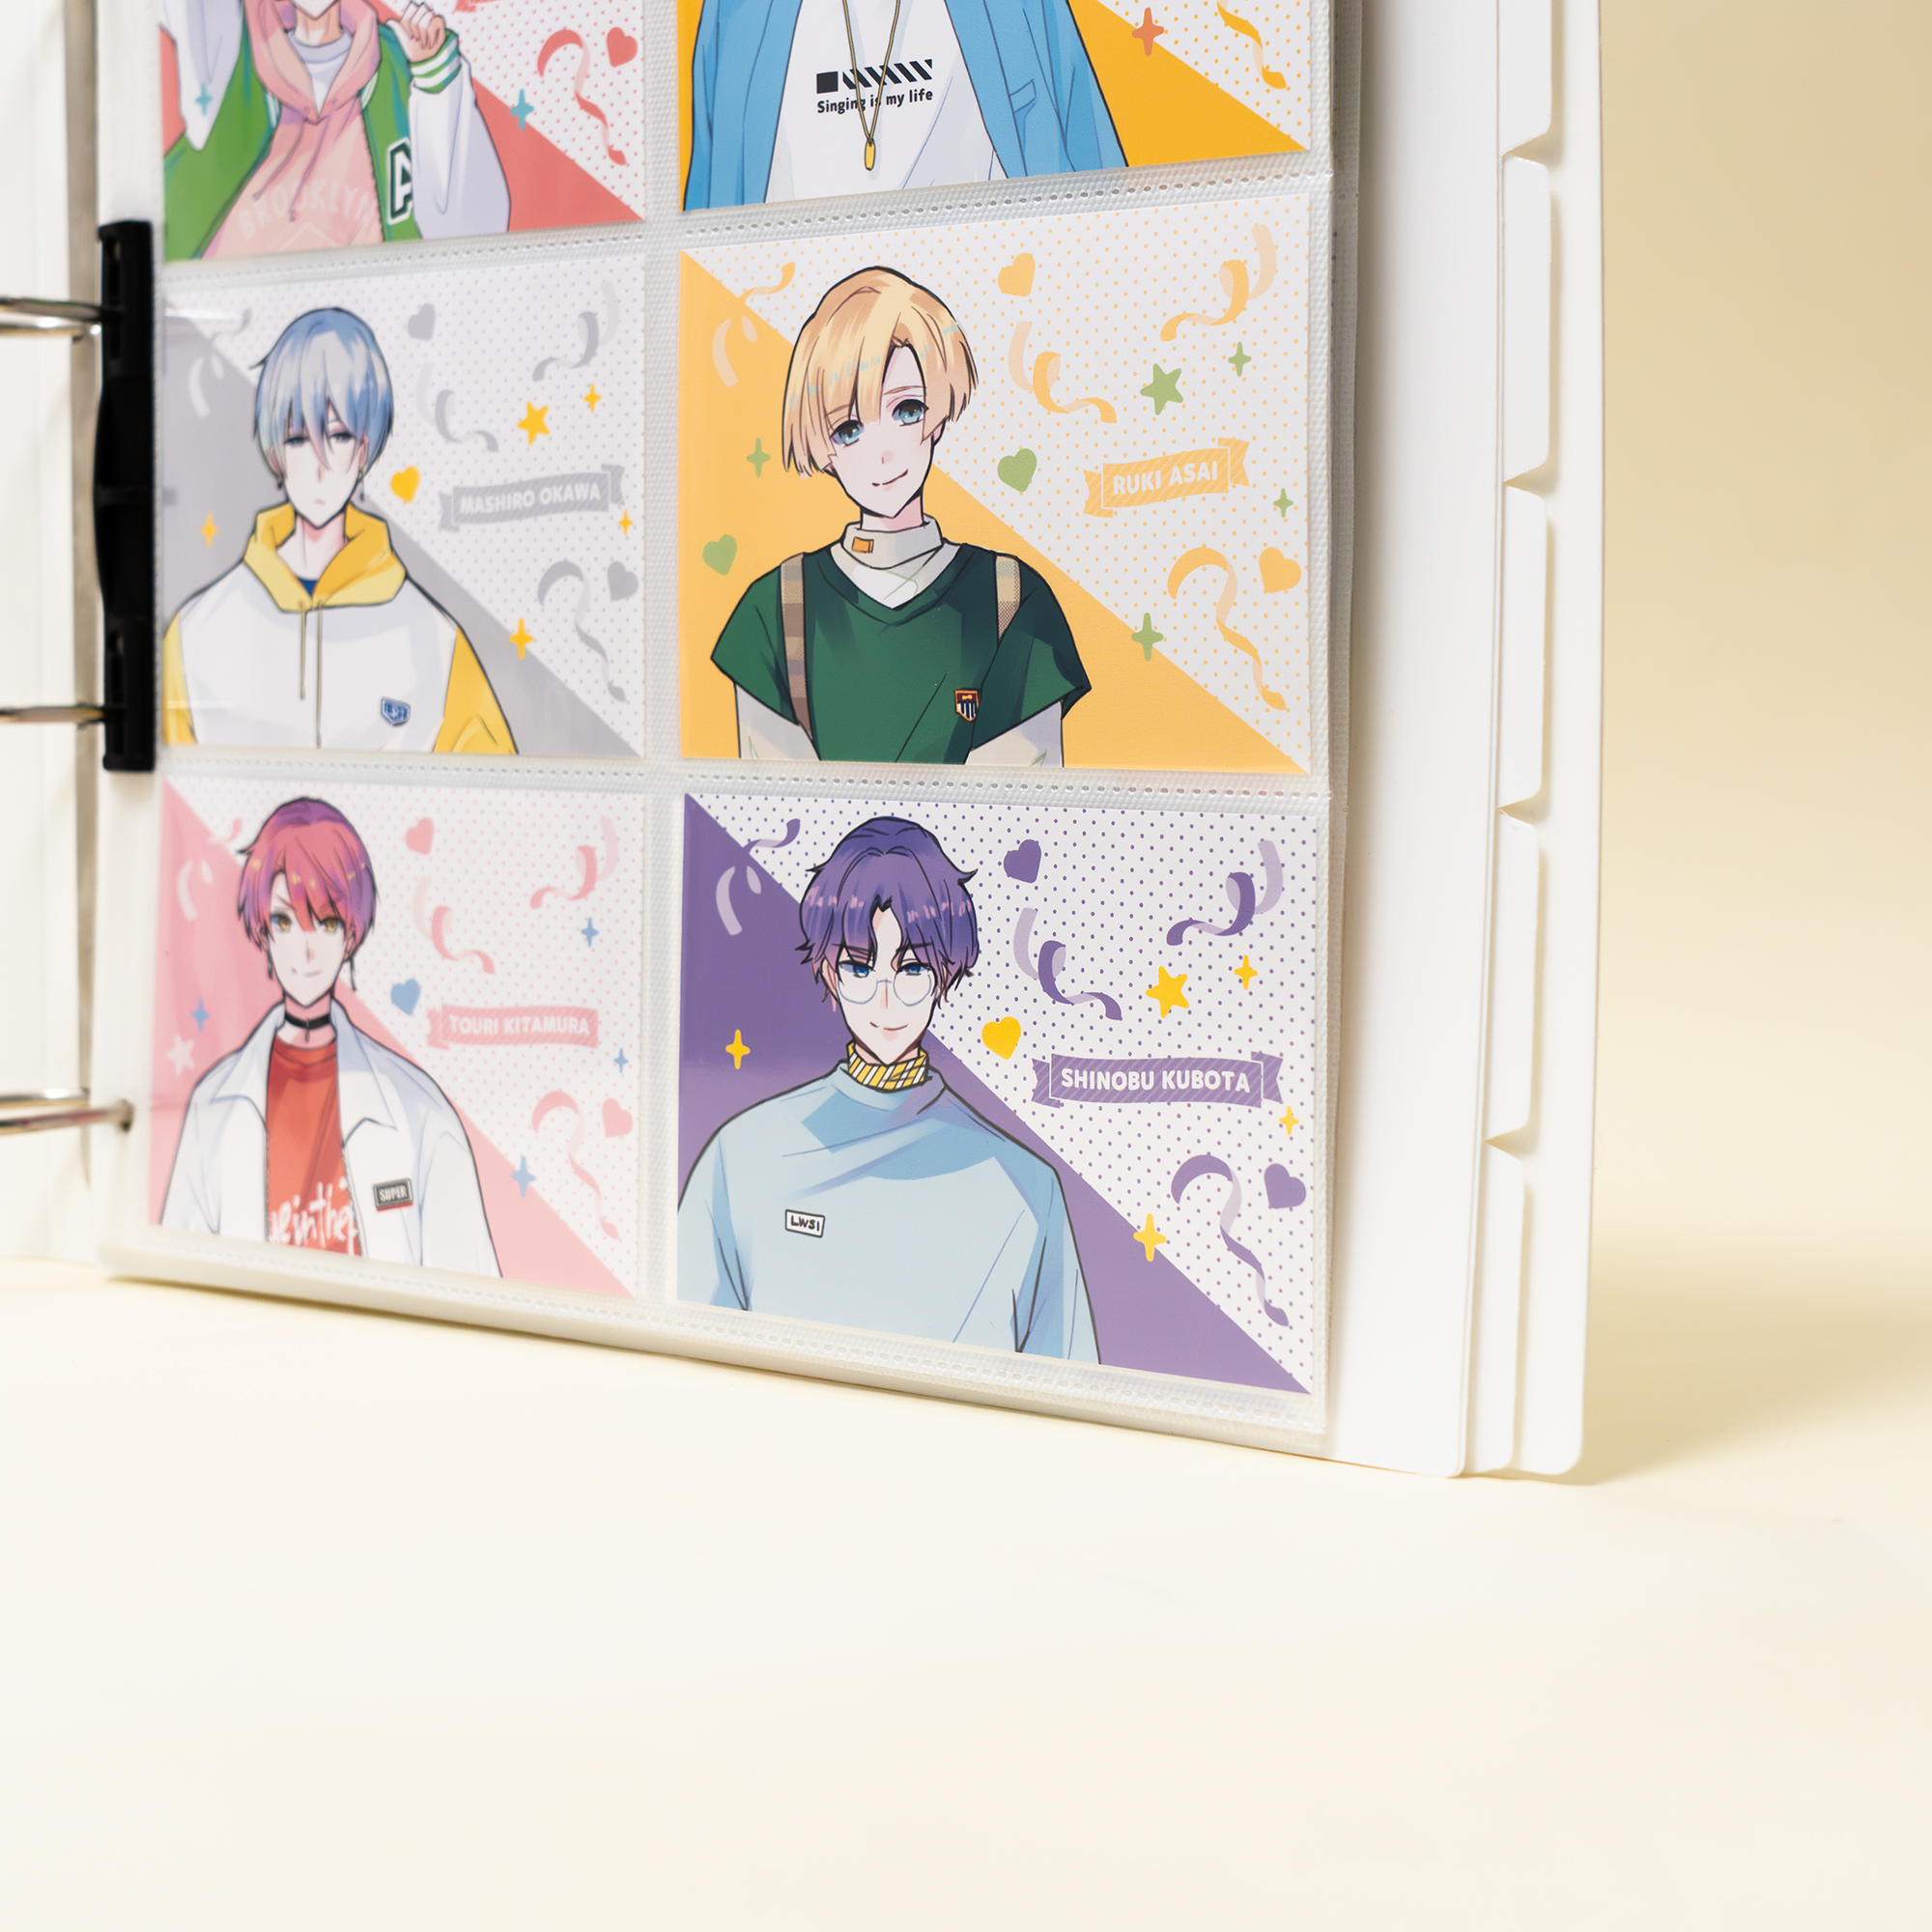





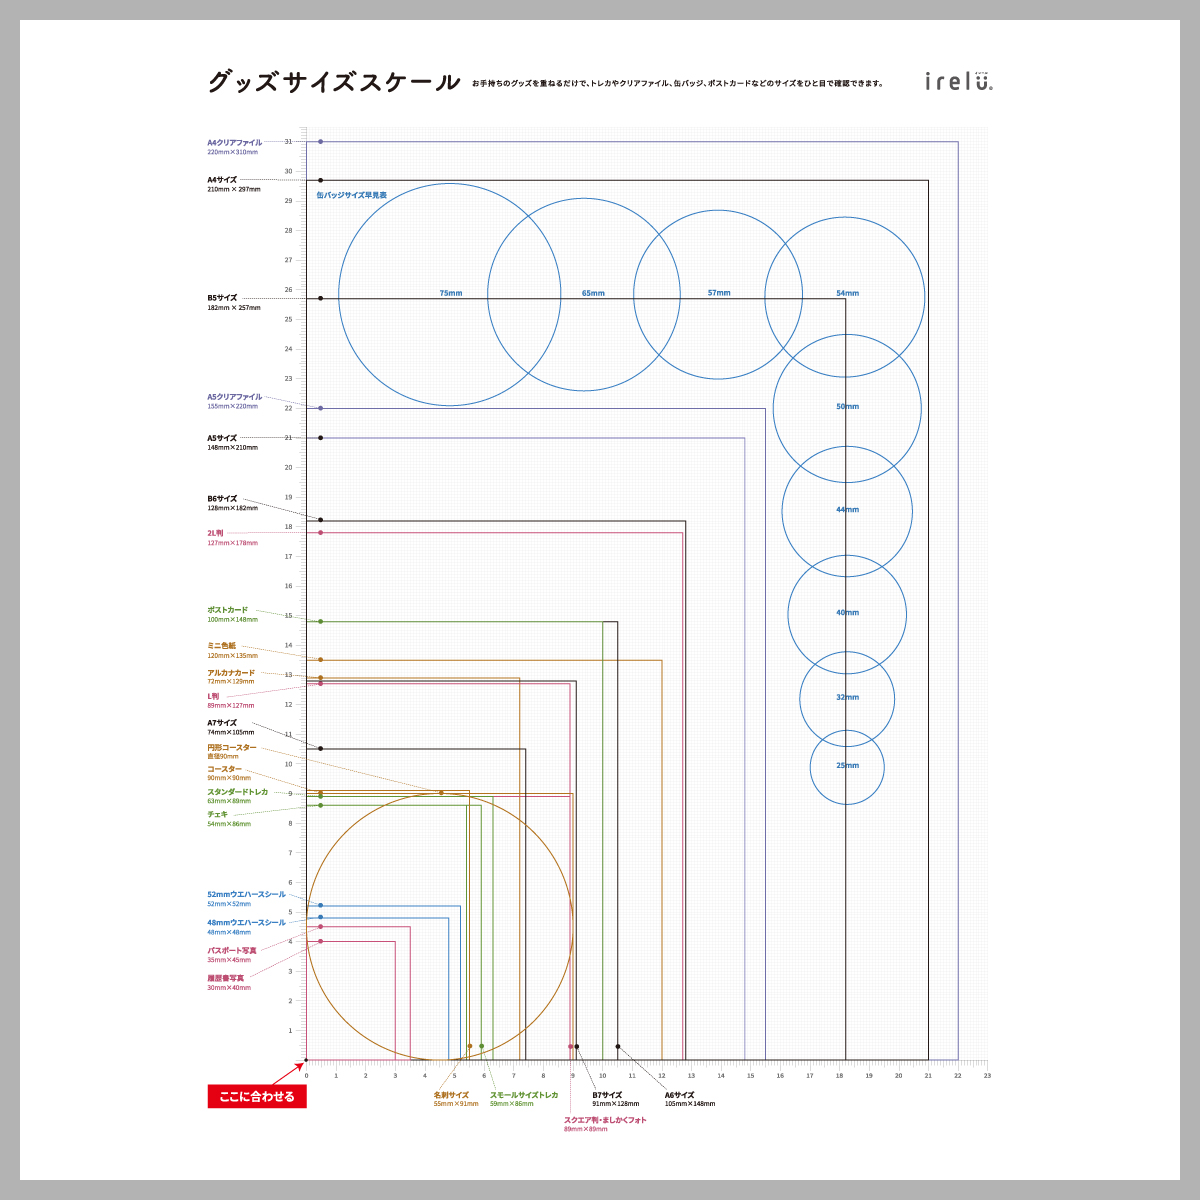

 「irelu®」は、総フォロワー数約10万人を持つ推し活収納系インフルエンサーmico氏が監修する「あなたの宝物をいれる」をコンセプトにしたライフスタイルブランドです。
 推し活応援YouTubeチャンネル「mico's journal」(https://youtube.com/c/micosjournal)の運営者。














 アルバム
 フォトフレーム・
 シュレッダ・
 収納・整理用品
 ファニチャー
 プリンタ用紙
 ノート・紙製品
 ファイル・
 筆記具
 パソコン周辺機器
 スマートフォン・
 ゲーム関連
 デジタルカメラ関連
 ボード用品
 事務用品
 防災・
 シルバー
 デジタル文具
 キャラクター・
 学童用品