EDINET提出書類 株式会社イトーキ(E02371) 半期報告書 【表紙】 【提出書類】 半期報告書 【根拠条文】 金融商品取引法第24条の5第1項の表の第1号 【提出先】 関東財務局長 【提出日】 2026年8月6日 【中間会計期間】 第77期中(自 【会社名】 株式会社イトーキ…
EDINET提出書類
株式会社イトーキ(E02371)
半期報告書
【表紙】
【提出書類】
半期報告書
【根拠条文】
金融商品取引法第24条の5第1項の表の第1号
【提出先】
関東財務局長
【提出日】
2026年8月6日
【中間会計期間】
第77期中(自
【会社名】
株式会社イトーキ
【英訳名】
ITOKI CORPORATION
【代表者の役職氏名】
代表取締役社長
【本店の所在の場所】
大阪市中央区淡路町一丁目6番11号
2026年1月1日
湊
至
2026年6月30日)
宏司
(同所は登記上の本店所在地であり、実際の業務は「最寄りの連絡場所」
で行っております。)
【電話番号】
該当事項はありません。
【事務連絡者氏名】
該当事項はありません。
【最寄りの連絡場所】
東京都中央区日本橋二丁目5番1号
【電話番号】
東京03(6910)3910(代表)
【事務連絡者氏名】
取締役常務執行役員経営企画本部長
【縦覧に供する場所】
株式会社東京証券取引所
田中
(東京都中央区日本橋兜町2番1号)
株式会社イトーキ東京本社
(東京都中央区日本橋二丁目5番1号)
1/25
有美
EDINET提出書類
株式会社イトーキ(E02371)
半期報告書
第一部【企業情報】
第1 【企業の概況】
1 【主要な経営指標等の推移】
回次
会計期間
第76期
中間連結会計期間
自 2025年1月1日
至 2025年6月30日
第77期
中間連結会計期間
自 2026年1月1日
至 2026年6月30日
第76期
自
至
2025年1月1日
2025年12月31日
売上高
(百万円)
79,244
86,316
153,682
経常利益
(百万円)
10,497
11,580
13,739
親会社株主に帰属する
中間(当期)純利益
(百万円)
6,960
7,748
9,382
中間包括利益又は包括利益
(百万円)
7,011
8,647
9,837
純資産額
(百万円)
53,983
61,969
56,813
総資産額
(百万円)
126,248
130,144
130,724
1株当たり中間(当期)純利益
(円)
141.26
156.77
190.17
潜在株式調整後1株当たり
中間(当期)純利益
(円)
−
−
−
自己資本比率
(%)
42.7
47.5
43.4
営業活動による
(百万円)
4,060
4,003
8,942
キャッシュ・フロー
投資活動による
(百万円)
△2,476
△1,180
△3,847
キャッシュ・フロー
財務活動による
(百万円)
978
△1,596
△5,941
キャッシュ・フロー
現金及び現金同等物の
(百万円)
24,054
22,172
20,820
中間期末(期末)残高
(注) 1.当社は中間連結財務諸表を作成しておりますので、提出会社の主要な経営指標等の推移については記載し
ておりません。
2.潜在株式調整後1株当たり中間(当期)純利益については、潜在株式が存在しないため記載しておりませ
ん。
2 【事業の内容】
当中間連結会計期間において、当社グループ(当社及び当社の関係会社)が営む事業の内容について、重要な変
更はありません。
2/25
EDINET提出書類
株式会社イトーキ(E02371)
半期報告書
第2 【事業の状況】
1 【事業等のリスク】
当中間連結会計期間において、前事業年度の有価証券報告書に記載した「事業等のリスク」について変更があった
項目は、以下のとおりです。
なお、文中の将来に関する事項は、当中間連結会計期間の末日現在において当社グループが判断したものでありま
す。
また、以下の見出しに関する事項は、前事業年度の有価証券報告書における「第一部
況
3
企業情報
第2
事業の状
事業等のリスク」に記載した、当社グループが、リスク軽減策を継続的に実施している主なリスクの項目番
号に対応したものです。
当社グループは、事業活動全般にわたって生じ得るさまざまなリスクを想定した対策を立て、リスクの発生可能性
や影響の低減を図るなど、適切な管理を行うとともに、万一リスクが顕在化した場合の被害・損害の極小化と再発防
止のためのリスクマネジメントに取り組んでいます。さまざまな要因を想定して洗い出したリスクに対して、その発
生可能性、影響度をそれぞれ4段階で分類し、これらを掛け合わせた点数により評価を行います。
当社グループでは、「イトーキグループリスク管理基本規程」に基づき、社長を委員長とするリスク管理委員会を
設置し、リスクマネジメントの実効性を確保しております。リスク管理委員会は、リスク管理方針の策定とリスク評
価、対策レベルの決定を行い、下位に位置するコンプライアンス委員会、情報セキュリティ委員会や主管部門に具体
的な対策を指示します。
当社グループでは、全体的リスクマネジメントのしくみをより実効性の高いものへと見直しを進め、当連結会計年
度においては、リスク評価に基づき、特に点数が高いリスク項目から、前事業年度と異なり次の6つをリスク管理委
員会で重点的に取り上げるべきリスクとして選定し、それぞれのリスクに対する対策の実効性を高めています。
・重要品質問題の発生リスク
・人権問題の発生リスク
・情報セキュリティリスク
・健康・労働災害リスク
・自然災害リスク
・独占禁止法等の法令違反リスク
<事業等のリスク>
当社グループが展開する事業に関わるリスクのうち、当連結会計年度において、リスク管理委員会で重点的に取り
上げるべきリスクとして選定したリスクの詳細は以下の通りです。
(1) 重要品質問題の発生リスク
当社グループは、社内で確立した厳しい品質基準をもとに製品を製造しており、検査やパトロールの強化による品
質管理体制の維持や品質教育の徹底等により品質問題の予防に努めております。また、万一問題が発生した場合には
迅速に対応しその影響を最小限にとどめられるような管理体制を構築しております。しかしながら、予期せぬ事情に
よりリコールが発生する可能性や、当社グループが提供する、製品・サービスにおいて不測の事象やクレームが発生
する可能性があります。当社グループは、重要品質問題が発生した場合への対応として、製造物責任賠償については
保険に加入しておりますが、損失額をすべて賄える保証はなく、結果として当社グループの業績及び財政状況に悪影
響を及ぼす可能性があります。またこのことにより、当社グループの製品に対する信頼性に悪影響を及ぼす可能性が
あります。
(2) 人権問題の発生リスク
当社グループは、「イトーキグループ行動規範」を制定し、従業員の人権を尊重するとともに、人格・個性と多様
性を重視し、一人ひとりが活き活き働き、能力を最大限に発揮できる制度と環境づくりを行い、社会に誇れる企業倫
理を確立するとともに、コンプライアンス重視の経営を推進するために充実した内部管理体制の確立に努めておりま
す。しかしながら、これらの活動が適切に推進できなかった場合は当社グループの業績及び財政状況に悪影響を及ぼ
す可能性があります。
3/25
EDINET提出書類
株式会社イトーキ(E02371)
半期報告書
(3) 情報セキュリティリスク
当社グループは、事業を展開する上で、顧客及び取引先の個人情報並びに当社グループ内の個人情報を有しており
ます。情報セキュリティの一環として厳重な管理を行い、規程類の整備や各種対策の実施、従業員への教育などを実
施し、内部監査を含めたマネジメントサイクルを運用することで個人情報の保護の徹底を図っておりますが、想定を
超えた技術によるサイバー攻撃等の予期せぬ事態により流出する可能性があります。このような事態が生じた場合
は、当社グループのブランド価値低下を招くとともに、多額の費用負担が発生する可能性があります。
(4)健康・労働災害リスク
当社グループは、労働災害の発生を防止するため、安全診断の実施、改善活動及び安全衛生教育の推進など安全管
理に関わる取り組みを実施しております。しかしながら、これらの取り組みが奏功せず重大な労働災害が発生した場
合には、当社グループの業績及び財政状況に悪影響を及ぼす可能性があります。
(5)自然災害リスク
当社グループは、自然災害等によって事業活動が停止しないよう安全衛生面を含めた災害防止活動、設備点検等の
対策を行っております。また、安全衛生、事業継続の両面からサプライチェーンを含めた対策の実施及び災害対策体
制の構築により、災害等のリスク低減を図っております。しかしながら、予想を超える大規模な災害等が発生した場
合には、当社グループの業績及び財政状況に悪影響を及ぼす可能性があります。
(6) 独占禁止法等の法令違反リスク
当社グループは、公正かつ自由な競争を維持し、法令を遵守した事業活動を行っております。過年度に受けました
公正取引委員会からの行政指導(警告)をきわめて重く受け止めており、取引適正化に向けた取り組みを全社を挙げ
て推進し、適切な関係の構築を推進しております。しかしながら、今後、万が一独占禁止法に違反する事象や、当局
による新たな調査や処分等が発生した場合に、当社グループの信用失墜、対応費用の発生、事業制限等、財政状態に
影響を及ぼす可能性があります。
4/25
EDINET提出書類
株式会社イトーキ(E02371)
半期報告書
2 【経営者による財政状態、経営成績及びキャッシュ・フローの状況の分析】
文中の将来に関する事項は、当中間連結会計期間の末日現在において当社グループ(当社及び連結子会社)が判断し
たものであります。
(1) 経営成績に関する説明
当中間連結会計期間における世界経済は、米中間の通商摩擦の長期化に加え、中東及びウクライナ情勢を背景と
した地政学リスクの高まりにより、先行き不透明な状況が続きました。
当社グループでは中期経営計画「RISE TO GROWTH 2026」の最終年度となる当期において、重点戦略7Flags及び
ESG戦略に基づいた各種施策を推進しております。当中間連結会計期間は、持続的な成長力を高めるため、新しい
働き方やその働き方を実装するオフィス空間の提案、価値向上に重点を置いた営業活動の展開により、一層の売
上・利益の拡大を図ってまいりました。
(単位:百万円)
2025年中間
2026年中間
増減額
増減率
連結会計期間
連結会計期間
売上高
79,244
86,316
7,072
8.9%
売上総利益
33,869
37,364
3,495
10.3%
販売費及び一般管理費
23,243
25,731
2,488
10.7%
営業利益
10,625
11,632
1,006
9.5%
営業外収益
280
363
83
29.7%
営業外費用
408
415
6
1.6%
経常利益
10,497
11,580
1,083
10.3%
特別利益
71
114
43
60.2%
特別損失
103
289
186
180.0%
税金等調整前中間純利益
10,465
11,405
940
9.0%
法人税等合計
3,510
3,653
142
4.1%
中間純利益
6,955
7,752
797
11.5%
親会社株主に帰属する中間純利益
6,960
7,748
788
11.3%
(ⅰ)売上高
前年同期と比較して70億72百万円(8.9%)増収の863億16百万円と想定通りの結果となりました。なお、中間期
において5期連続の増収、4期連続で過去最高の売上高を更新しました。
・ワークプレイス事業は、ハイブリッドな新しい働き方にあわせたリニューアル案件を中心に堅調に推移しまし
た。
・設備機器・パブリック事業は、主に研究施設向け設備が好調に推移したことにより、大幅増収となりました。
(ⅱ)売上総利益
前年同期と比較して34億95百万円(10.3%)増益の373億64百万円となりました。
・ワークプレイス事業は、増収効果により、増益となりました。
・設備機器・パブリック事業は、主に研究施設向け設備における増収効果や提供価値の向上による利益率の改善に
より、大幅増益となりました。
(ⅲ)販売費及び一般管理費
業容拡大に伴う人件費の増加に加えて、AX推進のための基盤強化等の将来の飛躍に向けた戦略的支出を計画通
りに実行したことにより、前年同期と比較して24億88百万円(10.7%)増の257億31百万円となりました。
5/25
EDINET提出書類
株式会社イトーキ(E02371)
半期報告書
(ⅳ)営業利益
以上の結果、営業利益は、前年同期と比較して10億6百万円(9.5%)増益の116億32百万円と想定通りの結果と
なりました。なお、中間期において2期連続で増益、過去最高益を更新しました。
・ワークプレイス事業は、売上高が堅調に推移し増収となったものの、販売費及び一般管理費の増加により、減益
となりました。
・設備機器・パブリック事業は、主に研究施設向け設備における増収効果及び提供価値の向上による利益率の改善
により、大幅増益となりました。
(ⅴ)営業外収益
為替差益等の増加により、前年同期と比較して83百万円(29.7%)増加し3億63百万円となりました。
(ⅵ)営業外費用
支払利息等の増加により、前年同期と比較して6百万円(1.6%)増加し4億15百万円となりました。
(ⅶ)経常利益
以上の結果、経常利益は前年同期と比較して10億83百万円(10.3%)増加し115億80百万円となりました。
(ⅷ)特別利益
製品自主回収関連損失引当金戻入額の計上等により、前年同期と比較して43百万円(60.2%)増加し1億14百万
円となりました。
(ⅸ)特別損失
減損損失の計上等により、前年同期と比較して1億86百万円(180.0%)増加し2億89百万円となりました。
(ⅹ)親会社株主に帰属する中間純利益
以上の結果、親会社株主に帰属する中間純利益は、前年同期と比較して7億88百万円(11.3%)増加し77億48百
万円となりました。
セグメントの業績は、次のとおりであります。
(単位:百万円)
セグメントの名称
ワークプレイス
事業
設備機器・
パブリック事業
報告セグメント計
その他
合計
売上高
営業利益
売上高
営業利益
売上高
営業利益
売上高
営業利益
売上高
営業利益
2025年中間
連結会計期間
58,571
8,322
19,897
2,221
78,468
10,543
775
81
79,244
10,625
6/25
2026年中間
連結会計期間
62,365
8,019
23,196
3,544
85,561
11,563
754
69
86,316
11,632
増減額
3,793
△303
3,298
1,322
7,092
1,019
△20
△12
7,072
1,006
増減率
6.5%
△3.6%
16.6%
59.6%
9.0%
9.7%
△2.7%
△15.0%
8.9%
9.5%
EDINET提出書類
株式会社イトーキ(E02371)
半期報告書
(2) 財政状態の状況
資産の部
負債の部
純資産の部
2025年12月末
130,724
73,910
56,813
2026年6月末
130,144
68,174
61,969
増減額
△580
△5,736
5,155
(単位:百万円)
増減率
△0.4%
△7.8%
9.1%
(資産の部)
総資産は、繰延税金資産等が減少したことにより、前連結会計年度末に比べて5億80百万円減少し、1,301億44
百万円となりました。
(負債の部)
負債合計は、支払手形及び買掛金、電子記録債務等が減少したことにより、前連結会計年度末に比べて57億36百
万円減少し、681億74百万円となりました。
(純資産の部)
純資産は、増益により利益剰余金等が増加したことにより、前連結会計年度末に比べて51億55百万円増加し、
619億69百万円となりました。なお、自己資本比率は前連結会計年度末から4.2ポイント増加し47.5%となりまし
た。
(3) キャッシュ・フローの状況
当中間連結会計期間末における現金及び現金同等物(以下「資金」という。)の残高は、前連結会計年度末に比
べ、13億51百万円の資金の増加があり221億72百万円となりました。
当中間連結会計期間における各キャッシュ・フローの状況とそれらの要因は次のとおりであります。
(ⅰ)営業活動によるキャッシュ・フロー
増収を主因として、営業活動による資金の増加は40億3百万円(前年同期は40億60百万円の増加)となりまし
た。
(ⅱ)投資活動によるキャッシュ・フロー
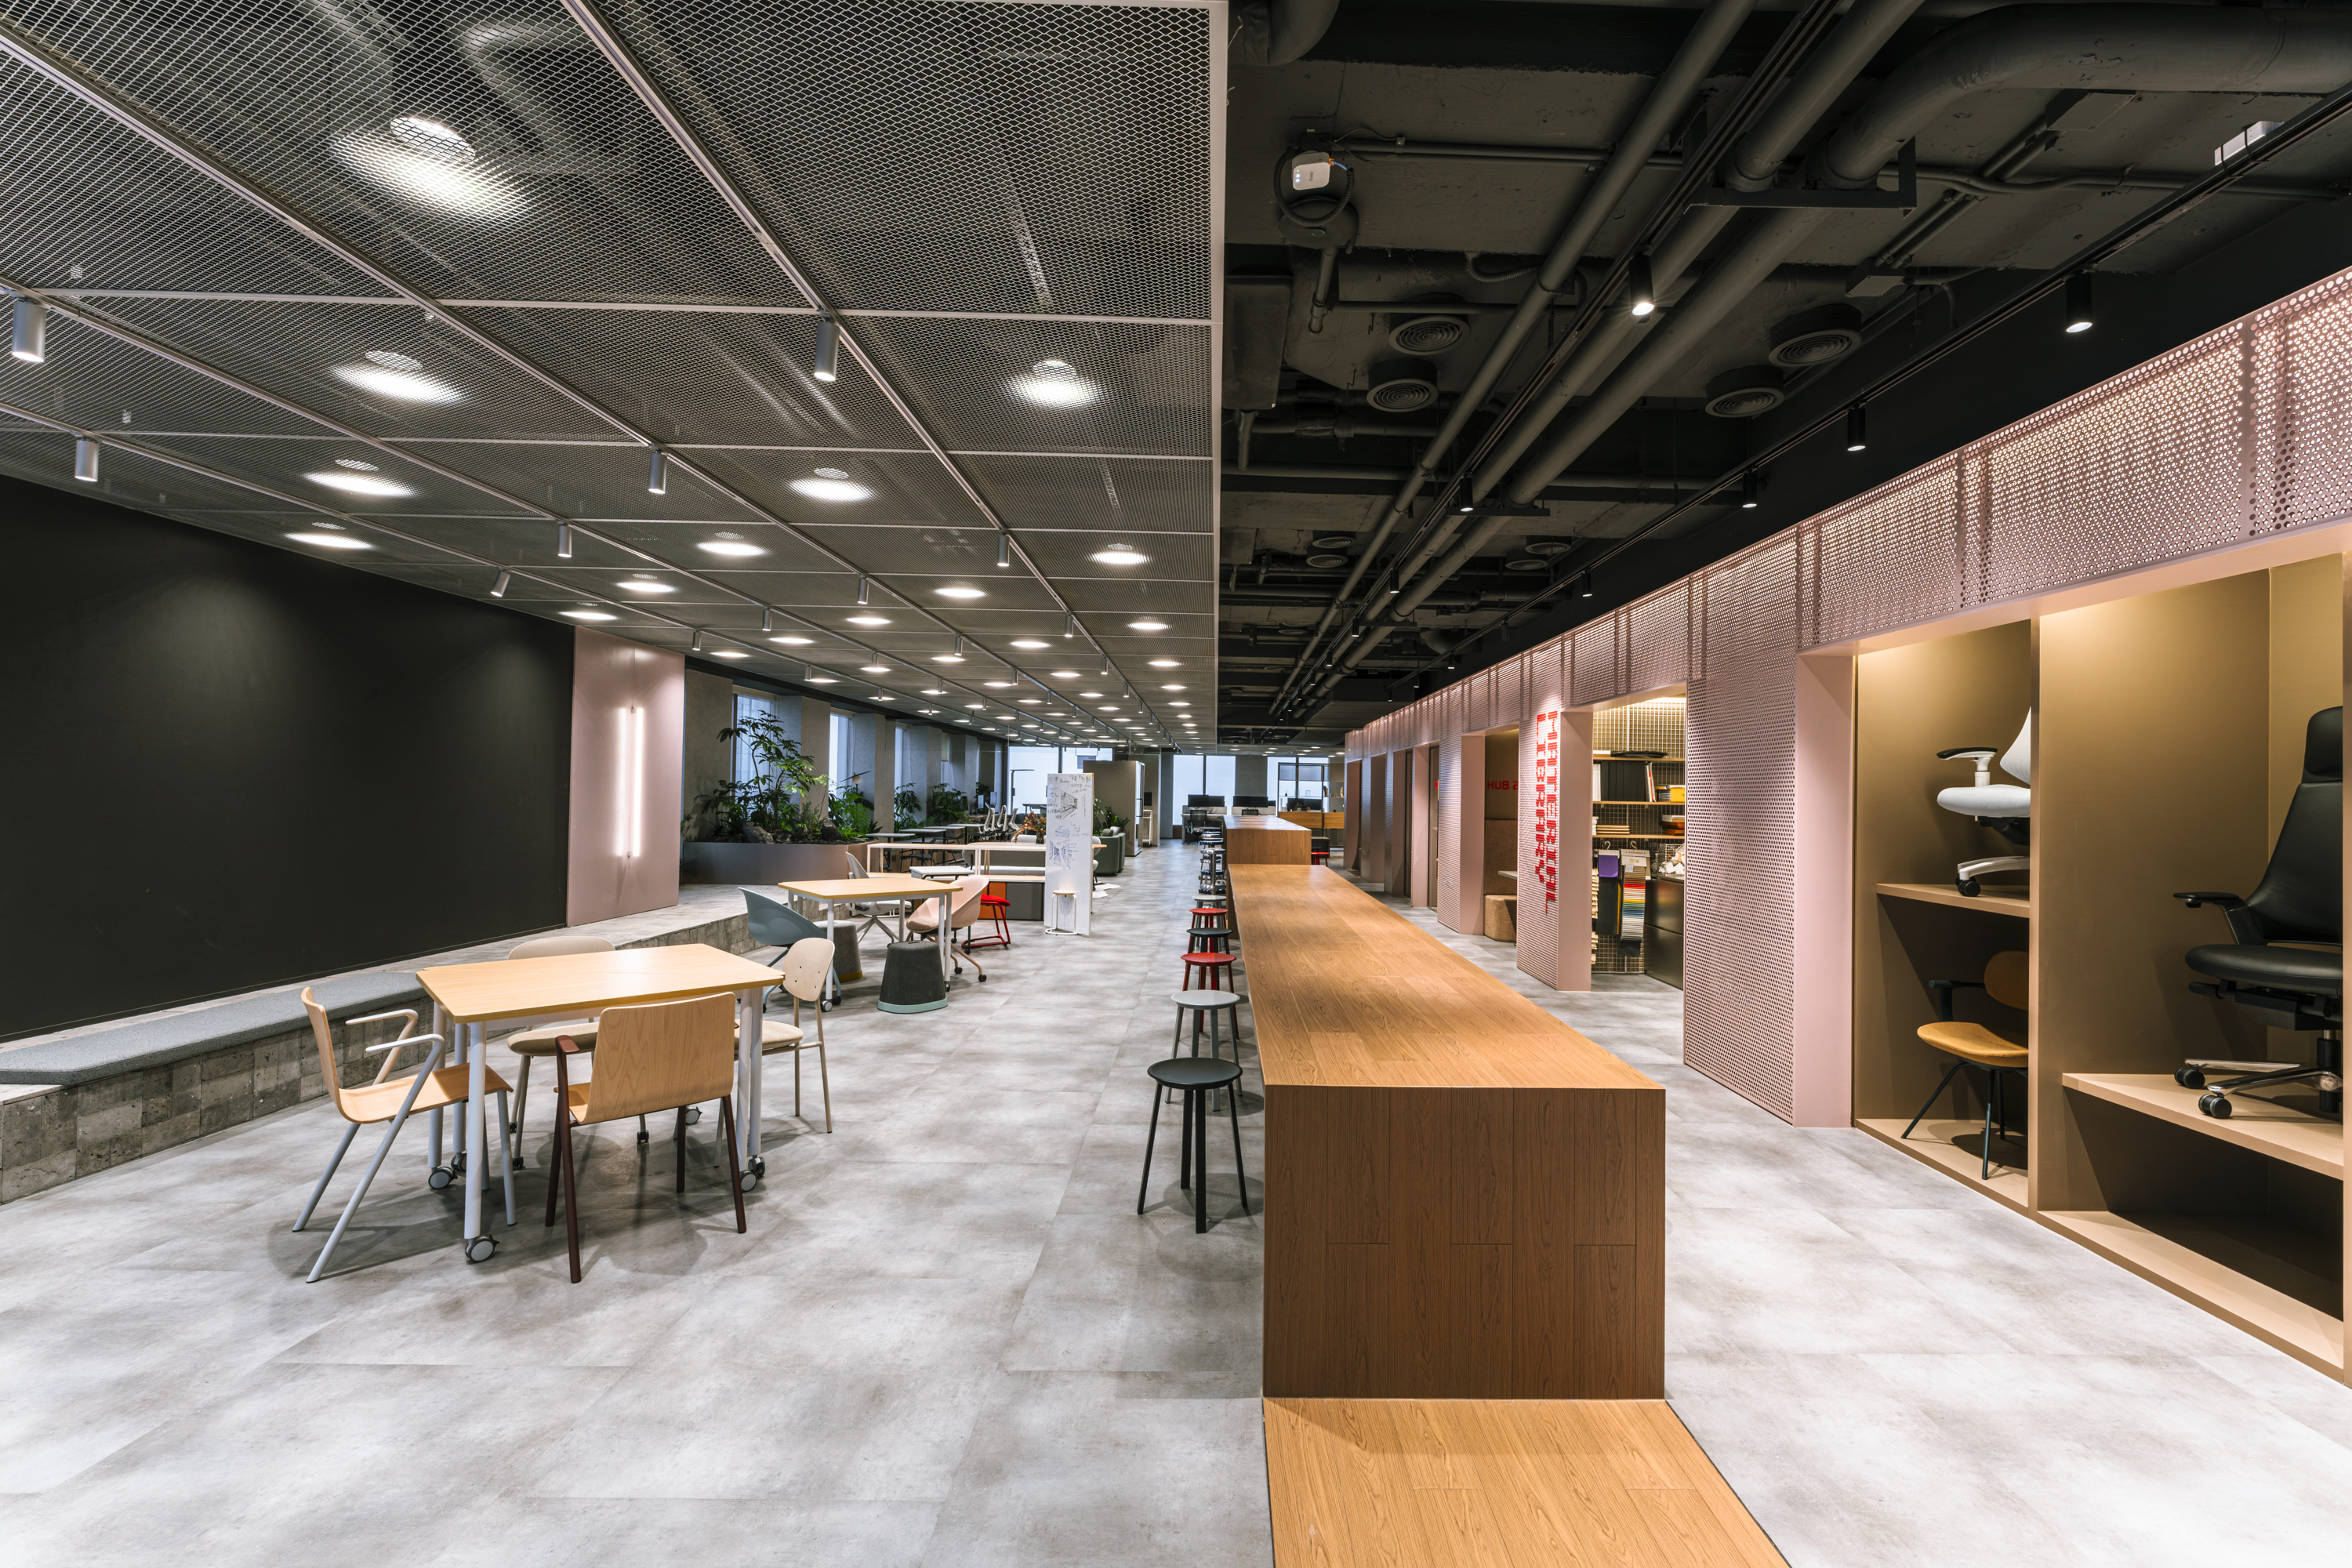
保険積立金の解約による収入等がある一方で、本社ショールーム(IDH)及び工場への設備投資による支出によ
り、投資活動による資金の減少は11億80百万円(前年同期は24億76百万円の減少)となりました。
(ⅲ)財務活動によるキャッシュ・フロー
配当金の支払等により、財務活動による資金の減少は15億96百万円(前年同期は9億78百万円の増加)となり
ました。
(4) 事業上及び財務上の対処すべき課題
当中間連結会計期間において、当社グループが対処すべき課題について重要な変更はありません。
(5) 研究開発活動
当中間連結会計期間におけるグループ全体の研究開発活動の金額は13億13百万円です。
なお、当中間連結会計期間において、当社グループの研究開発活動の重要な変更はありません。
3 【重要な契約等】
当中間連結会計期間において、重要な契約等の決定又は締結等はありません。
7/25
EDINET提出書類
株式会社イトーキ(E02371)
半期報告書
第3 【提出会社の状況】
1 【株式等の状況】
(1) 【株式の総数等】
① 【株式の総数】
種類
発行可能株式総数(株)
普通株式
149,830,000
計
149,830,000
② 【発行済株式】
種類
中間会計期間末
現在発行数(株)
(2026年6月30日)
上場金融商品取引所
提出日現在発行数(株)
名又は登録認可金融
(2026年8月6日)
商品取引業協会名
普通株式
53,382,850
53,382,850
東京証券取引所
(プライム市場)
計
53,382,850
53,382,850
―
(2) 【新株予約権等の状況】
① 【ストックオプション制度の内容】
該当事項はありません。
② 【その他の新株予約権等の状況】
該当事項はありません。
(3) 【行使価額修正条項付新株予約権付社債券等の行使状況等】
該当事項はありません。
8/25
内容
・完全議決権株式であり、権利
内容に何ら限定のない当社に
おける標準となる株式
・単元株式数 100株
―
EDINET提出書類
株式会社イトーキ(E02371)
半期報告書
(4) 【発行済株式総数、資本金等の推移】
年月日
発行済株式
総数増減数
(株)
発行済株式
総数残高
(株)
資本金増減額
(百万円)
資本金残高
(百万円)
資本準備金
増減額
(百万円)
資本準備金
残高
(百万円)
−
53,382,850
−
7,351
−
12,890
2026年1月1日〜
2026年6月30日
(5) 【大株主の状況】
氏名又は名称
日本マスタートラスト信託銀
行㈱(信託口)
㈱日本カストディ銀行(信託
口)
所有株式数
(千株)
住所
2026年6月30日現在
発行済株式(自己
株式を除く。)の
総数に対する所有
株式数の割合(%)
港区赤坂1丁目8−1
5,709
11.54
中央区晴海1丁目8−12
4,316
8.72
日本生命保険相互会社
千代田区丸の内1丁目6−6
2,225
4.49
㈱アシスト
大阪市中央区平野町2丁目4−12
1,609
3.25
イトーキ協力会社持株会
中央区日本橋2丁目5−1
1,333
2.69
㈱みずほ銀行
千代田区大手町1丁目5−5
1,121
2.26
㈱三井住友銀行
千代田区丸の内1丁目1−2
1,069
2.16
山田
匡通
世田谷区
897
1.81
伊藤
佐紀
大阪府豊中市
792
1.60
中央区日本橋2丁目5−1
756
1.52
19,832
40.00
イトーキ従業員持株会
計
(注)
1.上記のほか、当社は自己株式を3,913,913株を保有しております。
2.2026年3月19日付で公衆の縦覧に供されている大量保有報告書において、三井住友トラスト・アセットマ
ネジメント株式会社及びその共同保有者であるアモーヴァ・アセットマネジメント株式会社が2026年3月13日
現在で以下の株式を所有している旨が記載されているものの、当社として2026年6月30日時点における実質所
有株式数の確認ができませんので、上記大株主の状況には含めておりません。
なお、その大量保有報告書の内容は以下のとおりであります。
氏名又は名称
三井住友トラスト・アセット
マネジメント㈱
アモーヴァ・アセットマネジ
メント㈱
保有株券等の数
(千株)
住所
株券等保有割合
(%)
港区芝公園1丁目1−1
1,718
3.22
港区赤坂9丁目7−1
1,016
1.90
2,734
5.12
計
9/25
EDINET提出書類
株式会社イトーキ(E02371)
半期報告書
3.2026年4月7日付で公衆の縦覧に供されている大量保有報告書の変更報告書において、株式会社みずほ銀
行及びその共同保有者であるみずほ証券株式会社及びみずほ信託銀行株式会社及びアセットマネジメントOne株
式会社が2026年3月31日現在で以下の株式を所有している旨が記載されているものの、株式会社みずほ銀行及
びみずほ信託銀行株式会社を除き、当社として2026年6月30日時点における実質所有株式数の確認ができませ
んので、上記大株主の状況には含めておりません。
なお、その大量保有報告書の内容は以下のとおりであります。
氏名又は名称
保有株券等の数
(千株)
住所
株券等保有割合
(%)
㈱みずほ銀行
千代田区大手町1丁目5−5
1,121
2.10
みずほ証券㈱
千代田区大手町1丁目5−1
64
0.12
みずほ信託銀行㈱
千代田区丸の内1丁目3−3
350
0.66
アセットマネジメントOne㈱
千代田区丸の内1丁目8−2
2,238
4.19
3,774
7.07
計
10/25
EDINET提出書類
株式会社イトーキ(E02371)
半期報告書
(6) 【議決権の状況】
① 【発行済株式】
2026年6月30日現在
区分
株式数(株)
議決権の数(個)
内容
無議決権株式
―
―
―
議決権制限株式(自己株式等)
―
―
―
議決権制限株式(その他)
―
―
―
―
権利内容に何ら限定のない当
社における標準となる株式
完全議決権株式(自己株式等)
完全議決権株式(その他)
単元未満株式
(自己保有株式)
普通株式
3,913,900
普通株式
49,408,600
普通株式
60,350
発行済株式総数
53,382,850
総株主の議決権
―
494,086
同上
―
同上
―
―
494,086
―
② 【自己株式等】
2026年6月30日現在
発行済株式
所有株式数
総数に対する所
の合計
有株式数の割合
(株)
(%)
所有者の氏名
又は名称
所有者の住所
自己名義
所有株式数
(株)
他人名義
所有株式数
(株)
㈱イトーキ
大阪市中央区淡路町
一丁目6番11号
3,913,900
−
3,913,900
7.33
計
―
3,913,900
−
3,913,900
7.33
2 【役員の状況】
前事業年度の有価証券報告書の提出日後、当中間会計期間において、役員の異動はありません。
11/25
EDINET提出書類
株式会社イトーキ(E02371)
半期報告書
第4 【経理の状況】
1.中間連結財務諸表の作成方法について
当社の中間連結財務諸表は、「連結財務諸表の用語、様式及び作成方法に関する規則」(1976年大蔵省令第28号)に
基づいて作成しております。
当社の中間連結財務諸表は、第一種中間連結財務諸表であります。
2.監査証明について
当社は、金融商品取引法第193条の2第1項の規定に基づき、中間連結会計期間(2026年1月1日から2026年6月30
日まで)に係る中間連結財務諸表について、有限責任 あずさ監査法人による期中レビューを受けております。
12/25
EDINET提出書類
株式会社イトーキ(E02371)
半期報告書
1 【中間連結財務諸表】
(1) 【中間連結貸借対照表】
(単位:百万円)
前連結会計年度
(2025年12月31日)
資産の部
流動資産
現金及び預金
受取手形、売掛金及び契約資産
電子記録債権
有価証券
商品及び製品
仕掛品
原材料及び貯蔵品
その他
貸倒引当金
流動資産合計
固定資産
有形固定資産
建物及び構築物(純額)
土地
その他(純額)
有形固定資産合計
無形固定資産
のれん
その他
無形固定資産合計
投資その他の資産
投資有価証券
退職給付に係る資産
繰延税金資産
その他
貸倒引当金
投資その他の資産合計
固定資産合計
繰延資産
社債発行費
繰延資産合計
資産合計
13/25
当中間連結会計期間
(2026年6月30日)
21,629
34,474
7,289
6,572
2,035
4,592
2,997
△186
22,393
32,634
8,808
340
6,907
1,592
4,859
3,293
△221
79,406
80,609
12,458
7,950
6,117
12,946
7,950
6,237
26,525
27,133
714
5,359
635
5,177
6,074
5,813
6,659
1,740
2,370
8,063
△145
7,500
1,682
702
6,766
△91
18,688
51,288
16,561
49,508
29
26
29
130,724
26
130,144
EDINET提出書類
株式会社イトーキ(E02371)
半期報告書
(単位:百万円)
前連結会計年度
(2025年12月31日)
負債の部
流動負債
支払手形及び買掛金
電子記録債務
設備関係支払手形
1年内償還予定の社債
短期借入金
1年内返済予定の長期借入金
未払法人税等
未払消費税等
賞与引当金
役員賞与引当金
受注損失引当金
製品保証引当金
関係会社事業損失引当金
製品自主回収関連損失引当金
その他
流動負債合計
固定負債
社債
長期借入金
リース債務
繰延税金負債
製品自主回収関連損失引当金
退職給付に係る負債
資産除去債務
その他
固定負債合計
負債合計
純資産の部
株主資本
資本金
資本剰余金
利益剰余金
自己株式
株主資本合計
その他の包括利益累計額
その他有価証券評価差額金
為替換算調整勘定
退職給付に係る調整累計額
その他の包括利益累計額合計
非支配株主持分
純資産合計
負債純資産合計
※2
※2
14/25
9,380
1,962
0
16
12,830
6,055
当中間連結会計期間
(2026年6月30日)
※2
7,694
707
3
9
18,470
3,859
4,141
1,234
4,170
344
0
16
85
82
9,260
2,740
1,406
1,555
28
0
18
93
8
8,581
49,580
45,175
5,000
10,089
※2
5,000
8,989
637
345
83
3,669
1,584
2,921
556
247
83
3,652
1,558
2,909
24,330
73,910
22,998
68,174
7,351
11,692
42,812
△7,684
7,351
11,789
46,855
△7,566
54,171
58,429
1,719
729
89
2,610
725
96
2,537
104
56,813
130,724
3,432
106
61,969
130,144
EDINET提出書類
株式会社イトーキ(E02371)
半期報告書
(2) 【中間連結損益計算書及び中間連結包括利益計算書】
【中間連結損益計算書】
売上高
売上原価
売上総利益
販売費及び一般管理費
営業利益
営業外収益
受取利息
受取配当金
為替差益
受取保険金
その他
営業外収益合計
営業外費用
支払利息
支払手数料
その他
営業外費用合計
経常利益
特別利益
固定資産売却益
投資有価証券売却益
製品自主回収関連損失引当金戻入額
その他
特別利益合計
特別損失
固定資産売却損
固定資産除却損
退職給付制度終了損
減損損失
その他
特別損失合計
税金等調整前中間純利益
法人税、住民税及び事業税
法人税等調整額
法人税等合計
中間純利益
非支配株主に帰属する中間純利益又は非支配株主に
帰属する中間純損失(△)
親会社株主に帰属する中間純利益
前中間連結会計期間
(自 2025年1月1日
至 2025年6月30日)
79,244
45,374
※1
15/25
33,869
23,243
(単位:百万円)
当中間連結会計期間
(自 2026年1月1日
至 2026年6月30日)
86,316
48,951
※1
37,364
25,731
10,625
11,632
18
53
48
33
126
18
77
86
67
113
280
363
243
108
56
285
6
122
408
10,497
415
11,580
2
69
2
52
50
8
71
114
21
80
1
26
83
146
33
103
10,465
289
11,405
2,901
608
2,475
1,177
3,510
6,955
3,653
7,752
△4
4
6,960
7,748
EDINET提出書類
株式会社イトーキ(E02371)
半期報告書
【中間連結包括利益計算書】
中間純利益
その他の包括利益
その他有価証券評価差額金
為替換算調整勘定
退職給付に係る調整額
その他の包括利益合計
中間包括利益
(内訳)
親会社株主に係る中間包括利益
非支配株主に係る中間包括利益
前中間連結会計期間
(自 2025年1月1日
至 2025年6月30日)
6,955
(単位:百万円)
当中間連結会計期間
(自 2026年1月1日
至 2026年6月30日)
7,752
86
△35
5
891
△4
7
56
7,011
894
8,647
7,018
△6
8,644
3
16/25
EDINET提出書類
株式会社イトーキ(E02371)
半期報告書
(3) 【中間連結キャッシュ・フロー計算書】
前中間連結会計期間
(自 2025年1月1日
至 2025年6月30日)
営業活動によるキャッシュ・フロー
税金等調整前中間純利益
減価償却費
のれん償却額
減損損失
貸倒引当金の増減額(△は減少)
賞与引当金の増減額(△は減少)
役員賞与引当金の増減額(△は減少)
受注損失引当金の増減額(△は減少)
退職給付に係る負債の増減額(△は減少)
退職給付に係る資産の増減額(△は増加)
役員退職慰労引当金の増減額(△は減少)
製品保証引当金の増減額(△は減少)
関係会社事業損失引当金の増減額(△は減少)
競争法関連損失引当金の増減額(△は減少)
受取利息及び受取配当金
支払利息
投資有価証券売却損益(△は益)
固定資産売却損益(△は益)
固定資産除却損
売上債権の増減額(△は増加)
棚卸資産の増減額(△は増加)
仕入債務の増減額(△は減少)
その他
小計
利息及び配当金の受取額
利息の支払額
競争法関連支払額
法人税等の支払額又は還付額(△は支払)
営業活動によるキャッシュ・フロー
17/25
(単位:百万円)
当中間連結会計期間
(自 2026年1月1日
至 2026年6月30日)
10,465
1,547
70
△0
△1,344
△203
△1
△88
23
△71
0
0
△734
△72
243
△68
19
80
△1,822
△660
△1,886
1,375
11,405
2,137
79
146
13
△2,616
△315
△0
△16
76
1
7
△95
285
△25
△2
26
487
△141
△3,055
△415
6,871
7,983
74
△228
△734
△1,921
95
△279
△3,796
4,060
4,003
EDINET提出書類
株式会社イトーキ(E02371)
半期報告書
前中間連結会計期間
(自 2025年1月1日
至 2025年6月30日)
投資活動によるキャッシュ・フロー
定期預金の預入による支出
定期預金の払戻による収入
有形固定資産の取得による支出
有形固定資産の売却による収入
無形固定資産の取得による支出
投資有価証券の取得による支出
投資有価証券の売却による収入
長期貸付けによる支出
長期貸付金の回収による収入
保険積立金の純増減額(△は増加)
その他
投資活動によるキャッシュ・フロー
財務活動によるキャッシュ・フロー
短期借入金の純増減額(△は減少)
長期借入れによる収入
長期借入金の返済による支出
社債の償還による支出
配当金の支払額
非支配株主への配当金の支払額
自己株式の純増減額(△は増加)
その他
財務活動によるキャッシュ・フロー
現金及び現金同等物に係る換算差額
現金及び現金同等物の増減額(△は減少)
現金及び現金同等物の期首残高
現金及び現金同等物の中間期末残高
※
18/25
(単位:百万円)
当中間連結会計期間
(自 2026年1月1日
至 2026年6月30日)
△993
743
△1,813
2
△1,216
△156
107
△3
0
667
186
△630
1,218
△2,600
2
△561
△125
221
1
1,460
△167
△2,476
△1,180
△370
10,450
△6,270
△7
△2,651
△0
13
△186
5,640
100
△3,395
△7
△3,699
△0
△0
△233
978
△2
2,560
21,494
24,054
△1,596
125
1,351
20,820
22,172
※
EDINET提出書類
株式会社イトーキ(E02371)
半期報告書
【注記事項】
(継続企業の前提に関する事項)
該当事項はありません。
(連結の範囲又は持分法適用の範囲の変更)
当中間連結会計期間において、連結子会社であった伊藤喜オールスチール株式会社は、当社を存続会社とする吸
収合併により消滅したため、連結の範囲から除外しております。
また、連結子会社であった不二パウダル株式会社は、当社の連結子会社である株式会社ダルトンを存続会社とす
る吸収合併により消滅したため、連結の範囲から除外しております。
(中間連結貸借対照表関係)
1
受取手形割引高
前連結会計年度
(2025年12月31日)
受取手形割引高
※2
当中間連結会計期間
(2026年6月30日)
170百万円
24百万円
シンジケーション方式によるタームローン契約
(1)2024年9月17日契約のシンジケーション方式によるタームローン契約の借入残高は次のとおりでありま
す。
前連結会計年度
(2025年12月31日)
シンジケーション方式による
タームローン契約
当中間連結会計期間
(2026年6月30日)
2,000百万円
800百万円
なお、シンジケーション方式によるタームローン契約につきましては、下記の財務制限条項が付されておりま
す。これらに抵触した場合には当該有利子負債の一括返済を求められる可能性があります。
① 2024年12月期末日及びそれ以降の各事業年度末日における連結の貸借対照表に記載される純資産の部の合計金
額を、2023年12月期末日における連結の貸借対照表に記載される純資産の部の合計金額の75%に相当する金額、又
は直近の事業年度末日における連結の貸借対照表に記載される純資産の部の合計金額の75%に相当する金額のう
ち、いずれか高いほうの金額以上に維持すること。
② 2024年12月期末日及びそれ以降の各事業年度末日における連結損益計算書に記載される経常損益を損失としな
いこと。
(2)2024年9月25日契約のシンジケーション方式によるタームローン契約の借入残高は次のとおりでありま
す。
前連結会計年度
(2025年12月31日)
シンジケーション方式による
タームローン契約
当中間連結会計期間
(2026年6月30日)
2,220百万円
1,108百万円
なお、シンジケーション方式によるタームローン契約につきましては、下記の財務制限条項が付されておりま
す。これらに抵触した場合には当該有利子負債の一括返済を求められる可能性があります。
① 2024年12月期決算以降、各年度の決算期の末日および第2四半期の末日における連結の貸借対照表上の純資産
の部の金額を前年同期比75%以上に維持すること。
② 2024年12月期決算以降、各年度の決算期の末日における単体の貸借対照表上の純資産の部の金額を前年同期比
75%以上に維持すること。
19/25
EDINET提出書類
株式会社イトーキ(E02371)
半期報告書
(3)2025年3月27日契約のシンジケーション方式によるタームローン契約の借入残高は次のとおりでありま
す。
前連結会計年度
(2025年12月31日)
シンジケーション方式による
タームローン契約
当中間連結会計期間
(2026年6月30日)
4,250百万円
3,750百万円
なお、シンジケーション方式によるタームローン契約につきましては、下記の財務制限条項が付されておりま
す。これらに抵触した場合には当該有利子負債の一括返済を求められる可能性があります。
① 2024年12月期決算以降、各年度の決算期の末日および第2四半期の末日における連結の貸借対照表上の純資産
の部の金額を前年同期比75%以上に維持すること。
② 2024年12月期決算以降、各年度の決算期の末日における単体の貸借対照表上の純資産の部の金額を前年同期比
75%以上に維持すること。
(中間連結損益計算書関係)
※1
販売費及び一般管理費のうち主要な費目及び金額は次のとおりであります。
前中間連結会計期間
(自 2025年1月1日
至 2025年6月30日)
従業員給与手当
9,110 百万円
9,564 百万円
賞与引当金繰入額
1,105 百万円
1,226 百万円
446 百万円
442 百万円
退職給付費用
2
当中間連結会計期間
(自 2026年1月1日
至 2026年6月30日)
当社グループは、「グローバル・ミニマム課税制度に係る法人税等の会計処理及び開示に関する取扱い」(実
務対応報告第46号
2024年3月22日)第7項を適用し、当中間連結会計期間を含む対象会計年度に関する国際最
低課税額に対する法人税等を計上しておりません。
(中間連結キャッシュ・フロー計算書関係)
※
現金及び現金同等物の中間期末残高と中間連結貸借対照表に掲記されている科目の金額との関係は、下記のと
おりであります。
前中間連結会計期間
(自 2025年1月1日
至 2025年6月30日)
25,288百万円
当中間連結会計期間
(自 2026年1月1日
至 2026年6月30日)
22,393百万円
預入期間が3ヶ月を超える定期預金
△1,234百万円
△220百万円
現金及び現金同等物
24,054百万円
22,172百万円
現金及び預金勘定
(株主資本等関係)
Ⅰ
前中間連結会計期間(自
2025年1月1日
至
2025年6月30日)
配当金支払額
Ⅱ
(決議)
株式の種類
配当金の総額
(百万円)
1株当たり
配当額(円)
2025年3月26日
定時株主総会
普通株式
2,706
55
当中間連結会計期間(自
2026年1月1日
至
基準日
効力発生日
配当の原資
2024年12月31日
2025年3月27日
利益剰余金
基準日
効力発生日
配当の原資
2025年12月31日
2026年3月26日
利益剰余金
2026年6月30日)
配当金支払額
(決議)
株式の種類
配当金の総額
(百万円)
1株当たり
配当額(円)
2026年3月25日
定時株主総会
普通株式
3,705
75
20/25
EDINET提出書類
株式会社イトーキ(E02371)
半期報告書
(セグメント情報等)
【セグメント情報】
Ⅰ
前中間連結会計期間(自
2025年1月1日
至
2025年6月30日)
報告セグメントごとの売上高及び利益又は損失の金額に関する情報並びに収益の分解情報
(単位:百万円)
報告セグメント
ワークプレイ 設備機器・パ
ス事業
ブリック事業
その他
(注1)
計
合計
調整額
中間連結
損益計算書
計上額
(注2)
売上高
日本
55,241
19,791
75,033
688
75,721
−
75,721
アジア
3,191
28
3,220
−
3,220
−
3,220
その他
137
76
214
−
214
−
214
58,571
19,897
78,468
688
79,156
−
79,156
−
−
−
87
87
−
87
外部顧客への売上高
58,571
19,897
78,468
775
79,244
−
79,244
セグメント間の内部
売上高又は振替高
120
6
127
273
401
△401
−
58,692
19,904
78,596
1,049
79,645
△401
79,244
8,322
2,221
10,543
81
10,625
−
10,625
顧客との契約から
生じる収益
その他の収益
計
セグメント利益
(注)1.その他の区分は、報告セグメントに含まれない事業セグメントであり、ITシステム関連事業等を
含んでおります。
2.セグメント利益の合計額は、中間連結損益計算書の営業利益と一致しております。
Ⅱ
当中間連結会計期間(自
2026年1月1日
至
2026年6月30日)
1.報告セグメントごとの売上高及び利益又は損失の金額に関する情報並びに収益の分解情報
(単位:百万円)
報告セグメント
ワークプレイ 設備機器・パ
ス事業
ブリック事業
その他
(注1)
計
合計
調整額
中間連結
損益計算書
計上額
(注2)
売上高
日本
58,407
22,980
81,388
710
82,099
−
82,099
アジア
3,827
138
3,966
−
3,966
−
3,966
その他
129
77
206
−
206
−
206
62,365
23,196
85,561
710
86,272
−
86,272
−
−
−
44
44
−
44
外部顧客への売上高
62,365
23,196
85,561
754
86,316
−
86,316
セグメント間の内部
売上高又は振替高
134
35
170
246
417
△417
−
62,500
23,232
85,732
1,001
86,733
△417
86,316
8,019
3,544
11,563
69
11,632
−
11,632
顧客との契約から
生じる収益
その他の収益
計
セグメント利益
(注)1.その他の区分は、報告セグメントに含まれない事業セグメントであり、ITシステム関連事業等を
含んでおります。
2.セグメント利益の合計額は、中間連結損益計算書の営業利益と一致しております。
2.報告セグメントごとの固定資産の減損損失又はのれん等に関する情報
21/25
EDINET提出書類
株式会社イトーキ(E02371)
半期報告書
当中間連結会計期間において、ワークプレイス事業で146百万円の減損損失を計上しております。
(収益認識関係)
顧客との契約から生じる収益を分解した情報は、「注記事項(セグメント情報等)」に記載のとおりでありま
す。
(1株当たり情報)
1株当たり中間純利益及び算定上の基礎は、以下のとおりであります。
前中間連結会計期間
(自 2025年1月1日
至 2025年6月30日)
1株当たり中間純利益
当中間連結会計期間
(自 2026年1月1日
至 2026年6月30日)
141円26銭
156円77銭
6,960
7,748
−
−
普通株式に係る親会社株主に帰属する中間純利益(百
万円)
6,960
7,748
普通株式の期中平均株式数(千株)
49,272
49,428
(算定上の基礎)
親会社株主に帰属する中間純利益(百万円)
普通株主に帰属しない金額(百万円)
(注)潜在株式調整後1株当たり中間純利益については、潜在株式が存在しないため記載しておりません。
(重要な後発事象)
該当事項はありません。
2 【その他】
該当事項はありません。
22/25
EDINET提出書類
株式会社イトーキ(E02371)
半期報告書
第二部【提出会社の保証会社等の情報】
該当事項はありません。
23/25
EDINET提出書類
株式会社イトーキ(E02371)
半期報告書
独立監査人の中間連結財務諸表に対する期中レビュー報告書
2026年8月6日
株式会社イトーキ
取締役会御中
有限責任 あずさ監査法人
東京事務所
指定有限責任社員
業務執行社員
指定有限責任社員
業務執行社員
公認会計士
伊
丹
亮
資
公認会計士
香
月
まゆか
監査人の結論
当監査法人は、金融商品取引法第193条の2第1項の規定に基づき、「経理の状況」に掲げられている株式会社イ
トーキの2026年1月1日から2026年12月31日までの連結会計年度の中間連結会計期間(2026年1月1日から2026年6
月30日まで)に係る中間連結財務諸表、すなわち、中間連結貸借対照表、中間連結損益計算書、中間連結包括利益計
算書、中間連結キャッシュ・フロー計算書及び注記について期中レビューを行った。
当監査法人が実施した期中レビューにおいて、上記の中間連結財務諸表が、我が国において一般に公正妥当と認め
られる企業会計の基準に準拠して、株式会社イトーキ及び連結子会社の2026年6月30日現在の財政状態並びに同日を
もって終了する中間連結会計期間の経営成績及びキャッシュ・フローの状況を適正に表示していないと信じさせる事
項が全ての重要な点において認められなかった。
監査人の結論の根拠
当監査法人は、我が国において一般に公正妥当と認められる期中レビューの基準に準拠して期中レビューを行っ
た。期中レビューの基準における当監査法人の責任は、「中間連結財務諸表の期中レビューにおける監査人の責任」
に記載されている。当監査法人は、我が国における職業倫理に関する規定(社会的影響度の高い事業体の財務諸表監
査に適用される規定を含む。)に従って、会社及び連結子会社から独立しており、また、監査人としてのその他の倫
理上の責任を果たしている。当監査法人は、結論の表明の基礎となる証拠を入手したと判断している。
中間連結財務諸表に対する経営者並びに監査役及び監査役会の責任
経営者の責任は、我が国において一般に公正妥当と認められる企業会計の基準に準拠して中間連結財務諸表を作成
し適正に表示することにある。これには、不正又は誤謬による重要な虚偽表示のない中間連結財務諸表を作成し適正
に表示するために経営者が必要と判断した内部統制を整備及び運用することが含まれる。
中間連結財務諸表を作成するに当たり、経営者は、継続企業の前提に基づき中間連結財務諸表を作成することが適
切であるかどうかを評価し、我が国において一般に公正妥当と認められる企業会計の基準に基づいて継続企業に関す
る事項を開示する必要がある場合には当該事項を開示する責任がある。
監査役及び監査役会の責任は、財務報告プロセスの整備及び運用における取締役の職務の執行を監視することにあ
る。
中間連結財務諸表の期中レビューにおける監査人の責任
監査人の責任は、監査人が実施した期中レビューに基づいて、期中レビュー報告書において独立の立場から中間連
結財務諸表に対する結論を表明することにある。
監査人は、我が国において一般に公正妥当と認められる期中レビューの基準に従って、期中レビューの過程を通じ
て、職業的専門家としての判断を行い、職業的懐疑心を保持して以下を実施する。
・主として経営者、財務及び会計に関する事項に責任を有する者等に対する質問、分析的手続その他の期中レビュー
手続を実施する。期中レビュー手続は、我が国において一般に公正妥当と認められる監査の基準に準拠して実施さ
れる年度の財務諸表の監査に比べて限定された手続である。
・継続企業の前提に関する事項について、重要な疑義を生じさせるような事象又は状況に関して重要な不確実性が認
められると判断した場合には、入手した証拠に基づき、中間連結財務諸表において、我が国において一般に公正妥
当と認められる企業会計の基準に準拠して、適正に表示されていないと信じさせる事項が認められないかどうか結
論付ける。また、継続企業の前提に関する重要な不確実性が認められる場合は、期中レビュー報告書において中間
連結財務諸表の注記事項に注意を喚起すること、又は重要な不確実性に関する中間連結財務諸表の注記事項が適切
でない場合は、中間連結財務諸表に対して限定付結論又は否定的結論を表明することが求められている。監査人の
24/25
EDINET提出書類
株式会社イトーキ(E02371)
半期報告書
結論は、期中レビュー報告書日までに入手した証拠に基づいているが、将来の事象や状況により、企業は継続企業
として存続できなくなる可能性がある。
・中間連結財務諸表の表示及び注記事項が、我が国において一般に公正妥当と認められる企業会計の基準に準拠して
いないと信じさせる事項が認められないかどうかとともに、関連する注記事項を含めた中間連結財務諸表の表示、
構成及び内容、並びに中間連結財務諸表が基礎となる取引や会計事象を適正に表示していないと信じさせる事項が
認められないかどうかを評価する。
・中間連結財務諸表に対する結論表明の基礎となる、会社及び連結子会社の財務情報に関する証拠を入手する。監査
人は、中間連結財務諸表の期中レビューに関する指揮、監督及び査閲に関して責任がある。監査人は、単独で監査
人の結論に対して責任を負う。
監査人は、監査役及び監査役会に対して、計画した期中レビューの範囲とその実施時期、期中レビュー上の重要な
発見事項について報告を行う。
監査人は、監査役及び監査役会に対して、独立性についての我が国における職業倫理に関する規定を遵守したこ
と、並びに監査人の独立性に影響を与えると合理的に考えられる事項、及び阻害要因を除去するための対応策を講じ
ている場合又は阻害要因を許容可能な水準にまで軽減するためのセーフガードを適用している場合はその内容につい
て報告を行う。
利害関係
会社及び連結子会社と当監査法人又は業務執行社員との間には、公認会計士法の規定により記載すべき利害関係は
ない。
以
(注) 1.上記の期中レビュー報告書の原本は当社(半期報告書提出会社)が別途保管しております。
2.XBRLデータは期中レビューの対象には含まれていません。
25/25
上
 企業情報サイト