臨時報告書(第19条第2項第8号の2)
Bull 3
Bear 0
M&A
7951
Fiscal year ends March
Quarters are offset from the calendar — Q1 is Apr–Jun
|
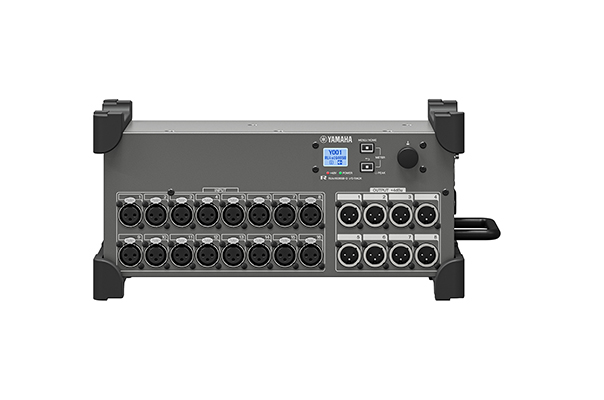
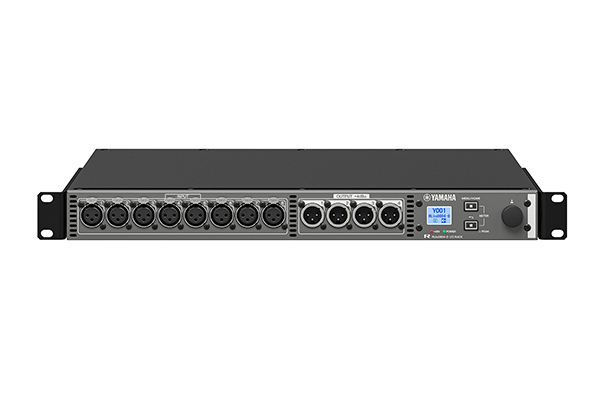
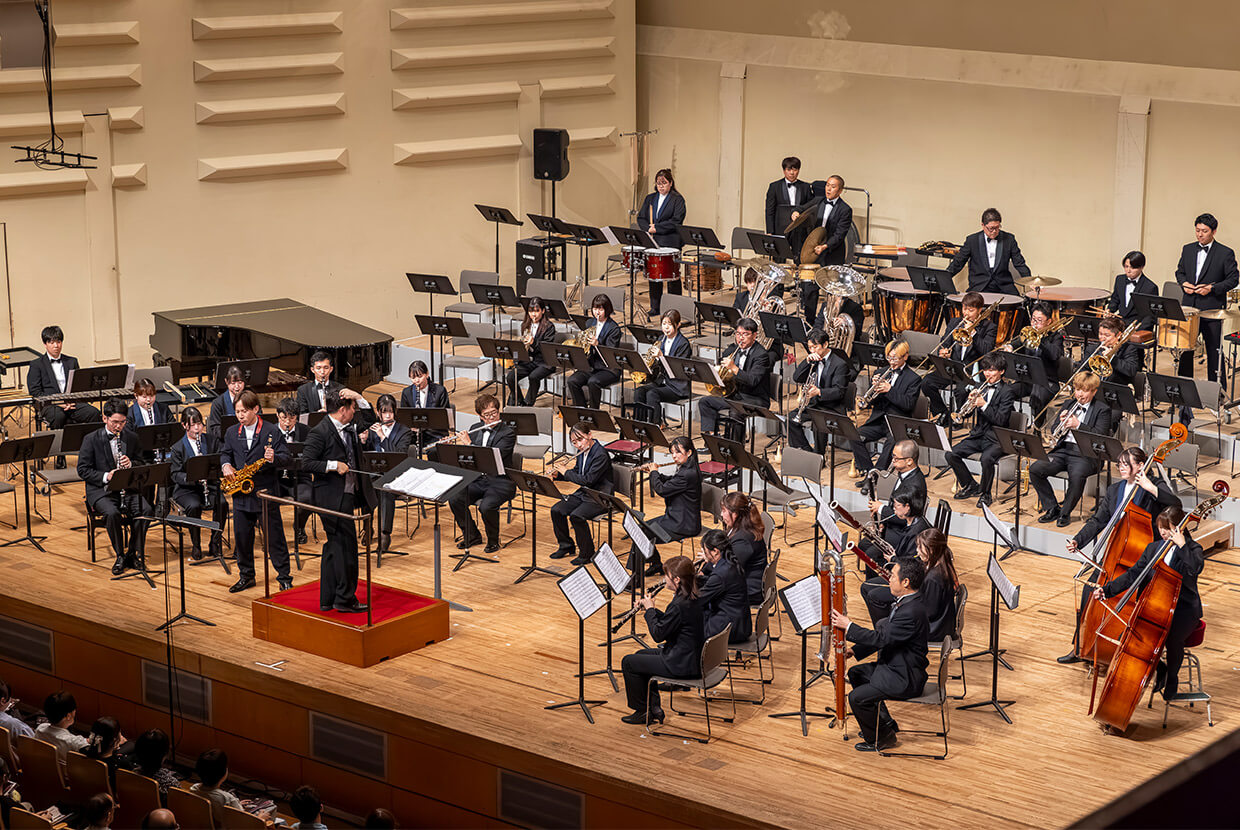
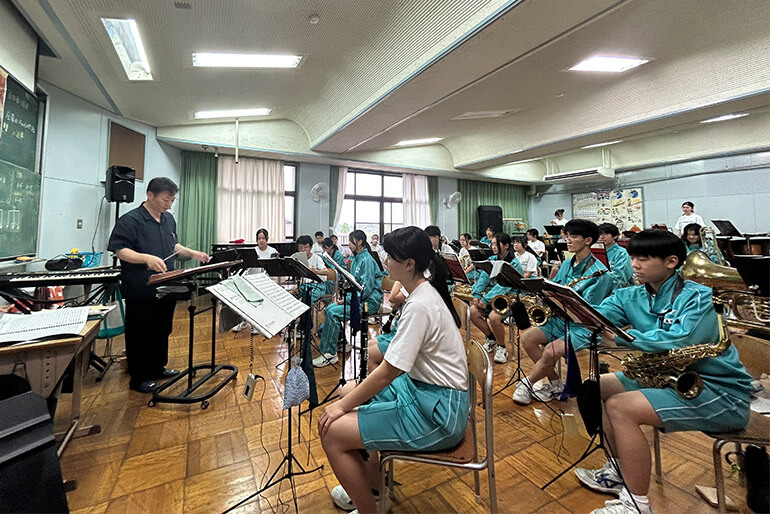
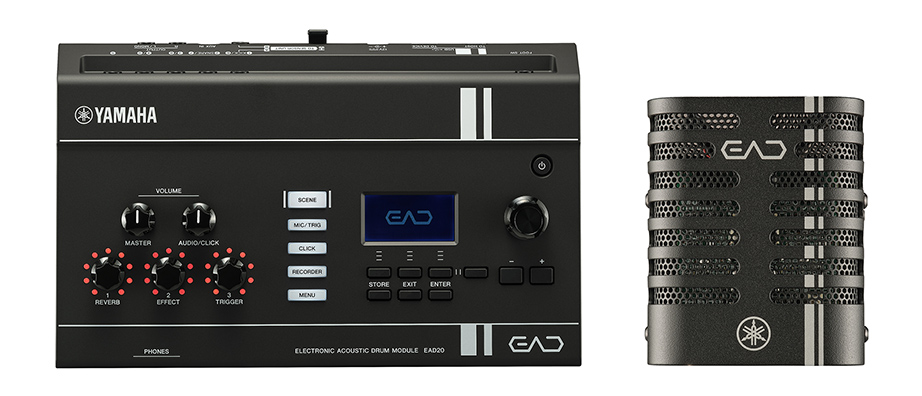
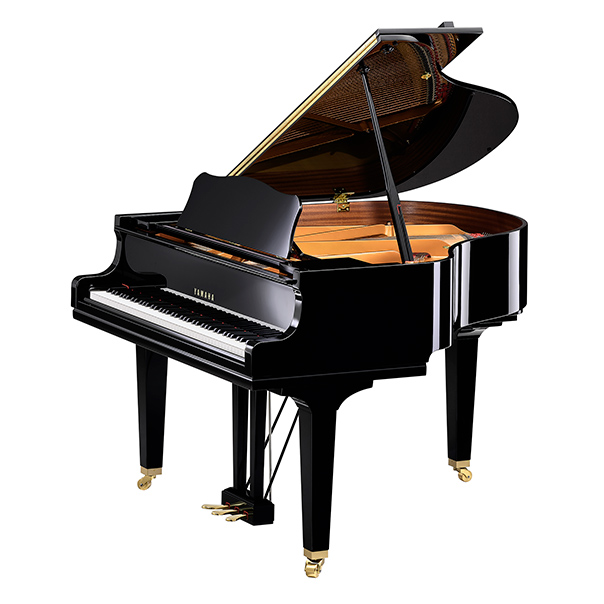
Yamaha Corporation is a diversified manufacturer operating in three main segments: musical instruments, audio equipment, and other businesses. The musical instruments segment includes the production and sale of acoustic and digital pianos, wind instruments, string instruments, percussion, and educational instruments, alongside the operation of YAMAHA MUSIC SCHOOL and media entertainment services such as music publishing and artist management. The audio equipment segment provides consumer and professional solutions, including home audio systems, music production and streaming devices, professional sound systems for venues, network equipment, and automotive audio products. The other businesses segment encompasses automotive interior components, factory automation (FA) machinery, golf equipment, and resort operations. The company serves global markets, with its music schools operating in multiple countries and regions, and its products utilized by consumers, professionals, and commercial entities worldwide. Summarised from the annual report, fiscal year ended Mar 2026 |
Industry Consumer Electronics | Homepage yamaha.com |
| Sector Technology | IR page yamaha.com/en | |
|
Tags
musical instruments, audio equipment, music education, network equipment, automotive interior, factory automation, golf equipment, resort operations, music publishing, professional sound, YAMAHA MUSIC SCHOOL, True Sound
|
Press page yamaha.com/en/news_release |
Metrics
| Valuation | |
|---|---|
| Market cap | ¥ 564.629B |
| Market cap (USD) | $ 3.538B |
| P/E | 16.56 |
| PEG | — |
| P/BV | 1.11 |
| P/S | 1.16 |
| P/OCF | 10.04 |
| P/FCF | 13.35 |
| Dividend yield | 2.1% |
| Turnover / mcap | — |
| Returns | |
|---|---|
| ROE | 5.1% |
| ROI | 4.9% |
| ROIC | 4.1% |
| Profit margin | 5.1% |
| Growth | |
|---|---|
| Revenue growing | Yes |
| Profits growing | No |
| Revenue up 3y | No |
| Revenue up 5y | No |
| Earnings growth 3y (net profit CAGR) | -14.7% |
| Quality | |
|---|---|
| Profitable | Yes |
| Margin expanding | Yes |
| Buying back stock | Yes |
| Diluting (TTM) | No |
| Debt/Equity | — |
| Podcast bulls (TTM) | Sign up |
| Podcast bears (TTM) | Sign up |
| Podcast sentiment (TTM) | Sign up |
| Podcast sentiment % (TTM) | Sign up |
| News sentiment (TTM) | 18 |
| Quality score | 0% |
| Insiders | |
|---|---|
| Buys, 1w | Sign up |
| Buys, 1m | Sign up |
| Buys, 1y | Sign up |
| Sells, 1w | Sign up |
| Sells, 1m | Sign up |
| Sells, 1y | Sign up |
Sign up to see this company's insider trades
| Figure | FY 2026 | FY 2025 | FY 2024 | FY 2023 | FY 2022 | FY 2021 | FY 2020 | FY 2019 | FY 2018 | FY 2017 | FY 2016 | FY 2015 | FY 2014 | FY 2013 |
|---|---|---|---|---|---|---|---|---|---|---|---|---|---|---|
| Revenue | 465.33B | 462.08B | 462.866B | 451.41B | 408.197B | 372.63B | 414.227B | 437.416B | 432.967B | 408.248B | 435.477B | 432.177B | 410.304B | 366.941B |
| Net profit | 23.72B | 13.351B | 29.642B | 38.183B | 37.255B | 26.615B | 34.621B | 43.753B | 54.378B | 46.719B | 32.633B | 24.929B | 22.898B | 4.122B |
| Free cash flow | 31.647B | 32.347B | 20.916B | -35.567B | 21.486B | 45.653B | 36.689B | 10.042B | 24.536B | 25.866B | 30.967B | — | — | — |
| Figure | FY 2026 | FY 2025 | FY 2024 | FY 2023 | FY 2022 | FY 2021 | FY 2020 | FY 2019 | FY 2018 | FY 2017 | FY 2016 | FY 2015 | FY 2014 | FY 2013 |
|---|---|---|---|---|---|---|---|---|---|---|---|---|---|---|
| Share price | 1.102K | 1.154K | 3.266K | 5.097K | 5.357K | 6.008K | 4.221K | 5.536K | 4.669K | 3.063K | 3.393K | 2.1K | 1.329K | 934.85 |
| Price performance 12m | -0.05 | -0.65 | -0.36 | -0.05 | -0.11 | 0.42 | -0.24 | 0.19 | 0.52 | -0.1 | 0.62 | 0.58 | 0.42 | — |
Filed figures
Lines the statements and their notes report beside the headline figures, read from the filings' XBRL as filed (no restatement applied), with figures computed from one filing's own lines. Cash-flow lines carry their cash direction: an outflow is negative. Each period links to its filing; a figure's period, report date and tag are in its tooltip.
| Figure | Mar 2017 | Mar 2018 | Mar 2019 | Mar 2020 | Mar 2021 | Mar 2022 | Mar 2023 | Mar 2024 | Mar 2025 | Mar 2026 |
|---|---|---|---|---|---|---|---|---|---|---|
| Balance sheet detail | ||||||||||
| Trade receivables (JPY) | 51B | 56.5B | 65.3B | 58.1B | 57.3B | 60B | 75.4B | 88B | 87.3B | 87.7B |
| ↳ YoY growth | +4.0% | +10.8% | -11.1% | -1.3% | +4.7% | +25.6% | +16.8% | -0.8% | +0.5% | |
| ↳ 5y CAGR | +6.1% | +8.5% | +8.9% | |||||||
| Borrowings, current (JPY) | 11.2B | 11.2B | 8.94B | — | — | — | — | — | — | — |
| Borrowings, non-current (JPY) | 40M | — | — | — | — | — | — | — | — | — |
| Lease liabilities (JPY) | — | — | 24B | 21.2B | 20.2B | 17.4B | 16.2B | 16.9B | 14.4B | 16.2B |
| Cash and deposits (JPY) | 106B | 123B | 95.8B | 92.7B | 129B | 172B | 104B | 102B | 99.8B | 109B |
| Intangible assets (JPY) | 3.2B | 6.17B | 1.32B | 1.74B | 2.53B | 3.05B | 2.98B | 6.24B | 5.41B | 5.04B |
| Right-of-use assets (JPY) | — | — | 29.6B | 24.5B | 22.2B | 21.7B | 21.9B | 24.1B | 19.2B | 21.9B |
| Net debt (borrowings + leases - cash) (JPY) | -94.6B | -112B | -97.1B | — | — | — | — | — | — | — |
| Cash flow detail | ||||||||||
| Operating cash flow (JPY) | 39.1B | 47.5B | 35.5B | 57.2B | 58.2B | 36B | -14.8B | 43.8B | 55.3B | 45.8B |
| Purchases of property, plant and equipment (JPY) | -13.3B | -23B | -20.2B | -20.5B | -12.6B | -14.5B | -20.7B | -22.9B | -22.9B | -14.1B |
| Change in receivables (cash effect) (JPY) | -3.04B | -5.76B | 987M | 3.28B | 3.08B | 582M | -12.4B | -7B | -464M | 4.82B |
| Change in inventories (cash effect) (JPY) | -3.39B | -312M | -6.24B | -2.84B | 7.67B | -13.8B | -28.3B | 2.11B | 12.3B | 10.3B |
| Change in payables (cash effect) (JPY) | -550M | 2.05B | -1.39B | -4.89B | 3.08B | 3.95B | -4.48B | -2.83B | 2.81B | -4.55B |
| Dividends paid (cash effect) (JPY) | -9.77B | -10.1B | -10.5B | -11.3B | -11.6B | -11.5B | -11.3B | -11.9B | -12.2B | -11.8B |
| Share buybacks (cash effect) (JPY) | -8M | -25B | -11.9B | -21.3B | -9M | -28B | -6.12B | -17.4B | -49.1B | -15B |
| Interest paid (cash effect) (JPY) | -230M | -274M | -859M | -802M | -565M | -404M | -453M | -516M | -581M | -697M |
| Income taxes paid (cash effect) (JPY) | -8.52B | -9.6B | -29.3B | — | — | — | — | — | — | — |
| Operating cash flow before change in receivables (JPY) | 42.2B | 53.3B | 34.5B | 53.9B | 55.1B | 35.4B | -2.47B | 50.8B | 55.7B | 41B |
| Free cash flow (OCF - PPE - intangibles) (JPY) | 25.9B | 24.5B | 15.3B | 36.7B | 45.7B | 21.5B | -35.6B | 20.9B | 32.3B | 31.6B |
| Income detail | ||||||||||
| Research and development expense (JPY) | 24.4B | 24.8B | 24.9B | 24.8B | 24.2B | 24B | 25.1B | 26.9B | 27B | 27.7B |
| ↳ 5y CAGR | +1.7% | +2.8% | ||||||||
| Total comprehensive income (JPY) | 76.1B | 56.4B | 14.4B | 1.62B | 82.2B | 58.5B | 58.3B | 83.5B | 624M | 56.3B |
| Comprehensive income to owners (JPY) | 76.1B | 56.2B | 14.4B | 1.6B | 82B | 58.3B | 58.3B | 83.3B | 517M | 56.1B |
| Provision for credit losses (JPY) | 149M | 103M | 124M | — | — | — | — | — | — | — |
| Credit cost ratio (credit losses / average receivables) (%) | 0.3% | 0.2% | 0.2% | — | — | — | — | — | — | — |
| Segments | ||||||||||
| Music · Segment revenue (JPY) | — | — | 279B | 269B | 239B | 276B | 303B | 305B | 296B | 305B |
| ↳ YoY growth | -3.6% | -11.3% | +15.6% | +9.6% | +0.8% | -3.0% | +3.0% | |||
| Professional And Consumer Audio · Segment revenue (JPY) | — | — | 120B | 114B | 104B | 96.9B | 108B | 121B | 128B | 143B |
| ↳ YoY growth | -4.8% | -9.2% | -6.6% | +11.1% | +12.5% | +6.0% | +11.1% | |||
| Reported | Jun 23, 2017 | Jun 26, 2018 | Jun 30, 2020 | Jun 30, 2020 | Jun 25, 2021 | Jun 23, 2022 | Jun 30, 2023 | Jun 25, 2024 | Jun 23, 2025 | Jun 25, 2026 |
Sign up to see institutional holdings
Sign UpPodcast Mentions
Sign up to see podcast mentions and sentiment
Sign UpTimely disclosures published on TDnet, newest first, titles as filed in Japanese. The link opens the disclosure on TDnet. Filings with EDINET (periodic reports, extraordinary reports, offerings, holding and buy-back reports), newest first, titles as filed in Japanese. The link opens the filing on EDINET. Press releases from the company's own website, newest first.




















Prompts
Click prompts to add them under the company line, click again to take one out, then copy the result into your AI chat. Shared by Asian Century Stocks and Uncovered Thai Stocks. Thank you.
Yamaha Corporation (ticker 7951), listed in Japan.
Copied
ETFs Holding Yamaha Corporation
Exchange-traded funds whose newest published daily portfolio holds one of the company's listings, largest weight first.
| ETF | Weight in ETF | Shares | Market value | As of |
|---|---|---|---|---|
| FYLD | 1.02% | 928,520 | $ 7.257M | Jul 31, 2026 |
| AVDS | 0.13% | 58,200 | $ 482.991K | Nov 16, 2026 |
| DFIS | 0.07% | 483,300 | $ 3.931M | Nov 12, 2026 |
| DXIV | 0.05% | 15,200 | $ 123.625K | Nov 12, 2026 |
| AVSD | 0.04% | 17,100 | $ 141.91K | Nov 16, 2026 |
| DFIC | 0.03% | 508,900 | $ 4.139M | Nov 12, 2026 |
| DFSI | 0.03% | 38,403 | $ 312.34K | Nov 12, 2026 |
| DFAX | 0.02% | 319,803 | $ 2.601M | Nov 12, 2026 |
| AVDE | 0.02% | 353,100 | $ 2.93M | Nov 16, 2026 |
| DFIV | 0.02% | 484,500 | $ 3.941M | Nov 12, 2026 |
| DFAI | 0.02% | 390,200 | $ 3.174M | Nov 12, 2026 |
| DISV | 0.01% | 49,800 | $ 405.034K | Nov 12, 2026 |