2026年3月期 決算短信〔日本基準〕(連結) 上場会社名 共同印刷株式会社 コード番号 7914 URL https://www.kyodoprinting.co.jp/ 代表者 (役職名) 代表取締役社長 (氏名)大橋輝臣 問合せ先責任者 (役職名) 広報・IR部長 (氏名)山田麗子…
2026年3月期
決算短信〔日本基準〕(連結)
上場会社名
共同印刷株式会社
コード番号
7914
URL https://www.kyodoprinting.co.jp/
代表者
(役職名) 代表取締役社長
(氏名)大橋輝臣
問合せ先責任者 (役職名) 広報・IR部長
(氏名)山田麗子
定時株主総会開催予定日
2026年6月25日
配当支払開始予定日
有価証券報告書提出予定日 2026年6月19日
決算補足説明資料作成の有無: 有
決算説明会開催の有無
2026年5月15日
上場取引所東
TEL 03-3817-2520
2026年6月26日
: 有 (機関投資家・アナリスト向け)
(百万円未満切捨て)
1.2026年3月期の連結業績(2025年4月1日~2026年3月31日)
(1)連結経営成績
売上高
2026年3月期
2025年3月期
百万円
98,205
99,977
(注)包括利益
2026年3月期
営業利益
%
△1.8
3.1
経常利益
百万円
2,134
2,331
%
△8.4
47.8
4,995百万円(223.3%)
1株当たり
当期純利益
円銭
141.15
115.00
2026年3月期
2025年3月期
(%表示は対前期増減率)
百万円
2,727
2,746
2025年3月期
潜在株式調整後
1株当たり当期純利益
円銭
-
-
%
△0.7
31.8
親会社株主に帰属する
当期純利益
百万円
%
3,960
19.6
3,310
121.3
1,544百万円
自己資本
当期純利益率
%
6.2
5.3
(△78.9%)
総資産
経常利益率
%
2.2
2.1
売上高
営業利益率
%
2.2
2.3
(参考)持分法投資損益
2026年3月期
-百万円
2025年3月期
-百万円
(注)当社は2025年4月1日付で普通株式1株につき4株の割合で株式分割を行っております。前連結会計年度の期首に
株式分割が行われたと仮定して、「1株当たり当期純利益」を算定しております。
(2)連結財政状態
総資産
2026年3月期
2025年3月期
純資産
百万円
123,801
126,168
自己資本比率
百万円
65,261
62,913
1株当たり純資産
円銭
2,359.63
2,233.66
%
52.7
49.8
(参考)自己資本
2026年3月期
65,234百万円
2025年3月期
62,892百万円
(注)当社は2025年4月1日付で普通株式1株につき4株の割合で株式分割を行っております。前連結会計年度の期首に
株式分割が行われたと仮定して、「1株当たり純資産」を算定しております。
(3)連結キャッシュ・フローの状況
営業活動による
キャッシュ・フロー
百万円
2026年3月期
6,589
2025年3月期
6,744
投資活動による
キャッシュ・フロー
百万円
△1,121
△902
財務活動による
キャッシュ・フロー
百万円
△5,360
△4,637
現金及び現金同等物
期末残高
百万円
12,366
12,184
2.配当の状況
第1四半期末
円銭
2025年3月期
-
2026年3月期
-
2027年3月期(予想)
-
第2四半期末
円銭
55.00
38.00
40.00
年間配当金
第3四半期末
円銭
-
-
-
期末
円銭
85.00
40.00
40.00
合計
円銭
140.00
78.00
80.00
配当金総額
(合計)
百万円
1,035
2,251
配当性向
(連結)
%
30.4
55.3
52.7
純資産配当
率(連結)
%
1.6
3.4
(注)当社は2025年4月1日付で普通株式1株につき4株の割合で株式分割を行っております。2025年3月期について
は、当該株式分割前の実際の配当金の額を記載しております。2026年3月期及び2027年3月期(予想)について
は、当該株式分割後の配当金の額を記載しております。
3.2027年3月期の連結業績予想(2026年4月1日~2027年3月31日)
売上高
第2四半期(累計)
通期
百万円
49,000
101,000
営業利益
%
2.9
2.8
百万円
850
2,500
※ 注記事項
(1)期中における連結範囲の重要な変更: 有
新規 1社 (社名)Kodama Tales Inc.、除外
経常利益
%
38.9
17.1
百万円
1,100
2,950
%
9.6
8.2
-社
(社名)-
(%表示は対前期増減率)
親会社株主に帰属
1株当たり
する当期純利益
当期純利益
百万円
%
円銭
1,700
25.8
61.49
4,200
6.0
151.92
(2)会計方針の変更・会計上の見積りの変更・修正再表示
① 会計基準等の改正に伴う会計方針の変更: 無
②
①以外の会計方針の変更
: 無
③
会計上の見積りの変更
: 無
④
修正再表示
: 無
(3)発行済株式数(普通株式)
① 期末発行済株式数(自己株式を含む)
② 期末自己株式数
③ 期中平均株式数
2026年3月期
30,000,000株 2025年3月期
33,480,000株
2026年3月期
2,353,718株 2025年3月期
5,323,152株
2026年3月期
28,058,781株 2025年3月期
28,790,458株
(注)当社は、2025年4月1日付で普通株式1株につき4株の割合で株式分割を行っております。これに伴い、
前連結会計年度の期首に株式分割が行われたと仮定して、「期末発行済株式数」、「期末自己株式数」及び
「期中平均株式数」を算定しております。また期末自己株式及び期中平均株式数の算定上控除する自己株式
には、「株式給付信託(BBT-RS、J-ESOP及び従業員持株会処分型)」の信託財産として、株式
会社日本カストディ銀行(信託E口)が所有する当社株式を含めております。また当社は、2025年12月10日
付で自己株式の消却を行っております。これにより、期末発行済株式数(自己株式数を含む)及び期末自己
株式数が3,480,000株減少しております。
(参考)個別業績の概要
2026年3月期の個別業績(2025年4月1日~2026年3月31日)
(1)個別経営成績
2026年3月期
2025年3月期
売上高
百万円
88,214
89,815
%
△1.8
3.9
営業利益
百万円
707
528
円銭
146.34
156.21
潜在株式調整後
1株当たり当期純利益
円銭
-
-
1株当たり
当期純利益
2026年3月期
2025年3月期
%
33.9
-
(%表示は対前期増減率)
経常利益
百万円
%
2,790
△10.1
3,102
43.1
当期純利益
百万円
%
4,105
△8.7
4,497
496.6
(注)当社は2025年4月1日付で普通株式1株につき4株の割合で株式分割を行っております。これに伴い、前事業年度
の期首に株式分割が行われたと仮定して、「1株当たり当期純利益」を算定しております。
(2)個別財政状態
総資産
2026年3月期
2025年3月期
純資産
百万円
116,038
116,779
自己資本比率
百万円
56,772
54,702
%
48.9
46.8
1株当たり純資産
円銭
2,053.52
1,942.76
(参考)自己資本
2026年3月期
56,772百万円
2025年3月期
54,702百万円
(注)当社は2025年4月1日付で普通株式1株につき4株の割合で株式分割を行っております。これに伴い、前事業年度
の期首に株式分割が行われたと仮定して、「1株当たり純資産」を算定しております。
※
決算短信は公認会計士又は監査法人の監査の対象外です
※
業績予想の適切な利用に関する説明、その他特記事項
本資料に記載されている業績見通し等の将来に関する記述は、当社が現在入手している情報及び合理的であると判
断する一定の前提に基づいており、その達成を当社として約束する趣旨のものではありません。また、実際の業績等
は様々な要因により大きく異なる可能性があります。業績予想の前提となる条件及び業績予想のご利用に当たっての
注意事項等については、添付資料3ページ「1.経営成績等の概況(1)当期の経営成績の概況 ②今後の見通し」
をご覧ください。
共同印刷(株) (7914) 2026年3月期決算短信
○添付資料の目次
1.経営成績等の概況 ………………………………………………………………………………………………………
(1)当期の経営成績の概況 ……………………………………………………………………………………………
(2)当期の財政状態の概況 ……………………………………………………………………………………………
(3)利益配分に関する基本方針及び当期・次期の配当 ……………………………………………………………
2.企業集団の状況 …………………………………………………………………………………………………………
3.会計基準の選択に関する基本的な考え方 ……………………………………………………………………………
4.連結財務諸表及び主な注記 ……………………………………………………………………………………………
(1)連結貸借対照表 ……………………………………………………………………………………………………
(2)連結損益計算書及び連結包括利益計算書 ………………………………………………………………………
連結損益計算書 ……………………………………………………………………………………………………
連結包括利益計算書 ………………………………………………………………………………………………
(3)連結株主資本等変動計算書 ………………………………………………………………………………………
(4)連結キャッシュ・フロー計算書 …………………………………………………………………………………
(5)連結財務諸表に関する注記事項 …………………………………………………………………………………
(継続企業の前提に関する注記) …………………………………………………………………………………
(連結財務諸表作成のための基本となる重要な事項) …………………………………………………………
(重要な会計上の見積り) …………………………………………………………………………………………
(追加情報の注記) …………………………………………………………………………………………………
(連結貸借対照表関係) ……………………………………………………………………………………………
(連結損益計算書関係) ……………………………………………………………………………………………
(連結包括利益計算書関係) ………………………………………………………………………………………
(連結株主資本等変動計算書関係) ………………………………………………………………………………
(連結キャッシュ・フロー計算書関係) …………………………………………………………………………
(セグメント情報等の注記) ………………………………………………………………………………………
(1株当たり情報の注記) …………………………………………………………………………………………
(重要な後発事象の注記) …………………………………………………………………………………………
5.その他 ……………………………………………………………………………………………………………………
2
2
4
5
6
7
8
8
10
10
12
13
15
16
16
16
18
19
20
21
24
25
27
28
32
32
33
共同印刷(株) (7914) 2026年3月期決算短信
1.経営成績等の概況
(1)当期の経営成績の概況
①当期の経営成績
当期におけるわが国の経済は、米国の通商政策による影響が一部に見られるものの、雇用・所得環境の改善の動
きなどにより、緩やかな回復傾向が続きました。その一方で、ビジネスを取り巻く環境は、生成AI技術の急速な
発達や、人権や地球環境問題といった社会課題への対応など、複雑かつ多様になっております。さらに、足元では
中東情勢の動向や物価上昇が企業業績や個人消費を下押しする懸念があり、景気の先行きには注意を要する状況と
なっております。
このような状況の中、当社グループは、2025年5月に公表した2025年度を起点とする3カ年の中期経営計画の目
標達成に向け、既存事業の収益性向上と期待事業の着実な育成を進めております。
情報系事業では、事業の重心を印刷から情報加工サービスを中心とした非印刷へと移行する取り組みを強化して
おり、IP(知的財産)を活用した各種企画や法人向け教育プログラム、健康管理支援サービスなど、高品質なサ
ービスの開発・提供に注力しております。
生活・産業資材系事業では、食品や日用品向けに、高い機能性や意匠性を兼ね備え、環境負荷の低減にも配慮し
た包装資材を提供しております。加えて、産業用包装資材など新たな市場の開拓に努めるとともに、東南アジアを
中心とした成長市場における販売拡大に注力しております。
以上の結果、当連結会計年度の業績は、売上高は982億5百万円(前期比1.8%減)、営業利益は21億3千4百万
円(前期比8.4%減)、経常利益は27億2千7百万円(前期比0.7%減)となりました。また、特別利益に投資有価
証券売却益34億4百万円を計上したことなどから、親会社株主に帰属する当期純利益は39億6千万円(前期比
19.6%増)となりました。
セグメント別の概況は、次のとおりであります。
セグメント別売上高
(単位:百万円)
前連結会計年度
当連結会計年度
増減率
情報コミュニケーション部門
34,658
32,344
△6.7%
情報セキュリティ部門
30,755
30,478
△0.9%
生活・産業資材部門
32,331
33,170
2.6%
その他
2,231
2,211
△0.9%
合計
99,977
98,205
△1.8%
情報コミュニケーション部門
出版印刷は、書籍ではコミックスが好調だったものの単行本や絵本が減少し、雑誌では収益性向上に向けて不採算
案件から撤退するなど受注管理を強化したこともあり、前期を下回りました。一般商業印刷は、統合報告書制作など
のIR分野や店頭什器・イベント制作などの店頭販促分野が伸長したものの、カタログ・情報誌が大きく減少し、前
期を下回りました。一方、注力分野であるオリジナルコンテンツ事業は、法人向け教育プログラム開発支援や電子コ
ミックの販売促進強化により、前期を上回りました。
以上の結果、部門全体の売上高は323億4千4百万円(前期比6.7%減)、営業損失は2億2千2百万円(前期は営
業損失1億7千6百万円)となりました。
情報セキュリティ部門
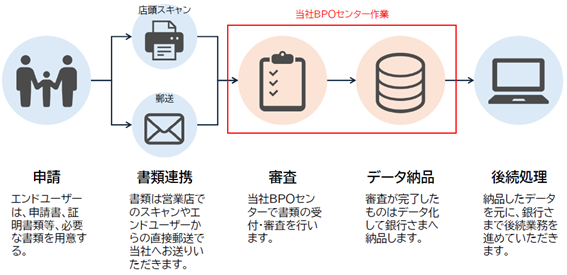
ビジネスフォームは、企業の健康経営支援サービスを中心とするヘルスケア分野と、非対面での手続きを可能にす
る口座開設アプリなど金融機関向けの情報サービスBPOが引き続き好調に推移しました。一方で官公庁向けのデー
タプリントは減少したため、全体では前期を下回りました。証券類とカードは、乗車券類が増加したものの交通系I
Cカードが減少し、前期を下回りました。
以上の結果、部門全体の売上高は304億7千8百万円(前期比0.9%減)、営業利益は11億2千8百万円(前期比
42.3%減)となりました。
共同印刷(株) (7914) 2026年3月期決算短信
生活・産業資材部門
チューブは、歯磨き向けをはじめ、UV製品やヘアケア製品などの化粧品向けが増加し、調味料向けのブローチュ
ーブやブローボトルも堅調に推移した結果、前期を上回りました。軟包装は、即席めん向けやカイロ向けのフィルム
包装が伸長したほか、フタ材の需要が増加したこともあり、前期を上回りました。紙器は、ラップカートンの生産体
制を強化したことにより受注が増加し、前期を上回りました。産業資材は医薬品向けの受注が減少するも、全体とし
ては堅調な推移となりました。
以上の結果、部門全体の売上高は331億7千万円(前期比2.6%増)、営業利益は15億2千1百万円(前期比25.7%
増)となりました。
その他
不動産や物流などの事業から構成され、売上高は22億1千1百万円(前期比0.9%減)、営業利益は2億7千万円
(前期比67.1%増)となりました。
②今後の見通し
当社グループを取り巻く経営環境は、地政学リスクによる物価上昇やサプライチェーンの混乱が、企業の収益性悪
化や個人消費の下押しにつながることが懸念され、先行きは不透明な状況であります。加えて、デジタル化の進展や
消費者ニーズの多様化による紙媒体の縮小を受け、厳しさが増しております。
このような環境のもと、当社グループは長期ビジョン「NexTOMOWEL2034」を掲げ、事業ポートフォリオ
の変革により生活・産業資材系事業を成長させて情報系事業との売上高比率を1:1とし、2034年度に売上高1.5倍
(2024年度比)、営業利益120億円の達成をめざしてまいります。これらの目標に向けファーストステップと位置付
けている2025年度起点の中期経営計画では、既存事業の基盤強化と成長に向けた足場固めとなる各種施策を推進して
まいります。
情報系事業では、事業の重心を印刷から情報加工サービスを中心とした非印刷へと移行する取り組みを強化いたし
ます。期待事業であるオリジナルコンテンツ事業では、IP(知的財産)を活用したイベント企画やグッズ販売の取
り組み、デジタルコミックのオリジナル作品の制作・販売、法人向け教育プログラムなどの開発に注力します。情報
サービスBPOでは、質の高いサービス提供と市場でのプレゼンス向上に努めます。あわせて、当社グループ内の出
版印刷事業の組織を再編し、さらなる合理化と柔軟な運用体制の構築を進めることで、量産型から高付加価値型へ生
産モデルを転換し、収益性の向上を図ってまいります。
生活・産業資材系事業では、主力商品である、ラミネートチューブやトップシール材をはじめとする軟包装の売上
拡大に向け、新規市場の開拓や環境に配慮した包材の開発などに取り組んでおります。また、期待事業である産業用
包材については、梱包・物流資材分野を中心に開拓を進めております。さらに東南アジアを中心とした海外市場での
事業拡大をめざし、協業も視野に入れた取り組みを進めてまいります。
翌連結会計年度の業績見通しについては、売上高1,010億円(当期比2.8%増)、営業利益25億円(当期比17.1%
増)、経常利益29億5千万円(当期比8.2%増)、親会社株主に帰属する当期純利益42億円(当期比6.0%増)を見込
んでおります。
なお、直近の中東情勢の不安定化に伴う資材の調達リスク及び価格上昇等の当社グループ業績に与える影響につき
ましては、現時点では合理的な算定が困難な状況であるため、本業績見通しに含めておりません。今後、業績に重要
な影響を及ぼすと判断される事象が生じた場合には、速やかに開示いたします。
共同印刷(株) (7914) 2026年3月期決算短信
(2)当期の財政状態の概況
①資産、負債及び純資産の状況
総資産は、1,238億1百万円(前連結会計年度末1,261億6千8百万円)となり、23億6千7百万円減少しました。こ
れは主に、売上債権が12億8千5百万円減少したことによるものです。負債は、585億4千万円(前連結会計年度末632
億5千5百万円)となり、47億1千5百万円減少しました。これは主に、仕入債務が13億3百万円、長期借入金が24億
4千6百万円減少したことによるものです。純資産は、652億6千1百万円(前連結会計年度末629億1千3百万円)と
なり、23億4千7百万円増加しました。これは主に、親会社株主に帰属する当期純利益39億6千万円の計上、その他有
価証券評価差額金5億8千7百万円の増加と、剰余金の配当17億2千8百万円、自己株式の取得9億5千8百万円があ
ったことによるものです。
②キャッシュ・フローの状況
当連結会計年度における現金及び現金同等物(以下「資金」という。)は、前連結会計年度末に比べ1億8千2百万
円増加し123億6千6百万円となりました。
「営業活動によるキャッシュ・フロー」
当連結会計年度において営業活動により得られた資金は、65億8千9百万円(前期比1億5千4百万円減)となりま
した。これは主に、税金等調整前当期純利益58億1千4百万円、減価償却費57億9千5百万円の計上、売上債権の減少
12億6千2百万円と、仕入債務の減少12億8千7百万円、法人税等の支払額17億2千1百万円があったことによるもの
です。
「投資活動によるキャッシュ・フロー」
当連結会計年度において投資活動により使用した資金は、11億2千1百万円(前期比2億1千9百万円増)となりま
した。これは主に、有形及び無形固定資産の取得による支出49億2千8百万円と投資有価証券の売却による収入40億8
千2百万円があったことによるものです。
「財務活動によるキャッシュ・フロー」
当連結会計年度において財務活動により使用した資金は、53億6千万円(前期比7億2千2百万円増)となりまし
た。これは主に、長期借入金の返済による支出25億9千万円、自己株式の取得による支出9億5千8百万円、配当金の
支払17億2千8百万円があったことによるものです。
(参考)キャッシュ・フロー関連指標の推移
2023年3月期
2024年3月期
2025年3月期
2026年3月期
自己資本比率(%)
46.7
47.9
49.8
52.7
時価ベースの自己資本比率(%)
17.0
19.1
23.0
35.5
キャッシュ・フロー対有利子負債比率(年)
0.6
5.0
1.9
1.6
インタレスト・カバレッジ・レシオ(倍)
158.8
20.6
36.4
38.2
※自己資本比率:自己資本/総資産
時価ベースの自己資本比率:株式時価総額/総資産
キャッシュ・フロー対有利子負債比率:有利子負債/キャッシュ・フロー
インタレスト・カバレッジ・レシオ:キャッシュ・フロー/利払い
1.各指標は、いずれも連結ベースの財務数値により算出しております。
2.株式時価総額は、期末株価終値×期末発行済株式数(自己株式控除後)により算出しております。
3.キャッシュ・フローは連結キャッシュ・フロー計算書の営業活動によるキャッシュ・フローを使用しておりま
す。有利子負債は、連結貸借対照表に計上されている負債のうち利子を支払っている全ての負債を対象としてお
ります。また、利払いについては、連結キャッシュ・フロー計算書の利息の支払額を使用しております。
共同印刷(株) (7914) 2026年3月期決算短信
(3)利益配分に関する基本方針及び当期・次期の配当
当社は、定款の定めに基づき取締役会の決議によって行う中間配当を除き、剰余金の配当等については株主総会の決
議によって決定しております。
利益配分につきましては、持続的な企業活動のために財務基盤の健全性を維持した上で、株主の皆さまへの安定的か
つ継続的な利益配分に努めております。
配当につきましては、企業価値の向上と安定的な株主還元を実現するため、自己資本配当率(DOE)3.5%を目安
といたします。
事業基盤の強化のため、技術開発、人材やDX等への投資を拡充して持続可能な利益を創出するとともに、事業提携
やM&Aなどの成長投資を積極的に実行し、利益の拡大を図ります。
(参考)
自己資本配当率(DOE)=1株当たり配当金/((前期末1株当たり自己資本+当期末1株当たり自己資本)/2)
※1株当たり自己資本の算定上、期末株式数から控除する自己株式には、「株式給付信託(BBT-RS、J-ES
OP及び従業員持株会処分型)」の信託財産として株式会社日本カストディ銀行(信託E口)が所有する当社株式
を含めません。
①当期の配当
期末配当金は、期初の予想より2円増配し、1株当たり40円とさせていただく予定です。年間配当金につきまして
は、先に実施しました中間配当金1株当たり38円と合わせ78円となり、これによりDOEは3.5%となります。
なお、当期は、経営環境に応じた機動的な資本政策の遂行及び資本効率の向上を通じて株主利益の向上を図るた
め、取締役会決議により、自己株式600,000株を9億5千8百万円で取得しております。これにより総還元性向は
81.1%となります。
②次期の配当
次期の配当金につきましては、年間配当80円(中間配当40円、期末配当40円)を予想しております。
共同印刷(株) (7914) 2026年3月期決算短信
2.企業集団の状況
当社グループは、当社、子会社16社及び関連会社1社で構成され、製版・印刷・製本及びこれらに関連する付帯事業
を中心として事業を展開しております。
当社グループの主要な事業内容は次のとおりであります。
セグメント区分
情報コミュニケーション部門
主要な事業内容
週刊誌、月刊誌、季刊誌、単行本、全集、教科書、ポスター、カレンダー、
広告宣伝媒体及び装飾展示等の企画・制作、電子書籍等
情報セキュリティ部門
各種ビジネスフォーム、証券類、各種カード、データプリント、BPO、決済
ソリューション等
生活・産業資材部門
紙器、軟包装用品、各種チューブ、ブローボトル、金属印刷、建材用品印刷、
電子機器部品、高機能材料等
その他
物流業、不動産管理業等
主な事業の系統図は次のとおりであります。
(注)当連結会計年度において、デジタルカタパルト株式会社の完全子会社であるKodama Tales Inc.を連結の範囲に含
めております。
共同印刷(株) (7914) 2026年3月期決算短信
3.会計基準の選択に関する基本的な考え方
当社グループは、連結財務諸表の期間及び企業間の比較可能性を考慮し、日本基準で連結財務諸表を作成しておりま
す。
なお、IFRS(国際財務報告基準)の適用につきましては、国内外の諸情勢を考慮の上、適切に対応していく方針
であります。
共同印刷(株) (7914) 2026年3月期決算短信
4.連結財務諸表及び主な注記
(1)連結貸借対照表
(単位:百万円)
前連結会計年度
(2025年3月31日)
資産の部
流動資産
現金及び預金
受取手形
売掛金
商品及び製品
仕掛品
原材料及び貯蔵品
その他
貸倒引当金
流動資産合計
固定資産
有形固定資産
建物及び構築物(純額)
機械装置及び運搬具(純額)
工具、器具及び備品(純額)
土地
リース資産(純額)
建設仮勘定
有形固定資産合計
無形固定資産
ソフトウエア
その他
無形固定資産合計
投資その他の資産
投資有価証券
退職給付に係る資産
繰延税金資産
その他
貸倒引当金
投資その他の資産合計
固定資産合計
資産合計
当連結会計年度
(2026年3月31日)
12,254
5,583
21,344
3,524
2,822
1,636
642
△27
47,780
12,438
5,438
20,203
3,598
2,880
1,875
692
△14
47,113
26,256
11,714
1,550
14,928
1,025
493
※1 55,968
24,683
10,871
1,498
14,841
1,208
414
※1 53,518
1,221
309
1,530
1,216
310
1,527
※2 17,501
※2 17,652
2,387
364
641
△5
20,889
78,388
126,168
2,705
409
880
△5
21,642
76,687
123,801
共同印刷(株) (7914) 2026年3月期決算短信
(単位:百万円)
前連結会計年度
(2025年3月31日)
負債の部
流動負債
支払手形及び買掛金
短期借入金
1年内償還予定の社債
1年内返済予定の長期借入金
リース債務
未払法人税等
賞与引当金
役員賞与引当金
その他
流動負債合計
固定負債
社債
長期借入金
リース債務
繰延税金負債
役員株式給付引当金
退職給付に係る負債
資産除去債務
長期前受金
製品補償引当金
その他
固定負債合計
負債合計
純資産の部
株主資本
資本金
資本剰余金
利益剰余金
自己株式
株主資本合計
その他の包括利益累計額
その他有価証券評価差額金
為替換算調整勘定
退職給付に係る調整累計額
その他の包括利益累計額合計
非支配株主持分
純資産合計
負債純資産合計
当連結会計年度
(2026年3月31日)
11,764
156
-
※3 2,434
351
1,256
968
95
9,234
26,262
10,461
251
5,000
※3 3,088
433
1,291
966
100
8,079
29,672
5,000
4,309
765
3,423
28
6,564
9
16,600
40
249
36,992
63,255
-
1,208
872
4,033
16
5,986
2
16,368
39
341
28,867
58,540
4,510
1,687
51,110
△4,248
53,059
4,510
1,687
50,461
△2,286
54,372
9,355
550
△73
9,833
20
62,913
126,168
9,942
416
503
10,862
26
65,261
123,801
共同印刷(株) (7914) 2026年3月期決算短信
(2)連結損益計算書及び連結包括利益計算書
(連結損益計算書)
(単位:百万円)
前連結会計年度
(自 2024年4月1日
至 2025年3月31日)
売上高
売上原価
売上総利益
販売費及び一般管理費
発送費
旅費交通費及び通信費
貸倒引当金繰入額
給料及び手当
賞与引当金繰入額
役員賞与引当金繰入額
役員株式給付引当金繰入額
退職給付費用
福利厚生費
減価償却費
その他
販売費及び一般管理費合計
営業利益
営業外収益
受取利息
受取配当金
物品売却益
設備賃貸料
保険配当金
為替差益
その他
営業外収益合計
営業外費用
支払利息
設備賃貸費用
支払補償費
為替差損
その他
営業外費用合計
経常利益
当連結会計年度
(自 2025年4月1日
至 2026年3月31日)
99,977
98,205
※1 79,844
※1 77,310
20,132
20,894
3,216
294
3
7,141
431
95
9
559
1,688
1,027
3,333
※1 17,801
2,331
3,297
335
△11
7,481
426
99
8
493
1,943
1,054
3,630
※1 18,759
2,134
7
321
37
69
150
-
235
823
8
398
32
69
177
12
241
940
184
33
41
23
125
408
2,746
174
32
34
-
105
347
2,727
共同印刷(株) (7914) 2026年3月期決算短信
(単位:百万円)
前連結会計年度
(自 2024年4月1日
至 2025年3月31日)
特別利益
固定資産売却益
投資有価証券売却益
その他
特別利益合計
特別損失
固定資産処分損
投資有価証券売却損
投資有価証券評価損
減損損失
製品補償引当金繰入額
訴訟関連損失
工場再編費用
その他
特別損失合計
税金等調整前当期純利益
法人税、住民税及び事業税
法人税等調整額
法人税等合計
当期純利益
非支配株主に帰属する当期純利益又は非支配株主に
帰属する当期純損失(△)
親会社株主に帰属する当期純利益
当連結会計年度
(自 2025年4月1日
至 2026年3月31日)
※2 2
2,821
17
2,842
※2 31
※3 162
※3 111
4
110
※4 146
40
※5 142
※6 285
68
960
4,628
1,256
81
1,338
3,289
9
49
※4 126
-
-
※6 16
34
348
5,814
1,826
22
1,849
3,965
△21
5
3,310
3,960
3,404
0
3,435
共同印刷(株) (7914) 2026年3月期決算短信
(連結包括利益計算書)
(単位:百万円)
前連結会計年度
(自 2024年4月1日
至 2025年3月31日)
当期純利益
その他の包括利益
その他有価証券評価差額金
為替換算調整勘定
退職給付に係る調整額
その他の包括利益合計
包括利益
(内訳)
親会社株主に係る包括利益
非支配株主に係る包括利益
当連結会計年度
(自 2025年4月1日
至 2026年3月31日)
3,289
3,965
△2,025
195
85
※ △1,744
1,544
587
△135
577
※ 1,029
4,995
1,562
△17
4,989
5
共同印刷(株) (7914) 2026年3月期決算短信
(3)連結株主資本等変動計算書
前連結会計年度(自 2024年4月1日
至
2025年3月31日)
(単位:百万円)
株主資本
資本金
当期首残高
資本剰余金
4,510
利益剰余金
1,687
自己株式
48,592
株主資本合計
△3,289
51,500
当期変動額
剰余金の配当
△792
△792
親会社株主に帰属する当期
純利益
3,310
3,310
自己株式の取得
△1,000
△1,000
自己株式の処分
41
41
株主資本以外の項目の当期
変動額(純額)
当期変動額合計
当期末残高
-
-
2,518
△959
1,558
4,510
1,687
51,110
△4,248
53,059
その他の包括利益累計額
当期首残高
その他有価証券
評価差額金
為替換算調整勘定
退職給付に係る
調整累計額
その他の包括利
益累計額合計
11,381
356
△156
11,581
非支配株主持分
38
純資産合計
63,120
当期変動額
剰余金の配当
△792
親会社株主に帰属する当期
純利益
3,310
自己株式の取得
△1,000
自己株式の処分
41
株主資本以外の項目の当期
変動額(純額)
当期変動額合計
当期末残高
△2,025
194
83
△1,748
△17
△1,765
△2,025
194
83
△1,748
△17
△207
9,355
550
△73
9,833
20
62,913
共同印刷(株) (7914) 2026年3月期決算短信
当連結会計年度(自
2025年4月1日
至
2026年3月31日)
(単位:百万円)
株主資本
資本金
当期首残高
資本剰余金
4,510
利益剰余金
1,687
自己株式
51,110
株主資本合計
△4,248
53,059
当期変動額
剰余金の配当
親会社株主に帰属する当期
純利益
△1,728
△1,728
3,960
3,960
自己株式の取得
△958
△958
自己株式の処分
62
62
2,857
-
自己株式の消却
△2,857
非支配株主との取引に係る
親会社の持分変動
△0
△0
連結範囲の変動
△23
△23
株主資本以外の項目の当期
変動額(純額)
当期変動額合計
当期末残高
-
△0
△648
1,962
1,313
4,510
1,687
50,461
△2,286
54,372
その他の包括利益累計額
当期首残高
その他有価証券
評価差額金
為替換算調整勘定
退職給付に係る
調整累計額
その他の包括利
益累計額合計
9,355
550
△73
9,833
非支配株主持分
20
純資産合計
62,913
当期変動額
剰余金の配当
△1,728
親会社株主に帰属する当期
純利益
3,960
自己株式の取得
△958
自己株式の処分
62
自己株式の消却
-
非支配株主との取引に係る
親会社の持分変動
△0
連結範囲の変動
△23
株主資本以外の項目の当期
変動額(純額)
当期変動額合計
当期末残高
587
△134
576
1,029
5
1,034
587
△134
576
1,029
5
2,347
9,942
416
503
10,862
26
65,261
共同印刷(株) (7914) 2026年3月期決算短信
(4)連結キャッシュ・フロー計算書
(単位:百万円)
前連結会計年度
(自 2024年4月1日
至 2025年3月31日)
営業活動によるキャッシュ・フロー
税金等調整前当期純利益
減価償却費
のれん償却額
減損損失
退職給付に係る資産及び負債の増減額
貸倒引当金の増減額(△は減少)
賞与引当金の増減額(△は減少)
役員賞与引当金の増減額(△は減少)
製品補償引当金の増減額(△は減少)
受取利息及び受取配当金
支払利息
投資有価証券評価損益(△は益)
投資有価証券売却損益(△は益)
固定資産除売却損益(△は益)
売上債権の増減額(△は増加)
棚卸資産の増減額(△は増加)
仕入債務の増減額(△は減少)
未払消費税等の増減額(△は減少)
破産更生債権等の増減額(△は増加)
その他
小計
利息及び配当金の受取額
利息の支払額
法人税等の支払額
営業活動によるキャッシュ・フロー
投資活動によるキャッシュ・フロー
有形及び無形固定資産の取得による支出
有形及び無形固定資産の売却による収入
投資有価証券の取得による支出
投資有価証券の売却による収入
貸付けによる支出
貸付金の回収による収入
その他
投資活動によるキャッシュ・フロー
財務活動によるキャッシュ・フロー
短期借入金の純増減額(△は減少)
長期借入れによる収入
長期借入金の返済による支出
配当金の支払額
自己株式の取得による支出
自己株式の処分による収入
その他
財務活動によるキャッシュ・フロー
現金及び現金同等物に係る換算差額
現金及び現金同等物の増減額(△は減少)
現金及び現金同等物の期首残高
新規連結に伴う現金及び現金同等物の増加額
現金及び現金同等物の期末残高
当連結会計年度
(自 2025年4月1日
至 2026年3月31日)
4,628
5,913
140
146
50
△0
14
36
40
△329
184
110
△2,816
159
1,730
△333
△3,600
△113
2
842
6,804
329
△185
△204
6,744
5,814
5,795
-
126
△50
△11
△1
4
-
△407
174
49
△3,394
79
1,262
△388
△1,287
△105
△1
415
8,077
406
△172
△1,721
6,589
△4,117
12
△108
3,150
△104
0
264
△902
△4,928
249
△65
4,082
△0
0
△461
△1,121
13
-
△2,490
△792
△1,000
41
△408
△4,637
35
1,240
10,944
-
※ 12,184
7
238
△2,590
△1,728
△958
62
△390
△5,360
△24
83
12,184
99
※ 12,366
共同印刷(株) (7914) 2026年3月期決算短信
(5)連結財務諸表に関する注記事項
(継続企業の前提に関する注記)
該当事項はありません。
(連結財務諸表作成のための基本となる重要な事項)
1.連結の範囲に関する事項
(1) 連結子会社の数 16社
(2) 主要な子会社名
共同物流(株)、共同印刷西日本(株)、デジタルカタパルト(株)
2.持分法の適用に関する事項
(1) 持分法適用の非連結子会社及び関連会社の数
該当事項はありません。
(2) 持分法を適用していない関連会社の名称
(株)コスモスキャナー
持分法を適用しなかった理由
当期純損益(持分に見合う額)及び利益剰余金(持分に見合う額)等からみて、持分法の対象から除いても連結
財務諸表に及ぼす影響が軽微であり、かつ、全体としても重要性がないため持分法の適用範囲から除外しておりま
す。
3.連結子会社の事業年度等に関する事項
連結子会社のうちKodama Tales Inc.、共印商貿(上海)有限公司、KYODO PRINTING (VIETNAM) CO.LTD.、PT. Arisu
Graphic Prima及びPT. Arisu Indonesiaの決算日は12月31日であります。
連結財務諸表の作成にあたっては、同日現在の財務諸表を使用し、連結決算日との間に生じた重要な取引について
は、連結上必要な調整を行うこととしております。
4.会計方針に関する事項
(1) 重要な資産の評価基準及び評価方法
a 有価証券
その他有価証券
・市場価格のない株式等以外のもの
時価法(評価差額は全部純資産直入法により処理し、売却原価は移動平均法により算定)
・市場価格のない株式等
主として移動平均法による原価法
b 棚卸資産
製品、仕掛品については、主として個別法による原価法(貸借対照表価額は収益性の低下に基づく簿価切下げ
の方法により算定)によっております。
原材料及び貯蔵品については、主として先入先出法による原価法(貸借対照表価額は収益性の低下に基づく簿
価切下げの方法により算定)によっております。
(2) 重要な減価償却資産の減価償却の方法
a 有形固定資産(リース資産を除く)
定額法によっております。なお、主な耐用年数については、以下のとおりであります。
建物及び構築物
31~50年
機械装置及び運搬具
4~10年
b 無形固定資産(リース資産を除く)
定額法によっております。なお、ソフトウエア(自社利用分)については、社内における利用可能期間(5
年)に基づいております。
c リース資産
・所有権移転ファイナンス・リース取引に係るリース資産
自己所有の固定資産に適用する減価償却方法と同一の方法を採用しております。
・所有権移転外ファイナンス・リース取引に係るリース資産
リース期間を耐用年数とし、残存価額を零(残価保証の取決めがある場合には残価保証額)とする定額法
を採用しております。
共同印刷(株) (7914) 2026年3月期決算短信
(3) 重要な引当金の計上基準
a 貸倒引当金
債権の貸倒れによる損失に備えるため、一般債権については貸倒実績率、貸倒懸念債権及び破産更生債権等に
ついては個別に回収可能性を勘案し、回収不能見込額を計上しております。
b 賞与引当金
従業員等の賞与の支給に充てるため、支給見込額を期間に対応して計上しております。
c 役員賞与引当金
取締役の賞与の支給に充てるため、支給見込額を期間に対応して計上しております。
d 役員株式給付引当金
役員株式給付規程に基づく取締役等への当社株式の給付に備えるため、当連結会計年度末における株式給付債
務の見込額に基づき計上しております。
e 製品補償引当金
当社グループの製品において、製品の品質に関する補償費用の支出に備えるため、今後必要と見込まれる金額
を計上しております。
(4) 退職給付に係る会計処理の方法
a 退職給付見込額の期間帰属方法
退職給付債務の算定にあたり、退職給付見込額を当連結会計年度末までの期間に帰属させる方法については、
給付算定式基準によっております。
b 数理計算上の差異及び過去勤務費用の費用処理方法
過去勤務費用については、その発生時における従業員の平均残存勤務期間以内の一定の年数(8年)による定
額法により費用処理しております。数理計算上の差異については、各連結会計年度の発生時における従業員の平
均残存勤務期間以内の一定の年数(8年)による定額法により按分した額をそれぞれ発生の翌連結会計年度から
費用処理しております。
c 小規模企業等における簡便法の採用
一部の連結子会社は、退職給付に係る負債及び退職給付費用の計算に、退職給付に係る期末自己都合要支給額
及び直近の年金財政計算上の数理債務を退職給付債務とする方法を用いた簡便法を適用しております。
(5) 重要な収益及び費用の計上基準
情報コミュニケーション部門、情報セキュリティ部門、生活・産業資材部門の製造・販売を主な事業とし、こ
れらの販売は顧客との販売契約に基づいて商品又は製品を引き渡す履行義務を負っております。また、収益にお
いては、商品又は製品を引き渡す一時点において、顧客が当該商品又は製品に対する支配を獲得して当該履行義
務が充足されると判断し、引渡時点で収益を認識しております。ただし、出荷時から当該商品又は製品の支配が
顧客に移転される時までの期間が通常の期間である国内販売の場合には、当該商品又は製品の出荷時に収益を認
識しております。
(6) 重要なヘッジ会計の方法
a ヘッジ会計の方法
繰延ヘッジ処理を採用しております。なお、為替変動リスクのヘッジについて振当処理の要件を充たしている
場合には振当処理を採用しております。また、連結会社間取引をヘッジ対象としている為替予約取引について
は、時価評価を行い、評価差額を当連結会計年度の損益として処理しております。
b ヘッジ手段とヘッジ対象
ヘッジ手段・・・為替予約
ヘッジ対象・・・外貨建金銭債権債務
c ヘッジ方針
社内規程等に基づき、外貨建取引の為替相場の変動リスクを回避する目的で為替予約取引を行い、ヘッジ対象
の識別は個別契約毎に行っております。
d ヘッジ有効性評価の方法
当社が利用している為替予約については、社内規程等に従って、原則としてヘッジ対象と同一通貨建による同
一金額で同一期日の為替予約を振当てているため、その後の為替相場の変動による相関関係は完全に確保されて
いるので、決算日における有効性の評価を省略しております。
(7) のれんの償却方法及び償却期間
のれんの償却については、5年以内のその効果が及ぶと見積もられる期間で均等償却を行っております。
(8) 連結キャッシュ・フロー計算書における資金の範囲
手許現金、要求払預金及び取得日から3か月以内に満期日の到来する流動性の高い、容易に換金可能であり、か
つ、価値の変動について僅少なリスクしか負わない短期的な投資からなっております。
共同印刷(株) (7914) 2026年3月期決算短信
(重要な会計上の見積り)
会計上の見積りは、連結財務諸表作成時に入手可能な情報に基づいて合理的な金額を算出しております。
当連結会計年度の連結財務諸表に計上した金額が会計上の見積りによるもののうち、翌連結会計年度の連結財務諸
表に重要な影響を及ぼすリスクがある項目は以下のとおりです。
(固定資産の減損)
(1)当連結会計年度の連結財務諸表に計上した金額
前連結会計年度
当連結会計年度
有形固定資産
55,968百万円
53,518百万円
無形固定資産
1,530百万円
1,527百万円
146百万円
126百万円
減損損失
(2)識別した項目に係る重要な会計上の見積りの内容に関する情報
①算出方法
当社グループは、事業用資産については、主として継続的に収支の把握を行っている管理会計上の区分を基礎とし
て製造工程等の関連性を加味し、処分予定資産及び遊休資産については、個別の物件を単位として資産のグルーピン
グを行っております。減損の兆候が識別され、減損の認識が必要と判断される資産グループについては、帳簿価額を
回収可能価額まで減額し、当該減少額を減損損失として計上しております。
回収可能価額は、使用価値と正味売却価額又は処分コスト控除後の公正価値のいずれか高い金額で算定しておりま
す。使用価値は、将来キャッシュ・フローを当社の加重平均資本コストを基礎として見積もった割引率で割り引いた
現在価値で算定しております。正味売却価額又は処分コスト控除後の公正価値は、鑑定評価額もしくは一定の評価額
や適切に市場価格を反映していると考えられる指標を基礎として合理的に算定された金額から処分見込費用を控除し
て算定しております。
②主要な仮定
減損損失の認識の要否の判断や使用価値の算定に用いる将来キャッシュ・フローは、経営者に承認された将来の事
業計画を基礎として見積もっております。当該見積における主要な仮定は、売上状況の推移、コスト増加分の受注価
格への反映等であり、市場動向、直近の業績、過去の趨勢を参考とし、予測しております。
③翌連結会計年度の連結財務諸表に与える影響
主要な仮定が変化することにより、実績が事業計画と大幅に乖離した場合には翌連結会計年度の連結財務諸表に影
響を与える可能性があります。
共同印刷(株) (7914) 2026年3月期決算短信
(追加情報の注記)
(従業員等に信託を通じて自社の株式を交付する取引)
自社の株式数については、2025年4月1日付で普通株式1株につき4株の割合で株式分割を行っているため、前連
結会計年度の期首に当該株式分割が行われたと仮定して、当該自己株式数を算定しております。
(1)株式給付信託(BBT-RS)
当社は、2018年6月28日開催の第138期定時株主総会決議に基づき、当社の取締役及び執行役員並びに一部の当社
子会社における役付取締役 (以下「取締役等」という。)に対する新たな業績連動型株式報酬制度「株式給付信託
(BBT(=Board Benefit Trust))」を導入しております。
2025年6月25日開催の第145期定時株主総会決議に基づき、BBT制度の一部を改定し、取締役等に給付する株式
に退任までの間の譲渡制限を付す「株式給付信託(BBT-RS(=Board Benefit Trust-Restricted Stock))」(以下
「本制度」という。)に改定しました。
①取引の概要
本制度は、当社が拠出する金銭を原資として当社株式が信託を通じて取得され、取締役等に対して、当社及び一部
の当社子会社が定める役員株式給付規程に従って、業績達成度等に応じて当社株式及び当社株式を時価で換算した金
額相当の金銭が信託を通じて給付される業績連動型の株式報酬制度であります。なお、取締役等が当社株式の給付を
受ける時期は、原則として毎年一定の時期とし、取締役等が当社株式を時価で換算した金額相当の金銭の給付を受け
る時期は、取締役等の退任時とします。
②信託に残存する自社の株式
当社は、信託に残存する当社株式を、信託における帳簿価額(付随費用の金額を除く。)により、純資産の部に自
己株式として計上しております。当該自己株式の帳簿価額及び株式数は、前連結会計年度末157百万円、218千株、当
連結会計年度末138百万円、191千株であります。
③総額法の適用により計上された借入金の帳簿価額
該当事項はありません。
(2)株式給付信託(J-ESOP)
当社は、2022年2月18日開催の取締役会決議に基づき、2022年3月10日より、当社の株価や業績と従業員の処遇の
連動性をより高め、経済的な効果を株主の皆様と共有することにより、株価及び業績向上への従業員の意欲や士気を
高めるため、
「株式給付信託(J-ESOP)
」
(以下「本制度」という。
)を導入しております。
①取引の概要
本制度の導入に際し制定した「株式給付規程」に基づき、一定の要件を満たした当社の従業員に対し当社株式を給
付する仕組みです。
将来給付する株式を予め取得するために、当社は「株式給付信託(J-ESOP)
」の信託財産として株式会社日
本カストディ銀行(信託E口)に金銭を信託し、当該信託銀行はその信託された金銭により当社株式を取得しており
ます。
②信託に残存する自社の株式
信託に残存する当社株式を、信託における帳簿価額(付随費用の金額を除く。
)により、純資産の部に自己株式と
して計上しております。当該自己株式の帳簿価額及び株式数は、前連結会計年度末417百万円、600千株、当連結会計
年度末417百万円、600千株であります。
③総額法の適用により計上された借入金の帳簿価額
該当事項はありません。
(3)株式給付信託(従業員持株会処分型)
当社は、2022年2月18日開催の取締役会決議に基づき、2022年3月10日より、従業員の福利厚生の増進及び当社の
企業価値向上に係るインセンティブの付与を目的として、
「株式給付信託(従業員持株会処分型)
」
(以下「本制度」
という。
)を導入しております。
①取引の概要
本制度の導入にあたり、当社は、当社を委託者、みずほ信託銀行株式会社(以下「受託者」という。
)を受託者と
する「株式給付信託(従業員持株会処分型)契約書」
(以下「本信託契約」という。
)を締結しております。
(以下、
本信託契約に基づいて設定される信託を「本信託」という。
)
。また、受託者は株式会社日本カストディ銀行との間
で、株式会社日本カストディ銀行を再信託受託者として有価証券等の信託財産の管理を再信託する契約を締結してお
ります。
共同印刷(株) (7914) 2026年3月期決算短信
本信託は、今後5年間にわたり持株会が購入することが見込まれる数に相当する当社株式を予め一括して取得し、
以後、持株会の株式購入に際して当社株式を売却していきます。本信託による持株会への当社株式の売却を通じて、
信託終了時までに、本信託の信託財産内に株式売却益相当額が累積した場合には、かかる金銭を残余財産として、受
託者適格要件を充足する持株会加入者(従業員)に分配します。
また、当社は、本信託が当社株式を取得するために借入に際し保証をするため、当社株価の下落等により、信託終
了時において、株式売却損相当額の借入残債がある場合には、保証契約に基づき当社が当該残債を弁済することとな
ります。
②信託に残存する自社の株式
信託に残存する当社株式を、信託における帳簿価額(付随費用の金額を除く。
)により、純資産の部に自己株式と
して計上しております。当該自己株式の帳簿価額及び株式数は、前連結会計年度末138百万円、198千株、当連結会計
年度末94百万円、136千株であります。
③総額法の適用により計上された借入金の帳簿価額
前連結会計年度末
当連結会計年度末
長期借入金
長期借入金
123百万円
36百万円
(連結貸借対照表関係)
※1
有形固定資産の減価償却累計額は、次のとおりであります。
前連結会計年度
(2025年3月31日)
有形固定資産減価償却累計額
※2
81,772百万円
83,061百万円
非連結子会社及び関連会社に対するものは、次のとおりであります。
前連結会計年度
(2025年3月31日)
投資有価証券(株式)
※3
当連結会計年度
(2026年3月31日)
当連結会計年度
(2026年3月31日)
36百万円
8百万円
財務制限条項
前連結会計年度(2025年3月31日)
当連結会計年度末の借入金のうち、2018年4月20日締結のシンジケートローン方式によるタームローン契約(当
連結会計年度末借入金残高2,400百万円)には、財務制限条項が付されております。財務制限条項は以下のとおり
でありますが、これらに抵触した場合には当該借入金の一括返済を求められる可能性があります。
なお、当連結会計年度末現在、以下の財務制限条項には抵触しておりません。
(1) 2018年3月期決算以降、各年度の決算期の末日及び第2四半期の末日における連結の貸借対照表上の純資産の
部の金額を、2017年9月第2四半期の末日における連結の貸借対照表上の純資産の部の金額の70%及び直前の決算
期末日又は第2四半期の末日における連結の貸借対照表上の純資産の部の金額の70%のいずれか高い方の金額以上
に維持すること。
(2) 2018年3月期決算以降の決算期を初回の決算期とする連続する3期について、各年度の決算期における連結の
損益計算書に示される経常損益が3期連続して損失とならないようにすること。
当連結会計年度(2026年3月31日)
該当事項はありません。
4
担保に供している資産及び担保付債務
(1)担保に供している資産
該当事項はありません。
(2)担保付債務
該当事項はありません。
なお、当社の連結子会社であるTOMOWEL Payment Service株式会社は、資金決済に関する法律に基づく発行保証
金として、現金100百万円を供託しております。
また、当該発行保証金については、上記供託資産以外に金融機関との間で資金決済に関する法律に基づく発行保
証金保全契約(契約金額1,680百万円)を締結しております。
共同印刷(株) (7914) 2026年3月期決算短信
(連結損益計算書関係)
※1 一般管理費及び当期製造費用に含まれる研究開発費は次のとおりであります。
前連結会計年度
(自 2024年4月1日
至 2025年3月31日)
研究開発費
※2
1,052百万円
当連結会計年度
(自 2025年4月1日
至 2026年3月31日)
1,073百万円
固定資産売却益の内容は次のとおりであります。
前連結会計年度
(自 2024年4月1日
至 2025年3月31日)
当連結会計年度
(自 2025年4月1日
至 2026年3月31日)
機械装置及び運搬具
2百万円
10百万円
その他の設備
0
0
-
21
2
31
前連結会計年度
(自 2024年4月1日
至 2025年3月31日)
当連結会計年度
(自 2025年4月1日
至 2026年3月31日)
土地
計
※3
固定資産処分損の内容は次のとおりであります。
売却損
機械装置及び運搬具
その他の設備
15百万円
1
-百万円
-
17
-
前連結会計年度
(自 2024年4月1日
至 2025年3月31日)
当連結会計年度
(自 2025年4月1日
至 2026年3月31日)
計
除却損
建物及び構築物
機械装置及び運搬具
47百万円
73
36百万円
63
その他の設備
9
7
ソフトウエア
計
14
4
144
111
共同印刷(株) (7914) 2026年3月期決算短信
※4
減損損失
前連結会計年度(自
2024年4月1日
至
2025年3月31日)
当社グループは、以下の資産グループについて減損損失を計上しております。
セグメント区分
場所
用途
種類
金額
(百万円)
建物及び構築物
99
機械及び装置
0
工具器具及び備品
5
リース資産
17
ソフトウエア
2
無形固定資産
(その他)
19
プリプレス
北海道苫小牧市
情報コミュニケーシ
ョン部門
(DTP)、
デジタルプリント
サービス生産設備
東京都文京区
電子書籍
当社グループは、事業用資産については、主として継続的に収支の把握を行っている管理会計上の区分を基礎と
して製造工程等の関連性を加味し、処分予定資産及び遊休資産については、個別の物件を単位として資産のグルー
ピングを行っております。
上記資産においては当初想定していた収益が見込めないため、帳簿価額を回収可能価額まで減額し、当該減少額
を減損損失146百万円として特別損失に計上しております。なお、建物及び構築物について、売却を予定している
ため、回収可能価額は正味売却価額により測定しており、正味売却価額は不動産鑑定評価額を基に算出しておりま
す。また、無形固定資産(その他)について、回収可能価額は使用価値により測定しておりますが、将来キャッシ
ュ・フローがマイナスであるため零として評価しております。
共同印刷(株) (7914) 2026年3月期決算短信
当連結会計年度(自 2025年4月1日至 2026年3月31日)
当社グループは、以下の資産グループについて減損損失を計上しております。
金額
(百万円)
セグメント区分
場所
用途
種類
情報コミュニケーシ
ョン部門
東京都文京区
電子書籍
無形固定資産
(その他)
9
工具器具及び備品
0
ソフトウエア
88
ソフトウエア仮勘定
13
長期前払費用
14
情報セキュリティ
部門
東京都文京区
決済ソリューション
当社グループは、事業用資産については、主として継続的に収支の把握を行っている管理会計上の区分を基礎と
して製造工程等の関連性を加味し、処分予定資産及び遊休資産については、個別の物件を単位として資産のグルー
ピングを行っております。
情報コミュケーション部門においては、当初想定していた収益が見込めないため、帳簿価額を回収可能価額まで
減額し、当該減少額を減損損失9百万円として特別損失に計上しております。なお、当該資産の回収可能価額は、
使用価値により測定しており、将来キャッシュ・フローが見込めないことにより、零と評価しております。
情報セキュリティ部門においては、当該事業における収益性の低下により、将来の回収可能性を見直した結果、
当初想定していた収益が見込めないため、帳簿価額を回収可能価額まで減額し、当該減少額を減損損失116百万円
として特別損失に計上しております。なお、当該資産の回収可能価額は、使用価値により測定しており、将来キャ
ッシュ・フローが見込めないことにより、零と評価しております。
※5
訴訟関連損失
前連結会計年度(自 2024年4月1日至 2025年3月31日)
当社は、公正取引委員会より独占禁止法に基づく排除措置命令及び課徴金納付命令を受けたことに伴い、日本年金
機構から帳票作成業務等に関する損害賠償請求を受けました。そのうち、契約書の解釈に異議があり支払いを留保し
ていた遅延損害金については、2023年11月13日付(訴状送達日:2023年12月1日)で同機構から訴訟を提起されてお
りましたが、協議の結果、2024年7月17日に当社が同機構に対し解決金142百万円を支払う内容で和解が成立し、当
該金額を特別損失として計上しております。
※6
工場再編費用
前連結会計年度(自 2024年4月1日至 2025年3月31日)
当社の連結子会社である株式会社コスモグラフィックの苫小牧工場の閉鎖に伴い発生した、主に退職給付に係る費
用等であります。
当連結会計年度(自
2025年4月1日
至
2026年3月31日)
当社の連結子会社である株式会社コスモグラフィックの苫小牧工場の閉鎖に伴い発生した費用等であります。
共同印刷(株) (7914) 2026年3月期決算短信
(連結包括利益計算書関係)
※
その他の包括利益に係る組替調整額並びに法人税等及び税効果額
前連結会計年度
(自 2024年4月1日
至 2025年3月31日)
当連結会計年度
(自 2025年4月1日
至 2026年3月31日)
その他有価証券評価差額金
当期発生額
組替調整額
法人税等及び税効果調整前
109百万円
△2,816
法人税等及び税効果額
その他有価証券評価差額金
4,259百万円
△3,394
△2,707
865
681
△278
△2,025
587
195
△135
△25
142
783
61
116
△30
844
△266
為替換算調整勘定
当期発生額
退職給付に係る調整額
当期発生額
組替調整額
法人税等及び税効果調整前
法人税等及び税効果額
退職給付に係る調整額
その他の包括利益合計
85
577
△1,744
1,029
共同印刷(株) (7914) 2026年3月期決算短信
(連結株主資本等変動計算書関係)
前連結会計年度(自
2024年4月1日
至
2025年3月31日)
1.発行済株式の種類及び総数並びに自己株式の種類及び株式数に関する事項
当連結会計年度期
首株式数(株)
当連結会計年度
増加株式数(株)
当連結会計年度
減少株式数(株)
当連結会計年度末
株式数(株)
8,370,000
-
-
8,370,000
合計
8,370,000
-
-
8,370,000
普通株式(注)1.2.3.
1,087,831
257,782
14,825
1,330,788
合計
1,087,831
257,782
14,825
1,330,788
発行済株式
普通株式
自己株式
(注)1.普通株式の自己株式の株式数には、「株式給付信託(BBT、J-ESOP及び従業員持株会処分型)」が
所有する当社株式(当連結会計年度期首269,200株、当連結会計年度末254,375株)が含まれております。
2.普通株式の自己株式の株式数の増加257,782株は、単元未満株式の買取による増加282株、2024年11月8日開
催の取締役会決議に基づく自己株式の取得(東京証券取引所における市場買付け)による増加257,500株に
よるものであります。
3.普通株式の自己株式の株式数の減少14,825株は、執行役員2名及び子会社取締役1名に職務執行の対価とし
て交付したことによる減少600株、「株式給付信託(従業員持株会処分型)」が所有する当社株式の売却に
よる減少14,225株によるものであります。
4.当社は2025年4月1日付で普通株式1株につき4株の割合で株式分割を行っておりますが、上記の事項は、
当該株式分割前の株式数を基準としております。
2.新株予約権及び自己新株予約権に関する事項
該当事項はありません。
3.配当に関する事項
(1) 配当金支払額
(決議)
2024年6月27日
定時株主総会
2024年11月8日
取締役会
配当金の総額
(百万円)
1株当たり
配当額(円)
普通株式
377
普通株式
415
株式の種類
基準日
効力発生日
50
2024年3月31日
2024年6月28日
55
2024年9月30日
2024年12月9日
(注)1.2024年6月27日定時株主総会決議による配当金の総額には「株式給付信託(BBT、J-ESOP及び従業
員持株会処分型)」の信託財産として、株式会社日本カストディ銀行(信託E口)が所有する当社株式に対
する配当金13百万円が含まれております。
2.2024年11月8日取締役会決議による配当金の総額には「株式給付信託(BBT、J-ESOP及び従業員持
株会処分型)」の信託財産として、株式会社日本カストディ銀行(信託E口)が所有する当社株式に対する
配当金14百万円が含まれております。
共同印刷(株) (7914) 2026年3月期決算短信
(2) 基準日が当連結会計年度に属する配当のうち、配当の効力発生日が翌連結会計年度となるもの
(決議)
株式の種類
2025年6月25日
定時株主総会
普通株式
配当金の総額
(百万円)
配当の原資
619
利益剰余金
1株当たり
配当額(円)
85
基準日
効力発生日
2025年3月31日
2025年6月26日
(注)1.配当金の総額には「株式給付信託(BBT、J-ESOP及び従業員持株会処分型)」の信託財産として、
株式会社日本カストディ銀行(信託E口)が所有する当社株式に対する配当金21百万円が含まれておりま
す。
2.当社は2025年4月1日付で普通株式1株につき4株の割合で株式分割を行っておりますが、2025年3月31日
を基準日とする配当につきましては、株式分割前の株式数を基準とした金額を記載しております。
当連結会計年度(自
2025年4月1日
至
2026年3月31日)
1.発行済株式の種類及び総数並びに自己株式の種類及び株式数に関する事項
当連結会計年度期
首株式数(株)
当連結会計年度
増加株式数(株)
当連結会計年度
減少株式数(株)
当連結会計年度末
株式数(株)
33,480,000
-
3,480,000
30,000,000
合計
33,480,000
-
3,480,000
30,000,000
普通株式(注)1.2.3.
5,323,152
600,056
3,569,490
2,353,718
合計
5,323,152
600,056
3,569,490
2,353,718
発行済株式
普通株式
自己株式
(注)1.普通株式の自己株式の株式数には、「株式給付信託(BBT-RS、J-ESOP及び従業員持株会処分
型)」が所有する当社株式(当連結会計年度期首1,017,500株、当連結会計年度末928,010株)が含まれてお
ります。
2.普通株式の自己株式の株式数の増加600,056株は、単元未満株式の買取による増加56株、2025年11月26日開
催の取締役会決議に基づく自己株式の取得(東京証券取引所における市場買付け)による増加600,000株に
よるものであります。
3.普通株式の自己株式の株式数の減少3,569,490株は、取締役4名、執行役員12名及び子会社取締役2名に職
務執行の対価として交付したことによる減少27,390株、「株式給付信託(従業員持株会処分型)」が所有す
る当社株式の売却による減少62,100株及び自己株式の消却による減少3,480,000株によるものであります。
4.当社は2025年4月1日付で普通株式1株につき4株の割合で株式分割を行っております。
2.新株予約権及び自己新株予約権に関する事項
該当事項はありません。
共同印刷(株) (7914) 2026年3月期決算短信
3.配当に関する事項
(1) 配当金支払額
(決議)
配当金の総額
(百万円)
1株当たり
配当額(円)
普通株式
619
普通株式
1,108
株式の種類
2025年6月25日
定時株主総会
2025年11月10日
取締役会
基準日
効力発生日
85
2025年3月31日
2025年6月26日
38
2025年9月30日
2025年12月9日
(注)1.2025年6月25日定時株主総会決議による配当金の総額には「株式給付信託(BBT、J-ESOP及び従業
員持株会処分型)」の信託財産として、株式会社日本カストディ銀行(信託E口)が所有する当社株式に対
する配当金21百万円が含まれております。
2.当社は2025年4月1日付で普通株式1株につき4株の割合で株式分割を行っておりますが、2025年3月31日
を基準日とする配当につきましては、株式分割前の株式数を基準とした金額を記載しております。
3.2025年11月10日取締役会決議による配当金の総額には「株式給付信託(BBT-RS、J-ESOP及び従
業員持株会処分型)」の信託財産として、株式会社日本カストディ銀行(信託E口)が所有する当社株式に
対する配当金36百万円が含まれております。
(2) 基準日が当連結会計年度に属する配当のうち、配当の効力発生日が翌連結会計年度となるもの
2026年6月25日開催の定時株主総会の議案として、次のとおり付議する予定です。
(決議)
2026年6月25日
定時株主総会
株式の種類
普通株式
配当金の総額
(百万円)
配当の原資
1,142
利益剰余金
1株当たり
配当額(円)
40
基準日
効力発生日
2026年3月31日
2026年6月26日
(注)配当金の総額には「株式給付信託(BBT-RS、J-ESOP及び従業員持株会処分型)」の信託財産とし
て、株式会社日本カストディ銀行(信託E口)が所有する当社株式に対する配当金37百万円が含まれておりま
す。
(連結キャッシュ・フロー計算書関係)
1※ 現金及び現金同等物の期末残高と連結貸借対照表に掲記されている科目の金額との関係は次のとおりであります。
前連結会計年度
(自 2024年4月1日
至 2025年3月31日)
現金及び預金勘定
12,254百万円
預入期間が3か月を超える定期預金
現金及び現金同等物
2
当連結会計年度
(自 2025年4月1日
至 2026年3月31日)
12,438百万円
△69
△71
12,184
12,366
重要な非資金取引の内容
新たに計上したファイナンス・リース取引に係る資産及び債務の額は次のとおりであります。
前連結会計年度
(自 2024年4月1日
至 2025年3月31日)
リース資産
リース債務
345百万円
374
当連結会計年度
(自 2025年4月1日
至 2026年3月31日)
524百万円
581
共同印刷(株) (7914) 2026年3月期決算短信
(セグメント情報等の注記)
1.報告セグメントの概要
当社グループは、製品・サービス別の事業本部又は事業部を置き、各事業(本)部において取り扱う製品・サービス
について包括的な戦略を立案し、事業活動を展開しております。これら事業(本)部は、独立した財務情報が入手可能
であり、取締役会が経営資源の配分の決定及び業績を評価するために定期的に検討を行う対象となっているものであ
ります。
報告セグメントとしては、類似した製品・サービスを取り扱う事業(本)部を集約し、「情報コミュニケーション部
門」、「情報セキュリティ部門」、「生活・産業資材部門」の3つとしております。
「情報コミュニケーション部門」は、定期刊行物、書籍、一般商業印刷及び関連するサービス等を取り扱っており
ます。「情報セキュリティ部門」は、ビジネスフォーム、証券印刷、カード及び関連するサービス等を取り扱ってお
ります。「生活・産業資材部門」は、紙器、軟包装、チューブ、ブローボトル、金属印刷、建材等を取り扱っており
ます。
2.報告セグメントごとの売上高、利益又は損失、資産、負債その他の項目の金額の算定方法
報告されている事業セグメントの会計処理の方法は、棚卸資産の評価基準を除き、「連結財務諸表作成のための基
本となる重要な事項」における記載と概ね同一であります。
棚卸資産の評価については、収益性の低下に基づく簿価切下げ前の価額で評価しております。
報告セグメントの利益は、営業利益ベースの数値であります。
セグメント間の内部収益及び振替高は市場価格、製造原価等を考慮した仕切価格に基づいております。
共同印刷(株) (7914) 2026年3月期決算短信
3.報告セグメントごとの売上高、利益又は損失、資産、負債その他の項目の金額に関する情報及び収益の分解情報
前連結会計年度(自
2024年4月1日
至
2025年3月31日)
(単位:百万円)
報告セグメント
その他
(注)1
合計
調整額
(注)2
連結財務
諸表計上
額
(注)3
情報コミュ
ニケーショ
ン部門
情報セキュ
リティ部門
生活・産業
資材部門
顧客との契約
から生じる収
益
34,658
30,755
32,331
97,745
1,734
99,479
-
99,479
その他の収益
-
-
-
-
497
497
-
497
外部顧客への
売上高
34,658
30,755
32,331
97,745
2,231
99,977
-
99,977
セグメント間
の内部売上高
又は振替高
941
636
376
1,954
5,199
7,153
△7,153
-
計
35,600
31,391
32,707
99,700
7,431
107,131
△7,153
99,977
セグメント利益
又は損失(△)
△176
1,954
1,211
2,988
161
3,150
△819
2,331
セグメント資産
22,050
25,045
34,697
81,793
8,820
90,614
35,554
126,168
減価償却費
898
1,497
2,296
4,692
266
4,959
954
5,913
のれん償却額
-
-
140
140
-
140
-
140
有形固定資産
及び無形固定
資産の増加額
567
1,694
1,554
3,817
169
3,986
237
4,223
計
売上高
その他の項目
(注)4
(注)1.「その他」の区分は、報告セグメントに含まれない事業であり、物流事業、保険取扱事業及び不動産管
理事業等であります。
2.セグメント利益又は損失の調整額は全社費用であり、主に報告セグメントに帰属しない一般管理費及び
研究開発費であります。セグメント資産の調整額は全社資産であり、主に当社の金融資産(現金及び預
金、投資有価証券等)及び管理部門に係る資産であります。減価償却費並びに有形固定資産及び無形固
定資産の増加額の調整額は全社資産に係るものであります。
3.セグメント利益又は損失は、連結損益計算書の営業利益と調整を行っております。
4.有形固定資産及び無形固定資産の増加額には長期前払費用が、減価償却費には長期前払費用の償却額が
含まれております。
共同印刷(株) (7914) 2026年3月期決算短信
当連結会計年度(自
2025年4月1日
至
2026年3月31日)
(単位:百万円)
報告セグメント
調整額
(注)2
連結財務
諸表計上
額
(注)3
97,707
-
97,707
497
497
-
497
95,993
2,211
98,205
-
98,205
314
1,919
5,468
7,387
△7,387
-
その他
(注)1
情報コミュ
ニケーショ
ン部門
情報セキュ
リティ部門
生活・産業
資材部門
顧客との契約
から生じる収
益
32,344
30,478
33,170
95,993
1,713
その他の収益
-
-
-
-
外部顧客への
売上高
32,344
30,478
33,170
セグメント間
の内部売上高
又は振替高
1,005
598
計
合計
売上高
計
33,349
31,077
33,485
97,912
7,680
105,592
△7,387
98,205
セグメント利益
又は損失(△)
△222
1,128
1,521
2,427
270
2,698
△563
2,134
セグメント資産
20,980
24,950
34,913
80,844
8,530
89,374
34,427
123,801
減価償却費
897
1,549
2,190
4,637
240
4,878
917
5,795
有形固定資産
及び無形固定
資産の増加額
422
1,495
1,570
3,488
206
3,694
222
3,916
その他の項目
(注)4
(注)1.「その他」の区分は、報告セグメントに含まれない事業であり、物流事業、保険取扱事業及び不動産管
理事業等であります。
2.セグメント利益又は損失の調整額は全社費用であり、主に報告セグメントに帰属しない一般管理費及び
研究開発費であります。セグメント資産の調整額は全社資産であり、主に当社の金融資産(現金及び預
金、投資有価証券等)及び管理部門に係る資産であります。減価償却費並びに有形固定資産及び無形固
定資産の増加額の調整額は全社資産に係るものであります。
3.セグメント利益又は損失は、連結損益計算書の営業利益と調整を行っております。
4.有形固定資産及び無形固定資産の増加額には長期前払費用が、減価償却費には長期前払費用の償却額が
含まれております。
【関連情報】
前連結会計年度(自 2024年4月1日
1.製品及びサービスごとの情報
至
2025年3月31日)
当社の報告セグメントは製品・サービス別に構成されており、セグメント情報に同様の情報を開示し
ているため、記載を省略しております。
2.地域ごとの情報
(1) 売上高
本邦の外部顧客への売上高が連結損益計算書の売上高の90%を超えるため、記載を省略しておりま
す。
(2) 有形固定資産
本邦に所在している有形固定資産の金額が、連結貸借対照表の有形固定資産の金額の90%を超える
ため、記載を省略しております。
3.主要な顧客ごとの情報
外部顧客への売上高のうち、特定の顧客への売上高であって、連結損益計算書の売上高の10%以上を
占めるものがないため、記載を省略しております。
共同印刷(株) (7914) 2026年3月期決算短信
当連結会計年度(自
2025年4月1日
至
2026年3月31日)
1.製品及びサービスごとの情報
当社の報告セグメントは製品・サービス別に構成されており、セグメント情報に同様の情報を開示し
ているため、記載を省略しております。
2.地域ごとの情報
(1) 売上高
本邦の外部顧客への売上高が連結損益計算書の売上高の90%を超えるため、記載を省略しておりま
す。
(2) 有形固定資産
本邦に所在している有形固定資産の金額が、連結貸借対照表の有形固定資産の金額の90%を超える
ため、記載を省略しております。
3.主要な顧客ごとの情報
外部顧客への売上高のうち、特定の顧客への売上高であって、連結損益計算書の売上高の10%以上を
占めるものがないため、記載を省略しております。
【報告セグメントごとの固定資産の減損損失に関する情報】
前連結会計年度(自 2024年4月1日至 2025年3月31日)
(単位:百万円)
情報コミュニケ 情報セキュリテ 生活・産業資材
ーション部門
ィ部門
部門
減損損失
146
当連結会計年度(自
-
その他
-
2025年4月1日
至
調整額
-
合計
-
146
2026年3月31日)
(単位:百万円)
情報コミュニケ 情報セキュリテ 生活・産業資材
ーション部門
ィ部門
部門
減損損失
9
116
その他
-
調整額
-
合計
-
126
【報告セグメントごとののれんの償却額及び未償却残高に関する情報】
前連結会計年度(自
2024年4月1日
至
2025年3月31日)
(単位:百万円)
情報コミュニケ 情報セキュリテ 生活・産業資材
ーション部門
ィ部門
部門
その他
調整額
合計
当期償却額
-
-
140
-
-
140
当期末残高
-
-
-
-
-
-
当連結会計年度(自 2025年4月1日
該当事項はありません。
至
2026年3月31日)
【報告セグメントごとの負ののれん発生益に関する情報】
該当事項はありません。
共同印刷(株) (7914) 2026年3月期決算短信
(1株当たり情報の注記)
前連結会計年度
(自 2024年4月1日
至 2025年3月31日)
当連結会計年度
(自 2025年4月1日
至 2026年3月31日)
1株当たり純資産額
2,233.66円
2,359.63円
1株当たり当期純利益
115.00円
141.15円
(注)1.当社は2025年4月1日付で普通株式1株につき4株の割合で株式分割を行っております。前連結会計年度の
期首に当該株式分割が行われたと仮定して1株当たり純資産額及び1株当たり当期純利益を算定しておりま
す。
2.「株式給付信託(BBT-RS)」の信託財産として、株式会社日本カストディ銀行(信託E口)が所有す
る当社株式を、1株当たり純資産額の算定上、期末発行済株式総数から控除する自己株式に含めております
(前連結会計年度218,800株、当連結会計年度191,410株)。
また、1株当たり当期純利益の算定上、期中平均株式数の計算において控除する自己株式に含めております
(前連結会計年度219,538株、当連結会計年度203,575株)。
3.「株式給付信託(J-ESOP)」の信託財産として、株式会社日本カストディ銀行(信託E口)が所有す
る当社株式を、1株当たり純資産額の算定上、期末発行済株式総数から控除する自己株式に含めております
(前連結会計年度600,000株、当連結会計年度600,000株)。
また、1株当たり当期純利益の算定上、期中平均株式数の計算において控除する自己株式に含めております
(前連結会計年度600,000株、当連結会計年度600,000株)。
4.「株式給付信託(従業員持株会処分型)」の信託財産として、株式会社日本カストディ銀行(信託E口)が
所有する当社株式を、1株当たり純資産額の算定上、期末発行済株式総数から控除する自己株式に含めてお
ります(前連結会計年度198,700株、当連結会計年度136,600株)。
また、1株当たり当期純利益の算定上、期中平均株式数の計算において控除する自己株式に含めております
(前連結会計年度226,669株、当連結会計年度167,485株)。
5.潜在株式調整後1株当たり当期純利益については、潜在株式が存在しないため記載しておりません。
6.1株当たり当期純利益の算定上の基礎は、以下のとおりであります。
前連結会計年度
(自 2024年4月1日
至 2025年3月31日)
当連結会計年度
(自 2025年4月1日
至 2026年3月31日)
1株当たり当期純利益
親会社株主に帰属する当期純利益
3,310
3,960
-
-
普通株式に係る親会社株主に帰属する当期
純利益(百万円)
3,310
3,960
期中平均株式数(千株)
28,790
28,058
(百万円)
普通株主に帰属しない金額(百万円)
(重要な後発事象の注記)
該当事項はありません。
共同印刷(株) (7914) 2026年3月期決算短信
5.その他
(役員の異動)
2026年2月25日付公表の「代表取締役及び役員の異動に関するお知らせ」及び2026年5月15日公表の「監査役の異
動に関するお知らせ」をご参照ください。











 共同印刷公式Youtubeチャンネル