2027年3月期 第1四半期決算説明資料 証券コード:7868 2026/8/7 0 目次 1 2027年3月期第1四半期決算説明 P. 2 ・2027年3月期第1四半期業績(連結) ・2027年3月期第1四半期業績(セグメント別) ・各事業セグメントの状況 ・2027年3月期のIR活動について 2…
2027年3月期
第1四半期決算説明資料
証券コード:7868
2026/8/7
0
目次
1
2027年3月期第1四半期決算説明
P. 2
・2027年3月期第1四半期業績(連結)
・2027年3月期第1四半期業績(セグメント別)
・各事業セグメントの状況
・2027年3月期のIR活動について
2
2027年3月期重点施策進捗およびトピックス
P. 11
・成長投資|東京博善の式場増築
・トピック|従業員向けRS制度導入
3
2027年3月期業績予想・配当予想
P. 14
・2027年3月期業績予想
・2027年3月期配当予想
A
ご参考資料
P. 18
Copyright KOSAIDO Holdings Co., Ltd. All Rights Reserved.
1
1
2027年3月期第1四半期
決算説明
2
1-01
2027年3月期第1四半期業績(連結)
前年対比で減収減益も、事業譲渡や大型PJ剥落の影響
•
減収減益の主因は、求人媒体事業の譲渡および資産コンサルにおける前期
大型PJの反動減。
(単位:百万円)
2027年3月期 2026年3月期
第1四半期
第1四半期
前年同期比
増減
増減率(%)
売上高
7,549
8,148
△ 599
△ 7.3
営業利益
1,132
1,455
△ 323
△ 22.2
経常利益
1,144
1,365
△ 221
△ 16.2
968
1,105
△ 137
△ 12.4
親会社株主に帰属する
四半期純利益
Copyright KOSAIDO Holdings Co., Ltd. All Rights Reserved.
3
1-02
2027年3月期第1四半期事業セグメント別業績サマリ
(単位:百万円)
売上高
2027年3月期
第1四半期
前年同期比
2026年3月期
第1四半期
営業利益
増減率
2027年3月期
第1四半期
増減
(%)
前年同期比
2026年3月期
第1四半期
増減率
増減
(%)
葬祭公益
1,236
1,285
△ 49
△ 3.9
187
186
1
0.2
葬祭収益
2,445
2,439
6
0.2
749
781
△ 32
△ 4.2
情報
2,631
2,699
△ 68
△ 2.5
△ 76
△ 116
40
ー
人材
1,212
1,530
△ 318
△ 20.8
1
22
△ 21
△ 91.3
24
192
△ 168
△ 87.3
6
94
△ 88
△ 92.6
0
ー
264
486
△ 222
△ 45.7
△ 599
△ 7.3
1,132
1,455
△ 323
△ 22.2
資産
コンサルティング
調整額等
合計
7,549
8,148
・
… 前年同期比増減
• 人材セグメントは、2025年7月1日付で譲渡した求人媒体事業の収益の剥落により減収減益となった。
• 資産コンサルティングセグメントは、前年第1四半期まで継続した大型PJ案件の反動減により減収減益となった。
Copyright KOSAIDO Holdings Co., Ltd. All Rights Reserved.
4
1-03
2027年3月期第1四半期|葬祭公益セグメントの状況
(単位:百万円)
売上高
2027年3月期 2026年3月期
第1四半期
第1四半期
1,236
葬祭公益
前年同期比
増減率
増減
(%)
1,285
△ 49
営業利益
2027年3月期 2026年3月期
第1四半期
第1四半期
187
△ 3.9
前年同期比
増減率
増減
(%)
186
1
0.2
[事業概況]
• 東京都内の死亡者数の減少に伴い火葬件数が減少(前年同期比93.9%)したことで減収となった
ものの、費用抑制等により、営業利益は前年同期並み。
(人)
(件)
東京都死亡者数|月次推移
東京博善火葬件数|月次推移
8,000
18,000
7,000
16,000
6,000
14,325
4,820
5,000
14,000
12,124
12,000
5,297
11,431
10,925
10,725 10,678 10,919
11,810
11,406
12,167
4,000
5,897
4,730
4,883
7月
8月
4,349
4,631
4,922
5,103
10月
11月
5,601
5,276
3,000
10,504
10,273
4,662
10,743
9,953
10,000 10,942
4,835
6,332
4,622
2,000
8,000
1,000
6,000
0
4月
5月
6月
7月
8月
2026年3月期
9月
10月
11月
12月
1月
2月
3月
2027年3月期
第1四半期|31,719人(前年差△590人前年比 98.2%)
4月
5月
6月
9月
2026年3月期
12月
1月
2月
3月
2027年3月期
第1四半期|13,846件(前年差△893件前年比 93.9%)
Copyright KOSAIDO Holdings Co., Ltd. All Rights Reserved.
5
1-04
2027年3月期第1四半期|葬祭収益セグメントの状況
(単位:百万円)
売上高
2027年3月期 2026年3月期
第1四半期
第1四半期
2,445
葬祭収益
前年同期比
増減率
増減
(%)
2,439
6
営業利益
2027年3月期 2026年3月期
第1四半期
第1四半期
749
0.2
前年同期比
増減率
増減
(%)
781
△ 32
△ 4.2
[事業概況]
• 子会社の葬儀社|葬儀施行件数伸長(前年比114.4%)に加え、前年M&Aの横濱聖苑が寄与し増収。
• 葬儀の簡素化傾向に伴う東京博善の式場利用件数の減少(前年比90.9%)や、来場者数減少による
付帯収益の落ち込みを、上記の増収要因で補い切れず減益。
(件)
(件)
1,800
東京博善式場利用件数|月次推移
400
1,600
1,499
350
1,390
1,400
1,256
1,319
1,160
1,200
1,000
1,144
1,142
1,203
1,198
1,256
1,306
1,258
1,237
1,166
300
葬儀社葬儀施行件数|月次推移
264
266
321
255
287
250
1,026
200
230
237
219
800
211
313
309
275
219
196
199
150
600
100
400
50
200
0
0
4月
5月
6月
7月
8月
9月
2026年3月期
10月
11月
12月
1月
2月
2027年3月期
第1四半期|3,312件(前年差△333件前年比 90.9%)
3月
4月
5月
6月
7月
8月
9月
2026年3月期
10月
11月
12月
1月
2月
3月
2027年3月期
第1四半期|785件(前年差+99件前年比 114.4%)
Copyright KOSAIDO Holdings Co., Ltd. All Rights Reserved.
6
1-05
2027年3月期第1四半期|情報セグメントの状況
(単位:百万円)
売上高
2027年3月期 2026年3月期
第1四半期
第1四半期
2,631
情報
2,699
前年同期比
増減率
増減
(%)
△ 68
△ 2.5
営業利益
2027年3月期 2026年3月期
第1四半期
第1四半期
△ 76
前年同期比
増減率
増減
(%)
△ 116
40
ー
減収増益要因
✓ 前期末(2026年3月末)での新聞印刷事業からの撤退等により減収。
✓ その他印刷関連の低採算案件見直しが利益面でも寄与。加えて印刷事業やBPO事業の
原価低減が奏功し、収益性が向上(赤字縮小)。
[事業概況]
• 印刷:商業印刷はIPコンテンツ系の高付加価値案件へのシフトを推進。
• BPO:自治体向けの給付金・物価高騰対策支援などのスポット案件を安定的に受託
[新規取組]
IPコンテンツグッズ
• 生産体制:アクリル製造ラインの内製化体制を強化し、製造原価を抑制。
• 販路開拓:オンライン販売やポップアップストア出店など、新たな直販チャネルの開拓を推進。
Copyright KOSAIDO Holdings Co., Ltd. All Rights Reserved.
7
1-06
2027年3月期第1四半期|人材セグメントの状況
(単位:百万円)
売上高
2027年3月期 2026年3月期
第1四半期
第1四半期
1,212
人材
1,530
前年同期比
増減率
増減
(%)
△ 318
△ 20.8
営業利益
2027年3月期 2026年3月期
第1四半期
第1四半期
1
22
前年同期比
増減率
増減
(%)
△ 21
△ 91.3
減収減益要因
✓ 減収:2025年7月1日付で譲渡した「求人媒体事業」の売上消失による影響が主因
✓ 減益:同事業の譲渡に伴う利益剥落に加え、各事業での成長投資(人員強化・体制構
築等)による影響
[事業概況]
• 人材派遣:長期案件のマッチングフロー改善や適正単価案件へのシフトによる収益性向上に注力。
• グローバル人材:海外在住人材の受入れ企業開拓を強化。海外法人は教育コンテンツの展開等に
より収益の改善が進む。
• ITソリューション(SES)等:新規案件獲得に向けた営業人員の増強とエンジニア採用を推進。
Copyright KOSAIDO Holdings Co., Ltd. All Rights Reserved.
8
1-07
2027年3月期第1四半期|資産コンサルティングの状況
(単位:百万円)
売上高
2027年3月期
第1四半期
2026年3月期
第1四半期
24
192
資産
コンサルティング
前年同期比
増減率
増減
(%)
△ 168
△ 87.3
営業利益
2027年3月期
第1四半期
2026年3月期
第1四半期
6
94
前年同期比
増減率
増減
(%)
△ 88
△ 92.6
減収減益要因
✓ 前年同期に計上した不動産関連大型プロジェクトの収益が剥落し減収減益
[事業概況]
• 貸金業:案件の積み上げが順調に進捗しており、安定的な収益貢献が見込める事業として推進
Copyright KOSAIDO Holdings Co., Ltd. All Rights Reserved.
9
1-08
2027年3月期のIR活動について
四半期毎の決算説明資料の開示は継続しつつ、説明会は、短期的な変動
に偏ることなく、通期および中長期視点を重視した内容といたします。
決算説明会開催頻度における変更(年4回 ⇒ 年2回に)
Q1
2026年3月期
前期
2027年3月期
PDF
決算説明資料
Q2(中間)
PDF
決算説明資料
Q3
PDF
決算説明資料
通期
PDF
決算説明資料
説明会開催
(ハイブリッド)
説明会開催
(ハイブリッド)
説明会開催
(ハイブリッド)
説明会開催
(ハイブリッド)
Q1
Q2(中間)
Q3
通期
PDF
決算説明資料
今期
説明会なし
PDF
決算説明資料
説明会開催
(LIVE配信)
PDF
決算説明資料
説明会なし
PDF
決算説明資料
説明会開催
(LIVE配信)
※説明会については、従来通り当社IRサイトにてオンデマンド配信いたします。
Copyright KOSAIDO Holdings Co., Ltd. All Rights Reserved.
10
2
2027年3月期
重点施策進捗
およびトピックス
11
2-01
成長投資|東京博善の式場増築
(2023年9月対比)
式場増築の進捗状況(実績)
キャパシティ拡張率
成長投資の継続
+10室増築
成長投資(式場数倍増)
✓四ツ木斎場
+5室増築
+33室増築
式場総数
(23区6斎場)
年月
全 37 室
2022年12月
計
+ 21.4 %
70 室
(稼働開始)
✓
計
75 室
2023年9月
桐ヶ谷斎場
(稼働中)
計
2025年12月
85 室
2026年7月
(※ 図中の式場数は、最大運用可能数を表しており、2026年8月現在においては80室で運用しております。)
四ツ木斎場(東京都葛飾区)における式場増築
概要・運用戦略
• 四ツ木斎場にて10室増築完了(2026年7月13日運用開始/式場:計5室 が 計15室へ)
• 式場・控室セパレート型を設け「8室運用」で開始(需要に応じて、最大10室へ柔軟に変更可能)
ニーズに対応した2タイプの新設式場
「旅(たび)」一体型式場
• 旅(たび):式場・控室一体型(少人数~20名故人に寄り添う空間)
• 蓮(はす):式場・控室セパレート型(20~40名家族葬~中規模まで対応)
導入効果
• 葬儀件数増加および火葬待ち問題の緩和に貢献(供給能力の拡大)
• 葬儀場・火葬場一体斎場としての利便性向上と稼働率の最適化
「蓮(はす)」式場
「蓮(はす)」控室
Copyright KOSAIDO Holdings Co., Ltd. All Rights Reserved.
12
2-02
トピック|従業員向けRS制度を導入[2026年7月31日公表]
株主との価値共有を促進し、中長期的な企業価値向上への意識を醸成
実施の背景・目的
・オーナーシップ意識向上
グループ従業員が「経営参画意識」をもって業務に取り組む風土の醸成
・株主との価値共有
株価上昇メリットを株主の皆様と共有、持続的な企業価値向上に貢献
・中長期的なリテンション
3ヵ年の譲渡制限期間を設定。人材の定着と中長期的貢献意欲を維持
概要
対象者
当社グループ従業員899名 + 中途入社予定者
付与方法
自己株式の処分による割当
譲渡制限期間
3年間(2026年10月1日~2029年9月30日)
付与時期
2026年10月1日(予定)
管理方法
専用口座にて管理(期間中の譲渡等を禁止)
Copyright KOSAIDO Holdings Co., Ltd. All Rights Reserved.
13
3
2027年3月期
業績予想配当予想
14
3-01
前回公表(2026年5月15日)
から変更なし
2027年3月期業績予想
2027年3月期通期予想
売上・営業利益ともに成長路線への回帰を目指す
(各事業セグメントの戦略推進により上振れを追求)
(単位:百万円)
前期比
通期予想
前期実績
増減
増減率(%)
売上高
39,400
36,228
3,172
8.8
営業利益
7,100
6,740
360
5.3
経常利益
6,900
6,571
329
5.0
親会社株主に帰属する
当期純利益
4,620
4,738
△ 118
※
△ 2.5
※ 当期純利益の減益|前期の税負担軽減および特別利益計上等の反動によるものであり、営業利益ベースでは着実な成長を計画。
Copyright KOSAIDO Holdings Co., Ltd. All Rights Reserved.
15
3-02
前回公表(2026年5月15日)
から変更なし
2027年3月期業績予想:セグメント別
2027年3月期通期予想
各セグメント(葬祭公益セグメントを除く)で、増益を計画
(単位:百万円)
業績予想
売上高
葬祭公益セグメント
葬祭収益セグメント
情報セグメント
人材セグメント
資産コンサルティングセグメント
営業利益
葬祭公益セグメント
葬祭収益セグメント
情報セグメント
人材セグメント
資産コンサルティングセグメント
調整額
39,400
5,846
13,270
15,096
5,097
91
7,100
1,071
4,556
678
54
37
703
前期実績
36,228
5,428
10,490
14,972
5,048
288
6,740
1,191
3,628
655
△ 71
△ 56
1,393
前期比
増減
増減率(%)
3,172
8.8
418
7.7
2,780
26.5
124
0.8
49
1.0
△ 197
△ 68.4
360
5.3
△ 120
△ 10.1
928
25.6
23
3.5
125
93
△ 690
△ 49.5
Copyright KOSAIDO Holdings Co., Ltd. All Rights Reserved.
16
3-03
前回公表(2026年5月15日)
から変更なし
2027年3月期配当予想
2027年3月期
✓ 発行済株式数の変動によらず、安定的な配当を優先
✓ 1株当たり配当金の維持・向上を目指します
1株当たり配当金
基準日
第2四半期末
期末
合計
2026年3月期実績
6円67銭
6円67銭
13円34銭
2027年3月期予想
6円67銭
6円67銭
13円34銭
Copyright KOSAIDO Holdings Co., Ltd. All Rights Reserved.
17
A
Appendix
1.2027年3月期業績詳細
2.ESG 報告
3.会社紹介
18
A1-01 四半期売上高推移
•
第1四半期売上高は、前年同期比で減収(△599百万円、前年比92.7%)
•
人材の事業譲渡や資産コンサルの前期反動減などが響き、全体で減収。
12,000
(単位:百万円)
10,857
10,000
8,757
8,000
832
8,756
324
9,931
320
320
1,316
1,373
10,386
9,383
8,311
192
26
7,549
1,170
24
5,012
4,103
3,016
1,221
1,530
4,370
6,000
1,127
51
8,148
1,309
1,284
19
1,212
3,899
3,304
2,699
3,362
2,631
4,000
2,985
2,643
2,345
2,469
1,277
1,352
1,491
1Q
2Q
3Q
2,775
2,763
2,439
2,513
1,285
1,241
1,437
1,465
1,236
1Q
2Q
3Q
4Q
1Q
2,445
2,000
1,866
0
4Q
2025年3月期
葬祭公益
2026年3月期
葬祭収益
情報
人材
2027年3月期
資産コンサル
Copyright KOSAIDO Holdings Co., Ltd. All Rights Reserved.
19
A1-02 四半期原価推移
•
第1四半期売上原価は前年同期比(△221百万円、売上高原価率+1.9pt)
•
主に情報BPO事業の案件積み上げに伴う棚卸高の増加(経費減)による
(単位:百万円 / %:売上高原価率)
7,000
6,000
5,000
4,871
(55.6%)
722
4,000
373
646
8.2%
4.3%
5,265
(60.1%)
656
5,813
(58.5%)
865
7.5%
8.7%
1,252 11.5%
779
367
3.4%
540
6.6%
348 4.2%
822
8.3%
784
7.2%
351
4.3%
757
674
8.3%
7.4%
3,000
1,459 16.7%
2,184 22.0%
2,057 18.9%
5,766
(61.5%)
666 7.1%
456 5.5%
3.5%
8.9%
1,783 20.4%
4,929
(60.5%)
5,351
(64.4%)
344
4.3%
373
6,378
(61.4%)
6,206
(57.2%)
356
850
9.1%
1,556 15.0%
3.8%
9.1%
354
3.4%
700
6.7%
4,708
(62.4%)
275 3.6%
352
4.6%
610
8.1%
1,654 20.3%
2,089 25.1%
2,229 23.8%
2,097 20.2%
1,794
23.8%
2,000
1,000
1,671
19.1%
1,674
19.1%
1,598
16.1%
1,746
16.1%
1,710
21.0%
1,701 20.5%
1,665
2Q
3Q
17.7%
1,671
16.1%
1,677 22.2%
0
1Q
2Q
3Q
4Q
1Q
2025年3月期
2026年3月期
人件費
外注加工費
仕入高
減価償却費
4Q
1Q
2027年3月期
その他
Copyright KOSAIDO Holdings Co., Ltd. All Rights Reserved.
20
A1-03 四半期販管費推移
•
第1四半期販管費は前年同期比減少(△55百万円)
•
求人媒体事業の人件費減少による影響が主な要因
(単位:百万円 / %:売上高販管費率)
2,500
2,000
1,864
(21.3%)
515
5.9%
1,890
(21.6%)
2,128
(19.6%)
1,963
(19.8%)
549
527
6.0%
524
139
1,000
500
939
1.2%
0.9%
0.8%
1.8%
10.7%
108
80
73
155
947
1.2%
0.9%
0.8%
1.8%
10.8%
114
1.1%
191
1.9%
93
158
0.9%
883
1,763
(21.6%)
5.3%
1,500
104
83
67
156
5.0%
191
79
197
1.3%
0.7%
1.8%
973
9.0%
113
89
76
163
1,733
(16.7%)
1,708
(22.6%)
482
4.6%
481
6.4%
1.2%
0.6%
0.8%
2.2%
196
1.9%
134
118
62
153
1.8%
0.8%
126
63
82
8.2%
784
7.5%
1,622
(19.5%)
486
5.2%
448
5.4%
111
1.2%
99
87
76
151
1.2%
1.0%
0.9%
305
3.3%
1.8%
77
202
761
9.2%
765
5.8%
1.8%
1.6%
8.9%
469
1,946
(20.7%)
1.1%
1.4%
0.9%
2.0%
853 10.5%
1.6%
0.8%
2.0%
760 10.1%
0
1Q
2Q
3Q
4Q
1Q
2Q
2025年3月期
人件費
3Q
2026年3月期
支払手数料
運搬費等
広告宣伝費
租税公課
4Q
1Q
2027年3月期
2027
その他
Copyright KOSAIDO Holdings Co., Ltd. All Rights Reserved.
21
A1-04 四半期人員数推移
・第1四半期の前年同期対比では、求人媒体事業の譲渡により人材
で大きく減少、M&A等により葬祭で増加。全体で減少。
(単位:人 / %は構成比率 )
※()内は、前年同期比増減
1,200
1,094
1,000
81
9
1,091
7.4%
0.8%
192 17.6%
76
7
7.0%
0.6%
198 18.1%
78
6
1,089
1,083
1,082
7.2%
0.6%
195 18.0%
7.0%
0.5%
78
4
7.2%
0.4%
76
5
206
19.2%
218 20.0%
1,027
71
6
1,023
6.9%
0.6%
72
5
994
1,002
7.0%
0.5%
144 14.0%
135 13.2%
(△95)
72
3
127 12.7%
119
12.0%
(△99)
37.6%
(+24)
800
600
31.4%
344
31.5%
342
31.6%
340
31.4%
350 32.1%
365 35.5%
374
36.6%
368
36.7%
374
468 42.8%
466
42.7%
461 42.6%
455
41.9%
440 40.4%
441 42.9%
437
42.7%
429
42.8%
426
1Q
2Q
3Q
4Q
1Q
2Q
3Q
344
7.2%(△4)
0.3%(△2)
7.3%
0.5%
73
5
400
200
42.9%
(△14)
0
2025年3月期
2026年3月期
情報
葬祭
人材
資産
4Q
1Q
2027年3月期
その他
Copyright KOSAIDO Holdings Co., Ltd. All Rights Reserved.
22
A1-05 四半期営業利益推移(セグメント別)
•
第1四半期の営業利益は、前年同期比△22.2 %減。資産コンサルの前年大
型PJ剥落などが響くも、情報セグメントの損益改善(赤字幅縮小)が寄与。
(単位:百万円)
3,000
2,524
2,500
2,021
2,000
2,276
242
319
1,602
311
1,500
2,155
207
210
266
314
1,671
253
1,455
166
745
242
1,000
500
0
486
1,367
138
△ 26
△ 11
264
△1
2Q
3Q
1,073
△ 87
6
1
781
879
415
186
△ 116
412
178
△ 20
△ 39
△ 11
△ 45
△ 62
△ 66
△ 76
1Q
2Q
3Q
4Q
1Q
530
390
191
△ 27
△ 44
1,132
129
306
895
929
855
287
35
94
22
1,137
607
1,338
749
187
(500)
1Q
4Q
2025年3月期
葬祭公益
2026年3月期
葬祭収益
情報
人材
資産コンサル
2027年3月期
調整額
Copyright KOSAIDO Holdings Co., Ltd. All Rights Reserved.
23
A1-06 2027年3月期第1四半期会計期間営業利益増減分析(主要項目)
•
前年同期対比では、事業譲渡(人材)や大型プロジェクト案件剥落(資産)
を主な要因として減収。原価の低減を進めたものの、売上減の影響等を補い
きれず全体で減益。
(単位:百万円)
+6
葬祭収益売上高
増加額
1,455
+188
’25.6 営業利益
+126
△68
情報売上高
△49
減少額葬祭公益売上高
減少額
情報
’25.6
その他原価
減少額
1,132
’26.6 営業利益
人件費/労務費
減少額
△168
資産売上高
減少額
△38
△318
その他販管費
増加額
人材売上高
減少額
営業利益 △323百万円
(増減率 △ 22.2%)
’26.6
Copyright KOSAIDO Holdings Co., Ltd. All Rights Reserved.
24
A1-07 連結貸借対照表推移
(単位:百万円)
2026年3月
2026年6月
前年差
流動資産
30,120
29,077
△ 1,043
現金および預金
22,423
22,329
△ 94
受取手形および売掛金
4,876
3,314
△ 1,562
固定資産
41,845
41,796
△ 49
有形固定資産
37,156
36,945
△ 211
無形固定資産
1,047
1,045
△2
投資その他資産
3,640
3,805
165
資産合計
71,966
70,873
△ 1,092
流動負債
10,132
9,975
△ 157
短期借入金
1,400
1,400
-
未払法人税等
1,135
218
△ 917
固定負債
12,304
11,381
△ 923
負債合計
22,436
21,356
△ 1,079
株主資本
49,266
49,256
△ 10
資本金
3,261
3,265
4
利益剰余金
39,039
39,022
△ 17
新株予約権
50
48
△2
純資産合計
49,529
49,517
△ 12
負債・純資産合計
71,966
70,873
△ 1,092
Copyright KOSAIDO Holdings Co., Ltd. All Rights Reserved.
25
A1-08 葬祭公益事業の収支|2027年3月期
葬祭公益事業は、公益性の高い事業であり、永続性と非営利性が求められます
透明性の向上
より一層の事業安定
■ 葬祭公益事業に対する当社の責任
火葬設備における
維持・更新にかかる投資
葬祭公益事業における
損失等に対する備え
■ 葬祭公益事業収支の考え方(算出式)
葬祭公益セグメント利益 - 法人税等 - 火葬炉特別修繕積立金 = 収支残
=
(葬祭公益事業損失準備積立金)
■ 2027年3月期における事業収支|2026年4月~2026年6月累計
①葬祭公益セグメントの利益
②セグメント売上高 ③セグメント コスト
1,236
1,049
(② ー ③ )=
187
④法人税等
59
⑤火葬炉
⑥事業収支
特別修繕積立金
(① ー ④ ー ⑤ )=
188
△ 59
(単位:百万円)
収支残は
利益処分
⑦葬祭公益事業
損失準備積立金
0
Copyright KOSAIDO Holdings Co., Ltd. All Rights Reserved.
26
A2-01 ESG 報告
広済堂ホールディングスの ESG報告は、株主・投資家・お取引先を始めとする幅広いステークホルダーの皆さまに、当社のサステナビリ
ティ推進の考え方や具体的な取組みを理解していただくことを目的としています。「広済堂グループ SDGs宣言」において策定した4つ
のマテリアリティ(重要課題)は、ESGにおいても連動しながら推進し企業経営ともリンクしております。
わたしたちの社名にある「広済」には「広く社会に貢献する」という意味があり、創
業以来、この普遍的な理念のもと、葬祭公益セグメント、葬祭収益セグメント、資産コ
ンサルティング、情報、人材関連などの事業を多角化し、人や社会から“感謝”される価
値あるサービスを提供し展開しております。企業理念の実現のための行動とともに、
https://www.kosaido.co.jp/sdgs/
SDGsへの貢献を意識したESGの具体的な取組みをご紹介いたします。
Society
“ともに生きる”
地域社会の発展への貢献
Environment
【火葬事業の社会的責任】
“未来を守る”
温室効果ガスを削減し
環境リスクを軽減
【TCFD提言への賛同】
【従業員参加型エコプログラム】
SDGsへの貢献・取り組み強化
経済活動
“広くささえる”
サステナブルな
経済活動への
価値創造
“企業文化“
透明性と対話のある健全な企業経営
ESG経営の推進
⇒ 持続可能な成長
【コーポレートガバナンス】
Governance
株主・投資家との
コミュニケーション
エンゲージメント
Copyright KOSAIDO Holdings Co., Ltd. All Rights Reserved.
27
A2-02 ESG 報告 [Society/社会] ~火葬事業の社会的責任~
当社は、「広済」(「広く社会に貢献する」の意)の精神のもと事業
を行い、特に東京博善の火葬事業においては、その精神の継承と実践を
通して広く地域社会に貢献しています。
本来、火葬場運営は「墓地・埋葬等に関する法律」によって定められ
ており、経営主体は原則として地方公共団体とし、より難い場合であっ
ても公益法人、宗教法人であることとされていますが、都内においては
その法律が施行される前から東京博善が火葬場を運営していたこともあ
り、民間企業である東京博善が6カ所の火葬場を運営しております。また、
東京博善が有する火葬場は、江戸から明治にかけて整備された歴史があ
り、現在では都内の好立地な場所に施設を構えています。
さらに、東京博善が有する斎場には64基*の火葬炉が稼働しており、火
葬のお取り扱い件数は年間約7万件 * 、これは都内23区内死亡者数の約
70% *にものぼります。それゆえご来場者数も多く約70万人のお客様に
ご来場いただいています。
( *2026年3月現在)
設立から100年以上、民間企業ゆえ公的な援助はなく、大都市東京の社
会インフラを守り社会的な責任を果たす必要不可欠な事業となっており、
地域社会への貢献はもちろん、火葬事業を通じて地域社会の発展を支え
ております。
Copyright KOSAIDO Holdings Co., Ltd. All Rights Reserved.
28
A2-03 ESG 報告 [Society/社会] ~火葬事業の社会的責任~
“火葬待ち”の無い、多死社会を。
~私たちの努力で目指します~
地域社会のみならず社会全体が直面する多死社会は、年々
深刻さを増していきます。死亡者数推移の資料(次ページ参
照)の通り、全国の死亡者数は2040年頃までにピークを迎え、
東京においては2065年までは増加傾向になります。
※死亡者数推移の詳細については次ページ資料をご参照ください。
すでに多死社会が問題視されている状況下において、火葬事業に従事する関係者に
は、速やかな対応が求められてます。しかし、自治体が運営する公営施設では十分な
■火葬待ちを無くすための具体的施策■
対応ができているとは言い難くすでに火葬待ちが発生し、今後さらにご遺族のご希望
首都圏の火葬インフラを担う立場として、昨今
通りに葬儀を執り行うことができない事態も懸念されています。
の火葬待ち日数の増加という社会課題の解決に
こうした多死社会への対応において、東京博善は民間企業ならではの事業視点
をもって社会課題・問題を正確に把握し、公費に頼らない永続的な運営を目指し
努力を重ねています。100年にわたる歴史を持つ東京博善は、東京という人口の
多い都市で加速度的に進む多死社会化に真摯に向き合い、いつの時代も滞りなく
火葬および葬送が執り行える社会を構築していく企業努力が社会的責任であると
考えます。
また、東京博善の存在をなくして、東京の葬送は成り立たないと強く認識し、
これからの100年のみならず未来永劫的に事業を遂行していくことが企業の大き
な社会的意義にもつながっています。全ての社会や地域の人々と信頼の絆を結ぶ
と共に、企業としての責任と求められる適正な行動を自覚し、社会から常に貢献
向け、冬季の営業日数拡大と営業時間の延長を
実施。火葬炉の稼働を最大化し、火葬炉の稼働
率を70%以下に維持することで、ご利用者の希
望する日時にて火葬を実現できる体制を構築し
ました。
また、夕方から葬儀・告別式そして火葬を1日
で行うことができる「夕刻葬」を開始。選択の
バリエーションが増えるとともに、火葬待ち軽
減に寄与できる新しい葬儀のカタチをご提案し
ています。
を認められる企業であることを目指します。
Copyright KOSAIDO Holdings Co., Ltd. All Rights Reserved.
29
A2-04 ESG 報告 [Society/社会] ~火葬事業の社会的責任~
Copyright KOSAIDO Holdings Co., Ltd. All Rights Reserved.
30
A2-05 ESG 報告 [Society/社会] ~火葬事業の社会的責任~
東京博善の取り組み
■円滑な葬儀を実現し、社会的責任を担う火葬技術。
多くの火葬場が「台車式」という火葬炉を導入している中、東京博善では火葬件数の増加に耐えうる
よう、短い時間でご火葬ができる「ロストル式」の火葬炉を導入。他火葬場が通常2~3回転/日のところ、
7~9回転/日で稼働をさせています。葬儀を執り行うまでの待ち時間をなくし、ご遺族にとって心理的な
ご負担を軽減。多死社会に対応すべく、技術はもちろんオペレーション向上にも力を注いでいます。
四ツ木斎場
火葬炉前
■環境への配慮。新・次世代型火葬炉システムを開発。(特許取得)★環境配慮
環境保全への取り組みとして、CO₂の排出量を減らしながら、ダイオキシンを抑制する次世代型の火
葬炉システムの開発を推進。火葬炉余熱による発電と電力還流システムによる、国内初となる環境配慮
型の新・火葬炉システムを開発しました(特許取得)。新・火葬炉システムは、従来型火葬炉システム
と比べて大幅に排気ガス量を抑制し、CO₂やダイオキシンなどの有害物質の低減を実現しました。
■地域との交流を通し相互理解を目指す地域イベント開催。★CSR活動
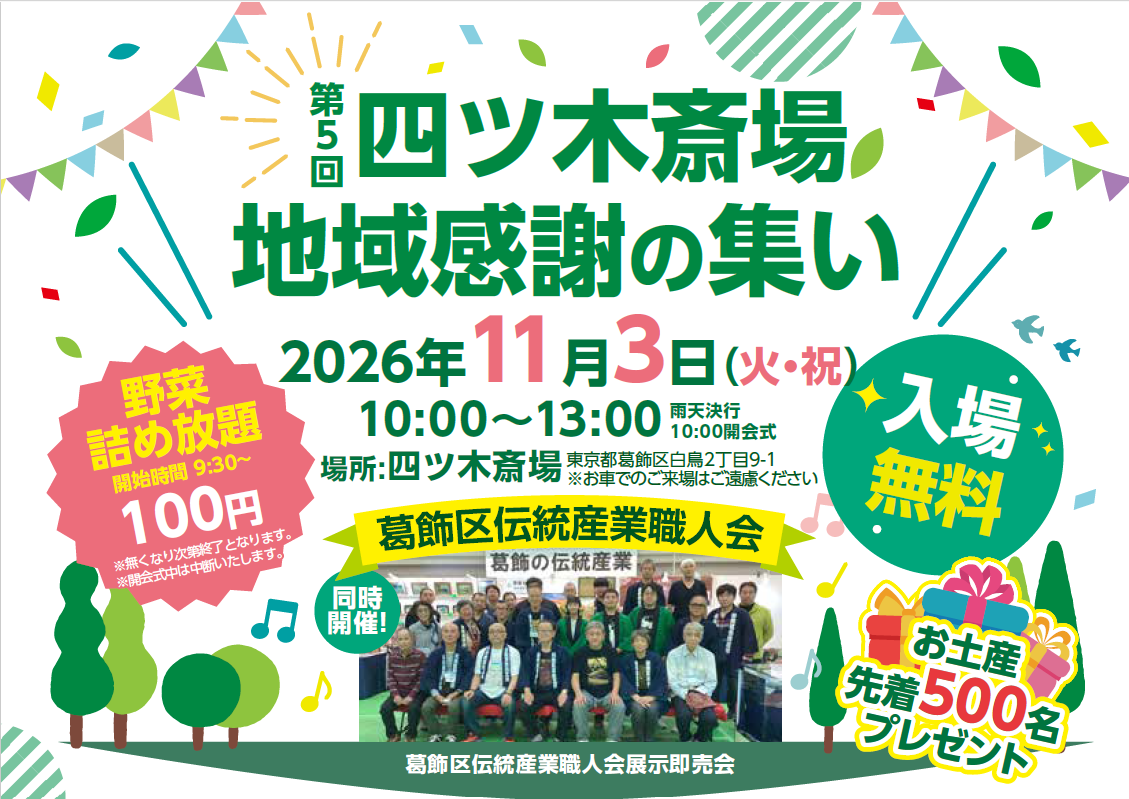
都内6カ所の各斎場では、近隣地域の方々のご理解・ご支援の感謝をこめたイ
ベント「地域感謝の集い」を開催。館内見学ツアーや朝市、障がい者就労支援
商品の販売、落語会、ミニコンサート、絵画展、健康セミナーなど様々な催し
を実施し、お子様から大人までの幅広い世代の皆様に、楽しく有意義なひとと
きをお過ごしいただける場となるよう努めています。各斎場ともご盛況をいた
だいております。
順次、開催斎場を移し開催。
地域の方が楽しんでいただけ
る趣向をこらしたイベントを
企画しております。
※「地域感謝の集い」のイベ
ント開催情報などは、東京博
善ホームページにて随時ご案
内しております。
Copyright KOSAIDO Holdings Co., Ltd. All Rights Reserved.
31
A2-06 ESG 報告 [Environment/環境]
TCFD(気候関連財務情報開示タスクフォース)提言に基づく情報開示
当グループは、2022年にTCFD(気候関連財務情報開示タスクフォース)の提言に賛同するとともに、国際社会の重要な課題となっている
温室効果ガスの排出量の増加や地球温暖化の影響による極端気象に対し、サステナビリティ経営を推進する「SDGs宣言」を発表しました。
「環境」をテーマとしたマテリアリティを設定し、パートナーとの連携でさらなる環境へのリスク軽減を目指してまいります。また、TCFDに
沿った情報開示を開始し、ステークホルダーの皆さまからのフィードバックから、気候変動に関する経営戦略強化につながるPDCAサイクルを
継続的に実行していきます。
開示情報のアップデート(2026年度版) ※2026年7月公表
TCFD提言は、気候変動により会社経営にどのような影響を及ぼすかを的確に把握すべく、4つの要素である「ガバナンス」「戦略」「リス
ク管理」「指標と実績」に沿って情報開示をしています。以下の通り、各要素については最新の情報にて対応しています。
■「ガバナンス」について:
ガバナンス強化のためのリスク管理委員会との連携強化、
およびサステナビリティ推進体制の再整備強化
■「戦略」について
シナリオの定義に基づき、経営におけるリスク/機会の洗い出し
および定性評価の実施状況確認
■「リスク管理」について:
リスク管理の体系化およびエスカレーションプロセスの確認
■「指標と実績」について:
「2026年度版・TCFD提言に基く情報開示」は、
弊社ホームページ[IRサイト/環境方針]にて
2026年7月に公表をしております。
2025年度のScope1/Scope2排出量実績の再算出
Copyright KOSAIDO Holdings Co., Ltd. All Rights Reserved.
32
A2-07 ESG活動報告 [Governance/ガバナンス]
株主価値の最大化と持続的な企業価値の向上及び社会から信頼される企業を目指し、収益力の向上はもちろんのこと、株主の権利を重視し、
効率的で公正かつ透明性の高い経営の実践、コンプライアンスの徹底を実施しております。さらには、環境、社会、ガバナンスの側面から企
業に求められている社会的責任を果たし、加えて企業と社会の持続可能な成長のための社会課題に取り組むこと等により、コーポレート・ガ
バナンスの充実を図ってまいります。
コーポレート・ガバナンス体制の概要
■取締役会
監査役会設置会社として、取締役による的確な意思決定と迅速な業務執行を行う一方、適正な監督及び監視を可能とする経営体
制を構築し、コーポレート・ガバナンスの充実を図り、基本的な考え方に基づき、経営の公正性及び透明性の向上に努めています。また、独
立社外取締役及び独立社外監査役を主なメンバーとする任意の指名・報酬委員会を設置し、取締役の報酬及びその決定方針並びに取締役の各
候補者案について審議を行い、取締役会に対して答申を行っています。取締役会は業務執行取締役2名、非常勤取締役1名及び社外取締役5
名並びに監査役が出席し、原則月1回の定例取締役会のほか、必要に応じ臨時取締役会を開催し、経営目標や経営戦略など重要な事業戦略、ま
た法令で定められた事項を決定するとともに、業務執行の状況を監督しています。
■監査役会
常勤監査役1名、社外監査役2名を
選任し、経営監視機能の客観性及び中立性を確保
し、ガバナンスのあり方や運営状況を監査してお
ります。また、社外監査役2名を独立役員として
指名し、社外取締役及び社外監査役の役割は中
立・公平な立場を保持し、株主の負託を受けた独
立機関として、経営の中立性・客観性の確保を担
保することであると理解しております。
コーポレート・ガバナンスに関しての詳細については、弊社ホームページ「IR情報>コーポレート・ガバナンス」にて開示しております。
Copyright KOSAIDO Holdings Co., Ltd. All Rights Reserved.
33
A3-01 会社概要
会社名
株式会社広済堂ホールディングス
創業
1949年1月
売上高
36,228百万円
純資産
49,517百万円
(2026年3月期)
総資産
70,873百万円
(2026年6月末)
(2026年6月末)
代表者
代表取締役会長CEO 羅怡文 ,代表取締役社長COO 常盤誠
従業員数
994人(連結|2026年6月末現在)
市場情報
東京証券取引所プライム市場
(証券コード:7868)
Copyright KOSAIDO Holdings Co., Ltd. All Rights Reserved.
34
A3-02 沿革
2022年
葬儀サービス開始
・広済堂ライフウェル
・グランセレモ東京
2021年
持株会社体制に移行
1984年
東京博善がグループに加わる
(エンディング関連事業開始)
1970年
日本初の
コンピュータ組版会社設立
1977年
求人情報誌創刊
(人材サービス事業開始)
2013年
ベトナム法人設立
(海外人材事業開始)
2023年
資産コンサルティングサービス開始
・東京博善あんしんサポート
1949年
櫻井謄写堂を創業
(情報ソリューション事業開始)
Copyright KOSAIDO Holdings Co., Ltd. All Rights Reserved.
35
A3-03 ミッション・ビジョン・バリュー
MISSION
人生100年をもっと豊かに
VISION
たくさんの“ありがとう”をつくり出す会社
VALUE
一人ひとりの挑戦と、組織としての強いつながりで、
ありがとうに溢れる革新的なサービスを提供します
当社は、社名にある「広済」(広く社会に貢献する)を経営理念とし、
社会の発展と人々の豊かな暮らし創りの担い手として、信頼される企業グループを
目指しております。
Copyright KOSAIDO Holdings Co., Ltd. All Rights Reserved.
36
GROUP
エンディング関連事業
広済堂グループ
人生100年を
もっと豊かに。
[主な事業内容]
火葬場運営・式場提供
葬儀サービス
エンディング関連ビジネス
税務・不動産・金融サービス
広済堂ライフウェル
横濱聖苑
セレモライフ
グランセレモ東京
情報ソリューション事業
[主な事業内容]
オフセット印刷(出版・商業)
デジタル印刷
パッケージ印刷
IT・デジタルソリューション
キャンペーンソリューション
D2Cビジネス支援
デジタルプロモーション支援
BPOサービス
展覧会ビジネス
キャラクターマーチャンダイジング
KOSAIDOはグループの力を結集し、
「エンディング関連事業」「情報ソリューション事業」
「人材サービス事業」の3つの事業領域から
人材サービス事業
人々の人生100年を総合的に支援。
より良い環境、豊かな生活、そして希望に満ちた社会を
この先の未来に実現する革新的な
サービスの創出にチャレンジします。
[主な事業内容]
海外人材サービス
人材派遣
登録支援機関
人材紹介
SES
教育研修
※2026年7月末時点
Copyright KOSAIDO Holdings Co., Ltd. All Rights Reserved.
37
A3-05 広済堂グループSDGs宣言
私たちは「広く社会に貢献する」
企業理念の実現のための行動を
起こすべく、
「SDGs」に貢献する
経済
社会
広くささえる
ともに生きる
サステナブルな経済活動への価値創造
公平で多様性のある地域社会の発展
目まぐるしく変化する世情の中においても、わた
したちのDNAである「広済(広く社会に貢献する」
の名のもと、サステナブルな経済活動のイノベー
ターとなり、既成概念に捉われない柔軟性で共創
価値を創造します。
これからの「人生100年時代」に、誰もが自分
らしい生き方を選ぶことができるよう、“思い
やりファースト”で地域社会のファシリテー
ターとなり、身も心も自由なライフスタイルを
実現します。
4つのマテリアリティを定めました。
希望ある未来を創造するため、
社員も含めたステークホルダーの
皆さまとともに、
“iDO”を社会課題解決の実現という
“DO”につなげてまいります。
環境
企業文化
未来をまもる
笑顔でつながる
環境負荷軽減による美しい地球の継承
透明性と対話のある健全な企業経営
次世代を生きる子どもたちや生き物が共存できるよ
う、地球のライフセーバーとなり、温室効果ガスの
削減や生態系の保全に努め、パートナーとの連携で
更なる環境リスク軽減を目指します。
法令遵守はもとより、誰ひとり取り残さないSDGsの普遍
的価値に基づく「人権尊重」「ジェンダー平等」「女性
のエンパワーメント」推進によって、一人ひとりがムー
ドメーカーとなり、働きがいある職場づくりとコミュニ
ケーションにあふれる企業文化を守り続けます。
Copyright KOSAIDO Holdings Co., Ltd. All Rights Reserved.
38
A3-06 問い合わせ先
本資料及び その他IRに関するご意見・ご質問がございましたら
下記URLよりお問い合せください。
また『機関投資家・アナリスト様向け 施設見学会』
( 東京博善(株)の運営する斎場見学 )を適宜開催しております。
ご希望される場合は、下記URLよりお問い合わせください。
問い合わせフォームURL
https://www.kosaido.co.jp/contact/
Copyright KOSAIDO Holdings Co., Ltd. All Rights Reserved.
39
人生100年をもっと豊かに
<本資料についてのご注意>
本資料のうち、業績見通し等に記載されている各数値は、現在入手可能な情報による判断および仮定に基
づいて算定しており、判断や仮定に内在する不確定性および今後の事業運営や内外の状況変化等による変
動可能性から、実際の業績等が見通しの数値と大きく異なる結果となりうることを、ご承知おき下さい。
https://www.kosaido.co.jp/