○添付資料の目次 1.経営成績等の概況 ……………………………………………………………………………………………………… 2 (1)当四半期の経営成績の概況 ……………………………………………………………………………………… 2 (2)当四半期の財政状態の概況 ……………………………………………………………………………………… 2…
○添付資料の目次
1.経営成績等の概況 ………………………………………………………………………………………………………
2
(1)当四半期の経営成績の概況 ………………………………………………………………………………………
2
(2)当四半期の財政状態の概況 ………………………………………………………………………………………
2
(3)連結業績予想などの将来予測情報に関する説明 ………………………………………………………………
3
2.四半期連結財務諸表及び主な注記 ……………………………………………………………………………………
4
(1)四半期連結貸借対照表 ……………………………………………………………………………………………
4
(2)四半期連結損益計算書及び四半期連結包括利益計算書 ………………………………………………………
6
四半期連結損益計算書 ……………………………………………………………………………………………
6
四半期連結包括利益計算書 ………………………………………………………………………………………
7
(3)四半期連結財務諸表に関する注記事項 …………………………………………………………………………
8
(四半期連結財務諸表の作成に特有の会計処理に関する注記) ………………………………………………
8
(セグメント情報等の注記) ………………………………………………………………………………………
9
(株主資本の金額に著しい変動があった場合の注記) …………………………………………………………
10
(継続企業の前提に関する注記) …………………………………………………………………………………
10
(四半期連結キャッシュ・フロー計算書に関する注記) ………………………………………………………
10
(重要な後発事象) …………………………………………………………………………………………………
10
萩原工業㈱
(7856)
2026年10月期第3四半期決算短信
1.経営成績等の概況
(1)当四半期の経営成績の概況
当第3四半期連結累計期間における我が国の経済は、雇用・所得環境の改善等を背景として緩やかな回復基調に
ありますが、米国の通商政策の影響やインバウンドの変調などの影響に加え、中東情勢の混乱による各種資材等の
価格高騰や供給制約が見られました。中東情勢の影響については、一定の落ち着きは見せているものの、先行き不
透明な状況が続いております。
このような状況のもと、当社グループにおきましては、物価上昇や人手不足に伴う需要の減少に直面しました
が、高付加価値製品の開発と販売強化、環境関連や海外市場など成長分野への注力などを通じて、収益確保に努め
てまいりました。また中東情勢の混乱による原材料調達への影響が生じましたが、製品の安定供給を最優先に事業
運営を行いました。
その結果、売上高251億10百万円(前年同四半期比4.4%増)、営業利益18億41百万円(前年同四半期比38.2%
増)、経常利益21億57百万円(前年同四半期比45.0%増)、親会社株主に帰属する四半期純利益は14億94百万円
(前年同四半期比4.0%減)となりました。親会社株主に帰属する四半期純利益が減少している理由は、前第3四
半期連結累計期間において笠岡工場建設に伴い交付決定された補助金8億円を特別利益に計上したためでありま
す。
セグメントごとの経営成績は次のとおりであります。
[合成樹脂加工製品事業]
合成樹脂加工製品事業におきましては、総じて原材料価格高騰に伴う価格改定の浸透や中東情勢を受けた追加需
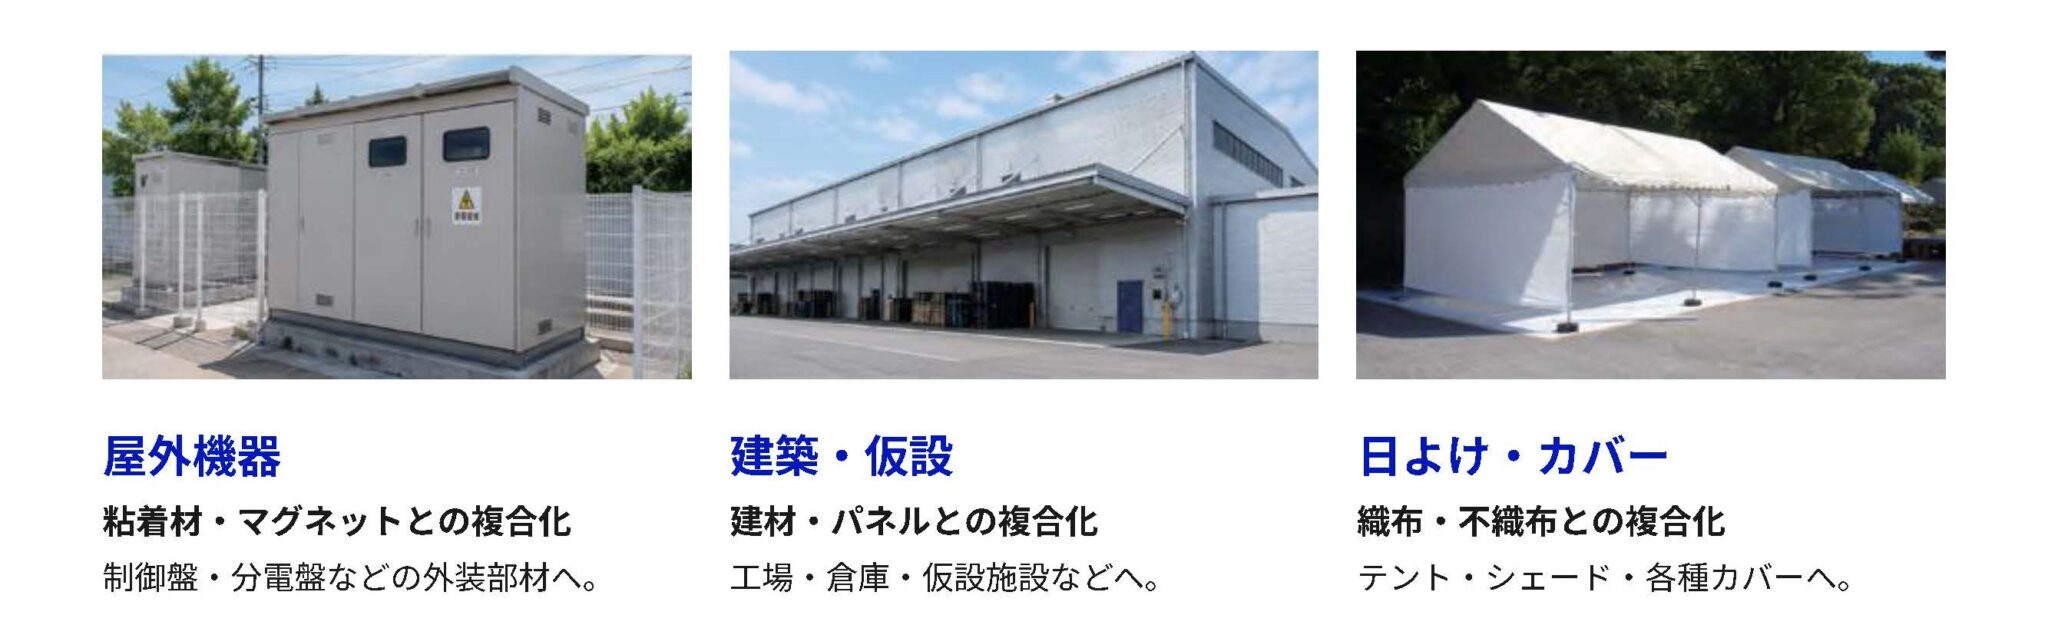
要が増収要因でした。さらに、耐候・遮熱などの高機能化製品が伸びたシート、大口顧客との取引復活があったフ
レコン関連、農業資材用遮熱原糸、人工芝原糸などは需要も伸びて増収となりました。また、粘着用原反、包装資
材用メルタックは需要が伸び悩んだものの価格改定効果で増収となりました。一方、米国の通商政策の影響で海外
向けラミクロスは減収となりました。
コンクリート補強繊維の「バルチップ」は、鉱山向けで価格競争が厳しくなる中、道路舗装向けなど新たな需要
を取り込み、増収となりました。
インドネシア子会社「ハギハラ・ウエストジャワ・インダストリーズ社」におきましては、価格改定効果に加
え、主要製品であるバルチップの販売増もあり増収となりました。国内子会社の「東洋平成ポリマー株式会社」に
おきましては、フィルム関係の販売が好調で増収となりました。
その結果、売上高214億61百万円(前年同四半期比8.7%増)、営業利益15億29百万円(前年同四半期比44.2%
増)となりました。
[機械製品事業]
機械製品事業におきましては、主力のスリッターは、投資需要の低迷する中国向けが低調だったことなどによ
り、紙スリッター、フィルムスリッターともに減収となりました。
押出関連機器では、リチウムイオン電池セパレーター用スクリーンチェンジャーなどの販売があり、増収となり
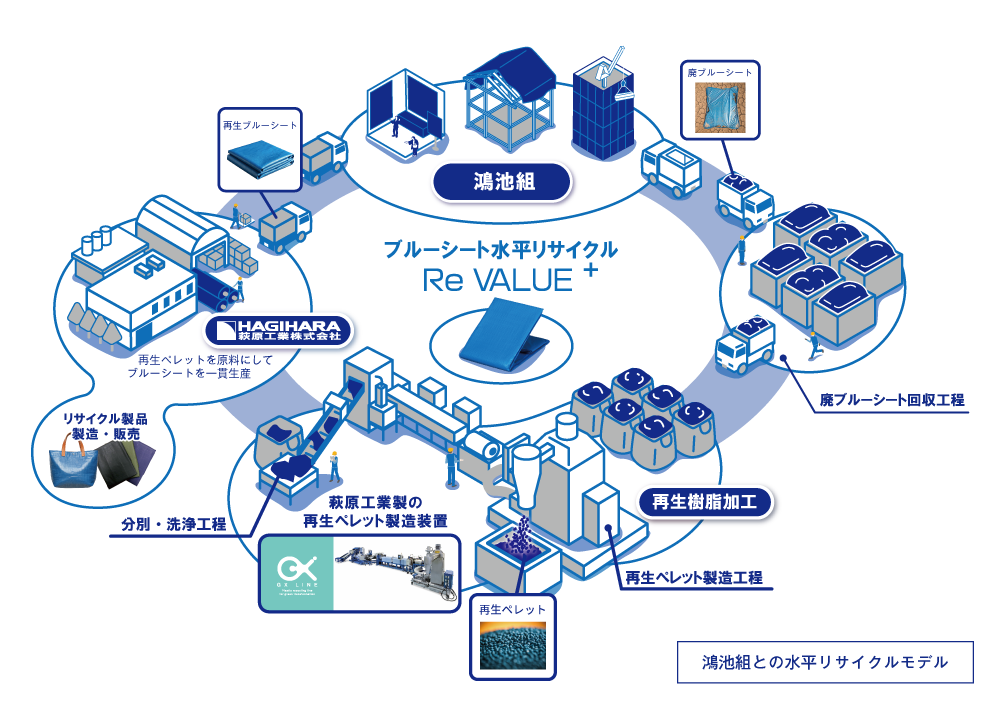
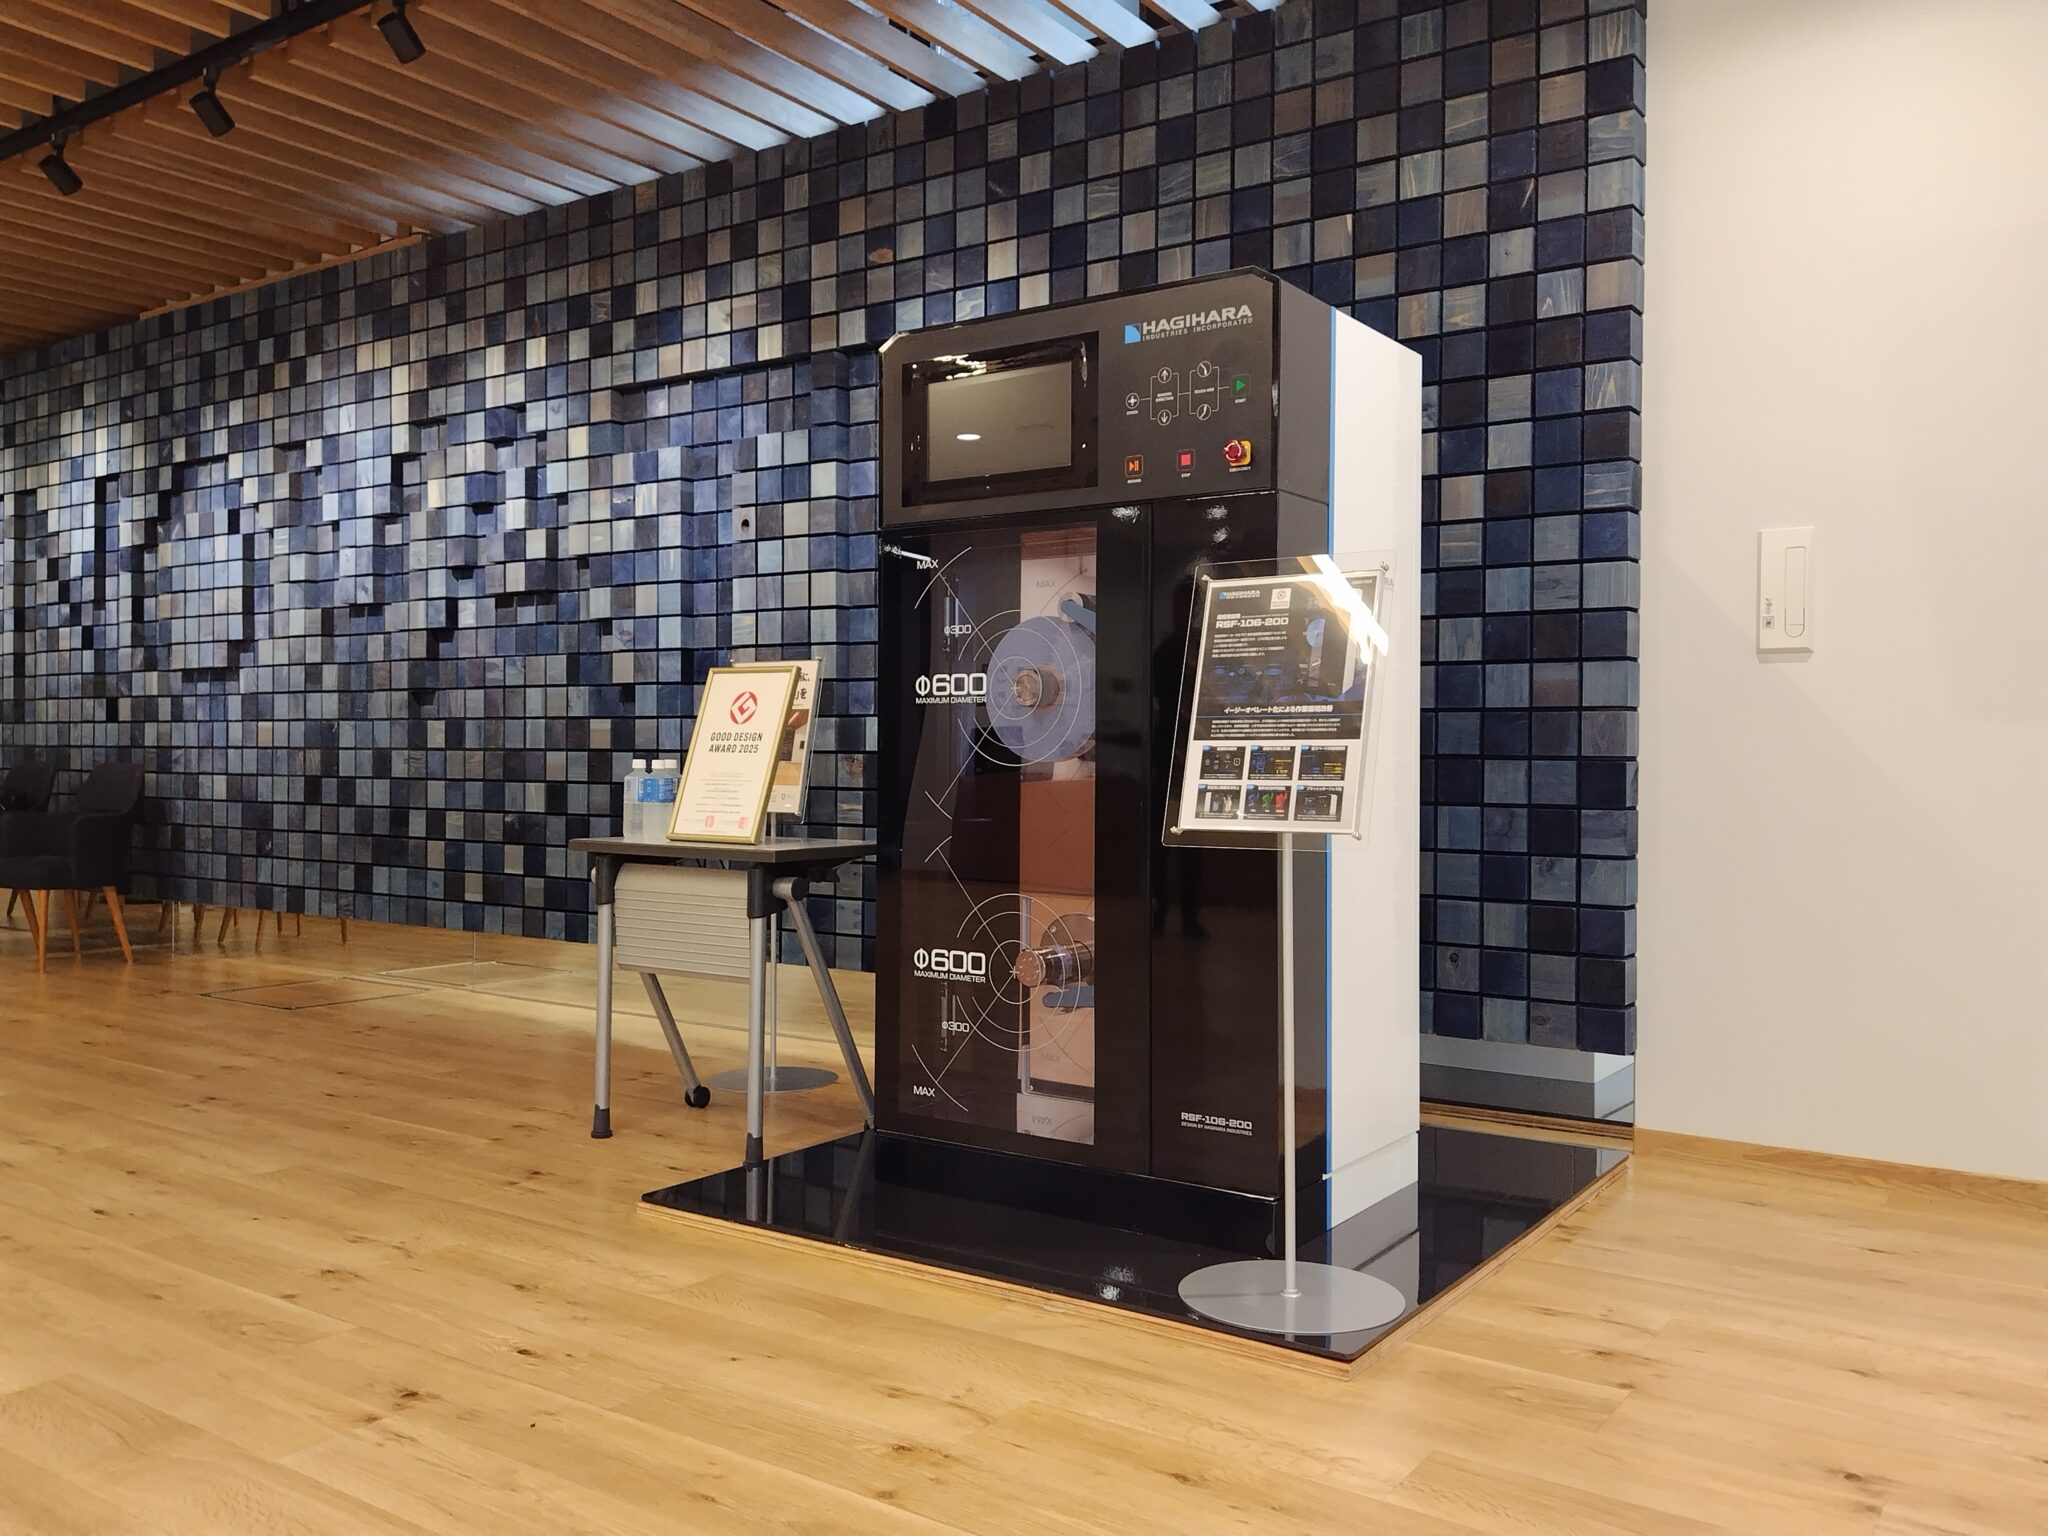
ました。リサイクル関連では、ブルーシートの水平リサイクル技術で開発した高度洗浄設備の初の販売などがあ
り、増収となりました。
その結果、売上高36億49百万円(前年同四半期比15.1%減)、営業利益3億12百万円(前年同四半期比14.8%
増)となりました。
(2)当四半期の財政状態の概況
資産の部では、流動資産は232億64百万円となり、前連結会計年度末に比べ21億28百万円の増加となりました。
これは主に現金及び預金が15億24百万円減少した一方、棚卸資産が22億58百万円増加したこと等によります。
固定資産は215億82百万円となり、前連結会計年度末に比べ15百万円の減少となりました。これは主に機械装置
及び運搬具が94百万円減少したこと等によります。
負債の部では、流動負債は92億39百万円となり、前連結会計年度末に比べ14億11百万円の増加となりました。こ
れは主に支払手形及び買掛金が11億48百万円増加したこと等によります。
固定負債は34億64百万円となり、前連結会計年度末に比べ4億76百万円の減少となりました。これは主に長期借
入金が5億58百万円減少したこと等によります。
純資産の部は321億42百万円となり、前連結会計年度末に比べ11億77百万円の増加となりました。これは主に利
益剰余金が5億2百万円及び為替換算調整勘定が6億97百万円増加したこと等によります。この結果、自己資本比
率は71.5%となりました。
萩原工業㈱
(3)連結業績予想などの将来予測情報に関する説明
2025年12月8日に公表いたしました業績予想の変更はありません。
(7856)
2026年10月期第3四半期決算短信
萩原工業㈱
(7856)
2026年10月期第3四半期決算短信
2.四半期連結財務諸表及び主な注記
(1)四半期連結貸借対照表
(単位:千円)
前連結会計年度
(2025年10月31日)
資産の部
流動資産
現金及び預金
受取手形及び売掛金
電子記録債権
商品及び製品
仕掛品
原材料及び貯蔵品
その他
貸倒引当金
流動資産合計
固定資産
有形固定資産
建物及び構築物(純額)
機械装置及び運搬具(純額)
工具、器具及び備品(純額)
土地
建設仮勘定
有形固定資産合計
無形固定資産
のれん
その他
無形固定資産合計
投資その他の資産
繰延税金資産
退職給付に係る資産
保険積立金
その他
投資その他の資産合計
固定資産合計
資産合計
当第3四半期連結会計期間
(2026年7月31日)
5,857,015
5,071,603
2,521,257
2,662,124
2,636,687
1,505,623
943,317
△61,027
21,136,603
4,332,630
5,706,857
3,134,153
3,238,428
3,313,565
2,511,095
1,073,852
△45,950
23,264,633
7,575,414
5,670,238
399,705
3,677,186
1,107,975
18,430,520
7,398,212
5,575,416
578,016
3,677,186
1,180,983
18,409,815
58,333
452,539
510,872
39,583
516,490
556,073
36,076
1,571,298
307,657
741,656
2,656,688
21,598,082
42,734,685
95,615
1,574,638
313,481
632,742
2,616,477
21,582,366
44,846,999
萩原工業㈱
(7856)
2026年10月期第3四半期決算短信
(単位:千円)
前連結会計年度
(2025年10月31日)
負債の部
流動負債
支払手形及び買掛金
電子記録債務
短期借入金
未払法人税等
賞与引当金
製品保証引当金
その他
流動負債合計
固定負債
長期借入金
退職給付に係る負債
その他
固定負債合計
負債合計
純資産の部
株主資本
資本金
資本剰余金
利益剰余金
自己株式
株主資本合計
その他の包括利益累計額
その他有価証券評価差額金
繰延ヘッジ損益
為替換算調整勘定
退職給付に係る調整累計額
その他の包括利益累計額合計
新株予約権
非支配株主持分
純資産合計
負債純資産合計
当第3四半期連結会計期間
(2026年7月31日)
1,711,606
1,418,791
1,710,315
340,589
641,757
55,298
1,949,832
7,828,190
2,860,023
945,433
2,074,839
510,629
376,265
54,173
2,417,947
9,239,311
2,813,030
871,642
256,448
3,941,120
11,769,311
2,254,697
899,739
310,479
3,464,916
12,704,227
1,778,385
1,472,428
26,621,678
△1,063,722
28,808,769
1,778,385
1,469,882
27,124,296
△1,005,517
29,367,046
69,057
△4,901
1,212,149
815,399
2,091,705
40,416
24,481
30,965,374
42,734,685
124,989
△631
1,909,600
680,316
2,714,276
32,132
29,316
32,142,771
44,846,999
萩原工業㈱
(7856)
2026年10月期第3四半期決算短信
(2)四半期連結損益計算書及び四半期連結包括利益計算書
(四半期連結損益計算書)
(単位:千円)
前第3四半期連結累計期間
(自 2024年11月1日
至 2025年7月31日)
当第3四半期連結累計期間
(自 2025年11月1日
至 2026年7月31日)
24,044,071
17,541,495
6,502,575
5,169,790
1,332,784
25,110,751
18,100,818
7,009,933
5,168,439
1,841,493
17,838
5,295
25,672
53,441
20,418
96,645
219,311
28,582
6,645
21,949
242,458
21,617
80,425
401,678
34,853
28,592
63,446
1,488,649
31,832
53,470
85,303
2,157,867
800,000
800,000
2,288,649
734,285
1,554,363
-
-
2,157,867
658,927
1,498,939
△3,363
4,037
1,557,727
1,494,902
売上高
売上原価
売上総利益
販売費及び一般管理費
営業利益
営業外収益
受取利息
受取配当金
受取保険金
為替差益
試作品等売却収入
その他
営業外収益合計
営業外費用
支払利息
その他
営業外費用合計
経常利益
特別利益
補助金収入
特別利益合計
税金等調整前四半期純利益
法人税等
四半期純利益
非支配株主に帰属する四半期純利益又は非支配株主
に帰属する四半期純損失(△)
親会社株主に帰属する四半期純利益
萩原工業㈱
(7856)
2026年10月期第3四半期決算短信
(四半期連結包括利益計算書)
(単位:千円)
前第3四半期連結累計期間
(自 2024年11月1日
至 2025年7月31日)
当第3四半期連結累計期間
(自 2025年11月1日
至 2026年7月31日)
1,554,363
1,498,939
15,164
3,625
55,358
△94,996
△20,847
1,533,516
55,931
4,270
698,248
△135,082
623,367
2,122,307
1,536,701
△3,185
2,117,473
4,834
四半期純利益
その他の包括利益
その他有価証券評価差額金
繰延ヘッジ損益
為替換算調整勘定
退職給付に係る調整額
その他の包括利益合計
四半期包括利益
(内訳)
親会社株主に係る四半期包括利益
非支配株主に係る四半期包括利益
萩原工業㈱
(7856)
2026年10月期第3四半期決算短信
(3)四半期連結財務諸表に関する注記事項
(四半期連結財務諸表の作成に特有の会計処理に関する注記)
(税金費用の計算)
税金費用については、当第3四半期連結会計期間を含む連結会計年度の税引前当期純利益に対する税効果会計
適用後の実効税率を合理的に見積り、税引前四半期純利益に当該見積実効税率を乗じて計算しております。
萩原工業㈱
(7856)
2026年10月期第3四半期決算短信
(セグメント情報等の注記)
【セグメント情報】
Ⅰ
前第3四半期連結累計期間(自 2024年11月1日至 2025年7月31日)
1.報告セグメントごとの売上高及び利益又は損失の金額に関する情報並びに収益の分解情報
(単位:千円)
報告セグメント
四半期連結損益
計算書計上額
(注)
調整額
合成樹脂
加工製品事業
機械製品事業
日本
アジア
13,656,286
2,543,516
3,265,000
1,024,598
16,921,287
3,568,114
-
-
16,921,287
3,568,114
北アメリカ
南アメリカ
1,271,157
1,214,468
3,107
-
1,274,264
1,214,468
-
-
1,274,264
1,214,468
ヨーロッパ
オセアニア
422,335
631,289
2,364
-
424,699
631,289
-
-
424,699
631,289
アフリカ
8,222
1,724
9,947
-
9,947
顧客との契約から生じる収益
その他の収益
19,747,275
-
4,296,795
-
24,044,071
-
-
-
24,044,071
-
外部顧客への売上高
19,747,275
4,296,795
24,044,071
-
24,044,071
-
427,312
427,312
△427,312
-
19,747,275
4,724,108
24,471,384
△427,312
24,044,071
1,060,849
271,934
1,332,784
-
1,332,784
計
売上高
セグメント間の内部売上高又は
振替高
計
セグメント利益
(注)セグメント利益は、四半期連結損益計算書の営業利益と一致しております。
Ⅱ
当第3四半期連結累計期間(自
2025年11月1日
至
2026年7月31日)
1.報告セグメントごとの売上高及び利益又は損失の金額に関する情報並びに収益の分解情報
(単位:千円)
報告セグメント
四半期連結損益
計算書計上額
(注)
調整額
合成樹脂
加工製品事業
機械製品事業
日本
14,898,016
2,969,586
17,867,602
-
17,867,602
アジア
2,452,712
526,081
2,978,794
-
2,978,794
北アメリカ
南アメリカ
ヨーロッパ
オセアニア
1,313,998
1,707,398
438,746
637,356
152,796
-
1,188
-
1,466,794
1,707,398
439,935
637,356
-
-
-
-
1,466,794
1,707,398
439,935
637,356
計
売上高
アフリカ
12,869
-
12,869
-
12,869
顧客との契約から生じる収益
その他の収益
21,461,098
-
3,649,653
-
25,110,751
-
-
-
25,110,751
-
外部顧客への売上高
21,461,098
3,649,653
25,110,751
-
25,110,751
-
23,272
23,272
△23,272
-
21,461,098
3,672,925
25,134,023
△23,272
25,110,751
1,529,353
312,139
1,841,493
-
1,841,493
セグメント間の内部売上高又は
振替高
計
セグメント利益
(注)セグメント利益は、四半期連結損益計算書の営業利益と一致しております。
萩原工業㈱
(7856)
2026年10月期第3四半期決算短信
(株主資本の金額に著しい変動があった場合の注記)
該当事項はありません。
(継続企業の前提に関する注記)
該当事項はありません。
(四半期連結キャッシュ・フロー計算書に関する注記)
当第3四半期連結累計期間に係る四半期連結キャッシュ・フロー計算書は作成しておりません。なお、第3四半
期連結累計期間に係る減価償却費(のれんを除く無形固定資産に係る償却費を含む。)及びのれんの償却額は、次
のとおりであります。
前第3四半期連結累計期間
(自 2024年11月1日
至 2025年7月31日)
減価償却費
のれんの償却額
当第3四半期連結累計期間
(自 2025年11月1日
至 2026年7月31日)
1,533,308千円
18,749
1,645,533千円
18,749
(重要な後発事象)
当社は、本日開催の取締役会において、株式会社日本政策投資銀行との間で、資本業務提携契約を締結し、同行
を割当予定先とする第三者割当による自己株式の処分を行うことを決議しました。
本件の詳細につきましては、本日公表の「資本業務提携契約の締結、第三者割当による自己株式の処分並びに主
要株主及び主要株主である筆頭株主の異動に関するお知らせ」をご参照ください。