|
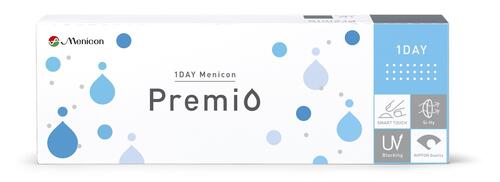
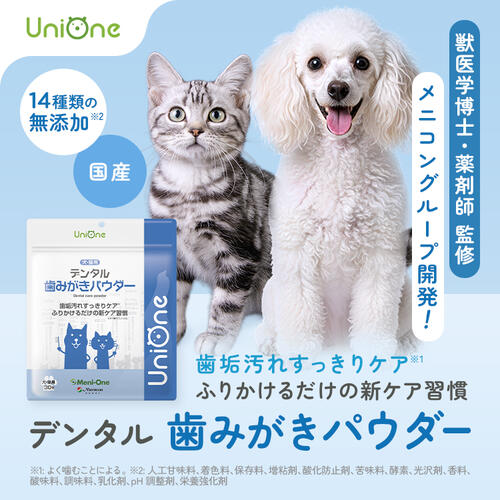
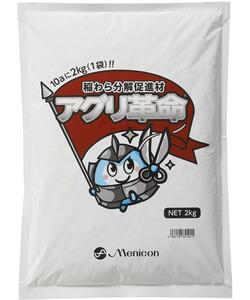
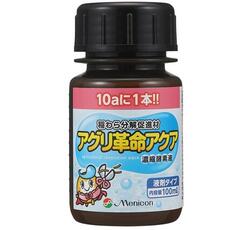
Menicon Co., Ltd. is a Japanese manufacturer and distributor of vision care products, primarily contact lenses and related care solutions. The company operates through two main segments: Vision Care and Other. In the Vision Care segment, Menicon develops and sells hard, soft, and disposable contact lenses, including 1-day, 2-week, and 1-month replacement types, along with cleaning and storage solutions. The company offers a subscription-based membership service called Mels Plan, which provides guarantees for loss, damage, and prescription changes. Menicon serves domestic and international markets, including Europe, North America, and Asia, where it supplies private-label disposable lenses to major retail chains and sells orthokeratology lenses. The company maintains production facilities in Japan and Malaysia to support global demand. In the Other segment, the group engages in the development of animal medical products, agricultural materials such as rice straw decomposition agents, reproductive assistance medical products, human resource dispatch, and the sale and import/export of agricultural and aquatic products. Menicon was founded in 1951 following the development of Japan's first corneal contact lens by its founder, Yasukazu Tanaka. Key subsidiaries include W.I. System Co., Ltd., Menicon Nect Co., Ltd., Alpha Corporation, and Menicon SAS. Summarised from the annual report, fiscal year ended Mar 2026 |
Industry Medical Devices | Homepage menicon.co.jp |
| Sector Healthcare | IR page menicon.co.jp | |
|
Tags
contact lenses, orthokeratology, disposable lenses, vision care, animal medical products, agricultural materials, subscription services, reproductive assistance, Mels Plan, W.I. System Co. Ltd., Menicon Nect Co. Ltd., Alpha Corporation, Itabashi Trading Co. Ltd., Menicon SAS, Menicon GmbH, Menicon B.V., SOLEKO S.p.A., Menicon (Dalian) Medical Technology Co. Ltd., Menicon Malaysia Sdn. Bhd., Menicon Business Assist Co. Ltd.
|
Press page menicon.co.jp/company/news |
Metrics
| Valuation | |
|---|---|
| Market cap | ¥ 131.817B |
| Market cap (USD) | $ 823.863M |
| P/E | 20.08 |
| PEG | — |
| P/BV | 1.37 |
| P/S | 1.02 |
| P/OCF | 12.98 |
| P/FCF | -30.59 |
| Dividend yield | 1.6% |
| Turnover / mcap | — |
| Returns | |
|---|---|
| ROE | 6.5% |
| ROI | 5.2% |
| ROIC | 6.0% |
| Profit margin | 4.7% |
| Growth | |
|---|---|
| Revenue growing | Yes |
| Profits growing | Yes |
| Revenue up 3y | Yes |
| Revenue up 5y | Yes |
| Earnings growth 3y (net profit CAGR) | -7.1% |
| Quality | |
|---|---|
| Profitable | Yes |
| Margin expanding | No |
| Buying back stock | No |
| Diluting (TTM) | No |
| Debt/Equity | — |
| Podcast bulls (TTM) | Sign up |
| Podcast bears (TTM) | Sign up |
| Podcast sentiment (TTM) | Sign up |
| Podcast sentiment % (TTM) | Sign up |
| News sentiment (TTM) | 26 |
| Quality score | 11.1% |
| Insiders | |
|---|---|
| Buys, 1w | Sign up |
| Buys, 1m | Sign up |
| Buys, 1y | Sign up |
| Sells, 1w | Sign up |
| Sells, 1m | Sign up |
| Sells, 1y | Sign up |
Sign up to see this company's insider trades
| Figure | FY 2026 | FY 2025 | FY 2024 | FY 2023 | FY 2022 | FY 2021 | FY 2020 | FY 2019 | FY 2018 | FY 2017 | FY 2016 | FY 2015 | FY 2014 | FY 2013 |
|---|---|---|---|---|---|---|---|---|---|---|---|---|---|---|
| Revenue | 125.605B | 121.491B | 116.192B | 110.194B | 100.172B | 86.209B | 84.519B | 80.898B | 76.672B | 72.052B | 67.332B | 63.131B | 62.209B | 57.933B |
| Net profit | 5.916B | 5.621B | 4.538B | 7.377B | 6.481B | 5.952B | 4.06B | 3.576B | 2.657B | 2.543B | 2.224B | 1.431B | 1.01B | 925.917M |
| Free cash flow | -4.659B | -3.544B | -9.468B | -226M | -2.002B | 437M | 3.12B | 2.384B | 3.675B | 1.459B | 4.18B | — | — | — |
Filed figures
Lines the statements and their notes report beside the headline figures, read from the filings' XBRL as filed (no restatement applied), with figures computed from one filing's own lines. Cash-flow lines carry their cash direction: an outflow is negative. Each period links to its filing; a figure's period, report date and tag are in its tooltip.
| Figure | Mar 2017 | Mar 2018 | Mar 2019 | Mar 2020 | Mar 2021 | Mar 2022 | Mar 2023 | Mar 2024 | Mar 2025 | Mar 2026 |
|---|---|---|---|---|---|---|---|---|---|---|
| Balance sheet detail | ||||||||||
| Trade receivables (JPY) | 8.06B | 8.16B | 8.86B | 9.73B | 10.7B | 22.5B | 24.8B | 26.6B | 27.2B | 29.5B |
| ↳ YoY growth | +5.1% | +1.2% | +8.5% | +9.9% | +10.3% | +109.9% | +10.0% | +7.5% | +2.0% | +8.7% |
| ↳ 5y CAGR | +7.0% | +22.8% | +24.9% | +24.6% | +22.8% | +22.4% | ||||
| Borrowings, current (JPY) | 4.28B | 5.51B | 3.78B | 3.34B | 2.87B | 2.8B | 2.34B | 1.97B | 1.17B | 4.67B |
| Borrowings, non-current (JPY) | 15.2B | 10.5B | 15B | 5.77B | 34.2B | 32.6B | 45.4B | 40.6B | 65.4B | 62.3B |
| Bonds payable (JPY) | 9.42B | 7.95B | 13.3B | 5.55B | 27B | 26B | 40.2B | 36.5B | 46.3B | 46.2B |
| Lease liabilities (JPY) | 271M | 202M | 120M | 4.31B | 8.24B | 7.05B | 5.87B | 5.27B | 8.54B | 7.22B |
| Cash and deposits (JPY) | 12.7B | 16.9B | 20.1B | 17.3B | 41.5B | 33B | 41.2B | 46.9B | 42B | 32.6B |
| Intangible assets (JPY) | 8.72B | 7.45B | 6.24B | 7.06B | 12.2B | 11.6B | 11.5B | 11.7B | 15.3B | 13.6B |
| Net debt (borrowings + leases - cash) (JPY) | 7.13B | -721M | -1.21B | -3.9B | 3.85B | 9.39B | 12.3B | 911M | 33B | 41.6B |
| Cash flow detail | ||||||||||
| Operating cash flow (JPY) | 5.2B | 7.86B | 7.02B | 8.71B | 10.6B | 12.7B | 12.7B | 11.9B | 13.9B | 11.8B |
| Purchases of property, plant and equipment (JPY) | -2.77B | -4.18B | -4.64B | -5.59B | -10.2B | -14.7B | -11.4B | -20.1B | -14B | -15.2B |
| Purchases of intangible assets (JPY) | -969M | -628M | -563M | -885M | -1.68B | -1.23B | -1.54B | -1.23B | -3.47B | -1.29B |
| Change in receivables (cash effect) (JPY) | -292M | -64M | -760M | -98M | -412M | -232M | -937M | -354M | -33M | -480M |
| Change in inventories (cash effect) (JPY) | -1.44B | -1.13B | -592M | -548M | -1.17B | 260M | -1.29B | -668M | -1.85B | -4.54B |
| Change in payables (cash effect) (JPY) | 480M | -58M | 236M | -409M | -485M | 645M | 655M | 129M | -437M | -1.14B |
| Dividends paid (cash effect) (JPY) | -549M | -665M | -878M | -986M | -1.06B | -1.32B | -1.52B | -1.9B | -1.9B | -2.15B |
| Share buybacks (cash effect) (JPY) | -2.88B | 0.00 | 0.00 | — | 0.00 | -1.19B | 0.00 | 0.00 | -1.14B | -2.4B |
| Interest paid (cash effect) (JPY) | -131M | -115M | -89M | -117M | -145M | -233M | -231M | -326M | -557M | -805M |
| Income taxes paid (cash effect) (JPY) | -1.82B | -1.38B | -1.96B | -2.62B | -2.43B | -3.85B | -4.09B | -3.82B | -2.82B | -3.7B |
| Operating cash flow before change in receivables (JPY) | 5.49B | 7.92B | 7.78B | 8.81B | 11B | 13B | 13.7B | 12.2B | 14B | 12.3B |
| Free cash flow (OCF - PPE - intangibles) (JPY) | 1.46B | 3.05B | 1.82B | 2.24B | -1.25B | -3.23B | -226M | -9.47B | -3.54B | -4.66B |
| Income detail | ||||||||||
| Research and development expense (JPY) | 3.5B | 3.4B | 3.66B | 3.81B | 3.6B | 3.94B | 4.33B | 5.14B | 5.89B | 5.56B |
| ↳ 5y CAGR | +0.8% | +2.4% | +4.9% | +7.1% | +9.1% | +9.1% | ||||
| Total comprehensive income (JPY) | 2.35B | 3.04B | 3.26B | 3.8B | 6.82B | 8.02B | 8.46B | 8.15B | 8.12B | 13.2B |
| Comprehensive income to owners (JPY) | 2.35B | 3.03B | 3.26B | 3.8B | 6.82B | 8.02B | 8.46B | 8.15B | 8.12B | 13.2B |
| Provision for credit losses (JPY) | 51.1M | 69M | 58M | 97M | 74M | 23M | 50M | 518M | 96M | 74M |
| Credit cost ratio (credit losses / average receivables) (%) | 0.7% | 0.9% | 0.7% | 1.0% | 0.7% | 0.1% | 0.2% | 2.0% | 0.4% | 0.3% |
| Segments | ||||||||||
| Vision Care Business · Segment revenue (JPY) | — | — | — | — | 84.5B | 93.6B | 102B | 107B | 112B | 117B |
| ↳ YoY growth | +10.8% | +8.6% | +5.1% | +5.1% | +3.7% | |||||
| Vision Care Business · Segment operating income (JPY) | — | — | — | — | 12.6B | 15.3B | 17.5B | 15.5B | 17B | 17.5B |
| Reported | Jun 30, 2017 | Jun 27, 2018 | Jun 28, 2019 | Jun 25, 2020 | Jun 24, 2022 | Jun 24, 2022 | Jun 26, 2023 | Jun 27, 2024 | Jun 27, 2025 | Jun 25, 2026 |
Sign up to see institutional holdings
Sign UpPodcast Mentions
Sign up to see podcast mentions and sentiment
Sign UpFilings with EDINET (periodic reports, extraordinary reports, offerings, holding and buy-back reports), newest first, titles as filed in Japanese. The link opens the filing on EDINET. Press releases from the company's own website, newest first.
ニュース
========
2026年10月27日
メニコン、「1Caseプロジェクト」が「プラスチック新技術賞」を受賞
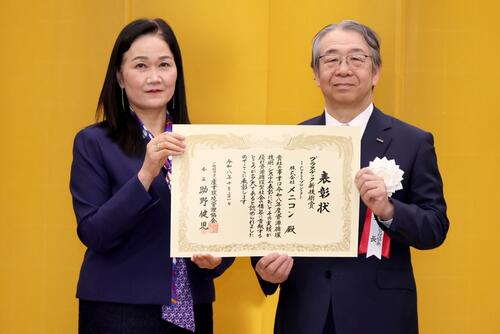 株式会社メニコンは、当社が推進する使用済みコンタクトレンズケースの回収・再資源化の取り組み「1Caseプロジェクト」が、一般社団法人産業環境管理協会の主催する令和8年度「資源循環技術・システム表彰」において、「プラスチック新技術賞」を受賞しましたことをお知らせいたします。
「資源循環技術・システム表彰」は、資源・エネルギー使用量の削減やリデュース・リユース・リサイクルの推進をはじめ、循環経済(サーキュラーエコノミー)への移行に貢献する先進的な技術・製品、事業・取組を表彰するものです。資源の有効利用を促進し、環境負荷の低減と循環型社会の形成に寄与することを目的としています。
今回受賞した「プラスチック新技術賞」は、今年度より新設された賞であり、先進的で高度な資源循環に係る技術・社会システムおよび製品開発の特長を有する事業・取組を顕彰するものです。
当社は、2024年よりコンタクトレンズの製造流通に使用するプラスチック:ポリプロピレン(PP)について、自社の製造端材および使用済みケースを対象に、高品質な再生材原料として循環利用するための技術・システムの構築に関する研究に取り組んで参りました。使い捨てコンタクトレンズ市場の拡大に伴い、コンタクトレンズケースの排出量増加が見込まれる中、回収率は使用量全体の数%にとどまり、またその用途も限定的であるため、その有効活用は業界共通の課題となっていました。
2024年より、メニコンは、内閣府が主導する「戦略的イノベーション創造プログラム(SIP)」の課題「サーキュラーエコノミーシステムの構築」の一環として「1Caseプロジェクト」の研究活動を実施しています。本プロジェクトにおいて、コンタクトレンズケースの再生利用に向け、使用済み材料の再生と良質な資源回収ルートの確保という科学的及び社会的な両面からの研究を進めています。
材料研究では、国内で流通する100種類を超えるコンタクトレンズブランドのケースを対象に、特性調査や強度試験を実施しています。さらに、放射光施設「ナノテラス」を活用して材料特性の差異が生じる原因を分析するとともに、自己組織化マップによって特性の傾向を体系化し、再生利用に必要な基礎データを蓄積しています。
コンタクトレンズケースは、無色・無臭で、ポリプロピレン(PP)単一素材からなることが特徴です。この特性を活かし、自動車用材料をはじめとする幅広い用途への活用可能性を確認しており、SIP課題で構築する「再生材データバンク」や環境省が進める「自動車向け再生プラスチック市場構築のための産官学コンソーシアム」においても、再生材原料として高い評価を得ています。
一方、回収面においては、将来的な社会実装を見据え、自社・販売店・自治体・企業・学校などにおける利用者が持参しやすい環境づくりや受入プロセスの設計・検証といった社会的研究に取り組んでいます。
今回、自社製品由来の使用済みコンタクトレンズケースを対象に、店舗等の接点を活用した受入スキームの検証を行うとともに、単一組成に近い高品質ポリプロピレン(PP)の再利用に向けた実証を進めた点が評価され、「プラスチック新技術賞」を受賞いたしました。今回の取り組みは運用の可能性検証を主目的とする限定的な段階ではあるものの、需要の大きいポリプロピレン(PP)を対象として将来的な回収から再利用までのシステム構築を見据えた点が高く評価されており、今後はさらなる手法の確立と事業化に向けて取り組んでまいります。
メニコンは、中期経営計画「Vision2030」のスローガン"新しい「みる」を世界に"のもと、資源循環をはじめとした環境負荷低減の取り組みを一層推進し、持続可能な社会の実現に貢献してまいります。
◆令和8年度資源循環技術・システム表彰について
一般社団法人産業環境管理協会 https://www.jemai.or.jp/
受賞紹介 https://www.cjc.or.jp/cjc_news/r08syshyo/r08_sys_hapyou2.pdf#page=9
◆1Caseプロジェクトについて
https://www.menicon.co.jp/campaign/1casepj/
関連情報


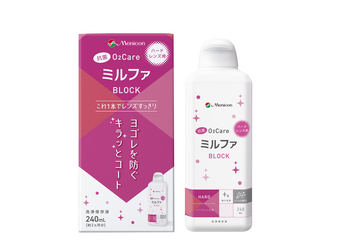
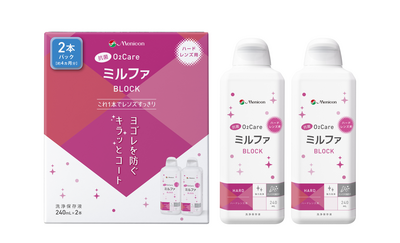
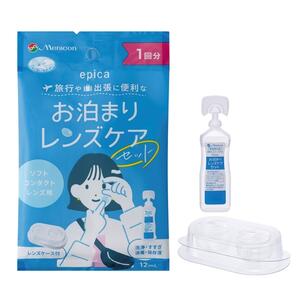
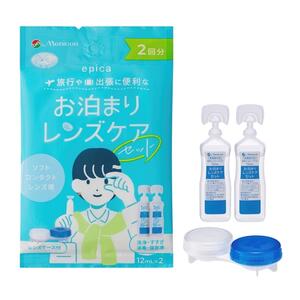
 * メニコンの商品サイト


© Menicon
























Prompts
Click prompts to add them under the company line, click again to take one out, then copy the result into your AI chat. Shared by Asian Century Stocks and Uncovered Thai Stocks. Thank you.
ETFs Holding Menicon Co., Ltd.
Exchange-traded funds whose newest published daily portfolio holds one of the company's listings, largest weight first.
| ETF | Weight in ETF | Shares | Market value | As of |
|---|---|---|---|---|
| DFIS | 0.04% | 211,501 | $ 2.537M | Nov 12, 2026 |
| AVDV | 0.03% | 412,900 | $ 5.028M | Nov 16, 2026 |
| AVDS | 0.03% | 8,900 | $ 108.387K | Nov 16, 2026 |
| DXIV | 0.02% | 4,100 | $ 49.179K | Nov 12, 2026 |
| AVSD | 0.02% | 6,000 | $ 73.07K | Nov 16, 2026 |
| DFIC | 0.01% | 144,725 | $ 1.736M | Nov 12, 2026 |
| AVDE | 0.01% | 161,500 | $ 1.967M | Nov 16, 2026 |
| DFAX | 0.01% | 64,200 | $ 770.079K | Nov 12, 2026 |
| DFSI | 0.01% | 5,800 | $ 69.571K | Nov 12, 2026 |
| DFAI | 0.00% | 72,782 | $ 873.02K | Nov 12, 2026 |