7747
Fiscal year ends June Quarters are offset from the calendar — Q1 is Jul–Sep

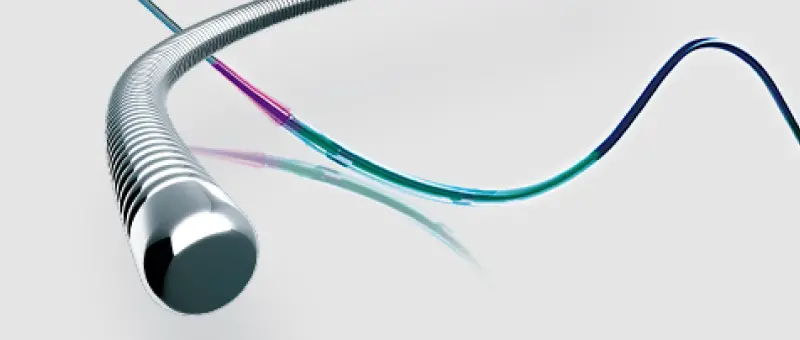
Asahi Intecc Co., Ltd. is a manufacturer of medical and industrial devices. The company operates two main business segments: Medical and Device. The Medical segment focuses on the development and manufacturing of minimally invasive treatment products, specifically guide wires and catheters for cardiovascular, peripheral, abdominal, and neurovascular applications. These products are sold to hospitals primarily through direct sales in Japan, the United States, France, Germany, and Italy, and via distributors in other regions. The Device segment involves the development and manufacturing of components for medical and industrial equipment, supplying domestic and international manufacturers. The company utilizes core technologies including wire drawing, wire forming, coating, and torque control to produce high-precision products from materials such as stainless steel, platinum, and titanium. Key subsidiaries include ASAHI INTECC THAILAND CO., LTD., ASAHI INTECC HANOI CO.,LTD., ASAHI INTECC USA, INC., and TOYOFLEX CEBU CORPORATION, which handle manufacturing and sales operations across Asia, the Americas, and Europe.

Summarised from the annual report, fiscal year ended Jun 2025

Industry Medical Devices Homepage asahi-intecc.co.jp
Sector Healthcare IR page asahi-intecc.co.jp
Tags
catheters, guide wires, minimally invasive surgery, cardiovascular, neurovascular, industrial components, wire drawing, coating technology, ASAHI INTECC THAILAND CO. LTD., ASAHI INTECC HANOI CO. LTD., ASAHI INTECC USA INC., Filmecc USA Inc., TOYOFLEX CEBU CORPORATION, ASAHI INTECC LATIN PROMOCAO DE VENDAS LTDA., ASAHI Medical Technologies Inc., ASAHI INTECC EUROPE B.V., ASAHI INTECC CIS LLC, ASAHI INTECC Deutschland GmbH, Rev.1 Engineering Inc., Pathways Medical Corporation, KARDIA S.R.L., NITTA M&T(THAILAND)CO. LTD., ELDORET HOSPITAL-ASAHI INTECC HEART CENTRE
Press page asahi-intecc.co.jp/news

Metrics

Valuation  
Market cap ¥ 883.557B
Market cap (USD) $ 5.522B
P/E 27.61
PEG 0.79
P/BV 5.07
P/S 6.08
P/OCF 22.04
P/FCF 28.35
Dividend yield 1.4%
Turnover / mcap —
Returns  
ROE 19.7%
ROI 17.7%
ROIC 18.0%
Profit margin 22.1%
Growth  
Revenue growing Yes
Profits growing Yes
Revenue up 3y Yes
Revenue up 5y Yes
Earnings growth 3y (net profit CAGR) 34.8%
Quality  
Profitable Yes
Margin expanding Yes
Buying back stock Yes
Diluting (TTM) No
Debt/Equity —
Podcast bulls (TTM) Sign up
Podcast bears (TTM) Sign up
Podcast sentiment (TTM) Sign up
Podcast sentiment % (TTM) Sign up
News sentiment (TTM) 29
Quality score 38.9%
Insiders  
Buys, 1w Sign up
Buys, 1m Sign up
Buys, 1y Sign up
Sells, 1w Sign up
Sells, 1m Sign up
Sells, 1y Sign up

Sign up to see this company's insider trades

Figure FY 2026 FY 2025 FY 2024 FY 2023 FY 2022 FY 2021 FY 2020 FY 2019 FY 2018 FY 2017 FY 2016 FY 2015 FY 2014 FY 2013 FY 2012
Revenue 145.419B 120.025B 107.547B 90.101B 77.748B 61.507B 56.546B 57.217B 50.124B 42.71B 39.511B 35.323B 28.145B 19.969B 14.852B
Net profit 32.075B 12.737B 15.808B 13.106B 10.857B 9.984B 9.179B 11.238B 10.042B 7.725B 6.907B 5.829B 4.36B 3.004B 967.979M
Free cash flow 31.163B 31.965B 24.164B 6.425B 8.742B -2.568B 2.246B 3.146B 3.851B 5.661B 4.924B 3.111B — — —

Figure FY 2026 FY 2025 FY 2024 FY 2023 FY 2022 FY 2021 FY 2020 FY 2019 FY 2018 FY 2017 FY 2016 FY 2015 FY 2014 FY 2013 FY 2012
Share price 3.8K 2.283K 2.256K 2.811K 2.049K 2.656K 3.066K 2.654K 4.191K 5.111K 4.974K 4.192K 2.08K 1.212K 524.8
Price performance 12m 0.66 0.01 -0.2 0.37 -0.23 -0.13 0.16 -0.37 -0.18 0.03 0.19 1.02 0.72 1.31 —

Filed figures

Figure Jun 2017 Jun 2018 Jun 2019 Jun 2020 Jun 2021 Jun 2022 Jun 2023 Jun 2024 Jun 2025 Jun 2026
Balance sheet detail
Trade receivables (JPY) 8.57B 9.03B 10.1B 8.73B 11.7B 29.6B 31.1B 37.3B 33.6B 39.9B
↳ YoY growth +16.7% +5.4% +12.1% -13.8% +33.9% +153.1% +5.1% +19.9% -9.9% +19.0%
↳ 5y CAGR +3.8% +9.7% +28.1% +28.1% +29.8% +30.9% +27.9%
Borrowings, current (JPY) 4.77B 2.89B 3.16B 2.99B 4.59B 5.82B 10.4B 5.62B 2.39B 2.36B
Borrowings, non-current (JPY) 3.48B 3.31B 2.86B 4.93B 3.45B 6.36B 3.89B 1.09B 6.63B 4.28B
Lease liabilities (JPY) — — — — — — — 1.5B 2.08B —
Cash and deposits (JPY) 20B 19.2B 18.8B 18.6B 21.4B 32.3B 34.9B 35.7B 54.2B 64.3B
Intangible assets (JPY) 654M 751M 4.54B 5.27B 6.26B 19.4B 18.4B 17B 5.6B 5.12B
Net debt (borrowings + leases - cash) (JPY) -11.7B -13B -12.8B -10.6B -13.3B -20.1B -20.6B -29B -43.1B -57.6B
Cash flow detail
Operating cash flow (JPY) 10.3B 11.7B 11.7B 11.2B 8.92B 17.3B 19.1B 34.7B 40.5B 40.1B
Purchases of property, plant and equipment (JPY) -4.6B -7.87B -8.57B -8.92B -9.91B -7.98B -12.3B -9.88B -8.1B -8.38B
Purchases of intangible assets (JPY) -280M -352M -695M -802M -1.58B -579M -422M -667M -482M -549M
Change in receivables (cash effect) (JPY) -996M -530M -1.07B 1.29B -2.97B -1.15B -86M -2.68B 1.06B -1.64B
Change in inventories (cash effect) (JPY) -123M -2.67B -2.24B -3.69B -2.39B -3.26B -2.79B 4.46B 3.54B -1.53B
Change in payables (cash effect) (JPY) 68.4M 21.8M 309M 5.94M -199M 1.19B -256M -973M 190M 2.27B
Dividends paid (cash effect) (JPY) -1.9B -1.96B -2.51B -2.81B -2.3B -2.99B -3.26B -3.93B -5.53B -6.53B
Share buybacks (cash effect) (JPY) — — — — — — — 0.00 -4.45B -10.6B
Interest paid (cash effect) (JPY) -43.4M -50.4M -60M -83.3M -133M -162M -261M -167M -248M -134M
Income taxes paid (cash effect) (JPY) -2.3B -2.92B -3.91B -3.1B -3.83B -3.44B -4.9B -5.32B -6.21B -9.17B
Operating cash flow before change in receivables (JPY) 11.3B 12.2B 12.8B 9.88B 11.9B 18.5B 19.2B 37.4B 39.5B 41.7B
Free cash flow (OCF - PPE - intangibles) (JPY) 5.38B 3.5B 2.45B 1.44B -2.57B 8.74B 6.43B 24.2B 32B 31.2B
Income detail
Research and development expense (JPY) 4.5B 5.05B 6.04B 6.58B 7.52B 8.87B 9.72B 11.7B 12.2B 13.4B
↳ 5y CAGR +15.3% +14.1% +14.5% +14.0% +14.1% +13.2% +12.2%
Total comprehensive income (JPY) 9.49B 10.6B 11.3B 9.25B 10.8B 17.3B 16.3B 22.9B 9.38B 40.1B
Comprehensive income to owners (JPY) 9.49B 10.6B 11.3B 9.25B 10.8B 17.2B 16B 22.7B 9.32B 39.9B
Provision for credit losses (JPY) 2.05M 3.12M 8.55M 5.92M 9M 113M 55M 269M 58M 198M
Credit cost ratio (credit losses / average receivables) (%) 0.0% 0.0% 0.1% 0.1% 0.1% 0.5% 0.2% 0.8% 0.2% 0.5%
Reported Sep 27, 2017 Sep 28, 2018 Sep 30, 2019 Sep 30, 2020 Sep 30, 2021 Sep 30, 2022 Sep 29, 2023 Sep 24, 2025 Sep 24, 2025 Sep 28, 2026

Sign up to see institutional holdings

Sign Up

Podcast Mentions

Sign up to see podcast mentions and sentiment

Sign Up

ラジオ番組提供開始のお知らせ Bull 0 Bear 0 Routine

2026/10/07

  • その他

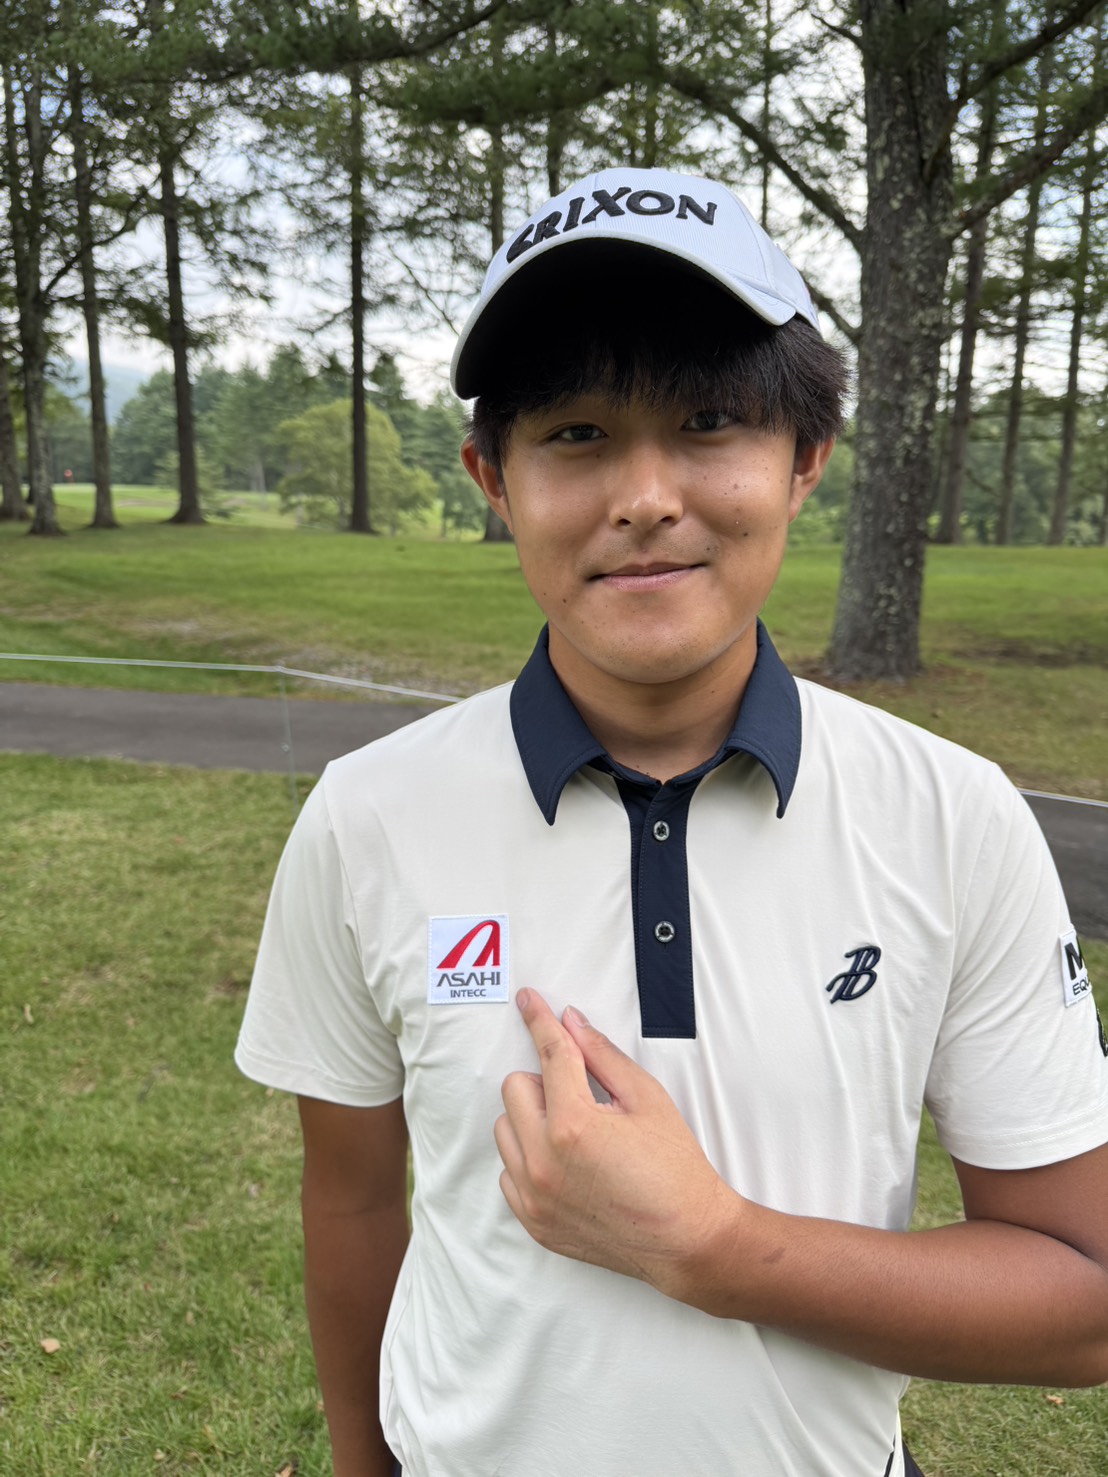
当社は、首都圏を放送エリアとするBAYFMにて放送中のFM番組「Beautiful DAY 」内のコーナー

「朝日インテック Dream Together」への提供を 2026年10月4日(日)より開始いたしましたので、ご案内いたします。

本コーナーは、現在FM COCOLO(大阪)およびZIP-FM(名古屋)で放送されている「朝日インテック Dream Together」と同様に、前向きな気持ちになれる楽曲や言葉の紹介、ゲストとのトークを通じて「夢に向かって頑張る人を後押しする」番組です。

ぜひお聴きください。

【番組放送局・スケジュール】
BAYFM(東京):毎週日曜日 17:00~17:10 (「Beautiful DAY 」 16:00-19:00 内)
           https://program.bayfm.co.jp/ryota/ (上記Beautiful DAYにリンク)

ニュースリリース一覧に戻る

Information

朝日インテック株式会社

© 2024 ASAHI INTECC CO., LTD.

Prompts

Asahi Intecc Co., Ltd. (ticker 7747), listed in Japan.

ETFs Holding Asahi Intecc Co., Ltd.

ETF Weight in ETF Shares Market value As of
DIHP 0.12% 321,000 $ 7.753M Nov 12, 2026
AVSD 0.05% 7,600 $ 197.375K Nov 16, 2026
DXIV 0.04% 4,000 $ 96.61K Nov 12, 2026
DFIC 0.03% 196,700 $ 4.751M Nov 12, 2026
DFAI 0.03% 193,400 $ 4.671M Nov 12, 2026
DFAX 0.02% 83,500 $ 2.017M Nov 12, 2026
AVDE 0.01% 88,000 $ 2.285M Nov 16, 2026