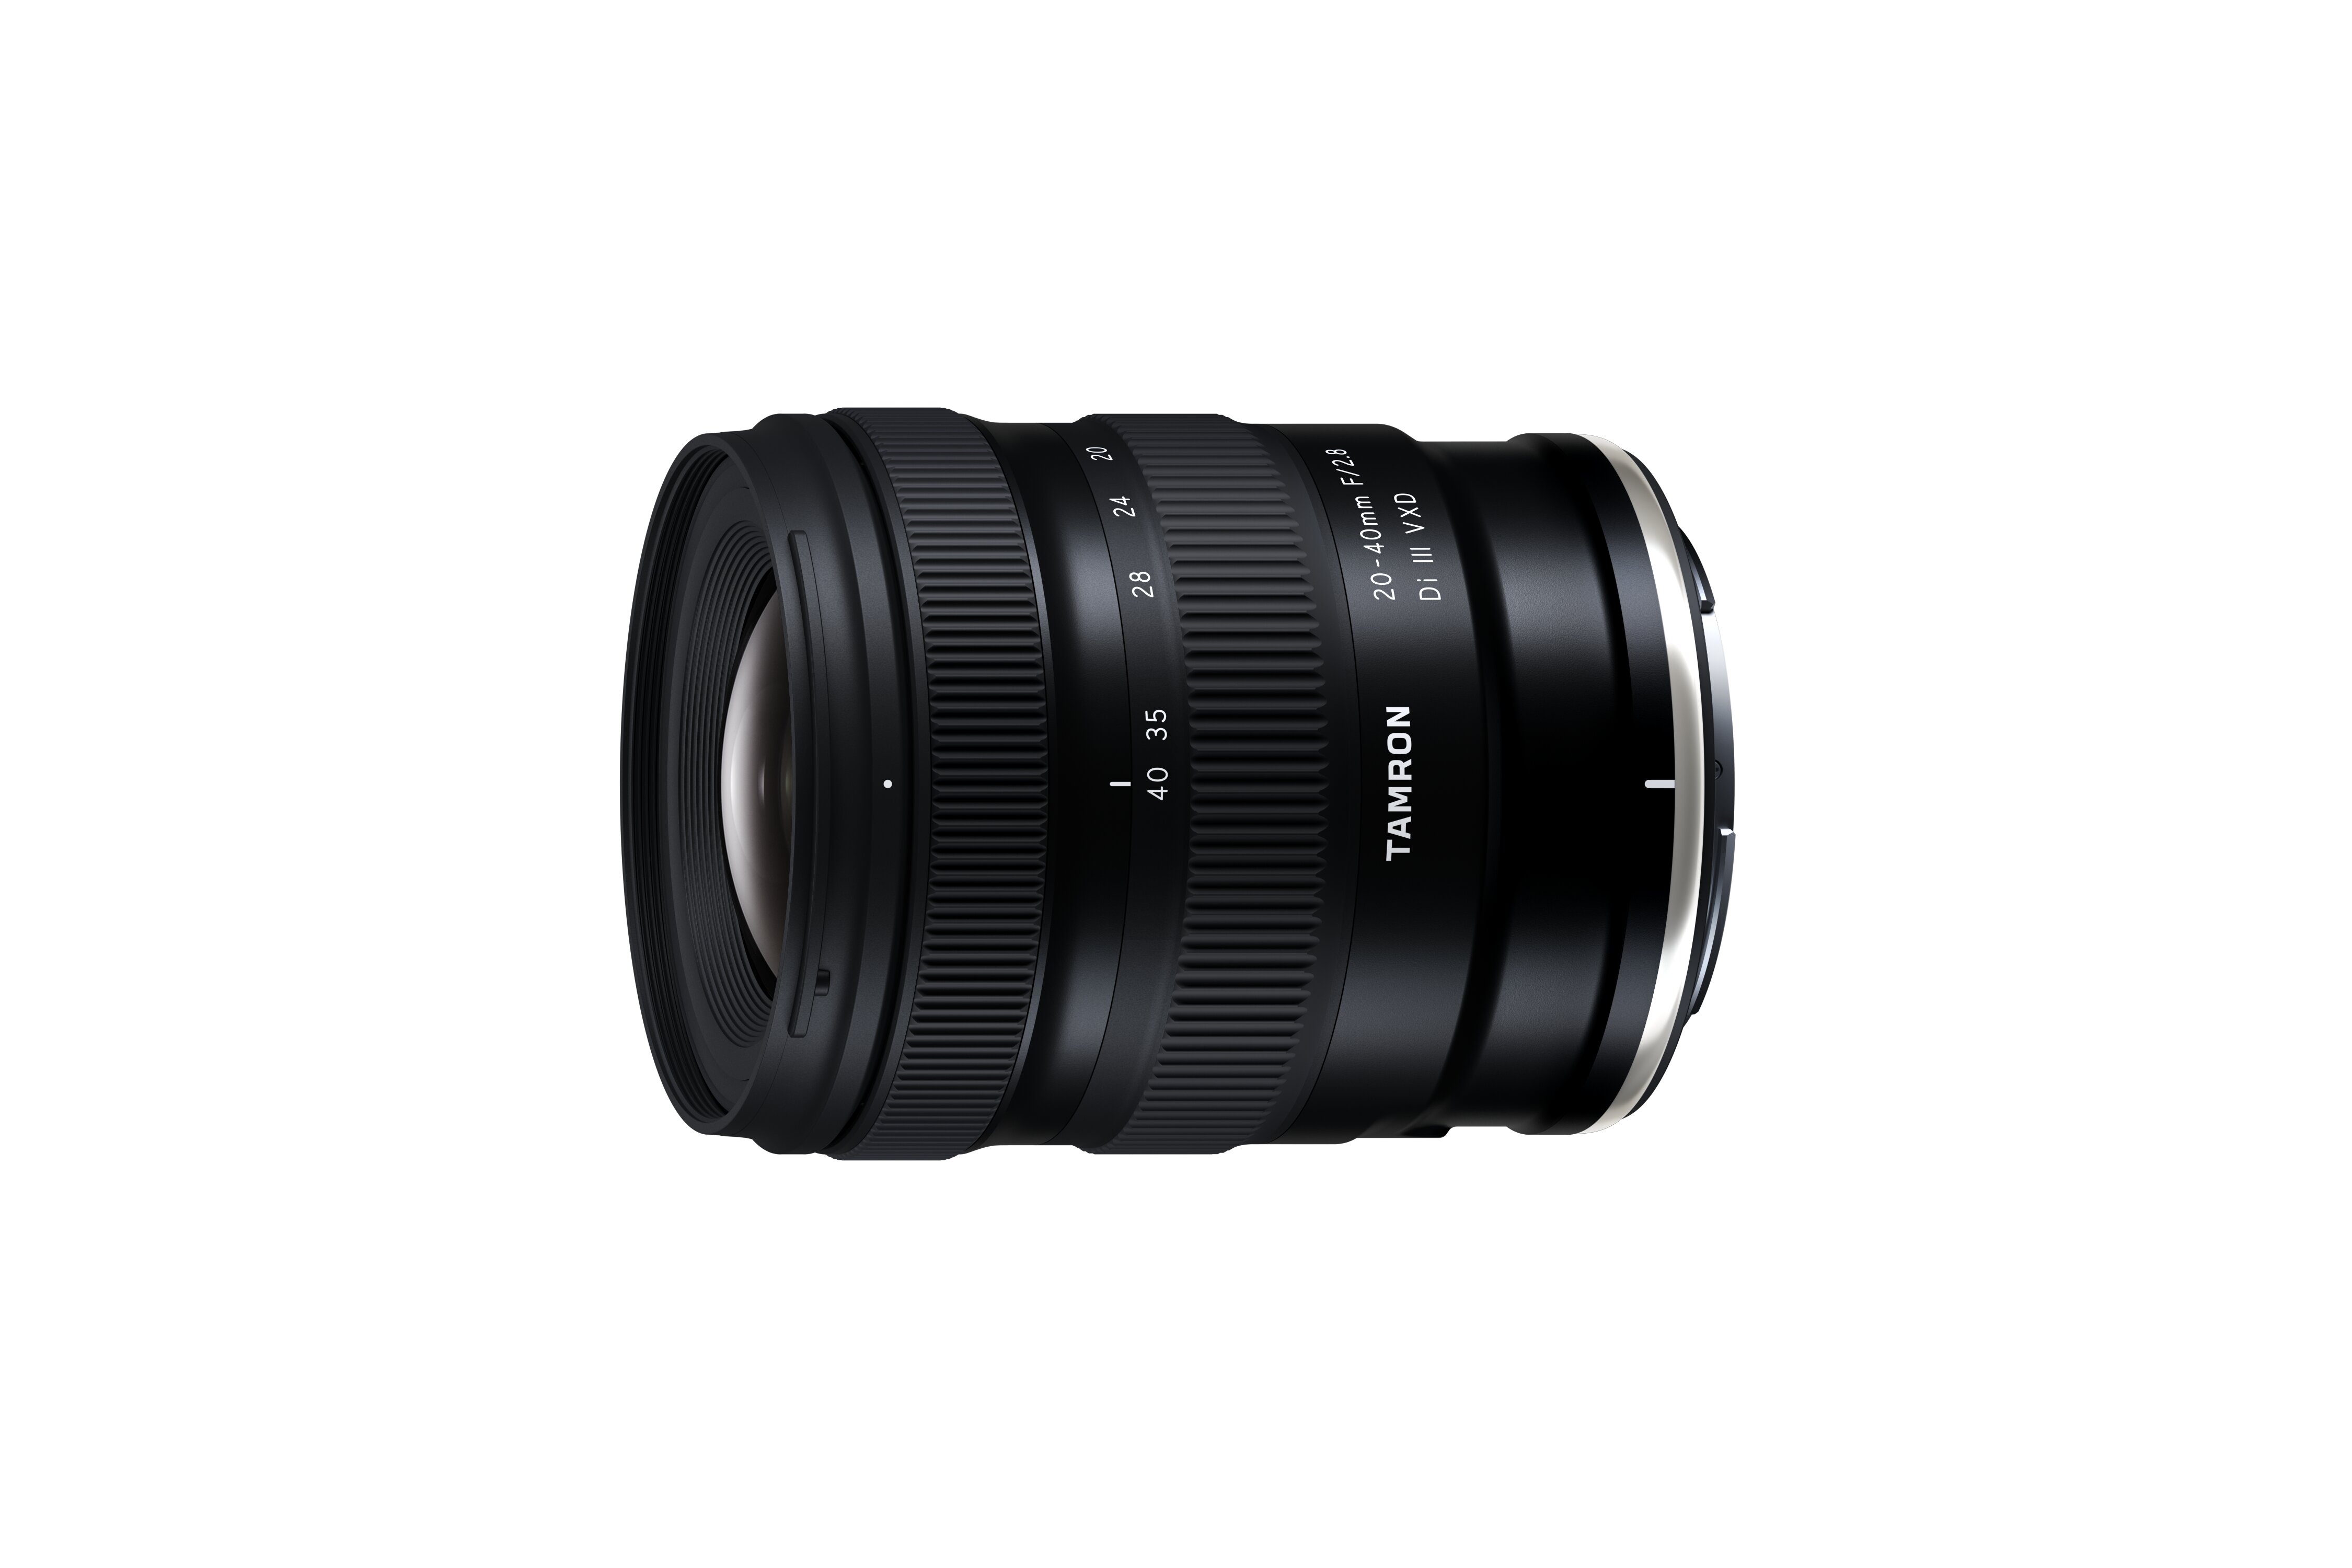
2nd Quarter FY2026 Financial Results August 7, 2026 Tamron Co., Ltd. (Code: 7740) Table of Contents P 03~ Ⅰ. Long-Term Vision & Next Medium-Term Management Plan "Value Up29" Ⅱ. 1st Half FY2026 Financial Result P 14~ Ⅲ. Financial Forecast FY2026 P 2…
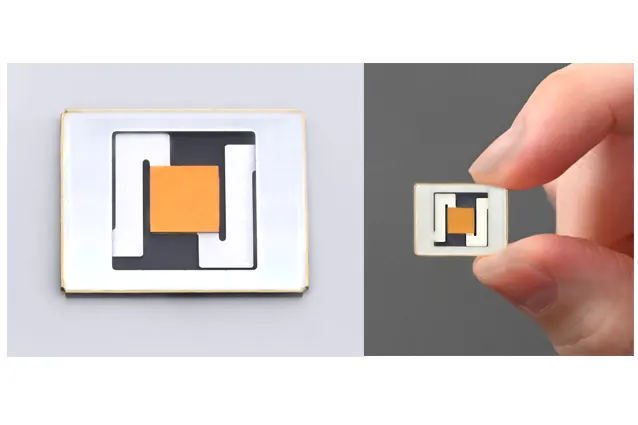
2nd Quarter FY2026
Financial Results
August 7, 2026
Tamron Co., Ltd. (Code: 7740)
Table of Contents
P 03~
Ⅰ. Long-Term Vision &
Next Medium-Term Management Plan "Value Up29"
Ⅱ. 1st Half FY2026 Financial Result
P 14~
Ⅲ. Financial Forecast FY2026
P 24~
Ⅳ. Reference Data
2
─
Copyright © Tamron Co., Ltd. All rights reserved.
P 30~
Ⅰ. Long-Term Vision & Next Medium-Term Management
Plan "Value Up29"
Ⅰ-1. Revised Long-Term Quantitative Targets & Strategic Position of the Next MTMP
Future Vision
Move toward the sustainable enhancement and
maximization of corporate value
by transforming from a lens manufacturer into a
comprehensive optical and sensing solutions company.
Commercialization of “Capture, Measure, and Connect”
technologies, solidifying the foundations for growth to
realize the Long-term Vision for 2035
Announced in
Feb. 2026
Next Medium-term
Management Plan
“Value Up29”
Medium-Term
Management Plan
“Vision23”
2021-2023
4
─
Optimized the portfolio
Development & grew new business
Established functional strategies
Developed human resources &
activated the organization
Medium-Term
Management Plan
“Value Creation26
ver2.0”
2024-2026
Deepening the optimization of business
portfolios
Creating and nurturing new businesses
Strengthening the shareholder return policy
Implementing the strategy for sustainability
Copyright © Tamron Co., Ltd. All rights reserved.
2027-2029
- New Quantitative Targets -
Maintaining an ROE of 20% or more
Shift to a growth strategy driven by the dual engines
of organic and inorganic strategies
Establish a new business portfolio
Achieve the social implementation and monetization
of new businesses, and build a business
development framework
Drive reforms to business management methods
Advance strategy-linked human capital management
Net sales: 200.0 billion yen or more
New businesses: 20.0 billion yen or more
- Previous quantitative targets -
A company with net sales of 100.0 billion yen
Net sales from new businesses: 10.0 billion yen
Driving Sustainable Corporate Value Growth
Ⅰ-2. Major Targets under the Next Medium-term Management Plan (MTMP)
To sustainably achieve an ROE of 20% or more by 2029, we will resolutely manage the balance sheet through continuous profit growth, aggressive growth
investments, and enhanced shareholder returns. If ROE of 20% or more is achieved, DOE is projected to be 12% or more with a payout ratio of 60%.
Capital efficiency target
ROE: 20% or more
(maintaining this level by 2029)
Net Sales and Profit
Shareholder Return
Net sales (2029)
Payout ratio of 60% or DOE of 8%,
whichever is higher (from 2027 onward)
120.0 billion yen or more
Operating income (2029)
25.0 billion yen or more
( If ROE of 20% or more is achieved, DOE is projected
to be 12% or more with a payout ratio of 60%)
Additional Returns:
approx. 18.0 billion yen
Capital Structure
Shareholders’ Equity Ratio
approx. 75%
(Target for 2029)
(to be achieved by the end of the period of the next
Medium-term plan)
Control the balance sheet and enhance shareholder return after accelerating growth investments to achieve the Long-term Vision.
Reference: Business targets under the current Medium-term Management Plan (Value Creation26 ver2.0)
ROE
exceeding 16%
5
─
Copyright © Tamron Co., Ltd. All rights reserved.
Net sales of 95.0 billion yen or more,
operating income of 20.5 billion yen or more
Payout ratio of 40% (with a DOE floor of 3%)
Total return ratio of 60%
Ⅰ-3. Roadmap for Achieving the ROE Target
2025 Results
ROE
14.0 %
166
16.6
Operating Income
Shareholders'
Equity Ratio
Liquidity on Hand
6
─
Current Medium-term
Management Plan Targets
ROE of 20% or more
16% or more
20.5
205
billion
億円
yen
億円
billion
yen
81%
2029 Targets
Maintaining a sustainable
Strengthening Earning Power
• Profitable Growth: Increase net sales while maintaining high profitability
• Business Transformation: Position photo business as a cash cow;
accelerate growth in industrial markets and drive new business creation
• Strategic Allocation: Optimize resources in light of growth potential and
profitability
To the 70s%
25.0
250
billion
億円以上
yen
or more
Around 75%
Capital Structure:
Optimized to sustainably achieve an ROE of 20% or more
5 months
of sales
Copyright © Tamron Co., Ltd. All rights reserved.
Around
3か月程度
3か月程度
3 months
• Dividend Upgrade: Payout ratio of 60% or DOE of 8%, whichever is
higher
Maintain
• Additional Returns: Approx. 18.0 billion yen, geared toward the target
3か月程度を維
3か月程度
around
equity ratio
持
3 months
を維持
Ⅰ-4. Business Strategy
Profitable Growth: Increase net sales while maintaining high profitability (by transforming the photo business into a cash cow and driving breakthrough growth in
industrial markets)
Strategic Allocation: Build a sustainable growth foundation by optimizing resource allocation based on the maturity, growth potential, and profitability of each business
Business portfolio transformation
- Entering the healthcare and nature-positive markets by
developing light sources, measuring instruments, etc. in addition to
New
supplying dedicated lenses
- Creating new business opportunities using image recognition and
domains
sensing technologies and looking ahead to next-generation markets,
including the physical AI market
Net Sales Growth Rate (%)
Camera modules
- Enhancing products
for manufacturers in
developed countries
- Establishing camera
Surveillance
technologies
- Entering businesses
targeting agriculture
and
livestock, defense
and aerospace, and
other industries
Healthcare
components
- Enhancing the lineup of products for rigid
endoscopes
- Enhancing items such as notch filters for
surgical microscopes
Automotive
lenses
Withdrawal
─
Operating Income Margin (%)
Copyright © Tamron Co., Ltd. All rights reserved.
Photographic Products Business: CAGR of 5% or more
Photographic
lenses
- Releasing at least ten own-brand products every year to
accelerate the shift to the multi-mount lens business
- Making the OEM products business a stable business by
developing more models, finding new customers, etc.
Expanding and creating such businesses by enhancing the profitability of highgrowth businesses and investing aggressively in highly profitable businesses and
new businesses
Establishing next-generation business pillars to build the foundations for
the sustainable growth of business
Effectively investing to achieve stable growth while maintaining high profitability
Making progress in turning the business into a revenue base supporting
the next generation of investments
FA, etc.
DSC/VC/
Video Conferencing
lenses
7
Businesses Targeting Industrial Customers:
CAGR of 10% or more
35%
or more
71%
2025
60s%
2029 (forecast)
Photographic Products
50%
or more
40s%
2035 (forecast)
Businesses for Other Industries
Ⅰ-5. Financial Strategy (1): Cash Allocation
(billion yen)
Cash Optimization
Reduce cash and deposits to around 3 months of
sales
Debt Utilization
Leverage debt strategically in light of our
financial standing
Cash allocation in the period of the next
Medium-term plan (2027 to 2029)
Vs. current MTMP: Investing at least
16.0
Cash Optimization
15.0
30.0
R&D Investment
Debt Utilization
20.0
Capital Investment
Operating Cash Flows
Generate stable CF by strengthening earning
power to sustainably achieve an ROE of 20% or
more by 2029
21.0
89.0
Reference: Targets under Value Creation26 ver2.0
Cash Opt. 8.0
Debt Util. 7.0
31.0
Dividends
Capital Inv.
17.5
Operating CF
69.5
Strategic Inv.
18.0
18.0
Shareholder
Returns
26.5
Cash Inflows
8
─
Strategic Investments
(M&A etc.)
Operating Cash
Flows (Before R&D
expenses)
R&D Inv.
22.5
Cash Outflows
Copyright © Tamron Co., Ltd. All rights reserved.
Additional Returns
Cash Inflows
Accelerating growth investments
Cash Outflows
1.2 times more
R&D Investment
Maintain R&D expenses at 9% or more of net sales, allocating
20% to new technologies and business creation
(including in cutting-edge technology domains such as AI and nextgeneration optical technologies)
Expand investments in human capital
Capital Investment
Focus on increasing profit in existing businesses , allocating 30%
to growth fields and new business creation.
Strategic Investments (M&A, etc.)
Establish an investment framework for non-continuous growth,
strengthening entry into next-generation domains. (AI, healthcare,
nature-positive, etc.)
※ Any unused funds will be partially carried over to the next plan, with the
remainder used for shareholder returns.
※ M&A will be executed considering both growth potential (PER) and
capital efficiency (ROE).
Dividends
Determine dividend amounts based on a payout ratio of 60% or
a DOE of 8%, whichever is higher (from the next Medium-term
Management Plan onward).
Additional Returns
Execute approx. 18.0 billion yen in additional returns by the end of the
next plan , aimed at achieving a target shareholders' equity ratio of
around 75%
Ⅰ-5. Financial Strategy (2): Shareholder Returns
Dividend Upgrade: Increase dividends to ensure more stable and long-term profit returns.
Additional Returns: Execute approx. 18.0 billion yen in additional returns by the end of 2029, targeting a shareholders' equity ratio of around 75%.
Change in Shareholder Return
Return Policy
Dividend
Dividend Upgrade:
Payout ratio of 60% or a DOE of 8%, whichever is higher
(from 2027 onward).
( If ROE of 20% or more is achieved, DOE is projected to be 12% or
more with a payout ratio of 60%)
Dividend payout ratio
Additional Returns (Approx. 18.0 Billion Yen)
:Consider share repurchases or dividend
payments in light of market trends.
(Dividends: yen/share)
(Payout ratio: %)
2026 Dividend Revision:
Increased dividend to achieve a
60% payout ratio (Revised from
the initial 37 yen to 51 yen).
Additional Returns:
Approx. 18.0 billion yen by the end of the next MTMP,
aimed at a shareholders' equity ratio of around 75%.
2022
9
─
Copyright © Tamron Co., Ltd. All rights reserved.
2023
2024
2025
2026
(forecast)
2027
(forecast)
2028
(forecast)
2029
(forecast)
Ⅰ-6. Sustainability
Sustainability Drive: Advance sustainability initiatives to enhance long-term corporate value and ensure the effectiveness of the next Medium-term Management Plan.
Strategy & Framework: Strengthen our sustainability strategy and implementation framework, including a comprehensive review of materiality.
E
nvironment
S
ocial
G
10 ─
overnance
Climate Change & Circular Economy: Reduce GHG emissions and execute circular economy measures toward a resource-recycling society.
• Scope 1 and 2: 27% reduction by 2029 (compared to 2015)*
- 2030: 30% reduction, 2035: 45% reduction, 2050: Zero emissions
• Scope 3: Launch reduction initiatives
Biodiversity & Nature Positive: Conserve biodiversity and contribute to a nature-positive future in harmony with nature.
• TNFD Alignment: Advance assessments and information disclosure based on the TNFD framework.
• Business Creation: Leverage optical technologies to create new businesses in the nature-positive market.
Human Capital Evolution: Advance strategy-linked human capital management.
• Talent Portfolio: Build a dynamic portfolio and expand investments to maximize human capital value.
• Intellectual Capital: Increase competitiveness by embracing D&I of knowledge/experience, and visualizing/elevating intellectual capital.
• DE&I & Re-skilling: Evolve DE&I practices while providing and supporting re-skilling/re-learning opportunities.
• Employee Alignment: Introduce employee stock compensation to align shared value and strengthen talent retention for mid- to long-term
corporate value.
Corporate Culture & Engagement: Foster a culture of taking on transformation and strengthen engagement through non-linear thinking and
open innovation.
Board Effectiveness: Strengthen the Board of Directors for effective supervision of the Long-term Vision and the Medium-term Management Plan.
• Increase independence, review the skills matrix, and enhance diversity (women, outside executives, etc.)
Incentive Alignment: Revise the compensation system to drive the achievement of the Medium-term Management Plan.
Agile Governance (CxO System): Introduce a CxO system to delegate authority, accelerate decision-making, and advance company-wide
strategic execution.
Copyright © Tamron Co., Ltd. All rights reserved.
Ⅰ-7. To Increase TSR: PBR Logic Tree
Element
Direction of actions
Higher TSR
Outperform relative TSR
to deliver enhancement
⇑
Higher BPS
×
Profit Growth
Sustainably maintaining an ROE of 20% or more
Growth in net sales and profits with high profitability maintained
Net sales target under the Long-term Vision: 200.0 billion yen or more
Net sales target under the next Medium-term plan (up to 2029):
120.0 billion yen or more
Operating income target: 25.0 billion yen or more
Higher ROE
Enhancing Capital
Efficiency: Target
sustainable ROE of 20%+
by 2029
Capital Efficiency
Optimization
Higher PBR
Drive medium- to
long-term corporate
value creation
Driving Growth
Expectations: Lower the
cost of capital
Copyright © Tamron Co., Ltd. All rights reserved.
Reducing the shareholders' equity ratio 2025: 81% 2029: 75% (rough target)
Optimizing liquidity on hand Rough target: Around 3 months of sales by 2029
Disclosing cash allocation policy (3-year period of the next Medium-term plan)
Cash Inflows (Operating CF): 89.0 billion yen (before deduction of R&D expenses)
Cash Outflows: Investments: 71.0 billion yen, Shareholder returns: 49.0 billion yen
Build a Growth Story
Investments for organic growth plus M&A of 21.0 billion yen for non-continuous growth
(a portion of unused funds is used for shareholder returns)
Implementing M&A activities in consideration of the activity's effects on not only growth
potential (PER) but also return on equity (ROE)
Strengthen
Shareholder Returns
Payout ratio of 60% or DOE of 8%, whichever is higher
(rough DOE target of 12% or more in light of the ROE target)
Additional returns of approx. 18.0 billion yen to achieve a shareholders' equity ratio of around
75%
Considering the introduction of shareholder benefits: Benefits based on common bonus points
Enhance
Sustainability &IR
Reducing GHG emissions, taking CE measures, and contributing to a society in harmony with
nature
Advance strategy-linked human capital management
Strengthening the functions of the Board of Directors, revising the compensation system, and
introducing a CxO system
Holding IR briefing sessions about 4 times a year
Higher PER
11 ─
Policy on specific initiatives
Ⅰ-8. Long-Term Vision : Announced in February 2026
Capture, Measure, Connect
—Creating a Healthier Future for People and Nature
Having refined light-capturing technologies while delivering emotion and reassurance to society for more than 75 years,
TAMRON will steer that legacy and those technologies toward a future of beneficial coexistence between people and nature.
Our mandate: to capture and measure an unseen world, and connect it with solutions.
Capturing and measuring information about the body, such as the condition of cells and blood, connects with advances in medicine and
healthcare.
Capturing and measuring changes in ecosystems, such as our forests, water quality and the air we breathe, connects with activities to restore
a rich natural environment.
To achieve this, we will connect our accumulated optical technologies with sensing and analysis technologies, taking those combined
capabilities to the next level.
To us at TAMRON, “to connect” means to bring together diverse types of value that will give rise to new possibilities.
It means forging connections between people, between companies,
and between technologies and sensibilities, connecting people with nature, and connecting the present with the future.
As a comprehensive optical and sensing solution provider, we will champion a beneficial coexistence between people and nature,
and secure the future of a fulfilling society that offers joy, emotion and reassurance.
12 ─
Copyright © Tamron Co., Ltd. All rights reserved.
Ⅰ-9. A Comprehensive Optical and Sensing Solutions Company
clarification
Transforming from an optical manufacturer specializing in lenses into a company that creates the very systems
that make it possible to solve social issues using the power of light and that proposes them directly to customers
A comprehensive optical and
sensing solutions company
Optical manufacturer
specializing in lenses
— Supplying optical systems and services —
— Supplying components —
Providing devices which solve issues using the power of light
Providing components that capture light
House-brand interchangeable lenses and
interchangeable lenses as OEM products
Supplying optical lenses intended for use in a more
diverse range of industries
We will supply optical systems featuring advanced
sensing technologies, AI/image processing technologies,
etc. that are vertically integrated with optical lenses, as
well as associated services, to industrial customers.
House-brand interchangeable lenses and interchangeable
lenses as OEM products
Supplying optical lenses for industries, including those for
monitoring, FA, automotive, and medical applications
Sensing systems for
physical AI
13 ─
Copyright © Tamron Co., Ltd. All rights reserved.
Systems for bio sensing
Systems for
environmental sensing
Ⅱ. 1st Half FY2026 Financial Result
Ⅱ-1. Summary
Operating Environment
Economic Trend
Persistent geopolitical risks and U.S. trade policies slowed global growth.
Business
Weaker JPY than assumed; tailwind for both sales and profits.
Environment
High material costs and rising global labor expenses increased cost pressures.
Market Conditions
Interchangeable-Lens Camera/ Interchangeable Lens Markets:
Units decreased; value grew via shift to high-value mirrorless & FX tailwinds
Surveillance & FA Markets:
Surveillance solid on high-res demand in developed markets; FA recovery sustained.
Automotive Camera Market:
Growth trend maintained, fueled by high-end sensing demand from expanding ADAS adoption.
1H Performance Highlight
Net Sales (+4% YoY): Double-digit growth in industrial segments (Surveillance/FA & Mobility/Healthcare) offset sharp drops in Photo OEM.
Photographic Products
• OEM: sales dropped ~20% due to soft sales of specific customer models continuing from 2H FY25;
• Own-Brand: Sales grew overall despite regional performance mix.
Surveillance/FA & Mobility/Healthcare: Both industrial segments delivered double-digit top-line growth, fueled by robust market demand and ongoing sales/R&D expansion.
Operating Profit (-17% YoY): Squeezed by lower revenue in high-margin Photo OEM, material cost inflation, and higher R&D and labor costs.
Vs. Forecast: Net sales beat plan on strong industrial demand; Operating profit met targets by absorbing cost pressures.
Topics
Business Topics
IR Topics
Jan.: Investment in Light Touch Technology, developer of the world’s 1st non-invasive
blood glucose sensor.
Feb.: Refreshed Long-Term Vision (qualitative goals).
トピック
Jun.: Successfully commercialized world's 1st metasurface NIR light source.
Jun.: Updated Long-Term Vision numerical targets and established the outline for the
next MTMP, "Value Up29.“
Jun.: Announced the launch of the new 17-70mm F/2.8 (Z/RF mounts), marking our 3rd
Canon RF mount lens.
Jun.: Under "Value Up29," announced new return policy to boost capital efficiency;
raised FY26 dividend forecast (¥37 ➔ ¥51).
15 ─
Copyright © Tamron Co., Ltd. All rights reserved.
Ⅱ-2. Consolidated Results
Net Sales (Up): Despite continued weak OEM orders in Photo, overall revenue increased as performance in the other two segments significantly beat plan.
Gross Profit & Margin (Squeezed): Margins declined due to lower high-margin Photo sales and inflation in material, utility, and shipping costs driven by Middle East tensions, which cost-reduction
efforts could not fully absorb.
Operating Profit (Down): Declined due to higher SG&A from expanded R&D investments and inflation-driven labor cost increases. (Also, Below Forecast)
(¥ million)
Q2 FY25
Actual
Q2 FY26
Actual
Change vs. FY25
Value
%
(¥ million)
1H FY25
Actual
1H FY26
Fcst.
1H FY26
Actual
Change vs. FY25
Value
%
vs. FY26 Fcst.
Value
%
Net Sales
22,263
24,795
+2,532
+11.4%
Net Sales
41,714
41,200
43,281
+1,566
+3.8%
+1,881
+4.5%
Gross Profit
10,006
9,920
-86
-0.9%
Gross Profit
18,917
-
18,130
-787
-4.2%
-
-
Gross Margin
44.9%
40.0%
-4.9pts
-
Gross Margin
45.3%
-
41.9%
-3.4pts
-
-
-
SG&A Expenses
5,039
5,673
+634
+12.6%
SG&A Expenses
9,714
-
10,441
+726
+7.5%
-
-
Operating Income
4,967
4,247
-720
-14.5%
Operating Income
9,203
7,700
7,689
-1,514
-16.5%
-10
-0.1%
Operating Margin
22.3%
17.1%
-5.2pts
-
Operating Margin
22.1%
18.6%
17.8%
-4.3pts
-
-0.8pts
-
Ordinary Income
5,031
4,377
-653
-13.0%
Ordinary Income
9,270
7,700
7,741
-1,528
-16.5%
+41
+0.5%
Ord. Income Margin
22.6%
17.7%
-4.9pts
-
Ord. Income Margin
22.2%
18.6%
17.9%
-4.3pts
-
-0.7pts
-
Net Income
4,040
3,484
-555
-13.8%
Net Income
6,881
5,700
6,197
-684
-9.9%
+497
+8.7%
Net Inc. Margin
18.1%
14.1%
-4.0pts
-
Net Inc. Margin
16.5%
13.8%
14.3%
-2.2pts
-
+0.5pts
-
USD/JPY
144.62
159.57
+14.95
-
USD/JPY
148.43
148.00
158.31
+9.88
-
+10.31
-
EUR/JPY
163.87
185.47
+21.60
-
EUR/JPY
162.31
175.00
184.61
+22.30
-
+9.61
-
16 ─
Copyright © Tamron Co., Ltd. All rights reserved.
Ⅱ-3. Factors Affecting Operating Income Variability
Operating Profit (Down): Significantly impacted by lower gross profit due to decreased sales and unfavorable product mix, alongside higher SG&A expenses
driven by expanded R&D and labor cost increases.
(¥ million)
1st Half FY 2026
FX Impact on Net Sales:
+2,480 million yen
9,203
+1,030
-170
-210
-190
-410
-1,560
SG&A Increase Total:
+380 million yen
1H FY25
Actual
17 ─
FX Impact
R&D Expense
Increase
Copyright © Tamron Co., Ltd. All rights reserved.
SG&A Increase
(Excl. R&D)
U.S. Tariff Impact
Lower GP
from sales decline
Product Mix, etc.
-4
Others
7,689
1H FY26
Actual
Ⅱ-4. Segment Results ①Photographic Products
Own Brand (Up):Overall revenue grew, as a sharp sales decline in China caused by market inventory adjustments was offset by double-digit growth in the US, Europe, and
India, alongside sustained strong performance in Japan.
OEM (Down): Continued weak orders for certain models—a trend persisting since 2H of the previous fiscal year—remained a key drag on the overall business.
Profitability (Squeezed): Earnings were squeezed by lower sales volume, surging raw material and utility costs, and increased R&D and labor expenses.
Vs. Forecast (Missed): Missed targets due to deeper-than-expected order cuts in OEM and persistent high inventory levels in China following a weak year-end shopping season
for Own Brand products.
Q2 FY25
Q2 FY26
Change vs. FY25
(¥ million)
Actual
Actual
Value
Net Sales
16,413
16,228
Operating
Income
4,599
Operating
Margin
28.0%
OwnBrand
(¥ billion)
Unit
(10K)
18 ─
1H FY26
1H FY26
Change vs. FY25
FX Impact
vs. FY26 Fcst.
Value
(¥ million)
Actual
Fcst.
Actual
Value
%
(vs. Prior
Year)
-184
-1.1%
Net Sales
29,982
28,400
27,534
-2,448
-8.2%
+1,490
-865
-3.0%
3,553
-1,046
-22.7%
Operating
Income
8,403
7,300
5,943
-2,459
-29.3%
+550
-1,356
-18.6%
21.9%
-6.1pts
-
Operating
Margin
28.0%
25.7%
21.6%
-6.4pts
-
-
-4.1pts
-
%
Q2 FY25
Q2 FY26
Change vs. FY25
Actual
Actual
Value
9.0
9.6
+0.6
+6.4%
7.4
6.6
-0.8
-10.3%
OwnBrand
13
13
-0
-1.1%
24
17
-7
-29.5%
Copyright © Tamron Co., Ltd. All rights reserved.
Value
(¥ billion)
Unit
(10K)
Value
YoY
+4%
SLR cameras
-27%
-35%
Mirrorless
cameras
-2%
+6%
-1%
+4%
IL (lenses)
1H Sales Mix
1H FY25
1H FY26
1H FY26
Change vs. FY25
Actual
Fcst.
Actual
Value
OwnBrand
16.5
17.5
17.1
+0.7
+4.2%
-0.4
-1.9%
OEM
13.5
10.9
10.4
-3.1
-23.2%
-0.5
-4.9%
OwnBrand
23
24
22
-1
-2.3%
-2
-6.5%
OEM
42
32
29
-13
-32.0%
-3
-10.0%
%
Qty
YoY
-5%
ILC total
1H Sales Mix
OEM
OEM
1H FY25
%
Q2 Sales Mix
Value
1H FY26 Market
1H
Q2
%
vs. FY26 Fcst.
Value
%
OEM
38%
45% Outside: FY26
Inside : FY25
55%
62%
Own-Brand
Ⅱ-4. Segment Results ①1H Own-Brand Sales by Region
Sales Mix by Region(Value Vasis)
Other Asia
18% 18%
China
14%
Others
5%
5%
Sales Growth Rate (YoY, Yen Basis)
+64%
Europe
19%
17%
+23%
Outside: FY26
Inside : FY25
16%
North
America
26%
26%
18%
+4%
+3% +6%
Europe
-14%
North America
Japan
China
-11%
Other Asia
-2%
-16%
Japan
18%
+12%
+4%
Others
-10%
-43%
Total
-8%
FY25
FY26
Interchangeable Lens Market for 1H
Shipment Growth Rate
Market Share(Value Basis)
FY26 (YoY)
Europe
FY25
22%
FY26
22%
Europe
+12%
+5%
-5%
+4%
Americas
26%
23%
Americas
+7%
+11%
-3%
-7%
Japan
10%
11%
Japan
-8%
-15%
+12%
+16%
China
23%
22%
China
+8%
-15%
-6%
+2%
Other Asia
14%
17%
Other Asia
-1%
-2%
+12%
+21%
Others
5%
5%
Others
+18%
+10%
+5%
-1%
100%
100%
+5%
-2%
-1%
+4%
Total
19 ─
FY25 (YoY)
Copyright © Tamron Co., Ltd. All rights reserved.
Qty
合計
Value
Qty
Value
Ⅱ-4. Segment Results ②Surveillance & FA Lenses
Surveillance: Sales grew solidly, led by advanced markets, capturing rising demand for high-definition/high-resolution specs and diversifying applications..
FA: Revenue surged ~1.4x YoY as customer inventory adjustments ran their course and demand recovered.
Video Conferencing: Maintained flat YoY sales despite a sluggish broader market, supported by resilient demand for core existing models.
Camera Modules: Achieved double-digit growth driven by increased demand in China and Europe.
Profitability: Operating profit rose double-digits as strong volume growth offset lower gross margins from raw material cost hikes and higher R&D expenses.
Vs. Forecast: Outperformed targets across all categories, delivering 1.2x revenue and ~1.5x profit growth compared to plan.
1H
Q2
Q2 FY25
Q2 FY26
Change vs. FY25
(¥ million)
Actual
Actual
Value
%
Net Sales
3,098
4,108
+1,010
+32.6%
520
503
-16
-3.2%
16.8%
12.3%
-4.5pts
-
Operating Income
Operating Margin
(¥ billion)
Unit
(10K)
20 ─
1H FY26
1H FY26
Change vs. FY25
(¥ million)
Actual
Fcst.
Actual
Value
%
Net Sales
5,976
6,400
7,711
+1,735
+29.0%
929
700
1,026
+97
15.5%
10.9%
13.3%
-2.2pts
Operating Income
Operating Margin
FX Impact
vs. FY26 Fcst.
(vs. Prior
Year)
Value
%
+450
+1,311
+20.5%
+10.5%
+170
+326
+46.7%
-
-
+2.4pts
-
1H Sales Mix
1H Sales Mix
Q2 Sales Mix
Value
1H FY25
Q2 FY25
Q2 FY26
Change vs. FY25
Actual
Actual
Value
Surv.
1.5
2.1
+0.6
+38.7%
FA & Oth.
0.6
0.9
+0.3
+51.2%
VC
0.3
0.3
+0
+1.5%
Cam.
Modules
0.7
0.8
+0.1
+18.7%
Segment
Total
30
44
+14
+44.8%
%
Copyright © Tamron Co., Ltd. All rights reserved.
Value
(¥ billion)
Unit
(10K)
1H FY25
1H FY26
1H FY26
Change vs. FY25
Actual
Fcst.
Actual
Value
%
vs. FY26 Fcst.
Value
Cam. Modules
%
Surv.
3.2
4.0
4.2
+1.0
+33.6%
+0.2
+5.6%
FA & Oth.
1.1
1.0
1.5
+0.4
+39.0%
+0.5
+47.8%
VC
0.6
0.2
0.6
+0
+8.0%
+0.4 +217.7%
Cam.
Modules
1.1
1.2
1.4
+0.3
+18.0%
+0.2
+14.6%
Segment
Total
59
73
83
+24
+41.7%
+10
+13.4%
18%
19%
VC
8%
10% Outside: FY26
Inside : FY25 53%
18%
19%
FA & Oth.
55%
Surv.
Ⅱ-4. Segment Results ② Surveillance & FA Lenses Sales Mix by Branch
Sales Mix by Branch (Value Basis)
Others
1%
China Europe
8%
7% US
3%
7%
6%
4%
Sales Growth Rate By Branch (YoY, Yen Basis)
+55%
+60%
+40%
+29%
+28%
1%
Outside: FY26
Inside : FY25
+6%
Europe
-2% US
Japan
China
Others
Total
-1%
-16%
82%
Japan
81%
21 ─
Copyright © Tamron Co., Ltd. All rights reserved.
-30%
-27%
-28%
FY25
FY26
Ⅱ-4. Segment Results ③ Mobility &Healthcare Products, Other
Automotive: Maintained steady revenue growth on sustained strong demand for advanced sensing cameras, driven by increasing ADAS adoption.
Healthcare: Achieved massive growth of over 2x YoY, boosted by line expansion in products supporting minimally invasive treatment.
Profitability: Profit grew ~1.5x, propelled by higher gross profit from top-line expansion; achieved constant-currency revenue and profit growth even excluding favorable forex impacts.
Vs. Forecast: Delivered double-digit revenue growth across all categories, with profit significantly outperforming targets at over 1.6x plan.
Q2
1H
Q2 FY25
Q2 FY26
Change vs. FY25
(¥ million)
Actual
Actual
Value
%
Net Sales
2,751
4,457
+1,705
613
1,085
22.3%
24.3%
Operating Income
Operating Margin
1H FY25
1H FY26
1H FY26
Change vs. FY25
(¥ million)
Actual
Fcst.
Actual
Value
%
+62.0%
Net Sales
5,755
6,600
8,035
+2,279
+39.6%
+472
+77.0%
Operating Income
1,342
1,200
1,987
+644
+2.0pts
-
Operating Margin
23.3%
18.2%
24.7%
+1.4pts
FX Impact
vs. FY26 Fcst.
(vs. Prior
Year)
Value
%
+540
+1,435
+21.7%
+48.0%
+310
+787
+65.6%
-
-
+6.5pts
-
1H Sales Mix
Q2 FY25
Value
(¥ billion)
22 ─
DSC/VC,
Drone & Oth.
1H Sales Mix
Q2 Sales Mix
Q2 FY26
Change vs. FY25
Actual
Actual
Auto
2.3
3.6
+1.3
HC Comp.
0.2
0.5
+0.3 +163.2%
DSC/VC,
Drone/Oth.
0.3
0.4
+0.1
Value
Copyright © Tamron Co., Ltd. All rights reserved.
1H FY25
%
Actual
+55.3%
+37.5%
Value
(¥ billion)
1H FY26
Fcst.
1H FY26
Actual
Change vs. FY25
Value
%
vs. FY26 Fcst.
Value
%
Auto
4.9
5.3
6.5
+1.7
+34.1%
+1.2
+23.8%
HC Comp.
0.4
0.8
0.9
+0.5 +113.5%
+0.1
+10.2%
DSC/VC,
Drone/Oth.
0.5
0.5
0.6
+0.1
+0.1
+17.8%
+32.1%
HC Comp.
11%
7%
7%
8%
Outside: FY26
Inside : FY25
85%
82%
Auto
Ⅱ-5. Quarterly Segment Performance Trends
Sales
Q1
FY24
YoY
(%)
Q2
FY24
13,944
+45.0
Op.Income
4,019
+50.8
Surveillance &
FA Lenses
Sales
2,939
-8.6
Mobility &
Healthcare
Products, Others
Sales
Consolidated
Financial
Results
(¥ million)
Photographic
Products
Op.Income
YoY
(%)
Q3
FY24
YoY
(%)
Q4
FY24
19,152
+38.7
5,959
+55.2
3,072
+38.6
YoY
(%)
YoY
(%)
17,228
+21.3
14,510
-5.8
13,569
-2.7
5,263
+33.3
2,868
-19.3
3,803
-5.4
3,403
+47.2
2,899
+42.0
2,878
-2.1
Q2
FY25
YoY
(%)
Q3
FY25
16,413
-14.3
4,599
-22.8
3,098
+0.8
15,529
+7.0
-25.4
3,301
+15.1
3,061
-10.0
3,053
+5.3
Q2
FY26
YoY
(%)
QoQ
(%)
11,305
-27.2
16,228
-1,1
+43.5
2,390
-27.6
3,553
-22.7
+48.6
3,602
+18.0
4,108
+32.6
+14.1
437
+52.6
578
+462.2
121
+222.6
409
-4.5
520
+18.9
321
-44.4
424
+248.4
523
+23.2
503
-3.2
-3.8
+27.5
2,970
+18.3
2,609
+18.5
3,003
+2.3
2,751
-2.0
3,195
+7.6
3,384
+29.7
3,577
+5.7
4,457
+62.0
+24.6
729
+156.3
630
+63.8
745
+46.8
371
+18.0
729
+0.0
613
-2.8
721
-3.2
636
+71.2
901
+41.8
1,085
+77.0
+20.3
Sales
19,819
+36.5
25,034
+37.3
23,602
+24.0
20,019
+1.9
19,451
-1.9
22,263
-11.1
21,389
-9.4
21,967
+9.7
18,485
-15.9
24,795
+11.4
+34.1
Op.Income
4,547
+72.9
6,292
+63.6
5,892
+59.1
2,469
-27.9
4,235
-6.9
4,967
-21.1
4,183
-29.0
3,251
+31.7
3,441
+5.8
4,247
-14.5
+23.4
Op.Income
Net Sales
20.0
19.2
22.3
19.5
13.9
21.4
22.0
14.5
13.6
16.4
15.1
15.5
11.3
3.4
2.9
2.9
3.1
3.1
3.1
2.9
2.8
3.0
2.6
3.0
2.8
3.2
3.4
Q1/24
Q2/24
Q3/24
Q4/24
Q1/25
Q2/25
Q3/25
Q4/25
Copyright © Tamron Co., Ltd. All rights reserved.
3.6
3.6
Q1/26
4.1
4.5
Q2/26
31.1%
28.8%
28.0%
25.1%
24.8%
28.0%
22.3%
6.0
4.0
14.6%
0.4
5.3
17.0%
14.2%
14.2%
22.6%
0.6
0.7
0.7
Q1/24
Q2/24
Q3/24
0.1
0.4
4.2%
Q4/24
25.2%
21.3%
3.8
14.2%
4.6
16.8%
3.9
3.3
13.9%
24.3%
21.1%
18.8%
2.9
0.4
0.6
30%
25.9%
19.8%
2.0
0.0
24.3%
22.4%
4.0
1.0
35%
30.6%
5.0
3.0
10.0
3.1
7.0
6.0
18.5
16.2
17.2
O.P. / O.P. Margin
(¥ Billion)
24.8
23.6
19.8
23 ─
-12.2
3,925
Q1
FY24
2,809
25.0
2.9
15,131
Q1
FY26
+48.4
25.0
5.0
YoY
(%)
+73.6
8.0
15.0
Q4
FY25
428
30.0
20.0
YoY
(%)
2,935
(¥ Billion)
0.0
Q1
FY25
14.5%
2.4
10.5%
21.9%
20%
3.6
15%
12.3%
10%
5%
0.4
0.6
0.5
0.5
0.6
0.3
0.7
0.9
1.1
Q2/25
Q3/25
Q4/25
Q1/26
Q2/26
0.4
0.5
0.7
Q1/25
25%
0%
Ⅲ. Financial Forecast FY2026
Ⅲ-1. Financial Forecast FY2026
1H Performance:Photo missed 1H targets, while the other two segments outperformed forecast.
2H Outlook & Revisions:
Net Sales (¥ million)
• Photo: Aiming to recover the 1H shortfall during 2H.
• Other Two Segments: Reflected risks based on recent market conditions and order momentum,
alongside 1H top-line upside.
Net Sales: Revised upward to reflect strong performance in Automotive and other growth areas.
Operating Income: Maintained initial full-year forecast, absorbing ongoing cost pressures.
(¥ million)
FY25
FY26
FY26
Actual
Initial Fcst.
Revised Foct.
%
%
Value
Net Sales
85,071
91,000
93,000
+7,928
+9.3%
+2,000
+2.2%
Operating
Income
16,638
18,500
18,500
+1,861
+11.2%
-
-
Operating Margin
19.6%
20.3%
19.9%
+0.3pts
-
-0.4pts
-
Ordinary
Income
16,699
18,500
18,500
+1,800
+10.8%
-
-
Ord. Income Margin
19.6%
20.3%
19.9%
+0.3pts
-
-0.4pts
-
Net Income
11,761
13,690
13,690
+1,928
+16.4%
-
-
Net Inc. Margin
13.8%
15.0%
14.7%
+0.9pts
-
-0.3pts
-
USD/JPY
149.63
148.00
159.16
+9.53
-
+11.16
EUR/JPY
169.24
175.00
182.31
+13.07
-
+7.31
25 ─
Copyright © Tamron Co., Ltd. All rights reserved.
49,600
49,718
41,714
41,400
43,281
FY25 Actual
FY26 Initial Foct.
FY26 Revised
Fcst.
vs. FY26 Fcst.
Change vs. FY25
Value
43,356
1H
2H
Operating Income (¥ million)
19.6%
20.3%
7,435
10,800
10,810
9,203
7,700
7,689
-
FY25 Actual
FY26 Initial Foct.
-
1H
2H
19.9%
FY26 Revised
Fcst.
OP. Margin
Ⅲ-2. Segment Forecast FY2026 ①Photographic Products
Net Sales:Expected to meet full-year initial targets, driven by forex tailwinds (yen
depreciation) and a 2H recovery offsetting the 1H shortfall.
Profitability:Revised downward due to higher procurement costs (raw materials
and freight) along with increased labor and R&D expenses.
Net Sales: Maintained initial full-year forecast.
Operating Income: Revised downward due to persistent cost pressures.
Net Sales(¥ million)
Operating Income (¥ million)
60,643
63,000
30,660
34,600
63,000
15,630
35,465
17,200
7,227
9,900
8,403
7,300
16,100
10,156
Full-Year Forecast
FY25
FY26
FY26
Change vs. FY25
vs. FY26 Initial Fcst.
Value
%
Value
(¥ million)
Actual
Initial Fcst.
Revised
Fcst.
Net Sales
60,643
63,000
63,000
+2,356
+3.9%
—
—
Operating
Income
15,630
17.200
16,100
+469
+3.0%
-1,100
-6.4%
Operating Margin
25.8%
27.3%
25.6%
-0.2pts
—
-1.7pts
—
(¥ billion)
Unit
(10K)
26 ─
28,400
FY25 Actual
FY26 Initial Fcst. FY26 Revised
Fcst.
1H
Full-Year Sales Mix
FY25
FY26
FY26
Actual
Initial Fcst.
Revised
Fcst.
Change vs. FY25
Value
%
vs. FY26 Initial Fcst.
%
Value
OwnBrand
35.9
39.0
39.0
+3.1
+8.5%
—
—
OEM
24.7
24.0
24.0
-0.7
-2.9%
—
—
OwnBrand
49
52
51
+2
+3.0%
-1
-1.9%
OEM
77
72
67
-10
-12.7%
-5
-6.9%
Copyright © Tamron Co., Ltd. All rights reserved.
27,534
5,943
%
Sales Mix
Value
29,982
FY25 Actual
FY26 Initial Fcst. FY26 Revised
Fcst.
1H
2H
OEM
38%
Outside: FY26
41% Inside : FY25
59%
62%
Own-Brand
2H
Ⅲ-2. Photographic Products Own-Brand New Models
Before FY23: Approx. 5 new models launches per year ⇒ Initial MTMP: Target of 6-7 models launches per year ⇒ New MTMP: Targeting 10+ new model launches per year by FY26
FY24: 7 models
FY25: 6 models
FY26: 10+ New Models
Jun.
Aug.
Oct.
Jul.
Nov.
Mar.
Aug.
50-300mm
F/4.5-6.3
VC VXD (A069)
28-300mm
F/4-7.1
VC VXD (A074)
90mm F/2.8
VXD (F072)
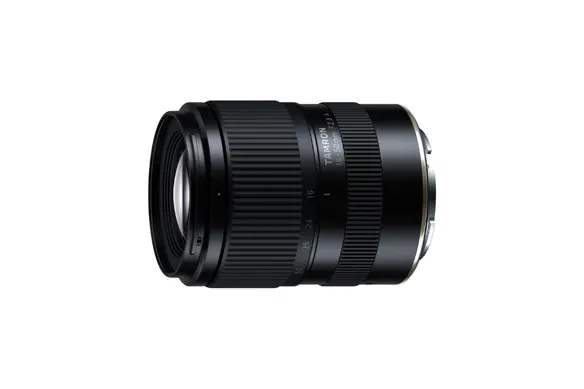
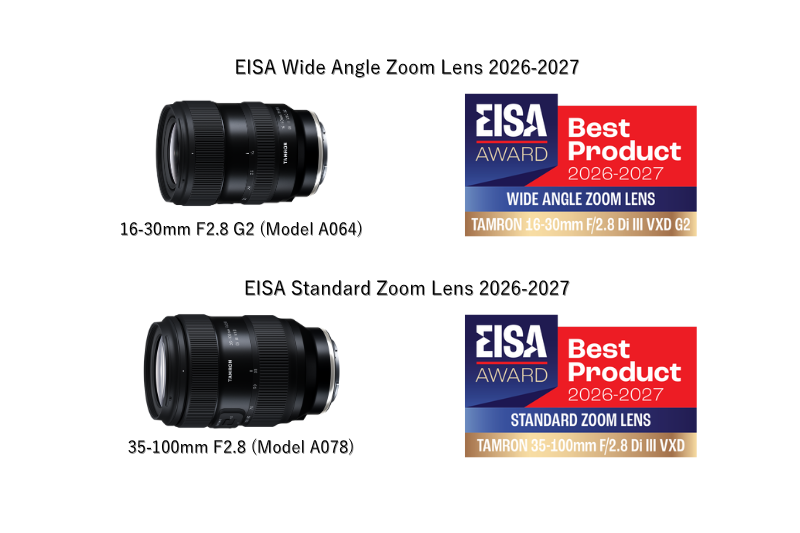
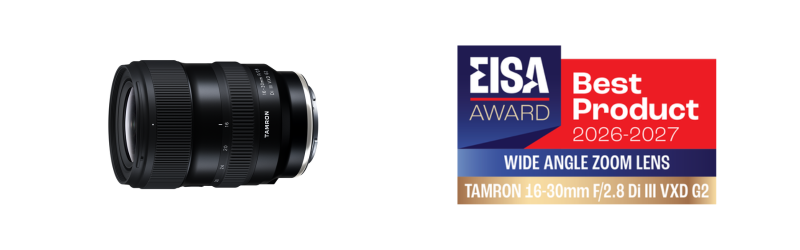
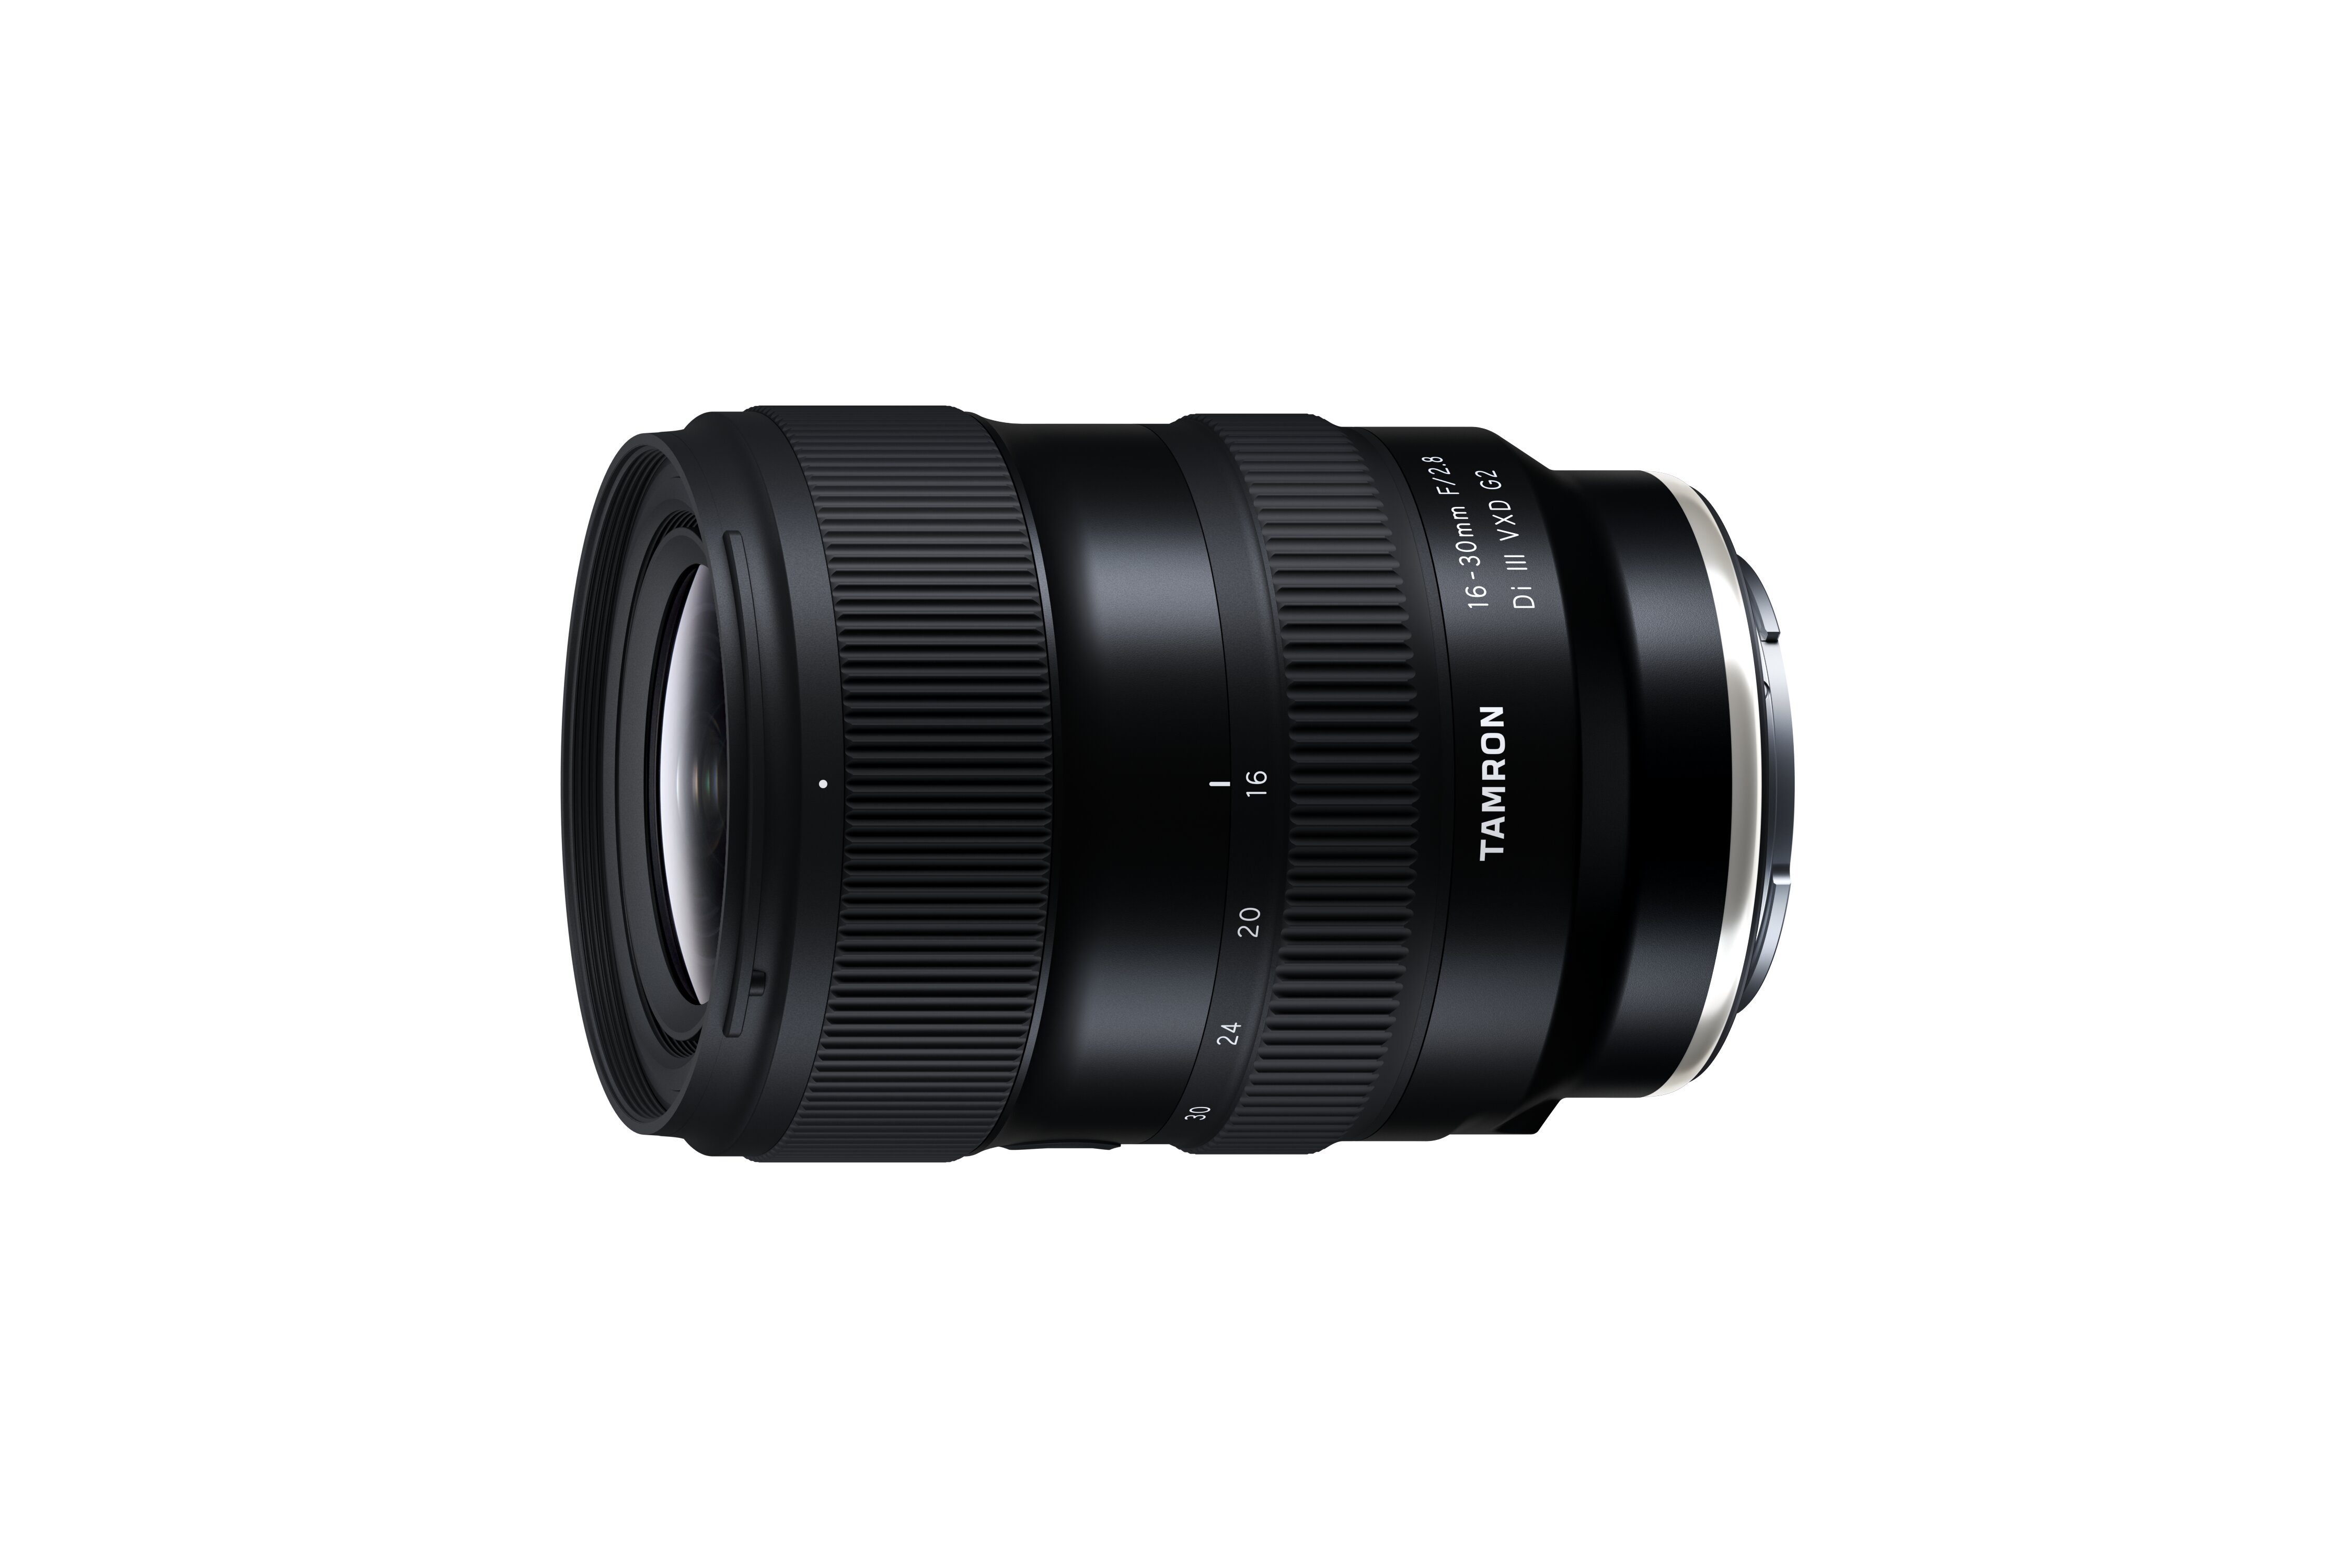
16-30mm F/2.8
VXD G2 (A064)
25-200mm
F/2.8-5.6
VXD G2 (A075)
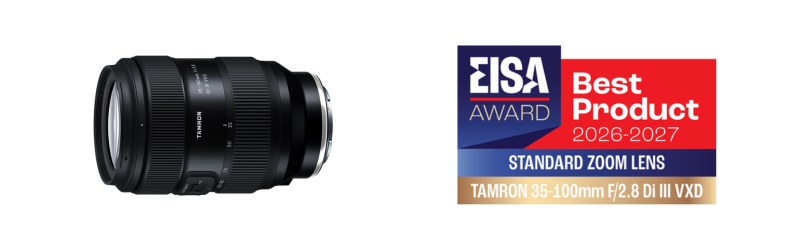
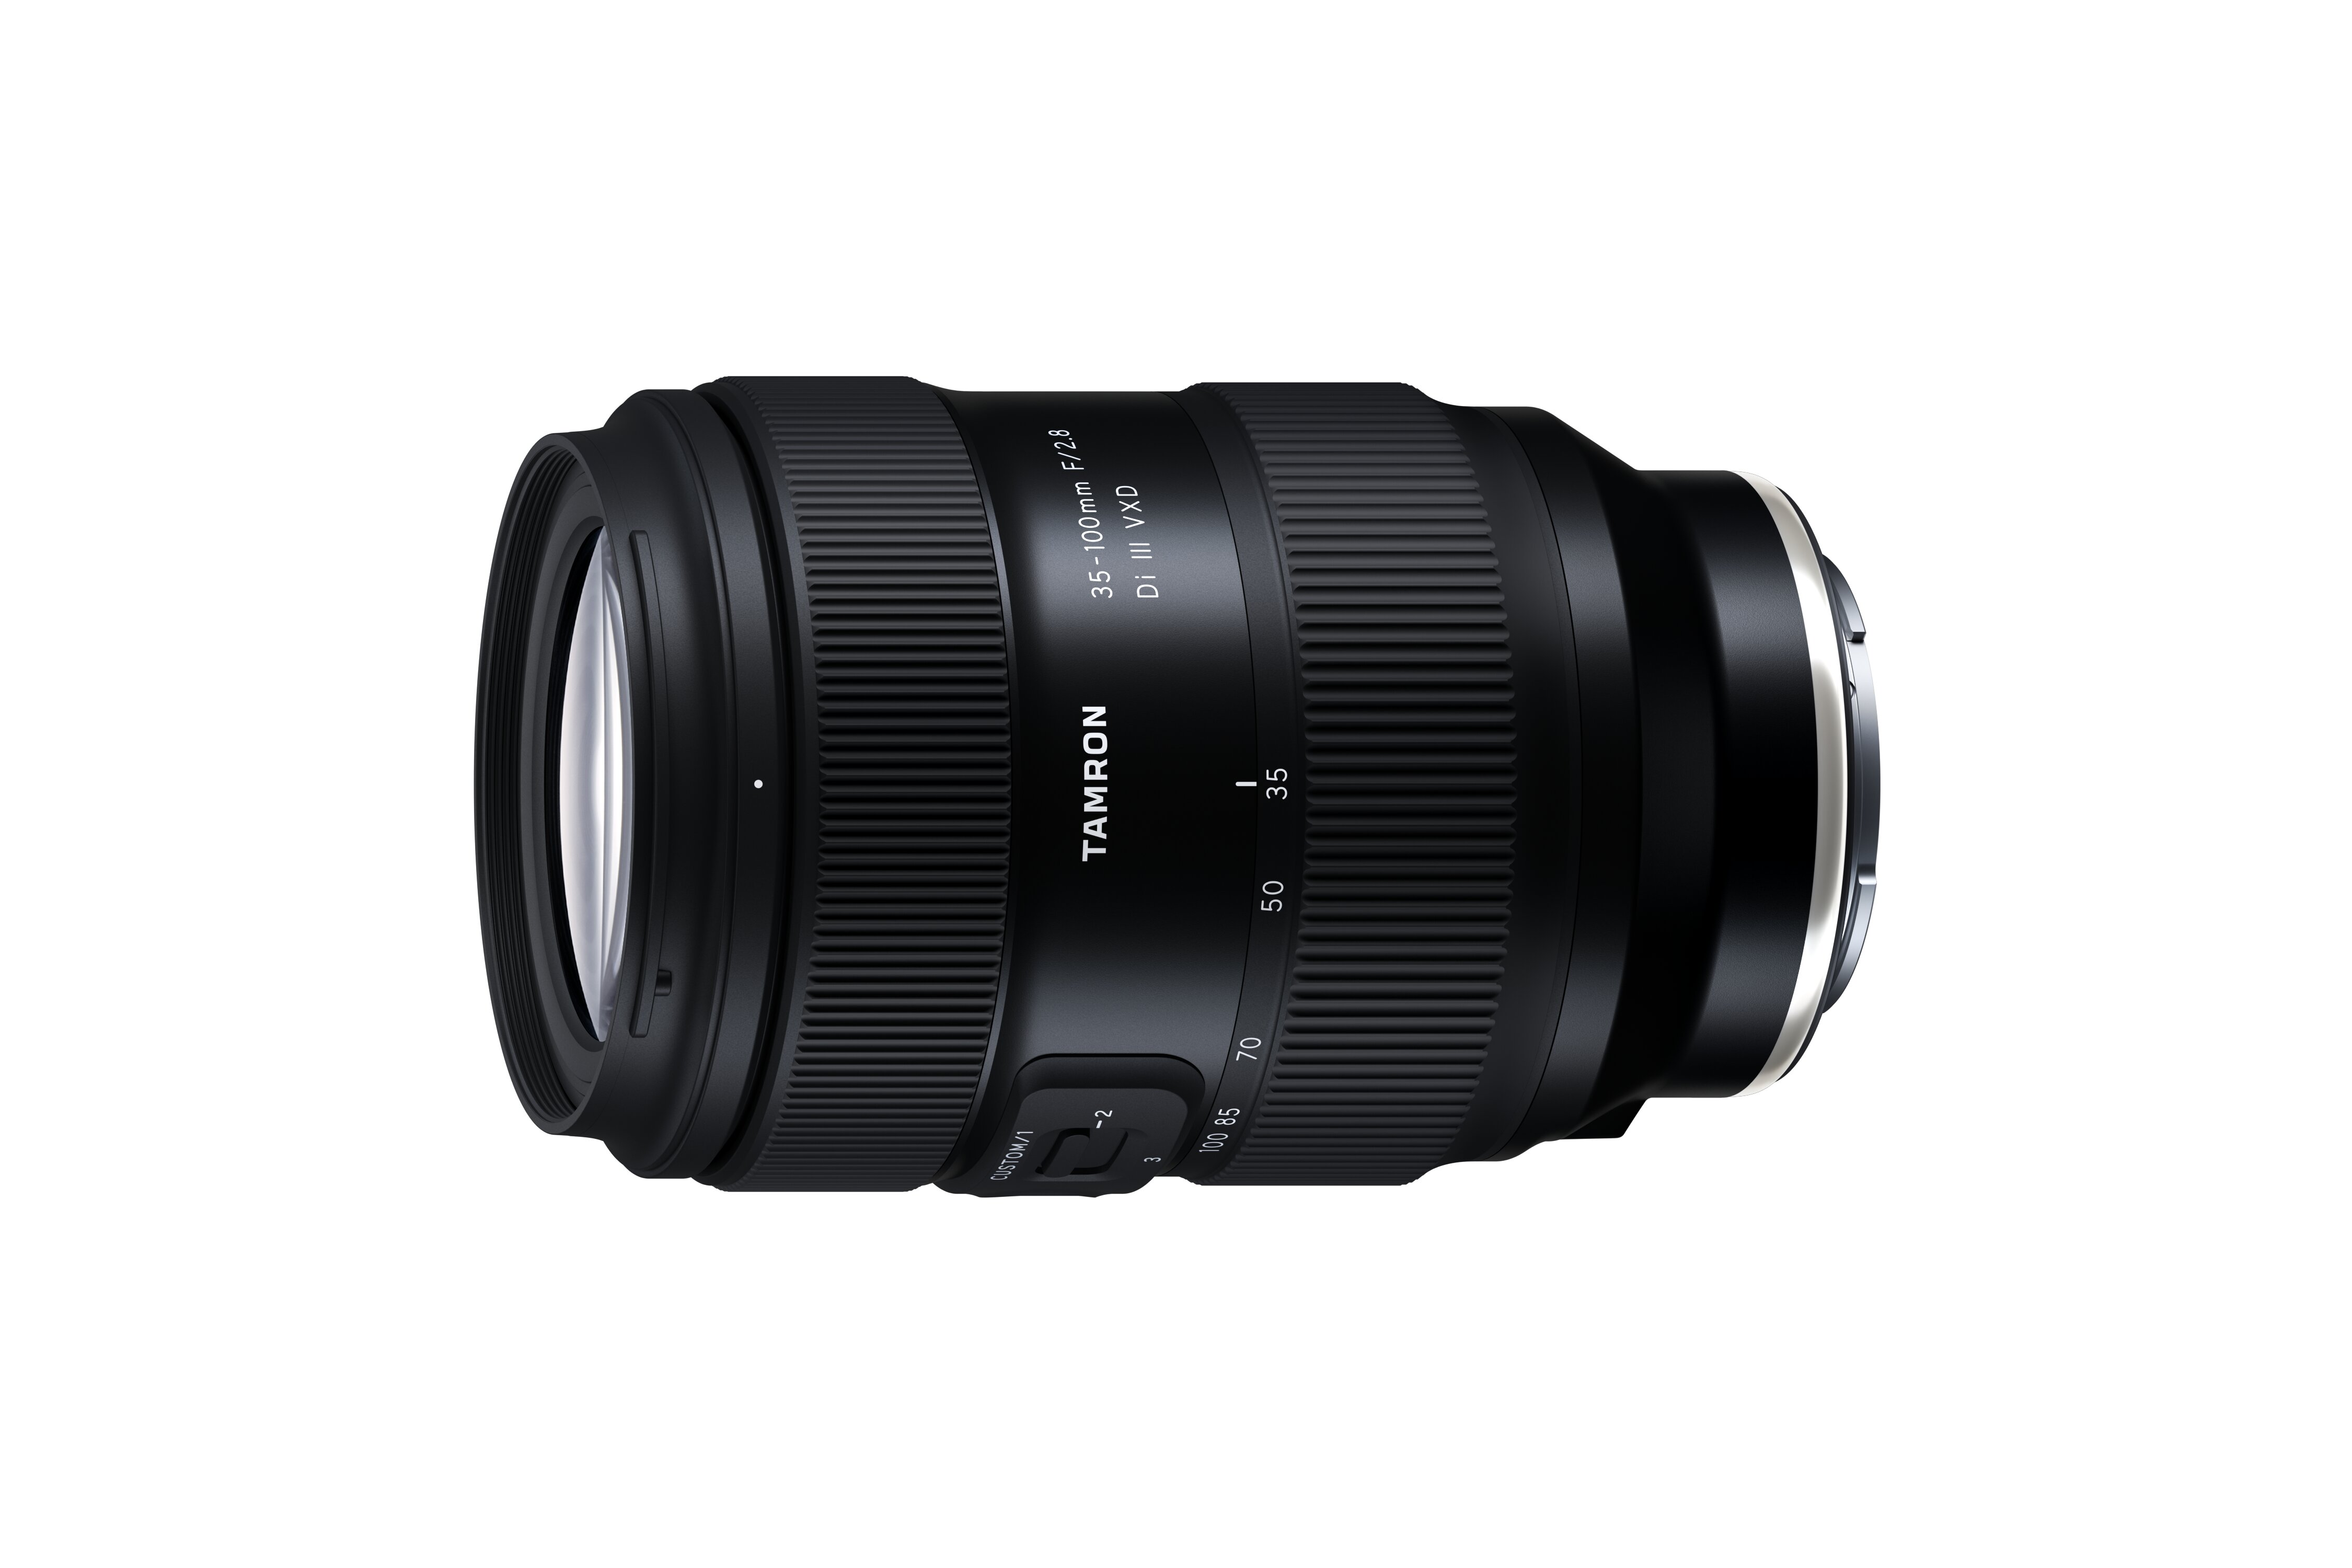
35-100mm F/2.8
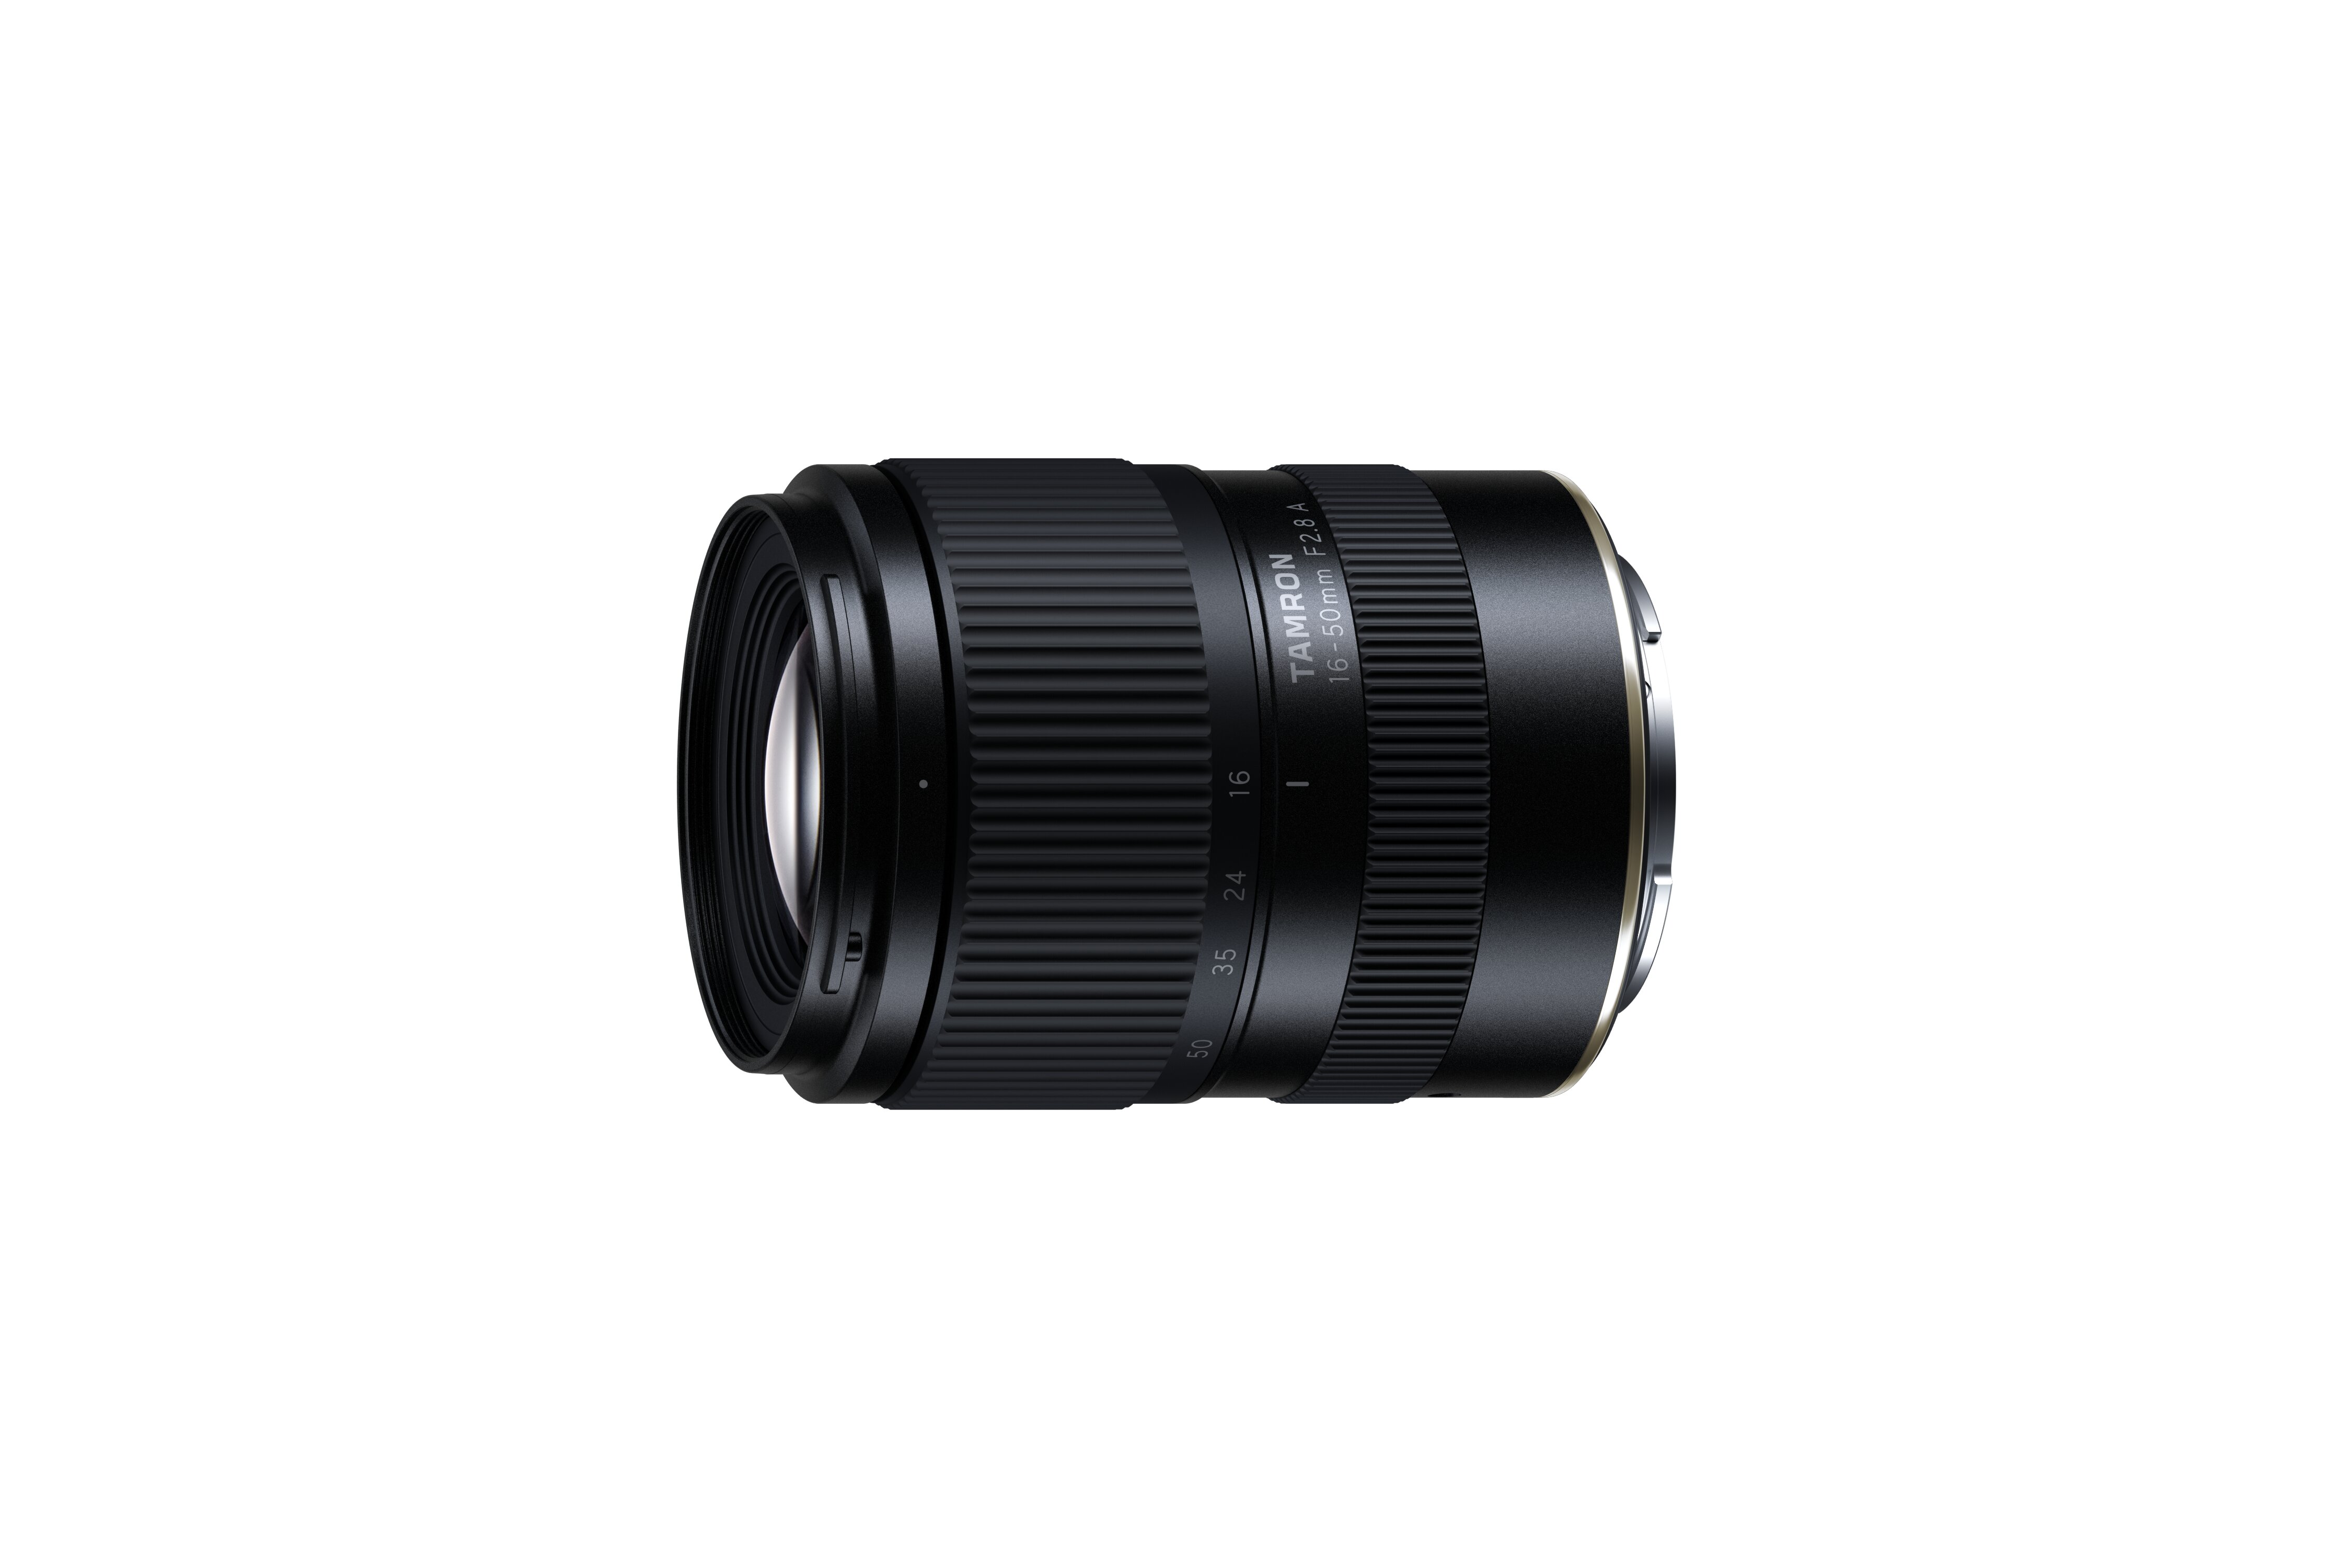
VXD (A078)
12-20mm F2.8 (A084)
Apr.
Sep.
Oct.
Aug.
Aug.
Oct.
Mar.
Jul.
Aug.
28-75mm F/2.8
VXD G2 (A063)
50-400mm
F/4.5-6.3
VC VXD (A067)
90mm F/2.8
VXD (F072)
16-30mm F/2.8
VXD G2 (A064)
18-300mm
F/3.5-6.3
VC VXD (B061)
70-180mm F/2.8
VXD G2 (A065)
35-100mm F/2.8
VXD (A078)
17-70mm F/2.8
VC RXD (B070)
12-20mm F2.8 (A084)
SONY
E-mount
Total: 22
models
NIKON
Z-mount
Total:11
models
Dec.
Sep.
Jul.
11-20mm F/2.8
RXD (B060)
18-300mm
F/3.5-6.3
VC VXD (B061)
17-70mm F/2.8
VC RXD (B070)
CANON
RF-mount
Total:3
models
FUJIFILM
X-mount
Total:4
models
27 ─
Copyright © Tamron Co., Ltd. All rights reserved.
Ⅲ-3. Segment Forecast FY2026 ②Surveillance & FA Lenses
Net Sales: Expected to hit initial full-year targets overall. While performance varies by
product line—such as sales declines in Camera Modules due to component shortages
being offset by Video Conferencing—the segment as a whole remains on track.
Profitability: Expected to meet initial full-year targets. While 1H profit outperformed plan,
2H profit will be impacted by increased R&D investments and shifted SG&A expenses.
Net Sales & Operating Income: Maintained initial full-year forecast.
FY25
FY26
FY26
(¥ million)
Actual
Initial Fcst.
Net Sales
12,091
Operating Income
Operating Margin
Sales Mix
Value
(¥ billion)
Unit
(10K)
28 ─
Change vs. FY25
vs. FY26 Initial Fcst.
Revised
Fcst.
Value
%
Value
14,500
14,500
+2,408
+19.9%
―
―
1,675
1,900
1,900
+224
+13.4%
―
―
13.9%
13.1%
13.1
-0.8pts
―
―
―
FY25
FY26
FY26
Actual
Initial Fcst.
Revised
Fcst.
5,976
%
FY25 Actual
6,788
8,100
7,711
6,400
FY26 Initial Fcst. FY26 Revised
Fcst.
1H
2H
Change vs. FY25
vs. FY26 Initial Fcst.
Value
Value
%
%
6.7
8.3
8.4
+1.7
+25.7%
+0.1
+1.2%
FA & Oth.
2.0
3.0
2.8
+0.8
+42.3%
-0.2
-6.7%
VC
1.2
0.5
1.2
+0
+1.0%
+0.7
+140.0%
Cam.
Modules
Segment
Total
2.2
2.7
2.1
-0.1
-6.7%
-0.6
-22.2%
129
156
167
+38
+29.1%
+11
+7.1
FY26 Initial
Fcst.
VC
8%
10%
15%
19%
Outside: FY26
Inside : FY25 55%
19% 16%
FA & Oth.
58%
1,026
700
1H
Cam.
Modules
873
1,200
929
FY25 Actual
1,900
1,900
1,675
746
Full-Year Sales Mix
Surv.
Copyright © Tamron Co., Ltd. All rights reserved.
14,500
14,500
12,091
6,115
Full-Year Forecast
Operating Income (¥ million)
Net Sales(¥ million)
Surv.
2H
FY26 Revised
Fcst.
Ⅲ-3. Segment Forecast FY2026 ③ Mobility &Healthcare Products, Other
Net Sales:Revised upward, driven by strong 1H performance where Automotive
exceeded forecast by 1.2x alongside steady Healthcare Components growth.
Profitability:While 1H top-line expansion boosted gross profit, 2H margins are expected
to decline compared to 1H due to customer price reduction pressures and increased
R&D investments.
Net Sales & Operating Income: Revised upward for both top and bottom lines.
Operating Income (¥ million)
Net Sales(¥ million)
15,500
12,336
6,580
3,500
13,500
2,699
7,464
6,900
1,357
1,300
Full-Year Forecast
FY25
FY26
FY26
(¥ million)
Actual
Initial Fcst.
Net Sales
12,336
Operating Income
Operating Margin
Change vs. FY25
vs. FY26 Initial Fcst.
Revised
Fcst.
Value
%
Value
%
13,500
15,500
+3,163
+25.6%
+2,000
+14.8%
2,699
2,500
3,500
+800
+29.6%
+1,000
+40.0%
21.9%
18.5%
22.6%
+0.7pts
—
+4.1pts
—
5,755
6,600
8,035
FY25 Actual
FY26 Initial
Fcst.
FY26 Revised
Fcst.
1H
2H
Full-Year Sales Mix
8%
Sales Mix
(¥ billion)
29 ─
FY26
FY26
Actual
Initial Fcst.
Revised
Fcst.
Change vs. FY25
vs. FY26 Initial Fcst.
Value
Value
%
%
13.0
+2.7
+26.0%
+1.7
+15.0%
1.2
1.3
+0.3
+29.9%
+0.1
+8.3%
1.0
1.2
+0.2
+18.3%
+0.2
+20.0%
10.3
11.3
HC Comp.
1.0
DSC/VC,
Drone/Oth.
1.0
Auto
Value
FY25
Copyright © Tamron Co., Ltd. All rights reserved.
1,200
FY25 Actual
FY26 Initial
Fcst.
1H
8%
8%
1,987
1,342
DSC/VC,
Drone & Oth.
HC Comp.
1,512
2,500
8%
Outside: FY26
Inside : FY25
84%
84%
Auto
2H
FY26 Revised
Fcst.
Ⅳ. Reference Data
Ⅳ-1. Financial Position
Liabilities / Net Assets
Assets
(¥ million)
120,000
96,535
100,000
80,000
33,155
60,000
16,908
40,000
14,964
20,000
0
106,046
109,240
35,371
34,633
17,090
18,346
16,768
17,725
1,668
(¥ million)
120,000
100,000
80,000
1,462
1,993
35,353
36,541
End-June 2025
End-Dec. 2025
End-June 2026
Other Current Assets
Cash & Deposits
14,309
106,046
109,240
15,499
15,491
3,419
4,634
4,350
60,000
29,838
Non-Current Assets
Notes & Accounts Receivable
96,535
40,000
78,806
85,911
89,398
End-June 2025
End-Dec. 2025
End-June 2026
Net Assets
Non-current Liabilities
20,000
0
Inventories
Current Liabilities
Liabilities with Interests
Inventories
(¥ million)
20,000
(¥ million)
2.2Mos
2.4Mos
2.5Mos
15,000
10,000
5,000
0
2.0
14,964
End-June 2025
17,725
16,768
End-Dec. 2025
Inventories
31 ─
3.0
Copyright © Tamron Co., Ltd. All rights reserved.
Turnover
End-June 2026
2,000
1.6%
1,000
1.0
0.0
3.0%
0
1,568
End-June 2025
1.0%
1.1%
1,045
1,150
End-Dec. 2025
End-June 2026
Liabilities with Interests
2.0%
1.0%
0.0%
Ⅳ-2. Cap Expenditures, Depreciation, and R&D Expenses
Capital Expenditures
R&D Expenses
(¥ million)
(¥ million)
10,000
8,000
6,000
5,299
4,000
10.0%
6,300
5,956
8.5%
4,828
3,218
8.6%
8.6%
8.6%
8.0%
8,000
8.0%
2,000
0
FY22
FY23
FY24
FY25
FY26(Fcst.)
6,000
6.0%
Depreciation
4,000
(¥ million)
7,092
5,000
4,200
4,000
3,000
2,957
2,961
3,082
3,523
5,398
7,313
8,000
4.0%
6,169
2,000
2.0%
2,000
0
1,000
0
32 ─
FY22
FY23
FY24
Copyright © Tamron Co., Ltd. All rights reserved.
FY25
FY26(Fcst.)
FY22
FY23
R&D Expenses
FY24
FY25
FY26(Fcst.)
R&D Expenses (% Net Sales)
0.0%
Ⅳ-3. Cash Flows
(¥ million)
20,000
Operating CF
Free CF
Financing CF
15,096
15,000
10,000
Investing CF
7,757
7,644
5,888
4,519
5,000
2,686
0
-5,000
-3,124
-3,201
-7,339
-10,000
-8,989
-11,129
-15,000
Operating CF
Investing CF
Free CF
Financing CF
33 ─
End-June 2025
7,644
-3,124
4,519
-8,989
Copyright © Tamron Co., Ltd. All rights reserved.
End-Dec. 2025
15,096
-7,339
7,757
-11,129
End-June 2026
5,888
-3,201
2,686
-4,140
-4,140
Ⅳ-4. Dividends and Key Performance Indicators
Dividends
Key Performance Indicators
(JPY)
Repurchase of
treasury stock
(4.0Bill.)
60
100%
200
84.1%
50
20
10
0
60.1%
54.0%
49.8%
30
32.9%
20%
60%
16.875
4.375
FY22
FY23
Interim Dividend
Dividend Payout Ratio
100
20.00
8.75
10.00
FY24
FY25
Year-End Dividend
Total Return Ratio
FY26(Fcst.)
0%
16.0%
15.4%
87.90
15%
14.0%
84.91
10%
72.79
64.64
50
17.0%
50.00
5%
Commemorative Dividend
Current MTMP:Payout ratio ~40% (¥20 minimum annual dividend); Total payout ratio 60%.
0
Next MTMP:Dividend policy set to the higher of 60% payout ratio or 8% DOE.;
~¥18B in additional returns planned.
FY2026 Dividend: Target set at 60% payout ratio
(Note) A 4-for-1 stock split of common shares was conducted, effective July 1, 2025. Dividends and EPS are presented on a post-split basis.
Copyright © Tamron Co., Ltd. All rights reserved.
19.0%
14.8%
20%
Shareholder Return Policy
34 ─
17.2%
16.1%
40%
26.25
10.625
3.750
150
16.5%
26.25
0.625
20.4%
31.00
39.8%
30.0%
25%
80%
Repurchase of
treasury stock
(2.0Bill.)
40
(JPY)
FY22
FY23
FY24
FY25
EPS
ROE: Net Income /Net Assets (average for Fiscal Year)
ROA: Ordinary Income/Total Assets (average for Fiscal Year)
FY26(Fcst.)
0%
Ⅳ-5. FX Impacts
FX Impact in 1H FY26
Impact (Millions of JPY)
1H FY25
1H FY26
Net Sales
Operating Income
USD/JPY
148.43
158.31
+1,400
+210
EUR/JPY
162.31
184.61
+570
+480
Others
ー
ー
+510
+340
Total
ー
ー
+2,480
+1,030
(Foreign exchange impact on previous year results)
FX sensitivity in 2nd Half FY26
Impact of ¥1 Appreciation (¥ million)
FX Assumption
2H FY26
Net Sales
Operating Income
USD/JPY
160.00
-170
-40
EUR/JPY
180.00
-40
-30
35 ─
Copyright © Tamron Co., Ltd. All rights reserved.
Disclaimer
-
This material is intended to provide information regarding the actual results for 1st half FY2026 and future management strategies;
it does not constitute, and should not be construed as, an offer or solicitation to buy or sell securities.
-
The information herein is based on data available at the time of publication and on assumptions deemed reasonable by the Company.
Actual results may differ from the forecasts contained in this material due to various factors.
-
Market forecast data from third-party vendors cited herein has not been independently verified by the Company, and no guarantees are made
regarding its accuracy, reliability, or consistency of assumptions. Please note that actual market trends may differ from the data presented due to
future changes in market conditions or social environment.
-
The Company accepts no liability for any loss or damage arising from the use of this material or from statements made in this presentation.
-
In the event of any discrepancy between the English and Japanese versions of this material, the Japanese version shall prevail.
36 ─
Copyright © Tamron Co., Ltd. All rights reserved.