|
Riken Keiki Co., Ltd. is a manufacturer and distributor of gas detection and alarm equipment. The company operates as a single business segment focused on the production and sale of these devices, alongside providing after-maintenance services for its installed base. Its group structure includes ten subsidiaries and one affiliate, with key operating entities including Riken Keiki Nara Works, RKI Instruments, Inc., RIKEN KEIKI ASIA PACIFIC PTE. LTD., RIKEN KEIKI GmbH, and Riken Keiki (Changzhou) Electronic Technology Co., Ltd. The company serves markets in Japan, Asia, and Europe through its regional subsidiaries. Summarised from the annual report, fiscal year ended Mar 2026 |
Industry Scientific & Technical Instruments | Homepage rikenkeiki.co.jp |
| Sector Technology | IR page rikenkeiki.co.jp | |
|
Tags
gas detection, alarm equipment, safety instruments, maintenance services, industrial safety, Riken Keiki Nara Works, Taiwan Riken Keiki Co. Ltd., Riken Keiki Trading (Shanghai) Co. Ltd., Riken Keiki (Shanghai) Import & Export Co. Ltd., RKI Instruments Inc., RIKEN KEIKI ASIA PACIFIC PTE. LTD., RIKEN KEIKI GmbH, Riken Keiki (Changzhou) Electronic Technology Co. Ltd.
|
Press page rikenkeiki.co.jp/english |
Metrics
| Valuation | |
|---|---|
| Market cap | ¥ 167.756B |
| Market cap (USD) | $ 1.048B |
| P/E | 14.62 |
| PEG | 3.10 |
| P/BV | 1.86 |
| P/S | 2.82 |
| P/OCF | 16.05 |
| P/FCF | 24.48 |
| Dividend yield | 1.6% |
| Turnover / mcap | — |
| Returns | |
|---|---|
| ROE | 12.2% |
| ROI | 11.4% |
| ROIC | 10.6% |
| Profit margin | 18.0% |
| Growth | |
|---|---|
| Revenue growing | Yes |
| Profits growing | Yes |
| Revenue up 3y | Yes |
| Revenue up 5y | Yes |
| Earnings growth 3y (net profit CAGR) | 4.7% |
| Quality | |
|---|---|
| Profitable | Yes |
| Margin expanding | No |
| Buying back stock | No |
| Diluting (TTM) | No |
| Debt/Equity | — |
| Podcast bulls (TTM) | Sign up |
| Podcast bears (TTM) | Sign up |
| Podcast sentiment (TTM) | Sign up |
| Podcast sentiment % (TTM) | Sign up |
| News sentiment (TTM) | 0 |
| Quality score | 27.8% |
| Insiders | |
|---|---|
| Buys, 1w | Sign up |
| Buys, 1m | Sign up |
| Buys, 1y | Sign up |
| Sells, 1w | Sign up |
| Sells, 1m | Sign up |
| Sells, 1y | Sign up |
Sign up to see this company's insider trades
| Figure | FY 2026 | FY 2025 | FY 2024 | FY 2023 | FY 2022 | FY 2021 | FY 2020 | FY 2019 | FY 2018 | FY 2017 | FY 2016 | FY 2015 | FY 2014 | FY 2013 |
|---|---|---|---|---|---|---|---|---|---|---|---|---|---|---|
| Revenue | 55.212B | 49.039B | 45.581B | 45.005B | 37.364B | 32.209B | 32.189B | 30.651B | 28.089B | 23.358B | 23.418B | 21.335B | 20.18B | 19.802B |
| Net profit | 9.957B | 8.008B | 8.379B | 8.67B | 5.964B | 4.692B | 4.343B | 4.099B | 3.175B | 4.128B | 2.575B | 2.693B | 2.315B | 2.026B |
| Free cash flow | 8.307B | 4.449B | 460.101M | 4.246B | 8.479B | 1.466B | 1.407B | 3.572B | 1.674B | 1.475B | 3.055B | — | — | — |
| Figure | FY 2026 | FY 2025 | FY 2024 | FY 2023 | FY 2022 | FY 2021 | FY 2020 | FY 2019 | FY 2018 | FY 2017 | FY 2016 | FY 2015 | FY 2014 | FY 2013 |
|---|---|---|---|---|---|---|---|---|---|---|---|---|---|---|
| Share price | 2.915K | 2.581K | 3.828K | 5.693K | 4.895K | 2.764K | 2.035K | 2.134K | 2.322K | 1.692K | 1.023K | 1.396K | 935.95 | 655.95 |
| Price performance 12m | 0.13 | -0.33 | -0.33 | 0.16 | 0.77 | 0.36 | -0.05 | -0.08 | 0.37 | 0.65 | -0.27 | 0.49 | 0.43 | — |
Filed figures
Lines the statements and their notes report beside the headline figures, read from the filings' XBRL as filed (no restatement applied), with figures computed from one filing's own lines. Cash-flow lines carry their cash direction: an outflow is negative. Each period links to its filing; a figure's period, report date and tag are in its tooltip.
| Figure | Mar 2017 | Mar 2018 | Mar 2019 | Mar 2020 | Mar 2021 | Mar 2022 | Mar 2023 | Mar 2024 | Mar 2025 | Mar 2026 |
|---|---|---|---|---|---|---|---|---|---|---|
| Balance sheet detail | ||||||||||
| Trade receivables (JPY) | 9.76B | 11.4B | 11.5B | 11.9B | 12.7B | 21.9B | 24.6B | 25.9B | 28.2B | 27.8B |
| ↳ YoY growth | -2.3% | +16.5% | +0.8% | +3.9% | +6.5% | +72.6% | +12.2% | +5.4% | +8.7% | -1.4% |
| ↳ 5y CAGR | +4.9% | +17.6% | +16.7% | +17.7% | +18.8% | +16.9% | ||||
| Borrowings, current (JPY) | 1.35B | 995M | 995M | 995M | 995M | 1.3B | 995M | 995M | 995M | 1.02B |
| Borrowings, non-current (JPY) | 851M | 1.15B | 1.15B | 1.15B | 1.15B | 851M | 851M | 851M | 851M | 815M |
| Bonds payable (JPY) | 400M | 300M | 300M | 300M | 300M | 300M | — | — | — | — |
| Lease liabilities (JPY) | 518M | 570M | 552M | 639M | 1.66B | 1.41B | 1.26B | 1.36B | 1.48B | 2.03B |
| Cash and deposits (JPY) | 5.82B | 6.09B | 7.35B | 10.2B | 9.63B | 11.6B | 13.6B | 16.6B | 18.3B | 17.4B |
| Intangible assets (JPY) | 1.82B | 2.22B | 2.78B | 2.54B | 2.15B | 1.86B | 1.77B | 1.79B | 2.56B | 3.44B |
| Net debt (borrowings + leases - cash) (JPY) | -3.11B | -3.38B | -4.66B | -7.44B | -5.83B | -7.99B | -10.5B | -13.4B | -15B | -13.6B |
| Cash flow detail | ||||||||||
| Operating cash flow (JPY) | 4.14B | 3.37B | 4.22B | 5.23B | 4.09B | 9.03B | 4.57B | 2.22B | 6.3B | 11.1B |
| Purchases of property, plant and equipment (JPY) | -2.4B | -1.5B | -648M | -3.77B | -2.62B | -774M | -943M | -2.15B | -832M | -1.51B |
| Purchases of intangible assets (JPY) | -258M | -203M | -178M | -279M | -161M | -51.9M | -65.6M | -481M | -1.01B | -1.31B |
| Change in receivables (cash effect) (JPY) | 403M | -1.6B | -53.2M | -452M | -803M | 163M | -1.09B | -755M | -962M | 254M |
| Change in inventories (cash effect) (JPY) | 233M | -564M | -1.31B | -124M | 64.4M | -2.96B | -5.54B | -5.12B | 331M | -488M |
| Change in payables (cash effect) (JPY) | -135M | 1.34B | 19.8M | -737M | 435M | 1.3B | 1.09B | -715M | -2.95B | -10.8M |
| Dividends paid (cash effect) (JPY) | -534M | -580M | -766M | -906M | -976M | -1B | -1.84B | -1.86B | -1.86B | -2.29B |
| Interest paid (cash effect) (JPY) | -32.1M | -29.3M | -28.6M | -27.9M | -33.9M | -47.4M | -41M | -43M | -52.4M | -74.4M |
| Income taxes paid (cash effect) (JPY) | -1.1B | -1.2B | -1.57B | -1.43B | -2.1B | -1.88B | -3.36B | -3.6B | -3.24B | -3.98B |
| Operating cash flow before change in receivables (JPY) | 3.73B | 4.98B | 4.27B | 5.68B | 4.89B | 8.87B | 5.67B | 2.97B | 7.26B | 10.9B |
| Free cash flow (OCF - PPE - intangibles) (JPY) | 1.48B | 1.67B | 3.39B | 1.18B | 1.3B | 8.21B | 3.56B | -416M | 4.45B | 8.31B |
| Income detail | ||||||||||
| Research and development expense (JPY) | 1.44B | 1.81B | 1.88B | 1.75B | 1.91B | 2.14B | 2.41B | 2.29B | 2.54B | 2.73B |
| ↳ 5y CAGR | +5.9% | +8.2% | +5.9% | +4.0% | +7.7% | +7.5% | ||||
| Total comprehensive income (JPY) | 4.36B | 3.93B | 3.57B | 4.39B | 5.1B | 6.73B | 9.78B | 10.9B | 8.59B | 11.7B |
| Comprehensive income to owners (JPY) | 4.36B | 3.81B | 3.44B | 4.23B | 5.1B | 6.53B | 9.66B | 10.9B | 8.59B | 11.7B |
| Reported | Jun 28, 2017 | Jun 27, 2018 | Jun 26, 2019 | Jun 25, 2020 | Jun 25, 2021 | Jun 28, 2022 | Jun 28, 2023 | Jun 26, 2024 | Jun 26, 2025 | Jun 24, 2026 |
Sign up to see institutional holdings
Sign UpPodcast Mentions
Sign up to see podcast mentions and sentiment
Sign UpFilings with EDINET (periodic reports, extraordinary reports, offerings, holding and buy-back reports), newest first, titles as filed in Japanese. The link opens the filing on EDINET. Press releases from the company's own website, newest first.
「統合報告書2026」発行のお知らせ
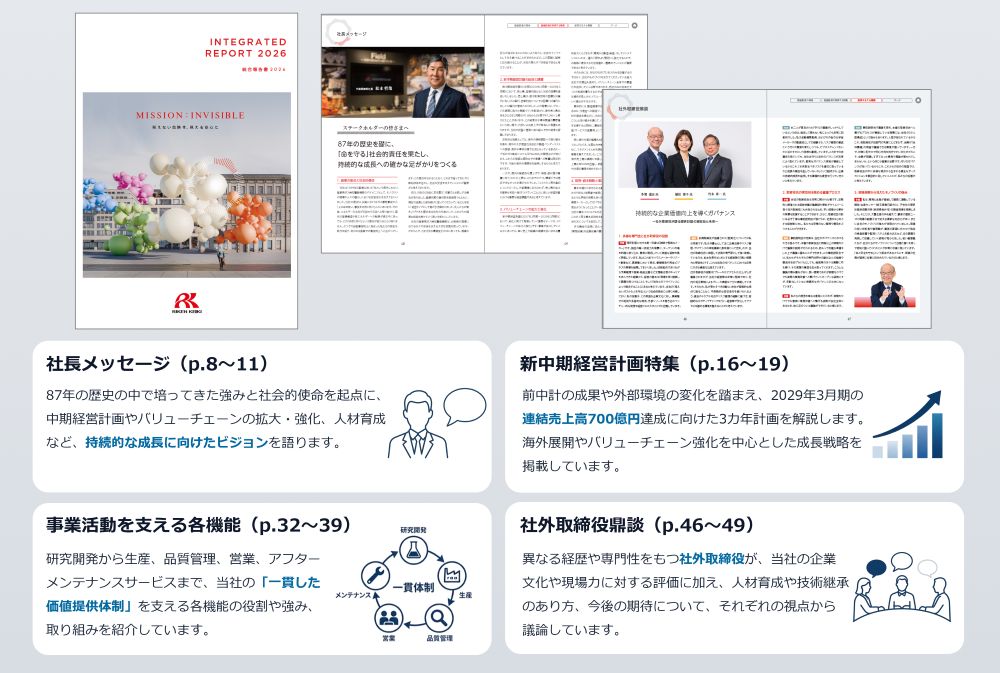
当社は、ステークホルダーの皆さまに持続的な成長に向けた取り組みをお伝えすることを目的として、「統合報告書2026」を発行いたしました。
本報告書では、社長メッセージを掲載するとともに、2026年5月に公表した新中期経営計画(2027年3月期~2029年3月期)を特集し、自社を取り巻く環境を踏まえた事業戦略や取り組みについて解説しています。
また、新設ページとして、事業活動を支える各機能・強みの紹介を通して事業内容をより詳しくお伝えするほか、社外取締役鼎談(ていだん)を掲載し、社外取締役3名それぞれの視点から、当社への評価や期待に関して意見を交わしています。
当社の経営方針や成長戦略、価値創造に向けた取り組みをご理解いただく一助となれば幸いです。
今後もステークホルダーの皆さまとの対話と情報開示の充実を図り、持続的な企業価値の向上を目指してまいります。
■「統合報告書2026」の閲覧はこちら
Integrated_report_2026_A3.pdf



Copyright© 2025 RIKEN KEIKI CO., LTD. All Rights Reserved.








Prompts
Click prompts to add them under the company line, click again to take one out, then copy the result into your AI chat. Shared by Asian Century Stocks and Uncovered Thai Stocks. Thank you.
ETFs Holding Riken Keiki Co., Ltd.
Exchange-traded funds whose newest published daily portfolio holds one of the company's listings, largest weight first.
| ETF | Weight in ETF | Shares | Market value | As of |
|---|---|---|---|---|
| AVDS | 0.02% | 4,000 | $ 85.256K | Nov 16, 2026 |
| DFIS | 0.00% | 12,001 | $ 251.428K | Nov 12, 2026 |
| DFSI | 0.00% | 1,000 | $ 20.951K | Nov 12, 2026 |
| DFAX | 0.00% | 8,800 | $ 184.365K | Nov 12, 2026 |
| DFIC | 0.00% | 8,900 | $ 186.46K | Nov 12, 2026 |
| DFAI | 0.00% | 9,200 | $ 192.745K | Nov 12, 2026 |
| AVDE | 0.00% | 22,000 | $ 468.906K | Nov 16, 2026 |