August 6, 2026 I am Matsumoto, CFO of Nikon. Thank you for taking time from your busy schedules to join todayʼs earnings briefing. Financial Results for the 1st Quarter of the Year Ending March 31, 2027 Forecast for the Year Ending March 31, 2027 …
August 6, 2026
I am Matsumoto, CFO of Nikon. Thank you for taking time from your busy
schedules to join todayʼs earnings briefing.
-
Financial Results for the 1st Quarter of
the Year Ending March 31, 2027
-
Forecast for the Year Ending March 31, 2027
Today, I will present our first-quarter results and provide an outlook for the
full fiscal year.
1st Quarter of the Year Ending March 31, 2027 :
Summary
• Revenue
: \164.1B (Up
¥6.0B YoY)
• Operating profit
:-\ 0.9B (Up
¥0.2B YoY)
• Profit attributable
to owners of parent
:\
1.2B (Down ¥8.2B YoY)
• Revenue grew YoY on increased sales in business segments outside Imaging Products
and FX tailwinds
Q1 Actual
(YoY)
• Operating profit was flat YoY as profit tailwinds from increased sales and US tariff
refunds (\4.0B) were offset by lower sales volumes and higher memory prices in
Imaging Products and \4.1B in inventory write-downs in Precision Equipment
• Profit attributable to owners of parent turned positive due to gains from financial P&L
and equity-method investments. However, it was down YoY as the disappearance of
tax benefits (\9.3B) booked in the previous year resulting from the resolution to
dissolve and liquidate Nikon Metrology NV
Note: Amounts in this statement are rounded down to the hundred millions of yen.
I will begin with our first-quarter results.
First-quarter revenue was 164.1 billion yen. Operating profit was a loss of
0.9 billion yen, while profit attributable to owners of parent was a profit of
1.2 billion yen.
Revenue increased by 6.0 billion yen year-on-year, supported by increased
sales in business segments outside Imaging Products and foreign
exchange tailwinds.
Operating profit benefited from higher sales and a 4.0 billion yen US tariff
refunds. However, we recorded an operating loss roughly in line with the
prior year, reflecting lower sales volumes and higher memory prices in
Imaging Products and 4.1 billion yen inventory write-downs in Precision
Equipment.
Profit attributable to owners of parent returned to profit due to gains from
the financial P&L and equity-method investments. The year-on-year
decline of 8.2 billion yen primarily reflects the disappearance of a 9.3 billion
yen tax benefits booked in the previous year resulting from the resolution
to dissolve and liquidate Nikon Metrology NV.
1st Quarter of the Year Ending March 31, 2027 :
Financial Highlights
FY2026/3 Q1
FY2027/3 Q1
Change
Actual (A)
Actual (B)
Amount
(B)-(A)
Revenue
158.1
164.1
+6.0
Operating profit
-1.1
Billions of Yen
% vs Revenue
Profit before tax
0.7
% vs Revenue
Profit attributable to
owners of parent
1.5
9.4
+0.8
1.2
+0.4P
-8.2
0.8%
-9.3
4.5
Exchange Rate:
US$
\145
\160
EURO
\164
\185
+0.2P
0.9%
6.0%
+3.8%
+0.2
-0.6%
0.5%
% vs Revenue
FCF
-0.9
-0.8%
%
(B)/(A)
+88.8%
-86.4%
-5.2P
+13.8
Impact on Revenue
+12.3
Impact on Operating profit
+0.7
The yellow box on Slide 4 summarizes the key consolidated first-quarter
figures, with year-on-year comparisons shown on the right.
Free cash flow turned positive at 4.5 billion yen, supported by an increase
in operating cash flow. This represents a 13.8 billion yen improvement
year-on-year.
1st Quarter of the Year Ending March 31, 2027 :
Performance by Segment
FY2026/3 Q1
Actual (A)
Billions of Yen
Imaging Products
Business
Precision Equipment
Business
Revenue
Operating profit
Operating profit
Healthcare Business
14.0%
Operating profit
23.1
-1.8
Industry Business
Operating profit
15.1
1.6
Digital Manufacturing
Business
Others
Operating profit
(incl. Corporate expenses, etc.) Operating profit
Revenue
Consolidated
5.0
-4.1
Operating profit
16.8%
0.8
-9.8
158.1
-1.1
% vs Revenue
-34.8%
-0.8%
+23.9%
+47.4P
+0.1
+1.5
+6.0
+0.2
-0.6%
+18.3%
+80.7%
+5.8P
+1.3
+2.0
0.9
-8.3
164.1
-0.9
+19.9%
+11.7P
+2.8
+1.4
6.3
-2.1
-82.2%
% vs Revenue
Revenue
3.8%
+13.2%
-12.5P
+4.6
+2.8
17.9
3.0
11.0%
% vs Revenue
Revenue
-6.9%
%
(B)/(A)
-8.8%
-27.5%
-2.9P
+4.4
-4.4
27.7
1.0
-7.9%
% vs Revenue
Revenue
11.1%
38.2
-2.6
5.6%
% vs Revenue
Revenue
72.9
8.1
33.8
1.8
Change
Amount
(B)-(A)
-7.1
-3.0
Actual (B)
80.0
11.1
% vs Revenue
Revenue
FY2027/3 Q1
+11.1%
+3.8%
+0.2P
Note: FY2026/3 actual have been re-stated to reflect segmentation changes.
Slide 5 shows results by segment.
Within the yellow box, the top row for each segment shows revenue, and
the bottom row shows operating profit.
Year-on-year, profits declined in Imaging Products and Precision
Equipment, while Healthcare, Industry, and Digital Manufacturing posted
improvements.
1st Quarter of the Year Ending March 31, 2027 :
Imaging Products Business
FY2026/3 Q1
Actual (A)
FY2027/3 Q1
Actual (B)
Revenue
80.0
72.9
-7.1
Operating profit
11.1
8.1
-3.0
Billions of Yen
% vs Revenue
14.0%
Change
(B)-(A)
-2.9P
11.1%
Digital Camera-Interchangeable
Lens type
(units: 1,000)
270
210
-60
Interchangeable Lens
(units: 1,000)
370
310
-60
Q1 YoY :
• Despite FX tailwinds, revenue was down on reduced sales of DCIL cameras and lenses driven by demand
contraction mainly in China
• Operating profit was down as reduced sales and higher memory prices outstripped FX tailwinds and US tariff
refunds
Note: FY2026/3 actual have been re-stated to reflect segmentation changes.
I will now review first-quarter performance by business segment.
Revenue for Imaging Products was 72.9 billion yen, and operating profit
was 8.1 billion yen.
Sales volume of DCIL declined by 60 thousand units year-on-year to 210
thousand units, and interchangeable lens sales declined by 60 thousand
units to 310 thousand units, reflecting demand contraction mainly in China.
Despite foreign exchange tailwinds, revenue was down by 7.1 billion yen on
reduced sales volumes.
Operating profit decreased by 3.0 billion yen as reduced sales and higher
memory prices outstripped foreign exchange tailwinds and US tariff
refunds.
1st Quarter of the Year Ending March 31, 2027 :
Precision Equipment Business
FY2026/3 Q1
Actual (A)
FY2027/3 Q1
Actual (B)
Change
(B)-(A)
Revenue
33.8
38.2
+4.4
Operating profit
1.8
-2.6
-4.4
Billions of Yen
% vs Revenue
5.6%
-12.5P
-6.9%
FPD Lithography Systems
(units)
7
5
-2
Semiconductor
Lithography Systems
New/Refurbished (units)
2/0
4/1
+2/+1
Q1 YoY :
• Revenue grew as increased sales volumes of ArF dry lithography systems and other factors outstripped lower
sales volumes of FPD lithography systems
• Operating profit was down as the recognition of inventory write-downs (\4.1B) outweighed profit growth on
increased revenues
Slide 7 covers the Precision Equipment.
Revenue increased by 4.4 billion yen year-on-year to 38.2 billion yen.
Sales volume of FPD lithography systems totaled 5 units, a decrease of 2
units year-on-year, due to the postponement of some installations to the
second quarter.
By contrast, sales volume of semiconductor lithography systems increased
by 3 units to 5 units, driven by ArF dry systems and other systems.
Operating profit shifted to a loss of 2.6 billion yen, a decrease of 4.4 billion
yen year-on-year, mainly due to a 4.1 billion yen inventory write-downs
caused by a long-term stagnation of equipment resulting from a timing
discrepancy in customer orders.
1st Quarter of the Year Ending March 31, 2027 :
Healthcare Business
FY2026/3 Q1
Actual (A)
FY2027/3 Q1
Actual (B)
Change
(B)-(A)
Revenue
23.1
27.7
+4.6
Operating profit
-1.8
1.0
+2.8
Billions of Yen
% vs Revenue
-7.9%
3.8%
+11.7P
Q1 YoY :
• Revenue grew on FX tailwinds, a gradual recovery from previous yearʼs doldrums in the US academia market in
Life Science Solutions, and solid sales trends in the US in Eye Care Solutions
• Operating profit grew on increased revenues, US tariff refunds, and the decrease of one-time costs in Eye Care
Solutions*
*One-time costs in Eye Care Solutions: \0.5B (FY2026/3 Q1 actual), \0.1B (FY2027/3 Q1 actual)
Slide 8 covers the Healthcare.
In Life Science Solutions, which includes biological microscopes, the US
academic market gradually recovered after a significant decline in the prior
year, resulting in higher sales. In Eye Care Solutions, which includes retinal
imaging diagnostic equipment, sales in the US market remained strong. As
a result, total Healthcare revenue increased by 4.6 billion yen to 27.7 billion
yen, also supported by foreign exchange effects.
Operating profit improved by 2.8 billion yen to 1.0 billion yen, driven by
increased revenues, US tariff refunds, and lower one-time costs in Eye
Care Solutions.
1st Quarter of the Year Ending March 31, 2027 :
Industry Business
FY2026/3 Q1
Actual (A)
FY2027/3 Q1
Actual (B)
Change
(B)-(A)
Revenue
15.1
17.9
+2.8
Operating profit
1.6
3.0
+1.4
Billions of Yen
% vs Revenue
11.0%
16.8%
+5.8P
Q1 YoY :
• Revenue and profit grew on increased sales and the pulling forward of demand for optical components, video
measuring systems for electronic components and semiconductor applications, and other products
Note: FY2026/3 actual have been re-stated to reflect segmentation changes.
Slide 9 covers the Industry.
Revenue increased by 2.8 billion yen to 17.9 billion yen, supported by
higher sales and accelerated shipments of optical components and
imaging measurement systems for electronic components and
semiconductor applications. Operating profit increased by 1.4 billion yen to
3.0 billion yen.
1st Quarter of the Year Ending March 31, 2027 :
Digital Manufacturing Business
Billions of Yen
FY2026/3 Q1
Actual (A)
FY2027/3 Q1
Actual (B)
Change
(B)-(A)
Revenue
5.0
6.3
+1.3
Operating profit
-4.1
-2.1
+2.0
% vs Revenue
-82.2%
-34.8%
+47.4P
Q1 YoY :
• Revenue grew on strength in SLM's large-format metal 3D printers and FX tailwinds
• Operating losses contracted on increased revenues, lower amortization (\0.9B) of intangible assets, and
benefits from restructuring
Slide 10 covers the Digital Manufacturing.
Sales of SLMʼs NXG series large-format metal 3D printers remained strong.
Although revenue recognition for some equipment was deferred to the
second quarter, first-quarter revenue increased by 1.3 billion yen to 6.3
billion yen, and the operating loss narrowed by 2.0 billion yen.
-
Financial Results for the 1st Quarter of
the Year Ending March 31, 2027
-
Forecast for the Year Ending March 31, 2027
Next, I will explain our outlook for future performance.
Forecast for the First Half and Full Year of the Year Ending March 31, 2027 :
Summary
Forecast
for 1H of
the Year
• Revenue
: \336.0B (Revised downward \7.0B vs. previous forecast)
• Operating profit
: -\ 5.5B (Revised upward \1.5B vs. previous forecast)
• Profit attributable to owners of parent : -\ 2.5B (Revised upward \0.5B vs. previous forecast)
- Imaging Products: Revised downward revenue by \13.0B and operating profit by \3.0B to reflect a
downward revision to the 1H sales plan, despite the reflection in Q1 of US tariff refunds
- Healthcare: Revised upward revenue by \1.0B and operating profit by \2.0B to reflect Q1 results and US
tariff refunds
- Industry: Revised upward revenue by \5.0B and operating profit by \2.5B to reflect Q1 results
Forecast
for the
Full Year
• Revenue
: \732.0B (Revised downward \8.0B vs. previous forecast)
• Operating profit
: \ 11.0B (Revised upward \1.0B vs. previous forecast)
• Profit attributable to owners of parent : \ 10.0B (Unchanged from previous forecast)
- Full-year guidance was revised mainly to reflect revisions to 1H forecasts
However, in Industry, we revised down 2H revenue by \1.0B and operating profit by \0.5B to reflect the
pulling forward of demand from 2H for some products
• Exchange Rate : US$ \156, EURO \181
(From Q2 onwards, US$ \155, EURO \180 (unchanged from previous forecast))
Based on first-quarter results, we revised downward our first-half revenue
forecast by 7.0 billion yen, while revising our operating profit forecast
upward by 1.5 billion yen and our profit attributable to owners of parent
forecast upward by 0.5 billion yen.
In the Imaging Products, while reflecting actual US tariff refunds in the first
quarter, we lowered our first-half sales plan and revised downward
revenue by 13 billion yen and operating profit by 3 billion yen.
In the Healthcare, based on first-quarter results, we revised upward
revenue by 1.0 billion yen and operating profit by 2.0 billion yen.
In the Industry, based on first-quarter results, we revised upward revenue
by 5.0 billion yen and operating profit by 2.5 billion yen.
For the full-year outlook, primarily reflecting the first-half revisions, we
now project revenue of 732.0 billion yen, operating profit of 11.0 billion yen,
and profit attributable to owners of parent of 10.0 billion yen. This
represents an 8.0 billion yen downward revision to revenue and a 1.0 billion
yen upward revision to operating profit, while our profit attributable to
owners of parent forecast remains unchanged.
For the second half, we are maintaining our previous forecast, except for
the acceleration of some sales in the Industry.
Furthermore, the exchange rate assumptions for the second quarter and
beyond remain unchanged from the previous forecast at 155 yen to the
dollar and 180 yen to the euro.
Forecast for the Year Ending March 31, 2027 :
Financial Highlights
FY2026/3
Previous Forecast
New Forecast
Change
Change
Actual (A)
(May 8) (B)
(Aug. 6) (C)
(C)-(A)
(C)-(B)
Revenue
677.1
740.0
732.0
+54.9
-8.0
Operating profit
-112.4
10.0
11.0
+123.4
+1.0
Billions of Yen
% vs Revenue
Profit before tax
% vs Revenue
Profit attributable to
owners of parent
% vs Revenue
-16.6%
-106.5
-15.7%
-86.0
-12.7%
1.4%
14.0
1.9%
10.0
1.4%
1.5%
14.5
2.0%
10.0
1.4%
+18.1P
+121.0
+0.1P
+0.5
+17.7P
+0.1P
+96.0
+14.1P
ROE
-14.1%
1.7%
1.7%
+15.8P
EPS
-\261.57
\30.36
\30.36
+\291.93
\40
\20
\20
-\20
\151
\155
\156
Annual Dividends
Exchange Rate:
US$
EURO
\175
\180
\181
Impact on Revenue
+16.9
+3.9
Impact on Operating profit
+1.5
+0.5
Note: The numbers of issued shares assumed for EPS forecast calculation: approx. 329.4M shares for previous forecast (May 8)
and approx. 329.4M shares for new forecast (Aug. 6).
Please turn to Slide 13.
This slide provides an overview of the key figures in our full-year earnings
forecast.
Forecast for the Year Ending March 31, 2027 :
Financial Highlights (Changes from Previous Forecast)
Previous Forecast
New Forecast
(May 8) (A)
(Aug. 6) (B)
Billions of Yen
1H
2H
Full Year
Revenue
343.0
397.0
740.0
1H
2H
336.0
396.0
Change
(B)-(A)
Full Year
1H
2H
Full Year
732.0
-7.0
-1.0
-8.0
-7.0
17.0
10.0
-5.5
16.5
11.0
+1.5
-0.5
+1.0
% vs Revenue
-2.0%
4.3%
1.4%
-1.6%
4.2%
1.5%
+0.4P
-0.1P
+0.1P
Profit before tax
-5.0
19.0
14.0
-4.0
18.5
14.5
+1.0
-0.5
+0.5
% vs Revenue
-1.2%
4.7%
2.0%
+0.3P
-0.1P
+0.1P
Operating profit
-1.5%
4.8%
1.9%
Profit attributable to
owners of parent
-3.0
13.0
10.0
-2.5
12.5
10.0
+0.5
-0.5
% vs Revenue
-0.9%
3.3%
1.4%
-0.7%
3.2%
1.4%
+0.2P
-0.1P
ROE
1.7%
1.7%
EPS
\30.36
\30.36
\20
\20
Annual Dividends
Exchange Rate: US$
\155
\155
\155
\157
\155
\156
+\2
±\0
+\1
EURO
\180
\180
\180
\183
\180
\181
+\3
±\0
+\1
Note: The numbers of issued shares assumed for EPS forecast calculation: approx. 329.4M shares for previous forecast (May 8)
and approx. 329.4M shares for new forecast (Aug. 6).
Slide 14 presents a table comparing our full-year earnings forecast with
the previous forecast, broken down into the first and second halves of the
fiscal year.
Forecast for the Year Ending March 31, 2027 :
Forecast by Segment
Billions of Yen
Imaging Products
Business
Precision Equipment
Business
Revenue
Operating profit
Previous Forecast
New Forecast
Change
Change
(May 8) (B)
(Aug. 6) (C)
(C)-(A)
(C)-(B)
290.1
17.2
303.0
16.0
290.0
13.0
-0.1
-4.2
-13.0
-3.0
5.9%
% vs Revenue
Revenue
Operating profit
167.2
-4.5
Operating profit
111.9
1.5
Industry Business
Operating profit
76.1
9.0
Digital Manufacturing
Business
Others
(incl. Corporate expenses, etc.)
Operating profit
% vs Revenue
Revenue
Operating profit
Revenue
Consolidated
Operating profit
28.0
-106.2
-378.4%
3.6
-29.3
677.1
-112.4
% vs Revenue
-16.6%
+16.1
+6.5
+11.9
+5.0
-11.8%
4.0
-32.0
740.0
10.0
+1.6P
+6.0
+102.2
-11.8%
4.0
-32.0
732.0
11.0
1.4%
+1.6P
+4.0
+2.0
+4.1P
15.9%
34.0
-4.0
+1.0
+2.0
+4.9P
6.3%
14.3%
+9.1P
6.4%
88.0
14.0
34.0
-4.0
-0.8P
+20.8
+16.5
128.0
8.0
4.7%
11.8%
% vs Revenue
Revenue
6.4%
84.0
12.0
-1.4P
4.5%
188.0
12.0
127.0
6.0
1.4%
% vs Revenue
Revenue
5.3%
188.0
12.0
-2.7%
% vs Revenue
Revenue
Healthcare Business
FY2026/3
Actual (A)
+366.6P
+0.4
-2.7
+54.9
+123.4
1.5%
-8.0
+1.0
+18.1P
Note: FY2026/3 actual have been re-stated to reflect segmentation changes.
Please proceed to Slide 15.
This slide presents a summary of the full-year outlook by segment, along
with year-on-year comparisons and comparisons to the previous forecast.
+0.1P
Forecast for the Year Ending March 31, 2027 :
Forecast by Segment (Changes from Previous Forecast)
Billions of Yen
Imaging Products
Business
Precision Equipment
Business
Healthcare Business
Industry Business
Digital Manufacturing
Business
Others
Corporate
expenses, etc.
Consolidated
Revenue
Operating profit
Revenue
Operating profit
Revenue
Operating profit
Revenue
Operating profit
Revenue
Operating profit
Revenue
Operating profit
Operating profit
Previous Forecast
(May 8) (A)
Full
1H
2H
Year
143.0
160.0
303.0
7.5
8.5
16.0
89.0
99.0
188.0
2.5
9.5
12.0
58.0
69.0
127.0
0.0
6.0
6.0
34.0
50.0
84.0
2.5
9.5
12.0
17.0
17.0
34.0
-2.5
-1.5
-4.0
2.0
2.0
4.0
-1.0
3.0
2.0
-16.0
-18.0
-34.0
New Forecast
(Aug. 6) (B)
Change
(B)-(A)
1H
2H
160.0
8.5
99.0
9.5
69.0
6.0
49.0
9.0
17.0
-1.5
2.0
3.0
-18.0
Full
Year
290.0
13.0
188.0
12.0
128.0
8.0
88.0
14.0
34.0
-4.0
4.0
2.0
-34.0
-13.0
-3.0
+1.0
+2.0
+5.0
+2.5
-1.0
-0.5
Full
Year
-13.0
-3.0
+1.0
+2.0
+4.0
+2.0
1H
2H
130.0
4.5
89.0
2.5
59.0
2.0
39.0
5.0
17.0
-2.5
2.0
-1.0
-16.0
Broken out: Expense related
to investment in growth
-7.5
-8.0
-15.5
-7.5
-8.0
-15.5
Broken out: Expense for
administration department
-8.5
-8.5
-17.0
-8.5
-8.5
-17.0
Broken out: Elimination
of intersegment transactions
0.0
-1.5
-1.5
0.0
-1.5
-1.5
343.0
-7.0
397.0
17.0
740.0
10.0
336.0
-5.5
396.0
16.5
732.0
11.0
-7.0
+1.5
-1.0
-0.5
-8.0
+1.0
Revenue
Operating profit
The yellow box on Slide 16 shows the first-half and second-half forecasts
by segment.
Forecast for the Year Ending March 31, 2027 :
Imaging Products Business
• Vs. Previous Forecast:
Revenue
Operating Profit
300.0
Revenue Down \13.0B, Operating Profit Down \3.0B
• YoY: Revenue Down \0.1B, Operating Profit Down \4.2B
400.0
\400.0B
303.0
290.1
290.0
【Vs. Previous Forecast】
200.0
- Revised downward DCIL market size projections by 300 thousand units to
reflect recent demand contraction mainly in China. Nevertheless, we
expect the DCIL market to remain solid over the medium- to long-term
100.0
- Revenue was revised downward by \13.0B, reflecting a reduction in 1H
sales plan based on Q1 results and changes to market projections
17.2
16.0
13.0
FY2026/3
Actual
FY2027/3
Forecast
(May 8)
FY2027/3
Forecast
(Aug. 6)
0.0
Digital Camera-Interchangeable Lens type
(units: 1,000)
Market Scale
7,040
7,000
Nikon
910
900
Interchangeable Lens (units:1,000)
Market Scale 10,670
10,000
Nikon
1,300
1,300
- Operating profit was revised downward by \3.0B on downward revisions
to the 1H sales plan, despite US tariff refunds
【YoY】
- Revenue to be mostly flat YoY as FX tailwinds offset lower sales volumes
6,700
850
10,000
1,250
- Operating profit to decline as lower sales volumes and higher memory
prices outweigh FX tailwinds, the disappearance of one-time costs
booked in the previous year, and US tariff refunds
Note: FY2026/3 actual have been re-stated to reflect segmentation changes.
Next, I will explain the full-year forecasts for each segment.
First, the Imaging Products.
We expect the DCIL market to remain robust over the medium- to longterm. In the near term, however, demand is softening, particularly in China,
due to the economic slowdown. Accordingly, we revised our market
forecast to 6.7 million units, down 0.3 million units from our previous
forecast.
We also revised our sales volume forecasts: camera bodies down 50
thousand units from the previous forecast to 850 thousand units and
lenses down 50 thousand units to 1.25 million units.
Based on first-quarter results and the revised sales plan, we lowered our
revenue forecast by 13 billion yen from the previous projection to 290.0
billion yen.
We revised downward operating profit by 3 billion yen from the previous
forecast, as the impact of the revised sales plan more than offsets the
benefit of US tariff refunds.
On a year-on-year basis, revenue should remain roughly flat, as foreign
exchange tailwinds will offset the impact of lower sales volumes. Operating
profit should decline due to the impact of lower sales volumes and soaring
memory prices, despite foreign exchange effects, the absence of the 3.2
billion yen in one-time costs recorded in the previous year, and the US
tariff refund.
Forecast for the Year Ending March 31, 2027 :
Precision Equipment Business
• Vs. Previous Forecast: Unchanged
250.0
\250.0B
167.2
Revenue
Operating Profit
188.0
188.0
【Vs. Previous Forecast】
- Guidance remains unchanged because business trends in line with plan
150.0
【YoY】
50.0
-50.0
• YoY: Revenue Up \20.8B, Operating Profit Up \16.5B
12.0
12.0
FY2027/3
Forecast
(May 8)
FY2027/3
Forecast
(Aug. 6)
-4.5
FY2026/3
Actual
FPD Lithography Systems (units)
Market Scale
67
50
(CY25/26)
Nikon
32
27
Semiconductor Lithography Systems
(New/Refurbished, units)
Market Scale
570
580
(CY25/26)
Nikon
22/5
23/6
50
- Revenue to grow as a decline in sales volumes of FPD lithography systems
is expected to be offset by an increase in semiconductor ArF dry and
immersion lithography systems sales volumes
- Operating profit to grow on the disappearance of one-time costs from
previous year and increased sales of ArF dry and immersion lithography
systems
- In Q1, we booked the first sale of our new ArF dry lithography system
"NSR-S333F"
27
580
23/6
Slide 18 presents the outlook for the Precision Equipment.
There are no changes from the previous forecast. Furthermore, the
majority of the inventory write-down recorded in the first quarter are
expected to be recovered through order intake in the second half of the
year.
Year-on-year, revenue should increase as the decline in FPD lithography
system unit sales is offset by an increase in ArF lithography system unit
sales.
Operating profit should increase, driven by the absence of the one-time
costs recorded in the previous year and the contribution from increased
sales of ArF lithography systems.
In the first quarter, we completed installation and recognized the related
revenue for our new ArF dry lithography system, the NSR-S333F.
Forecast for the Year Ending March 31, 2027 :
Healthcare Business
• Vs. Previous Forecast:
Revenue
140.0
\140.0B
120.0
Operating Profit
128.0
127.0
Revenue Up \1.0B, Operating Profit Up \2.0B
• YoY: Revenue Up \16.1B, Operating Profit Up \6.5B
【Vs. Previous Forecast】
111.9
- Revenue was revised upward by \1.0B to reflect Q1 results
100.0
- Operating profit was revised upward by \2.0B on better-than-expected Q1
sales, US tariff refunds, and restrained expenses
80.0
60.0
【YoY】
40.0
- In Life Science Solutions, revenue to grow as stagnant sales to US
academia are expected to recover, and increased sales are also expected
in Asia and China
20.0
1.5
6.0
8.0
FY2027/3
Forecast
(May 8)
FY2027/3
Forecast
(Aug. 6)
0.0
FY2026/3
Actual
- In Eye Care Solutions, performance to be in line with previous year as
markets in Europe and the US trend solidly
- In Contract Cell Development and Manufacturing, revenue to grow driven
by expansion of existing projects
- Operating profit to grow on increased revenues, the decrease of one-time
costs in Eye Care Solutions*, and US tariff refunds
- One-time costs in Eye Care Solutions: \2.9B (FY2026/3 actual), Approx. \1.0B (FY2027/3 forecast).
See Contingent Liabilities (page 15) of our Consolidated Financial Results for details on the one-time costs.
Next, please turn to Slide 19. I will now explain the Healthcare.
Compared with our previous forecast, and based on first-quarter results,
we revised upward our revenue forecast by 1.0 billion yen and our
operating profit forecast by 2.0 billion yen.
Compared to the previous year, Life Science Solutions should see
increased revenue due to a recovery in sales to US academia, as well as
anticipated sales growth in Asia and China.
In Eye Care Solutions, performance should remain steady, particularly in
the European and US markets, and revenue is projected to be in line with
the previous year.
In Contract Cell Development & Manufacturing, we expect revenue to
increase on the expansion of existing projects.
Operating profit should increase on higher revenue, as well as a decrease
in one-time costs related to Eye Care Solutions and US tariff refunds.
Forecast for the Year Ending March 31, 2027 :
Industry Business
• Vs. Previous Forecast:
Revenue
Operating Profit
\100.0B
100.0
88.0
84.0
80.0
Revenue Up \4.0B, Operating Profit Up \2.0B
• YoY: Revenue Up \11.9B, Operating Profit Up \5.0B
【Vs. Previous Forecast】
76.1
- Revised upward revenue by \4.0B and operating profit by \2.0B to reflect
Q1 results
60.0
【YoY】
- Revenue to grow on increased sales of EUV related components and other
customized products
40.0
20.0
9.0
12.0
14.0
- In optical parts and optical components, as well as the field of inspection
and measurement equipment such as video measuring systems, X-ray and
CT systems, we expect solid performance, supported by strengthened
sales expansion efforts
- FPD photomask substrates are expected to see a decline in reaction to the
increase in sales in the previous year
0.0
FY2026/3
Actual
FY2027/3
Forecast
(May 8)
FY2027/3
Forecast
(Aug. 6)
- Operating profit to grow on increased revenue and the disappearance of
one-time costs incurred in the previous year, despite increased expenses
resulting from strengthening sales activities and the launch of new
products
Note: FY2026/3 actual have been re-stated to reflect segmentation changes.
Slide 20 covers the Industry.
Compared with our previous forecast, and based on first-quarter results,
we revised upward our revenue forecast upward by 4.0 billion yen and our
operating profit forecast by 2.0 billion yen.
Compared to the previous year, revenue should increase due to higher
sales of EUV-related components and other customized products.
We also expect steady demand for optical parts and optical components as
well as inspection and measurement equipment, including X-ray and CT
inspection systems, as we strengthen our sales executions.
We expect a decline in FPD photomask substrates in reaction to the strong
performance in the previous year.
We forecast operating profit growth driven by higher revenue and the
absence of one-time costs incurred in the previous year partially offset by
increased expenses related to strengthened sales activities and new
product launches.
Forecast for the Year Ending March 31, 2027 :
Digital Manufacturing Business
• Vs. Previous Forecast: Unchanged
40.0
\40.0B
30.0
Revenue
Operating Profit
34.0
34.0
• YoY: Revenue Up \6.0B, Operating Profit Up \102.2B
【Vs. Previous Forecast】
28.0
- Guidance remains unchanged because business trends in line with plan
20.0
【YoY】
10.0
0.0
-4.0
-10.0
-4.0
- The overall market for metal 3D printers is expected to see increased
demand for large-format metal 3D printers mainly in the defense and
space segments
- Revenue to grow on further sales expansion of SLMʼs large-format metal
3D printers mainly in the defense and space segments
-20.0
- Operating losses to contract substantially on increased revenues, the
disappearance of \91.3B in one-time costs from the previous year, a \2.6B
reduction in amortization costs of intangible assets, and restructuring
benefits
-30.0
-106.2
-40.0
-120.0
FY2026/3
Actual
FY2027/3
Forecast
(May 8)
FY2027/3
Forecast
(Aug. 6)
- SLM to turn profitable in FY2027/3. Total segment to turn profitable in
FY2028/3
Note: Intangible-asset amortization costs resulting from the Nikon SLM Solutions acquisition: \3.1B (FY2026/3 results), \0.5B (FY2027/3 forecast)
Slide 21 covers the Digital Manufacturing.
There are no changes from the previous forecast.
Year-on-year, demand for large-format metal 3D printers should continue
expanding, primarily in the defense and aerospace markets.
Revenue should increase, driven primarily by further sales growth of SLMʼs
large-format metal 3D printers in the defense and aerospace segments.
Operating profit should improve significantly, reflecting profit growth from
higher revenue, the absence of 91.3 billion yen in one-time costs incurred
in the previous year, a 2.6 billion yen decrease in amortization of intangible
assets, and the benefits of structural reforms.
There is no change to the plan for SLM to return to profitability this fiscal
year on a standalone basis or for the entire business segment to return to
profitability by the fiscal year ending March 2028.
Closing Statement
That concludes my explanation. To summarize this first quarter.
At the company-wide level, growth in non-Imaging businesses should
offset the decline in Imaging revenue. Furthermore, US tariff refunds
should offset the inventory write-down in Precision Equipment to remain
our operating profit at almost the same as the previous year.
Based on the first-quarter results, we revised our full-year earnings
forecast, primarily due to a reassessment of first-half performance.
Full-year operating profit has been revised upward by 1.0 billion yen to 11.0
billion yen.
While there are variations across different businesses, our outlook for the
second half of the year remains largely unchanged from our previous
forecast in May. In addition to the impact of US tariffs and the situation in
the Middle East, there are still uncertainties regarding the business
environment and customer trends in some of the businesses. We will
continue to strive to control costs company-wide while also focusing on
understanding product demand and market trends, and securing and
expanding orders from key customers.
We ask for the continued support of our shareholders and investors.
Thank you for your attention.
Reference Data
Business Segments and Major Products
Segment
Imaging
Products
Business
Description
Major products
Digital camera-interchangeable lens type
Interchangeable lens
Digital cinema camera
Digital Cinema Camera [ZR]
Precision
Equipment
Business
FPD lithography system
Semiconductor lithography system
Digital lithography system
Alignment station
Healthcare
Business
Biological microscope
(Life Science Solutions)
Retinal diagnostic imaging system
(Eye Care Solutions)
Contract Cell Development and Manufacturing
Industry
Business
Digital
Manufacturing Business
EUV related components
Optical parts, Optical components
Encoders, Measuring and inspection systems
Photomask substrates for FPD
Mirrorless Camera [Zf Silver]
FPD Lithography
System
[FX-88SL]
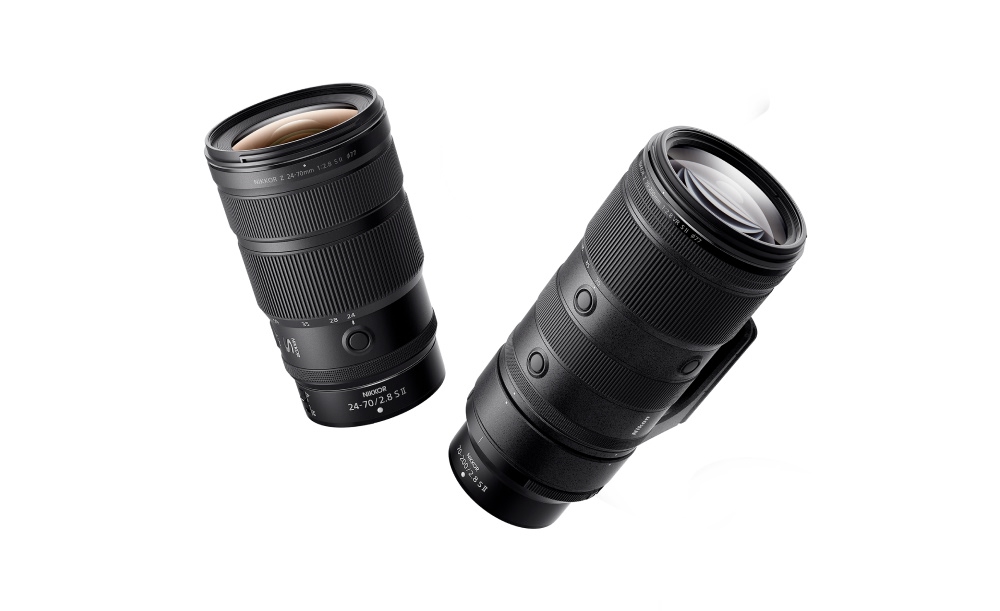
[NIKKOR Z 70-200mm f/2.8 VR S II]
Optical Components
Metal 3D printer
Optical processing machine
3D scanner
Contract material processing
Metal 3D Printer [NXG 600E]
Digital Lithography
System
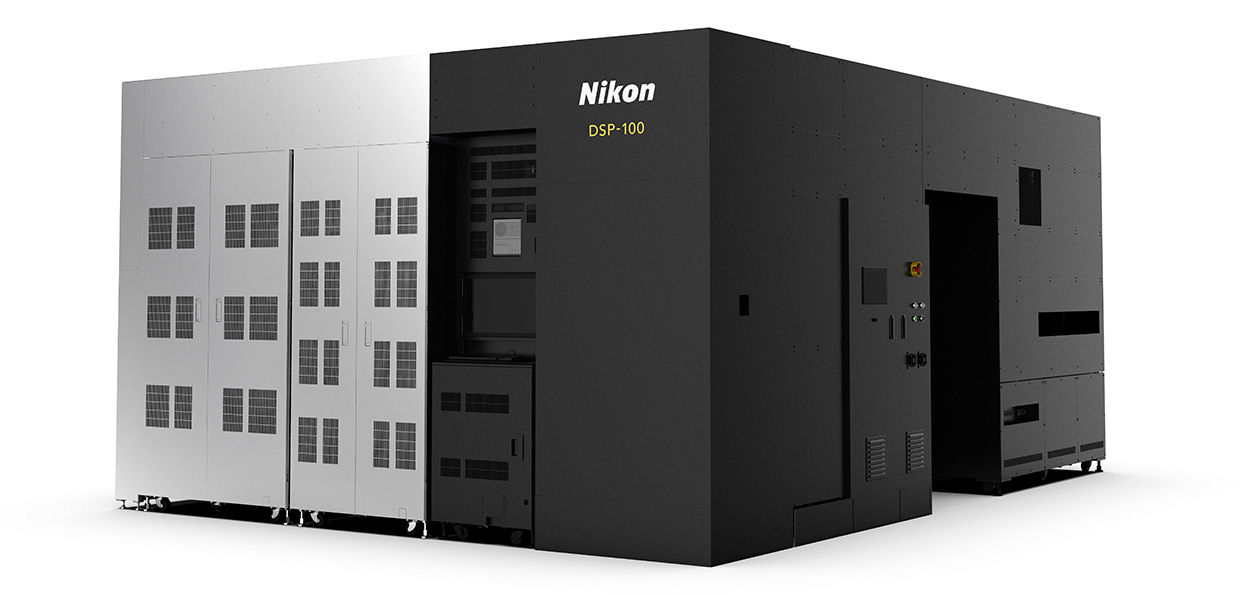
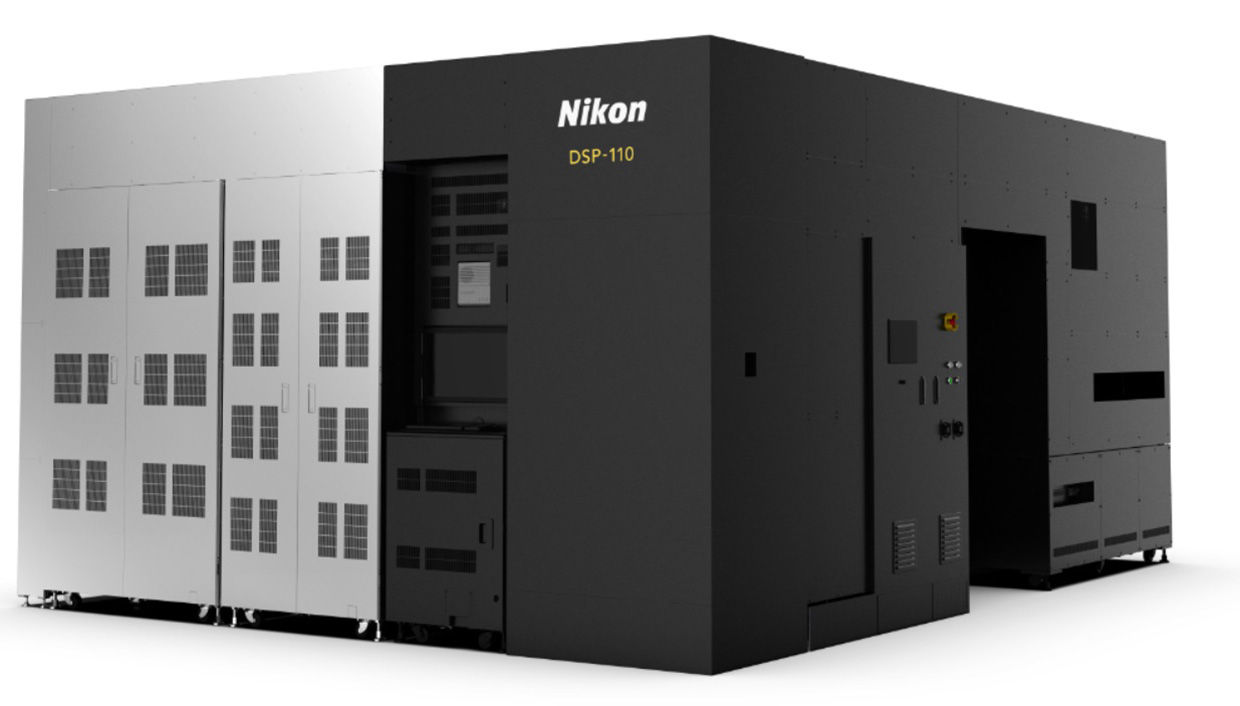
[DSP-100]
ArF Immersion Scanner
[NSR-S636E]
Ultra-Widefield
Retinal Diagnostic Imaging
System with
Integrated UWF-Guided Swept
Source OCT
「Silverstone」
Confocal Microscope System
[AX/AX R]
Multi-turn External BatteryFree Absolute Encoder
[MAR-M700MFA]
[V-RAPTOR [XE] Z Mount]
Alignment Station
[Litho Booster 1000]
Contract Cell
Development and
Manufacturing
Video Measuring
System
[NEXIV VMF-K
Series]
Laser Radar
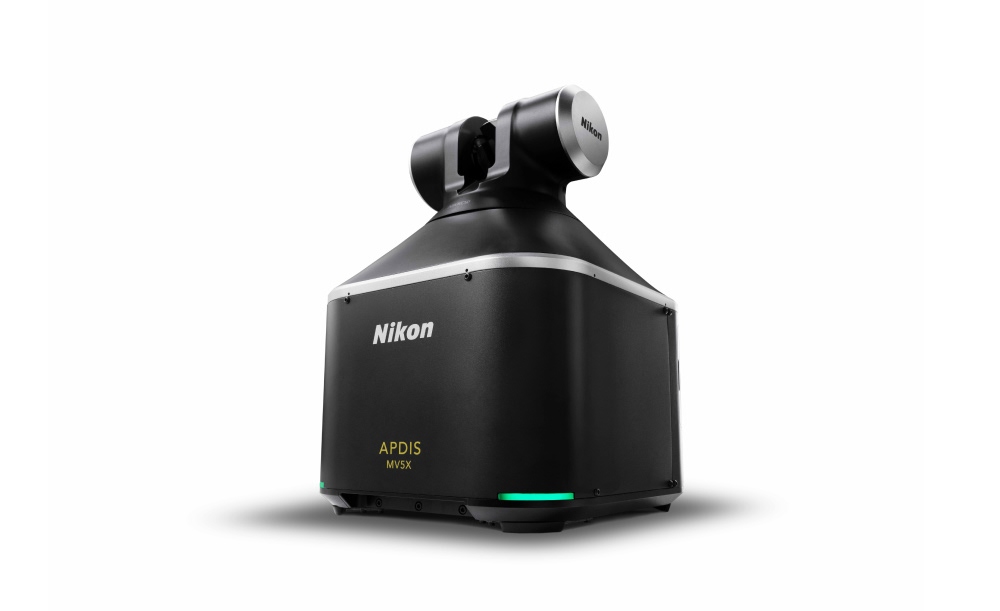
[APDIS MV5X]
Material Processing Machine
[Lasermeister LM300A]
Versatile Large-Envelope
X-ray and CT System
[VOXLS 40 C 450]
3D Scanner
[Lasermeister SB100]
Photomask
Substrates for FPD
Contract Material Processing
The Year Ended March 31, 2026 :
One-Time Profit/Losses by Segment
FY2026/3
Billions of Yen
Q1
Q2
Q3
Q4
Full Year
Details
Imaging Products
Business
-3.2
-3.2
Costs related to the sale of MRMC shares -3.2
Precision Equipment
Business
+2.1
-11.3
-9.2
Q2: Gain from transfer of business +2.9 and
restructuring costs (optimization of service bases) -0.8
Q4: fixed-asset impairment losses -5.7,
inventory write-downs -5.5
Healthcare Business
-0.5
-0.4
-1.8
-0.1
-2.9
Q1-Q4: Eye Care Solutions investigation costs, etc. -1.4
Q3: Eye Care Solutions provision -1.4
Industry Business
-2.0
-2.0
Avonix* fixed assets impairment losses -1.4,
restructuring costs -0.6
Digital Manufacturing
Business
-90.6
-0.6
-91.3
Q3: Impairment losses on fixed assets -90.6
Q4: Restructuring costs -0.6
(incl. Corporate expenses,
etc.)
-0.6
-0.5
-0.1
+4.3
+3.0
Q1-Q3: Expenses related to footprint reorganization -1.2
Q4: NCC** fixed-asset impairment losses -0.6,
Capital gain on sale of idle land +4.9
Consolidated
-1.1
+1.1
-92.5
-13.0
-105.6
Others
- Avonix Imaging, Inc. was acquired in 2023 and is mainly in the business of the development and manufacture of X-ray and CT systems
** Nikon Creates (NCC) is mainly in the business of the planning, filming and production of next-generation imaging contents
Forecast for the Year Ending March 31, 2027 :
Financial Highlights
FY2024/3
FY2025/3
Full Year
Full Year
1H
2H
Full Year
1H
2H
Full Year
Revenue
717.2
715.2
312.9
364.2
677.1
336.0
396.0
732.0
Operating profit
39.7
2.4
-4.8
-107.6
-112.4
-5.5
16.5
11.0
Billions of Yen
% vs Revenue
Profit before tax
% vs Revenue
Profit attributable to
owners of parent
% vs Revenue
5.5%
42.6
5.9%
32.5
4.5%
0.3%
4.5
FY2026/3
-1.5%
-5.2
0.6%
-1.7%
6.1
5.3
0.9%
1.7%
-29.5%
-101.3
-27.8%
-91.3
-25.1%
FY2027/3 Forecast
-16.6%
-106.5
-15.7%
-86.0
-12.7%
-1.6%
-4.0
-1.2%
-2.5
-0.7%
4.2%
18.5
4.7%
12.5
3.2%
FCF
-10.6
-21.7
-17.0
ROE
5.0%
0.9%
-14.1%
1.7%
EPS
\94.03
\17.86
-\261.57
\30.36
Annual Dividends
\50
\50
Exchange Rate: US$
\145
\157
\153
\164
EURO
\40
\146
\168
Note: The numbers of issued shares assumed for EPS forecast calculation: approx. 329.4M shares
\156
\182
1.5%
14.5
2.0%
10.0
1.4%
\20
\151
\175
\157
\183
\155
\180
\156
\181
Forecast for the Year Ending March 31, 2027 :
Financial Highlights
1H
FY2026/3
Actual (A)
2H
Full Year
1H
Revenue
312.9
364.2
677.1
336.0
396.0
Operating profit
-4.8
-107.6
-112.4
-5.5
16.5
Billions of Yen
% vs Revenue
Profit before tax
% vs Revenue
Profit attributable to
owners of parent
% vs Revenue
-1.5%
-5.2
-1.7%
5.3
1.7%
-29.5%
-101.3
-27.8%
-91.3
-25.1%
-16.6%
-106.5
-15.7%
-86.0
-12.7%
-1.6%
-4.0
-1.2%
-2.5
-0.7%
FY2027/3
Forecast (B)
2H
Full Year
4.2%
18.5
4.7%
12.5
3.2%
1H
Change
(B)-(A)
2H
Full Year
732.0
+23.1
+31.8
+54.9
11.0
-0.7
+124.1
+123.4
1.5%
14.5
2.0%
10.0
1.4%
-0.1P
+1.2
+0.5P
-7.8
-2.4P
+33.7P
+119.8
+32.5P
+103.8
+28.3P
ROE
-14.1%
1.7%
+15.8P
EPS
-\261.57
\30.36
+\291.93
\40
\20
-\20
Annual Dividends
+18.1P
+121.0
+17.7P
+96.0
+14.1P
Exchange Rate: US$
\146
\156
\151
\157
\155
\156
+\11
-\1
+\5
EURO
\168
\182
\175
\183
\180
\181
+\15
-\2
+\6
Note: The numbers of issued shares assumed for EPS forecast calculation: approx. 329.4M shares
Forecast for the Year Ending March 31, 2027 :
Forecast by Segment
Billions of Yen
Imaging Products
Business
Revenue
Precision Equipment
Business
Revenue
Healthcare
Business
Revenue
Industry Business
Digital Manufacturing
Business
Others
Operating profit
Operating profit
Operating profit
Revenue
Operating profit
Revenue
Operating profit
Revenue
Operating profit
Operating profit
Corporate
expenses, etc.
Consolidated
Broken out: Expense related
to investment in growth
Broken out: Expense for
administration department
Broken out: Elimination of
intersegment transactions
Revenue
Operating profit
FY2026/3
Actual (A)
1H
2H
Full Year
145.0
145.1
290.1
15.4
1.8
17.2
69.8
97.4
167.2
3.0
-7.5
-4.5
51.2
60.7
111.9
0.3
1.2
1.5
35.0
41.1
76.1
4.9
4.1
9.0
9.8
18.2
28.0
-8.9
-97.3
-106.2
1.8
1.8
3.6
-0.5
1.9
1.4
-19.0
-11.7
-30.7
FY2027/3
Forecast (B)
1H
2H
Full Year
130.0
160.0
290.0
4.5
8.5
13.0
89.0
99.0
188.0
2.5
9.5
12.0
59.0
69.0
128.0
2.0
6.0
8.0
39.0
49.0
88.0
5.0
9.0
14.0
17.0
17.0
34.0
-2.5
-1.5
-4.0
2.0
2.0
4.0
-1.0
3.0
2.0
-16.0
-18.0
-34.0
1H
-15.0
-10.9
+19.2
-0.5
+7.8
+1.7
+4.0
+0.1
+7.2
+6.4
+0.2
-0.5
+3.0
Change
(B)-(A)
2H
Full Year
+14.9
-0.1
+6.7
-4.2
+1.6
+20.8
+17.0
+16.5
+8.3
+16.1
+4.8
+6.5
+7.9
+11.9
+4.9
+5.0
-1.2
+6.0
+95.8
+102.2
+0.2
+0.4
+1.1
+0.6
-6.3
-3.3
-8.4
-9.4
-17.8
-7.5
-8.0
-15.5
+0.9
+1.4
+2.3
-8.9
-4.3
-13.2
-8.5
-8.5
-17.0
+0.4
-4.2
-3.8
-1.7
2.0
0.3
0.0
-1.5
-1.5
+1.7
-3.5
-1.8
312.9
-4.8
364.2
-107.6
677.1
-112.4
336.0
-5.5
396.0
16.5
732.0
11.0
+23.1
-0.7
+31.8
+124.1
+54.9
+123.4
Note: FY2026/3 actual have been re-stated to reflect segmentation changes.
1st Quarter of the Year Ending March 31, 2027 :
Quarterly Performance by Segment
FY2026/3
Imaging Products Business
Precision Equipment
Business
Healthcare Business
Industry Business
Digital Manufacturing
Business
Others
Q2
65.0
4.3
36.0
1.2
28.1
2.1
19.9
3.3
4.8
-4.8
1.0
-0.3
-9.4
Q3
84.1
6.0
34.8
-2.4
27.8
-0.9
16.7
1.2
6.8
-94.5
0.9
-1.0
-7.1
Q4
61.0
-4.2
62.6
-5.1
32.9
2.1
24.4
2.9
11.4
-2.8
0.9
2.9
-4.6
Q1
72.9
8.1
38.2
-2.6
27.7
1.0
17.9
3.0
6.3
-2.1
0.9
0.3
-8.6
Broken out: Expense related
to investment in growth
-4.1
-4.3
-4.2
-5.2
-3.1
Broken out: Expense for
administration department
-4.0
-4.9
-4.1
-0.2
-3.5
Revenue
Operating profit
Revenue
Operating profit
Revenue
Operating profit
Revenue
Operating profit
Revenue
Operating profit
Revenue
Operating profit
Operating profit
Corporate expenses, etc.
Broken out: Elimination of
intersegment transactions
Consolidated
FY2027/3
Q1
80.0
11.1
33.8
1.8
23.1
-1.8
15.1
1.6
5.0
-4.1
0.8
-0.2
-9.6
Billions of Yen
Revenue
Operating profit
Note: FY2026/3 actual have been re-stated to reflect segmentation changes.
-1.4
-0.3
1.3
0.7
-1.9
158.1
-1.1
154.8
-3.7
171.0
-98.8
193.2
-8.8
164.1
-0.9
1st Quarter of the Year Ending March 31, 2027 :
Financial Position
LIABILITIES/EQUITY
ASSET
1,250
\1,250B
\1,250B
1,250
1,110.5
1,000
163.5
125.4
307.5
250
1,110.5
1,075.0
1,097.1
158.0
157.0
Cash & cash
equivalents
127.4
121.9
Trade & other
receivables
332.8
338.2
Inventories
28.1
34.4
Other current financial
/current assets
428.5
445.4
Non-current assets
26/3
26/6
164.7
115.9
23.6
321.5
28.6
490.2
507.5
25/3
25/6
1,138.4
1,075.0
1,097.1
67.3
77.6
Advances
received
239.8
238.9
Interest-bearing
debt
179.6
185.7
Other
liabilities
588.1
594.7
Total equity
25/6
26/3
26/6
56.3%
54.6%
54.1%
68.1
82.0
213.6
235.3
189.4
178.3
639.2
642.7
25/3
57.4%
1,000
750
750
500
1,138.4
500
250
0
0
Equity ratio
Note: Cash and cash equivalents exclude time deposits with maturities of three months or more.
Equity ratio is the ratio of equity attributable to owners of parent to total assets.
Capital Expenditures, Depreciation & Amortization, and Inventories
CAPITAL EXPENDITURES,
DEPRECIATION & AMORTIZATION
\80B
80
75.0
70.7
70
69.3
300
59.8
250
42.1
44.1
40
30
332.8
338.2
31.2
33.8
Others
19.6
27.0
20.7
28.6
Industry
25.0
26.2
27.0
Healthcare
116.7
128.9
127.4
125.1
Precision Equipment
98.2
94.7
101.1
102.8
Imaging Products
25/3
25/6
26/3
26/6
\350B
350
307.5
60
50
BREAKDOWN OF INVENTORIES
43.0
43.0
35.6
33.8
13.2
25.7
Digital Manufacturing
200
150
29.0
30.7
12.1
25.3
24.3
321.5
100
20
50
10
0
0
23/3
24/3
Capital expenditures
25/3
26/3
27/3
Forecast
Depreciation & amortization
Note: Capital expenditures include right-of-use assets.
Depreciation & amortization include right-of-use assets, depreciation of property, plant and equipment and amortization of intangible assets
obtained by business combination.
Note: FY2026/3 actual have been re-stated to reflect segmentation changes.
1st Quarter of the Year Ending March 31, 2027 :
Revenue Breakdown
BY REGION
BY SEGMENT
Billions of Yen
Billions of Yen
Digital
Others
Manufacturing
Others
4% 1%
Industry
11%
6.3
17.9
10%
Healthcare
17%
27.7
Precision
Equipment
0.9
Imaging
27/3 Products
3% 1%
15.1
15%
23.1
21%
27/3
15%
17%
28.4
26/3
51%
80.0
25.4
16%
44%
5.0 0.8
25.4
72.9
China
25%
Japan
26/3
14%
21.9
26%
26%
26%
40.8
41.5
42.2
40.9
18%
33.8
28.4
23%
16%
38.2
27.0
Note: The outside and inside circles show the breakdown of FY2027/3 revenue of \164.1B and FY2026/3 revenue of \158.1B, respectively.
Note: FY2026/3 actual have been re-stated to reflect segmentation changes.
Europe
United
States
Forecast for the Year Ending March 31, 2027 :
R&D Expenditures
R&D EXPENDITURES BREAKDOWN
R&D EXPENDITURES
\90B
90
80
76.5
80.1
77.1
Corporate
(Undistributed)
73.5
70.0
70
15.0%
60
Digital
Manufacturing
12%
8.5
9%
14%
6.5
50
40
Billions of Yen
20.0%
11.2%
10.7%
11.2%
11.4%
Industry
10.0%
5.0
10.0%
30
7%
12%
Healthcare
0
5.0%
23/3
24/3
25/3
26/3
27/3
Forecast
R&D Expenditures
R&D vs
Revenue (%)
Note: R&D expenditures include capitalization of some development expenditures.
Note: FY2026/3 actual have been re-stated to reflect segmentation changes.
6% 4.7
10%
20
10
10.8
10% 7.5
7.9
27/3
Forecast
26/3
33% Imaging
32%
24.5
Products
24.4
28%
21.6
8.5
28%
20.5
Precision
Equipment
Cash Flow History
\100B
100
54.9
49.9
50
22.9
18.0
0
30.7
2.4
0.0
4.9
-4.9
48.2
39.7
31.3
30.9
-10.6
-0.3
-4.4
-21.7
-8.9
-12.6
-19.8
-26.1
-50
-41.4
-56.2
-56.2
-69.9
-100
-112.1
-112.1
-150
21/3
Operating Profit
22/3
23/3
-112.4
24/3
25/3
Cash Flows from
Net cash used
Net cash used
operating activities
in investing activities
in financing activities
0.8
-17.0
26/3
Free cash flow
Note: FCF + CF from financing activities + Effect of exchange rate changes on cash and cash equivalents = net increase (decrease) in cash and cash equivalents
Imaging Products Business : Sales Units
SALES IN UNITS BY PRODUCT CATEGORY
500
500K Units
400
370
340
300
200
320
280
270
210
200
370
370
370
360
330
230
170
250
290
260
160
260
270
210
180
180
120
100
0
DCIL(Digital Camera-Interchangeable Lens Type)
310
300
270
230
220
170
280
270
Interchangeable Lens
210
170
Forecast for the Year Ending March 31, 2027 :
Precision Equipment Business Sales Units
SEMICONDUCTOR LITHOGRAPHY
SYSTEMS SALES BY TECHNOLOGY
FPD LITHOGRAPHY SYSTEMS SALES
BY GENERATION
60 Units
60
G5/6
系列1
G7/8
系列2
(INCL. REFURBISHED)
60 Units
60
G10.5
系列3
i-line,
系列1
etc.
45
38
40
32
29
22
7
20
5
17
0
40
15
16
16
4
1
11
27
1
27
1
16
10
11
8
20
17
10
ArF
immersion
系列4
46
4
27
16
ArF
dry
系列3
8
6
G10.5
G7/8
4
KrF
系列2
23
28
27
3
5
2
3
4
18
20
29
29
3
3
ArF immersion
7
7
ArF dry
2
2
KrF
17
17 i-line, etc.
G5/6
0
23/3
24/3
25/3
26/3
27/3
27/3
23/3
24/3
25/3
26/3
27/3
27/3
Actual
Actual
Actual
Actual
Forecast
Forecast
Actual
Actual
Actual
Actual
Forecast
Forecast
(May 8)
(Aug. 6)
(May 8)
(Aug. 6)
Note: “i-line, etc.” part in numbers of semiconductor lithography systems sales include sales numbers of the “Mini Step & Repeat Exposure System.”
The unit sales of new semiconductor lithography systems are 27 units in FY2023/3, 31 units in FY2024/3, 18 units in FY2025/3, 22 units in FY2026/3,
and 23 units (forecast) in FY2027/3.
Precision Equipment Business : Sales Units
FPD LITHOGRAPHY SYSTEMS SALES IN UNITS
BY GENERATION
20 units
20
15
12
10
10
7
5
0
9
2
6
6
3
1
4
5
2
1
3
7
3
5
3
2
1
1
2
2
G5/6
4
10
7
5
5
2
7
7
1
8
7
5
1
G7/8
10
5
3
G10.5
6
8
7
4
3
4
4
7
3
5
5
Precision Equipment Business : Sales Units
SEMICONDUCTOR LITHOGRAPHY SYSTEMS SALES
IN UNITS BY TECHNOLOGY(INCL. REFURBISHED)
20
19
20 units
20
15
10
5
10
8
8
2
1
1
1
2
1
3
4
0
6
5
1
3
5
3
12
1
12
10
2
4
2
1
4
2
1
1
i-line, etc.
2
4
7
6
4
7
4
4
KrF
15
2
1
2
3
11
2
16
ArF dry
1
1
2
2
2
3
2
2
11
ArF immersion
Note: “i-line, etc.” part in numbers of semiconductor lithography systems sales include sales numbers of the “Mini Step & Repeat Exposure System.”
5
3
6
3
9
2
1
2
Forecast for the Year Ending March 31, 2027 :
Foreign Exchange Impact
Exchange Rate
Financial Impact from Fluctuation by 1 yen
FY2027/3
Forecast for Q2〜Q4
Revenue
Q2〜Q4
Operating Profit
Q2〜Q4
US$
\155
Approx. \1.8B
Approx. \0.3B
EURO
\180
Approx. \0.5B
Approx. \0.2B
Note: The foreign exchange impact above is made on the assumption that emerging-market currencies move according to the influence of US$ and EURO.
Disclaimer Regarding Forecast and Projections
Forward-looking statements for earnings and other performance data contained
herein are based on information currently available to the Company, and all potential
risks and uncertainties are taken into account. The Company asks that investors
understand that changes in conditions may cause actual performance to significantly
differ from these projections.


 Swipe horizontally to view full table.