(金融商品取引法第24条第1項に基づく報告書) (E02289) 事業年度 自 2025年4月1日 (第103期) 至 2026年3月31日 第103期(自2025年4月1日 至2026年3月31日) 有価証券報告書 1 本書は金融商品取引法第24条第1項に基づく有価証券報告書を、同…
(金融商品取引法第24条第1項に基づく報告書)
(E02289)
事業年度
自
2025年4月1日
(第103期)
至
2026年3月31日
第103期(自2025年4月1日
至2026年3月31日)
有価証券報告書
1
本書は金融商品取引法第24条第1項に基づく有価証券報告書を、同
法第27条の30の2に規定する開示用電子情報処理組織(EDINET)を使用
し提出したデータに目次及び頁を付して出力・印刷したものです。
2
本書には、上記の方法により提出した有価証券報告書に添付された
監査報告書及び上記の有価証券報告書と併せて提出した内部統制報告
書・確認書を末尾に綴じ込んでいます。
目
次
頁
第103期有価証券報告書
【表紙】 ……………………………………………………………………………………………………………………… 1
第一部【企業情報】……………………………………………………………………………………………………… 2
第1 【企業の概況】…………………………………………………………………………………………………… 2
1 【主要な経営指標等の推移】………………………………………………………………………………… 2
2 【沿革】………………………………………………………………………………………………………… 4
3 【事業の内容】………………………………………………………………………………………………… 6
4 【関係会社の状況】…………………………………………………………………………………………… 8
第2 【事業の状況】…………………………………………………………………………………………………… 9
1 【経営方針、経営環境及び対処すべき課題等】…………………………………………………………… 9
2 【サステナビリティに関する考え方及び取組】…………………………………………………………… 11
3 【事業等のリスク】…………………………………………………………………………………………… 30
4 【経営者による財政状態、経営成績及びキャッシュ・フローの状況の分析】………………………… 32
5 【重要な契約等】……………………………………………………………………………………………… 37
6 【研究開発活動】……………………………………………………………………………………………… 37
第3 【設備の状況】…………………………………………………………………………………………………… 38
1 【設備投資等の概要】………………………………………………………………………………………… 38
2 【主要な設備の状況】………………………………………………………………………………………… 39
3 【設備の新設、除却等の計画】……………………………………………………………………………… 41
第4 【提出会社の状況】……………………………………………………………………………………………… 42
1 【株式等の状況】……………………………………………………………………………………………… 42
2 【自己株式の取得等の状況】………………………………………………………………………………… 54
3 【配当政策】…………………………………………………………………………………………………… 55
4 【コーポレート・ガバナンスの状況等】…………………………………………………………………… 56
5 【従業員の状況等】…………………………………………………………………………………………… 77
第5 【経理の状況】…………………………………………………………………………………………………… 80
1 【連結財務諸表等】…………………………………………………………………………………………… 81
2 【財務諸表等】…………………………………………………………………………………………………131
第6 【提出会社の株式事務の概要】…………………………………………………………………………………144
第7 【提出会社の参考情報】…………………………………………………………………………………………145
1 【提出会社の親会社等の情報】………………………………………………………………………………145
2 【その他の参考情報】…………………………………………………………………………………………145
第二部【提出会社の保証会社等の情報】………………………………………………………………………………146
監査報告書
内部統制報告書
確認書
【表紙】
【提出書類】
有価証券報告書
【根拠条文】
金融商品取引法第24条第1項
【提出先】
関東財務局長
【提出日】
2026年6月19日
【事業年度】
第103期(自 2025年4月1日
【会社名】
株式会社東京精密
【英訳名】
TOKYO
【代表者の役職氏名】
代表取締役社長CEO
【本店の所在の場所】
東京都八王子市石川町2968番地2
【電話番号】
(042)642-1701(代表)
【事務連絡者氏名】
執行役員常務CFO
【最寄りの連絡場所】
東京都八王子市石川町2968番地2
【電話番号】
(042)642-1701(代表)
【事務連絡者氏名】
執行役員常務CFO
【縦覧に供する場所】
株式会社東京証券取引所
至 2026年3月31日)
SEIMITSU
木
小
小
CO.,
村
一
公
人
公
人
泉
龍
泉
(東京都中央区日本橋兜町2番1号)
― 1 ―
LTD.
第一部【企業情報】
第1 【企業の概況】
1 【主要な経営指標等の推移】
(1) 連結経営指標等
回次
第99期
第100期
第101期
第102期
第103期
決算年月
2022年3月
2023年3月
2024年3月
2025年3月
2026年3月
売上高
(百万円)
130,702
146,801
134,680
150,534
166,839
経常利益
(百万円)
29,160
35,297
26,453
29,939
34,825
親会社株主に帰属する
当期純利益
(百万円)
21,326
23,630
19,378
25,637
24,739
包括利益
(百万円)
22,411
24,745
21,152
26,486
26,749
純資産額
(百万円)
131,081
146,028
158,427
176,229
192,916
総資産額
(百万円)
190,287
209,032
225,524
237,952
250,533
1株当たり純資産額
(円)
3,187.39
3,573.81
3,875.32
4,305.52
4,706.73
1株当たり当期純利益
(円)
522.52
581.33
480.49
633.75
610.02
潜在株式調整後
1株当たり当期純利益
(円)
517.51
575.62
475.42
628.31
606.14
自己資本比率
(%)
68.1
69.0
69.4
73.2
76.3
自己資本利益率
(%)
17.4
17.3
12.9
15.5
13.5
株価収益率
(倍)
9.3
8.8
25.3
12.6
21.7
(百万円)
23,837
1,000
4,892
28,824
25,012
(百万円)
△8,990
△8,421
△10,563
2,541
△11,491
(百万円)
△10,346
△2,174
1,616
△13,991
△15,674
(百万円)
49,006
40,036
36,736
54,516
53,052
2,354
2,468
2,658
2,767
2,890
(1,123)
(1,258)
(1,225)
(1,258)
(1,330)
営業活動による
キャッシュ・フロー
投資活動による
キャッシュ・フロー
財務活動による
キャッシュ・フロー
現金及び現金同等物の
期末残高
従業員数
(外、平均臨時
雇用人員数)
(名)
(注) 1.「従業員数」は、就業人員数を表示しています。
2.在外子会社の収益及び費用は、従来、決算日の直物為替相場により円貨に換算していましたが、第100期よ
り期中平均相場により円貨に換算する方法に変更しています。当会計方針の変更は遡及適用され、第99期は
遡及適用後の数値となっています。
3.当社は第102期より、「株式給付信託(BBT)」を導入しています。株主資本において自己株式として計上さ
れている信託が保有する当社株式は、第102期連結会計年度より1株当たり当期純利益金額の算定上、期中平
均株式数の計算において控除する自己株式に含めています。
― 2 ―
(2) 提出会社の経営指標等
回次
第99期
第100期
第101期
第102期
第103期
決算年月
2022年3月
2023年3月
2024年3月
2025年3月
2026年3月
売上高
(百万円)
107,841
122,274
110,716
128,647
143,826
経常利益
(百万円)
29,804
32,408
21,411
24,620
29,469
当期純利益
(百万円)
24,086
22,835
16,830
22,998
24,122
資本金
(百万円)
11,000
11,064
11,450
11,573
11,748
41,869,581
41,903,281
42,104,381
42,170,081
42,282,881
発行済株式総数
(株)
純資産額
(百万円)
106,258
119,462
128,019
142,373
156,951
総資産額
(百万円)
157,146
175,187
190,591
199,707
210,712
1株当たり純資産額
(円)
2,590.81
2,932.37
3,142.05
3,494.96
3,850.67
1株当たり配当額
(内1株当たり
中間配当額)
(円)
185.00
235.00
192.00
253.00
262.00
(円)
(84.00)
(109.00)
(89.00)
(114.00)
(111.00)
1株当たり当期純利益
(円)
590.15
561.77
417.31
568.50
594.81
潜在株式調整後
1株当たり当期純利益
(円)
584.48
556.25
412.90
563.63
591.03
自己資本比率
(%)
67.0
67.6
66.6
70.8
74.2
自己資本利益率
(%)
24.7
20.4
13.7
17.1
16.2
株価収益率
(倍)
8.3
9.1
29.2
14.0
22.2
配当性向
(%)
31.3
41.8
46.0
44.5
44.0
従業員数
(外、平均臨時
雇用人員数)
992
1,054
1,200
1,292
1,428
(名)
(712)
(783)
(775)
(804)
(861)
株主総利回り
(比較指標:
配当込みTOPIX)
(%)
100.5
109.9
253.7
175.1
284.5
(%)
(102.0)
(107.9)
(152.5)
(150.2)
(202.2)
最高株価
(円)
5,740
5,180
12,695
13,800
18,375
最低株価
(円)
4,025
4,100
4,885
6,134
6,148
(注) 1.「従業員数」は、就業人員数を表示しています。
2.最高株価及び最低株価は、2022年4月3日以前は東京証券取引所市場第一部におけるものであり、2022年4
月4日以降は東京証券取引所プライム市場におけるものです。
3.当社は、第102期より株式給付信託(BBT)を導入し、当該信託が所有する当社株式を財務諸表において自己
株式として計上しています。これに伴い、1株当たり純資産額の算定上、当該信託が所有する当社株式を期
末発行済株式総数から控除する自己株式に含めています。また、1株当たり当期純利益の算定上、当該信託
が所有する当社株式を普通株式の期中平均株式数の計算において控除する自己株式に含めています。
4.第103期の1株当たり配当額262円のうち、期末配当金151円については、2026年6月22日開催予定の定時株
主総会の決議事項となっています。
― 3 ―
2 【沿革】
1949年3月
㈱東京精密の前身、東京精密工具㈱を設立(資本金160万円)ミシン加工用切削工具、各種精密
部品及び治具類の製作販売開始
1953年1月
高圧流量式空気マイクロメータの我が国初の工業化に成功
1957年10月
差動変圧式電気マイクロメータの我が国初の工業化に成功
1962年4月
社名変更(株式会社東京精密に改称)
8月
東京証券取引所市場第二部に株式を上場
1963年12月
八王子工場第一期工事完成
1967年2月
八王子工場第二期工事完成
1969年4月
アフターサービスを担当する会社として、㈱東精エンジニアリングサービス(現、㈱東精エンジ
ニアリング)を設立
7月
土浦工場第一期工事完成
1971年1月
八王子工場本館完成
1981年8月
土浦工場に三次元座標測定機専用工場完成
1985年10月
ソフトウエア開発を担当する会社として、㈱トーセーシステムズを設立
1986年9月
東京証券取引所市場第一部銘柄に指定
1989年3月
海外営業展開 の 一拠点 と し て 西 ド イ ツ ( 現、 ド イ ツ ) に TOKYO SEIMITSU EUROPE GmbH( 現、
ACCRETECH (EUROPE) GmbH)を設立
10月
海外営業展開の一拠点として米国にTOKYO SEIMITSU AMERICA,INC.を設立
1992年10月
海外生産拠点の確保を目的として米国のSILICON TECHNOLOGY CORPORATIONを買収
1995年4月
米国子会社の統括管理を目的として持株会社TSK AMERICA,INC.を設立
1997年7月
八王子第2工場完成
1998年1月
北米地域における製造・販売の効率化を目指し、TSK AMERICA,INC.を存続会社とし米国内の現地
子会社4社を統合合併
1999年2月
子会社㈱マイクロ・テクノロジをグループ内におけるウェーハ外観検査装置の生産担当会社とし
て位置づけ、増資及び組織変更
4月
2001年3月
6月
子会社㈱東精エンジニアリングの土浦本社・工場完成
八王子工場新本館完成
子会社㈱東精エンジニアリング、東京証券取引所市場第二部に株式を上場
2002年10月
中国における販売、物流、保守サービスの拠点として東精精密設備(上海)有限公司を設立
2005年3月
八王子第3工場及び土浦新本館完成
10月
当社グループの競争力強化と企業価値向上を目的として、株式交換により子会社㈱東精エンジニ
アリングを完全子会社化
これに伴い㈱東精エンジニアリングの東京証券取引所上場廃止
2007年1月
韓国半導体市場 へ の 販売・ サ ー ビ ス ・ サ ポ ー ト 業務 の 強化 を 目的 と し て、旧現地法人 を
ACCRETECH KOREA CO.,LTD.として増資及び組織変更
ウェーハ外観検査装置事業に関する競争力の強化を目的として、子会社㈱アクレーテク・マイク
ロテクノロジを吸収合併
4月
2008年3月
4月
子会社㈱東精エンジニアリングの土浦半導体工場完成
土浦工場CMM棟完成
2009年4月
北米地域での販売活動の拠点として米国支店を開設
2010年6月
本店所在地を東京都三鷹市より東京都八王子市へ変更
2011年6月
八王子第5工場完成
― 4 ―
2012年4月
8月
米国支店を閉鎖し、北米地域での販売活動の拠点として新たに現地法人ACCRETECH AMERICA INC.
を設立
事業譲受により精密切断ブレード事業を開始
2014年9月
精密切断 ブ レ ー ド 事業 の 海外生産拠点確立 の た め、 タ イ に 現地法人 ACCRETECH ADAMAS
(THAILAND) CO.,LTD.を設立
2016年5月
八王子第6工場完成
2019年2月
電気計測分野への事業展開を進めるため、充放電試験装置の開発・製造・販売を手がける㈱富士
通テレコムネットワークス福島(現、二次電池評価センター 福島サイト)を株式取得により子会
社化
11月
自動計測製品ラインナップ強化を目的として、子会社㈱東精エンジニアリング及びその米国子会
社TOSEI AMERICA INC.がバランサやレーザ測定器等の開発・製造・販売を手がけるSCHMITT
INDUSTRIES, INC.のバランサ事業を買収し、米国子会社の名称をACCRETECH SBS, INC.に変更
2020年2月
5月
西日本における事業推進と販売・サポート機能拡充のため、大阪営業所を改装開設
土浦工場MI棟完成
2021年3月
子会社ACCRETECH TAIWAN CO.,LTD.の新社屋完成及び台湾新アプリケーションセンターを設立
2022年4月
東京証券取引所の市場区分の見直しにより市場第一部からプライム市場へ移行
2023年7月
飯能工場完成
2025年8月
子会社㈱東精エンジニアリングの名古屋工場完成
― 5 ―
3 【事業の内容】
当社グループは、当社及び子会社27社、関連会社2社で構成され、半導体製造装置並びに計測機器の製造販売を主
な内容とした事業活動を行っています。
グループ各社の事業における位置付け及びセグメントとの関連は以下のとおりです。なお、連結財務諸表のセグメ
ント情報におけるセグメント区分と同一の区分です。
半導体製造装置
ウェーハプロービングマシン、ウェーハダイシングマシン等半導体製造工程で使用され
る加工・検査装置を扱う当事業においては、当社が生産の大部分を担当し、子会社㈱東
精エンジニアリングが一部関連製品の、子会社ACCRETECH ADAMAS(THAILAND)CO.,LTD.が
一部消耗品の生産を行っています。販売及びアフターサービスについては、当社が中心
となって行い、ソフトウエアについては、子会社㈱トーセーシステムズが主に供給を担
当しています。
海外への販売については当社による輸出の他、米州地域では子会社ACCRETECH AMERICA
INC. が、欧州地域 で は 子会社 ACCRETECH(EUROPE)GmbH が、 ア ジ ア 地域 で は 子会社
ACCRETECH KOREA CO.,LTD.、東精精密設備 ( 上海 ) 有限公司、ACCRETECH TAIWAN
CO.,LTD.等がそれぞれ行っています。
<主な関係会社>
㈱東精 エ ン ジ ニ ア リ ン グ、㈱ ト ー セ ー シ ス テ ム ズ、ACCRETECH AMERICA INC.、
ACCRETECH(EUROPE)GmbH、ACCRETECH KOREA CO.,LTD.、東精精密設備(上海)有限公司、
ACCRETECH TAIWAN CO.,LTD.、ACCRETECH(MALAYSIA)SDN.BHD.、ACCRETECH ADAMAS
(THAILAND)CO.,LTD.
計測機器
三次元座標測定機、表面粗さ・輪郭形状測定機等の精密測定機器類を扱う当事業におい
ては、当社及び子会社㈱東精エンジニアリングが生産と販売の大部分を担当し、ソフト
ウエアについては、子会社㈱トーセーシステムズが主に供給を担当しています。
な お、一部 の 製品 に つ い て は、子会社東精計量儀 ( 平湖 ) 有限公司 や 子会社 TOSEI
(THAILAND)CO.,LTD.による海外現地生産も行われています。
海外への販売については当社及び子会社㈱東精エンジニアリングによる輸出の他、米州
地域では子会社ACCRETECH SBS,INC.が、欧州地域では子会社ACCRETECH(EUROPE)GmbHが、
アジア地域では子会社ACCRETECH KOREA CO.,LTD.、東精精密設備(上海)有限公司等がそ
れぞれ行っています。
<主な関係会社>
㈱東精エンジニアリング、㈱トーセーシステムズ、ACCRETECH(EUROPE)GmbH、
ACCRETECH KOREA CO.,LTD.、東精精密設備(上海)有限公司、
ACCRETECH(THAILAND)CO.,LTD.、東精計量儀(平湖)有限公司、
TOSEI(THAILAND)CO.,LTD.、ACCRETECH SBS, INC.
― 6 ―
当社を中心としたグループ各社の位置づけは次のとおりです。
連結子会社、非連結子会社及び関連会社は次のとおりです。
連結子会社
会社名
㈱東精エンジニアリング
㈱トーセーシステムズ
㈱アクレーテク・クリエイト
㈱東精ボックス
㈱アクレーテク・ファイナンス
ACCRETECH AMERICA INC.
ACCRETECH(EUROPE)GmbH
ACCRETECH KOREA CO.,LTD.
東精精密設備(上海)有限公司
ACCRETECH TAIWAN CO.,LTD.
ACCRETECH(MALAYSIA)SDN. BHD.
ACCRETECH ADAMAS(THAILAND)CO.,LTD.
ACCRETECH(THAILAND)CO.,LTD.
東精計量儀(平湖)有限公司
TOSEI(THAILAND)CO.,LTD.
ACCRETECH SBS, INC.
非連結子会社
ACCRETECH(SINGAPORE)PTE.LTD.
ACCRETECH VIETNAM CO.,LTD.
PT ACCRETECH INDONESIA
ACCRETECH-TOSEI DO BRASIL LTDA.
PT TOSEI INDONESIA
TOSEI PHILIPPINES CORPORATION
TOSEI ENGINEERING PRIVATE LIMITED
TOSEI MEXICO S.A.DE.C.V.
ACCRETECH-TOSEI HUNGARY KFT.
東精精密設備(平湖)有限公司
ACCRETECH-SBS UK LTD.
― 7 ―
関連会社
㈱オンチップ・バイオテクノロジーズ
AAダイヤモンドテクノロジー㈱
4 【関係会社の状況】
名称
住所
資本金
又は
出資金
主要な
事業の内容
議決権の
所有(被所有)
割合
関係内容
役員の兼任
所有被所有
割合
割合当社当社
(%)
(%) 役員従業員
(人) (人)
営業上の取引
資金設備の
援助の 賃貸借
有無 の有無
(連結子会社)
茨城県
㈱東精エンジニアリング
土浦市
百万円半導体製造装置
988 計測機器
100.0
―
1
2
当社への半導体製造
装置関連製品の供給
及び当社計測機器製
品の保守、サービス
有
有
㈱トーセーシステムズ
東京都
八王子市
百万円半導体製造装置
50 計測機器
100.0
―
2
1
当社製品へのソフト
ウエアの供給
無
有
㈱アクレーテク・
クリエイト
東京都
八王子市
百万円半導体製造装置
10 計測機器
100.0
―
1
3
当社製品の運送に係
る損害保険代理業務
無
有
㈱東精ボックス
東京都
立川市
百万円
計測機器
10
100.0
―
1
1
当社への事務所賃貸
無
有
㈱アクレーテク・
ファイナンス
東京都
八王子市
百万円半導体製造装置
50 計測機器
100.0
―
1
1
当社への短期資金貸
付
無
無
ACCRETECH AMERICA INC.
米国
テキサス州
リチャード
ソン市
千USD
半導体製造装置
1,500
100.0
―
3
―
当社の半導体製造装
置製品の販売
無
無
千EUR 半導体製造装置
1,500 計測機器
100.0
―
2
―
無
無
有
無
無
無
無
無
ドイツ
ACCRETECH(EUROPE) GmbH バイエルン州
ミュンヘン市
ACCRETECH KOREA CO.,
LTD.
韓国
京畿道華城市
百万KRW 半導体製造装置
1,000 計測機器
100.0
―
2
1
東精精密設備(上海)
有限公司
中国
上海市
千CNY 半導体製造装置
15,211 計測機器
100.0
―
2
2
ACCRETECH TAIWAN
CO.,LTD.
台湾
新竹県竹北市
千TWD 半導体製造装置
60,000 計測機器
100.0
―
3
1
当社の半導体製造装
置製品及び計測機器
製品の販売
当社の半導体製造装
置製品及び計測機器
製品の販売
当社の半導体製造装
置製品及び計測機器
製品の販売
当社の半導体製造装
置製品及び計測機器
製品の販売
マレーシア
セランゴール
州プタリンジ
ャヤ市
タイ
パトゥムター
ニー県クロー
ンルアン
タイ
サムットプラ
カーン県バー
ンプリー
千MYR 半導体製造装置
1,000 計測機器
100.0
―
2
―
当社の半導体製造装
置製品及び計測機器
製品の販売
無
無
千THB
半導体製造装置
80,000
73.5
(25.4)
―
1
2
当社への半導体製造
装置関連部品の供給
有
無
千THB 半導体製造装置
10,000 計測機器
49.0
―
2
2
当社の半導体製造装
置製品及び計測機器
製品の販売
無
無
東精計量儀(平湖)
有限公司
中国
浙江省平湖市
千CNY 半導体製造装置 100.0
39,480 計測機器
(100.0)
―
―
1
――――――
無
無
TOSEI(THAILAND)CO.,
LTD.
タイ
チョンブリー
県ムアンチョ
ンブリー
千THB
計測機器
6,000
49.0
(49.0)
―
―
2
――――――
無
無
ACCRETECH SBS, INC.
米国
オレゴン州ポ
ートランド市
千USD 半導体製造装置 100.0
1 計測機器
(100.0)
―
―
2
――――――
有
無
ACCRETECH(MALAYSIA)
SDN. BHD.
ACCRETECH ADAMAS
(THAILAND)CO.,LTD.
ACCRETECH(THAILAND)
CO.,LTD.
(注) 1.「主要な事業の内容」欄には、セグメント情報に記載された名称を記載しています。
2.「議決権の所有(被所有)割合」欄の( )内は間接所有に係るもので内書数です。
3.ACCRETECH(THAILAND)CO.,LTD.及びTOSEI(THAILAND)CO.,LTD.の議決権所有割合はそれぞれ49.0%ですが、実
質的に支配しているため子会社としています。
4.上記会社のうち㈱東精エンジニアリング及びACCRETECH TAIWAN CO.,LTD.は特定子会社です。
5.上記会社のうち有価証券届出書又は有価証券報告書を提出している会社はありません。
― 8 ―
第2 【事業の状況】
1 【経営方針、経営環境及び対処すべき課題等】
文中の将来に関する事項は、当連結会計年度末現在において当社グループが判断したものです。
(1) 会社の経営の基本方針
①
当社グループは半導体製造装置及び計測機器メーカーとして、顧客の生産性向上に寄与する最先端の製品開発
とカスタマーサポートに注力しています。企業成長の必須条件である「安全・健康」、「品質」、「環境・省エ
ネルギー」、「全員力」を行動指針として、これまで培ってきた精密測定技術と精密加工技術を活かし、優れた
半導体製造装置と計測機器を開発・供給することを通じ、顧客、株主の皆様、従業員、地域社会、国際社会等広
く社会に貢献していきます。
②
当社グループは、「計測で未来を測り、半導体で未来を創る」をパーパス(企業としての存在意義)とし、世界
中 の 技術・知恵・情報 の 融合 で、「夢 の あ る 未来」 の 実現 を 目指 し て い ま す 。 コ ー ポ レ ー ト ブ ラ ン ド
「ACCRETECH」のもとで、当社の培ってきたコア・テクノロジーを応用することに加え、世界No.1の商品創りと
いう共通の目的をもつ国内外の会社及び個人と“WIN-WIN”の関係を築くことにより、世界No.1の製品開発体
制を構築して真のグローバル・カンパニーとなるべく努力しています。
③
当社は経営体制として、半導体社、計測社、業務会社の三つの社内カンパニー制と執行役員制を採用していま
す。各カンパニーは、完結した組織として責任と権限を有し、それぞれの顧客に対し機動的かつ迅速に対応する
ことにより、顧客満足の向上と業績拡大を目指しています。
(2) 目標とする経営指標
技術革新がハイレベルかつハイスピードで進行する事業環境の下、成長分野において最先端技術を駆使した世界
No.1商品を提供し続けることにより高収益・高効率体質を確立することを目指しており、内部資金を有効に活用
し成長のための投資を効果的に行うことで資本効率を維持向上させることに努めています。
当社グループは、一株当たり利益の長期的な上昇ひいては企業価値の長期的な上昇を実現することが経営上重要
であると考えており、中期的な経営指標として、2028年3月期までに「ROE15%」「連結売上高1,850億円」「連結
営業利益450億円」を達成することを目標としています。
(3) 中長期的な会社の経営戦略と対処すべき課題
①
成長戦略の推進と業績の拡大
最先端技術を駆使した世界No.1商品を不断に提供し続けるため、品質向上と生産革新を継続的に推進し、高
収益・高効率の企業体質確立に努めており、その成果も着実に顕われていますが、今後とも強化された企業体質
を活かして成長戦略を進め、一層の業績拡大を図っていく所存です。
②
継続的な利益還元
企業価値を高め、株主の皆様へ継続的に利益還元を図ることが経営の重要な課題と認識し、業績の更なる改善
と安定化に努めていく所存です。
③
コーポレート・ガバナンスの充実
企業価値の向上には、国際社会から信頼される企業市民として公正で透明性の高い経営活動を展開していくた
めのコーポレートガバナンスの充実が不可欠と認識し、「コーポレートガバナンス基本方針」に以下の方針を掲
げて、取り組んでいく所存です。
ⅰ
透明・公正かつ迅速・果断な意思決定を行うため、取締役会の役割・責務の適切な遂行に努めます。
ⅱ
株主の権利を尊重し、株主の平等性の確保に努めます。
ⅲ
中長期的な株主利益を尊重する投資方針の株主との建設的な対話に努めます。
ⅳ
株主以外のステークホルダーとの適切な協働に努めます。
ⅴ
適切な情報開示と透明性の確保に努めます。
― 9 ―
④
グローバルな経営体制の構築
海外子会社による現地営業が定着し、海外売上高が連結売上高の過半を占めるようになった中、中国、タイ等
では現地生産も行われるようになりました。このような状況下、現地経営幹部の積極的登用、生産面における現
地調達体制の確立、現地・本社間の経営情報の共有化等の方策を通じて、グローバル化に対応する経営体制の構
築を図ることが経営の重要な課題であると認識し、その実現を目指していく所存です。
― 10 ―
2 【サステナビリティに関する考え方及び取組】
当社グループのサステナビリティに関する考え方及び取組は、次のとおりです。
なお、文中の将来に関する事項は、当連結会計年度末現在において当社グループが判断したものです。
(1) ガバナンス及びリスク管理
当社グループは企業理念のもと、お客さまであるモノづくり企業の製造プロセスや省エネ・省資源製品に不可欠
な精密測定機器、半導体製造装置の提供を通じて、社会の利便性向上と環境負荷低減に貢献してきました。
一方で、企業を取り巻く環境が大きく変化するなか、当社グループはサステナビリティが重要な経営課題である
ことを認識し、持続可能な社会の実現と企業価値向上を目的とした取り組みの指針となるサステナビリティ基本方
針を制定しています。
(サステナビリティ基本方針)
1. 環境問題への取り組み
提供する製品のライフサイクルを含む全てのバリューチェーンを通じて、CO2排出量削減、廃棄物削減と再
利用促進、生物多様性を含めた地球環境保護などに取り組むことで、人と地球環境を大切にする社会の実現に貢
献します。
2. 社会からの信頼の確立
あらゆる法令や規則を厳格に遵守し、公正な競争、お客様のニーズに合致した安全かつ高品質な製品・サービ
スの安定的な提供、製品や企業情報の適切な開示など誠実かつ公正な企業活動を遂行するとともに、お客様をは
じめ事業活動に関わるすべてのステークホルダーの情報資産の管理・保護を徹底し、社会から高い信頼を得る経
営を実現します。
3. 人権の尊重
性別、国籍などの個人の属性に関わらず、社会的に弱い立場にある人を含むすべてのステークホルダーの人権
を尊重するとともに、多様な従業員がいきいきと働き一人ひとりの能力を最大限発揮できる、安全・健康で働き
がいのある職場づくりを推進します。
4. 人財育成
従業員は、当社グループの財産です。従業員とともにWIN-WINの仕事で世界No.1の商品を創るためには、従業
員一人ひとりがプロフェッショナル人財として自らの強みを最大限に発揮するとともに、多様な人財の多様な価
値観を受け入れ、認め合い、お互いの強みを引き出し、ともに成長していくことが必要です。
当社は、そうした従業員の成長を支援するため教育研修をはじめとしたプログラムを用意するとともに、多様
な人財が働きがいを感じられる職場環境の構築に取り組んでいきます。
5. 地域社会への参画と貢献
事業活動を通じて社会に貢献するとともに、企業市民として健全で持続可能な社会づくりのため、各地域の課
題、ニーズに応じて解決に向けた社会貢献活動を実践することで、地域社会の活性化や生活環境の改善に向けた
取り組みを推進します。
6. 公平、透明で効率的なガバナンス体制の構築と運営
株主の皆様の権利を尊重し経営の公平性・透明性を確保するとともに、企業理念の実現に向けて、コーポレー
トガバナンスを経営上の重要課題と位置づけ、迅速かつ的確な意思決定および監督機能の強化を図ります。ま
た、中長期にわたる企業価値向上と経営の健全性維持のため継続的にコーポレートガバナンスの充実に取り組み
ます。
― 11 ―
当社グループは、サステナビリティ活動の推進強化を目的として、2021年11月に体制を再編し、CSR推進委員
会を発展させたサステナビリティ委員会を新設しました。
代表取締役会長を委員長とする同委員会は、年2回の定期開催のほか、必要に応じ臨時で開催され、サステナビ
リティ活動に関する企画・立案・計画・実施を統括し、基本方針の策定や、運営体制の構築、目標・指標の設定/審
議に加え、情報のモニタリングや調査を実施するとともに、執行役員会議や取締役会への報告・提言等の活動を推
進しています。
本委員会の傘下には、「気候変動対応ワーキンググループ」を設置し、気候変動対応活動に関する調査・検討を
担い、定期的に委員会に報告します。技術、製造、営業および管理部門の関係者が参加しており、リスク・機会の
抽出、シナリオ分析および対応策の検討を組織横断的に推進する体制を構築しています。
― 12 ―
(2) サステナビリティへの取り組み
当社は、サステナビリティへの取り組みを、経営基盤を一層強固にし、中長期的な価値創造を安定的に実現する
ための重要な活動として位置づけています。マテリアリティは、多様なサステナビリティの課題の中から特に重要
度の高いテーマを特定し、グループの経営方針に組み込むとともに、適切な情報開示を行うための枠組みとして活
用しています。
(マテリアリティの特定)
マテリアリティの特定に際しては、財務上の連結対象となるグループ全体のバリューチェーンを責任範囲とし、
既に顕在化している課題の洗い出しに加えて、中長期的な社会・環境の変化を踏まえた潜在的課題の抽出、さらに
は主要ステークホルダーごとに求められる対応事項の整理など、多角的な分析を実施しています。
これらの分析結果を基に、以下の二つの観点から影響評価を行っています。
1)自社が地球環境やステークホルダーへ与える影響
2)サステナビリティに関する課題が、自社の価値創造や経営戦略へ与える影響
それぞれの観点で重要度が高いと判断された課題をマテリアリティとして特定しています。
事業と社会の持続可能性を追求する上で、社会課題や環境課題への対応が加速している時代の流れに則したマテ
リアリティ(重要課題)への対応が重要になっています。
― 13 ―
- 一般的なサステナビリティ課題の参照
GRIスタンダード、SASBスタンダード、グローバルコンパクトなど主要な世界的なガイドライン、及びESG格付け
機関の評価項目等から、一般的に企業が求められるサステナビリティの課題を参照しています。
- 分析フェーズ
(1) バリューチェーン分析
原材料の調達から製造、販売、さらには顧客による製品の使用・廃棄に至るまで、バリューチェーン全体を対象
に、自社の価値創造の過程のどこで、どのように社会・環境へ影響(正の影響・負の影響)を与えているかを整理
し、そこから重要な課題を抽出しています。バリューチェーン分析では、現在既に発生している顕在的なサステナ
ビリティ課題を主に抽出しています。
(2) 経営・事業分析
中期経営計画や各事業計画、各種方針を分析し、既に顕在化し取り組みが進められているサステナビリティ課題
に加え、事業計画に内在する、将来的に発生する可能性のある潜在的なサステナビリティ課題を抽出しています。
(3) メガトレンド分析
気候変動、テクノロジーの進化、経済の変化など、将来の事業環境に大きく影響を及ぼすと考えられるテーマに
ついてメガトレンドを予測し、今後自社が社会・環境に対して果たすべき役割や課題を予想しています。メガトレ
ンド分析では、主に将来的に対応が必要と考えられる潜在的なサステナビリティ課題を抽出しています。
(4) ステークホルダー分析
主要なステークホルダーごとに、彼らが抱える課題や関心事項、自社への期待を調査・分析し、それらへの自社
の対応の在り方を検討しています。ステークホルダーごとに分析することで、より深いニーズや、自社が対応すべ
き具体的な事項を明確化しています。ステークホルダー分析では、現在発生している顕在的なサステナビリティ課
題とともに、将来的に対応が必要となる潜在的な課題を抽出しています。
- 評価フェーズ
(1) 地球環境やステークホルダーへの影響評価
当社事業が地球環境や各ステークホルダーに与える影響について、その規模と発生可能性の観点で評価を行い、
影響度を判断しています。評価の結果、地球環境やステークホルダーに一定以上の影響を及ぼしていると考えられ
る課題をマテリアリティ(インパクト・マテリアリティ)としています。
(2) 価値創造/経営戦略への影響評価
サステナビリティ課題が当社の価値創造や経営戦略に与える影響について、リスクおよび機会のそれぞれの側面
で、その規模と発生可能性の観点で評価を行い、影響度を判断しています。リスク面或いは機会面のどちらかある
いは両方で影響度が高いと判断した項目を、当社のマテリアリティ(ファイナンシャル・マテリアリティ)として
います。
- マテリアリティの審議と決定
評価フェーズで影響度が高いと判断された項目を、当社従業員やステークホルダーに適切に伝達できるよう、内
容を分かりやすい表現に整え、必要に応じてグルーピングを調整したうえで、最終的なマテリアリティとして取り
まとめています。マテリアリティは、サステナビリティ委員会、経営執行会議で審議を行い、取締役会において確
認の上、決定をしています。
(マテリアリティとその取り組み)
当社グループは、2025年度-2027年度中期経営計画の策定に伴い、サステナビリティ基本方針(環境問題への取り
組み、社会からの信頼の確立、人権の尊重、人財育成、地域社会への参画と貢献、公平、透明で効率的なガバナン
ス体制の構築と運営)に基づき、事業活動のバリューチェーンの状況と環境、社会への影響など配慮すべき課題を
整理し、マテリアリティを見直しました。具体的な取り組みや目標を示し、従業員一人ひとりの取り組むべき課題
を明確化し、その業務の価値を理解しやすくすることでモチベーションの向上につなげるとともに、今後も必要に
応じて適宜見直していきます。
― 14 ―
テーマ
豊かな社会の実現
に貢献
マテリアリティ
優先的な活動(2026年度)
社会課題を解決する製品の創出と提供
環境課題に寄与する製品・サービスの拡大
未来を創り社会を豊かにする
半導体製造への貢献
最先端デバイスに向けた製品開発とサービスの提供
精密測定を通じたモノづくりの
イノベーションへの貢献
次世代製造技術に寄与する加工時のリアルタイム測定の提供
精密測定による半導体製造への貢献
カーボンニュートラルに向けた取り組み
バリューチェーンにおける
温室効果ガスの削減
事業のCO2排出量削減
エネルギー管理の徹底
持続可能な社会づ
くりに貢献する事
業活動の推進
地球環境に貢献する製品の創出と提供
環境に配慮した製品開発
水使用量の調査分析と削減
環境保全と資源管理の最適化
有害物質及び高懸念物質の管理と削減
生物多様性保全活動の推進
サーキュラー・エコノミーの実現
資源循環(サーキュラーエコノミー)の推進
環境マネジメントシステムの高度化
ISO14001による環境配慮活動の推進
バリューチェーンにおける
サステナビリティの推進
サステナブル調達の推進
人権の尊重/紛争鉱物対応
顧客満足度の向上
ステークホルダー
の信用・信頼に応
える企業姿勢の維
持・強化
製品安定供給と
カスタマーサポートの充実
品質管理の高度化
東京精密技術の伝承
IR活動推進
産官学連携での技術発展への貢献
ステークホルダーエンゲージメントの推進
地域美化活動の推進
迅速・公正な情報開示
サステナビリティサイトの積極運用
女性活躍推進(女性中核人財の採用と育成)
多様な視点と価値観の尊重
海外グループ会社との人財交流
障がい者が活躍できる職場環境の整備
従業員の健康推進に資する施策の周知と強化
多様な人々が前向
きに活々と働ける
職場環境の醸成
心身ともに健康で安全に働ける職場づくり
労働災害の防止
安全・安心に働ける環境づくり
自主的な安全活動推進
パーパス、ビジョンの浸透
従業員エンゲージメントの向上
失敗を恐れずにより高度な課題にチャレンジできる風土の醸成
カンパニーや部門間の垣根を越え、一体感のある組織風土の醸成
コーポレート・ガバナンスの強化
公正な企業活動の
基盤となるガバナ
ンスの強化
コンプライアンスの強化
企業倫理・法令順守の厳格化
適時・適切な情報開示
内部統制機能の維持・向上
リスクマネジメントの強化(BCM/BCP)
リスクマネジメントの推進
グループ会社の情報セキュリティ強化
CSIRT体制の強化
次世代セキュリティ基盤への移行
人財の確保と育成の推進
研究開発力の強化
知的財産の管理と活用
採用力の強化
教育研修機会の充実
最先端技術への対応力強化
知的財産投資・活用
独占的事業領域の確保
IT活用による業務効率化
事業基盤の強化
DXの推進
個別DX案件の推進
各種AI推進施策(ガイドライン/規程/環境整備)
自動化・省人化の推進
変革を支える企業風土の醸成
パーパスの浸透
リカーリングビジネスの強化
強固な事業継続計画の策定
持続可能な安定経営の実現
棚卸資産の管理強化
投資判断フォーマットの導入
公正な利益分配
― 15 ―
(3) 気候変動への取り組みとTCFDへの対応
当社グループは、気候変動がもたらす気温上昇や自然災害の激甚化等が社会経済に及ぼす影響は大きく、当社事
業においても大きなリスクと考えています。一方で、気候変動への対応を進めることで、企業の強靭化や製品競争
力強化につながるほか、事業の拡大といった機会にもなり得ると考えています。
当社グループは、2021年8月にTCFD(気候関連財務情報開示タスクフォース)対応プロジェクトを発足し、
2022年3月に「TCFD(気候関連財務情報開示タスクフォース)」提言への賛同を表明しています。気候変動が
もたらす気温上昇や自然災害の激甚化などは、当社グループ事業においても大きなリスクと考えています。一方で、
気候変動への対応を進めれば、企業の強靭化や製品競争力強化につながるほか、事業の拡大といった機会にもなり
得ます。そこで当社グループは、気候変動が事業に与えるリスクと機会を分析し、課題を共有・展開するとともに、
TCFDの枠組みに基づいた気候関連財務情報の開示を進めています。
① ガバナンス
当社グループは、気候変動を経営上の重要課題として認識しており、気候変動問題に関するリスク・機会の管理
をサステナビリティ委員会で審議し、その内容を定期的に取締役会に付議・報告します。
サステナビリティ委員会の委員長は代表取締役会長が務め、年2回定例のサステナビリティ委員会で審議すると
ともに委員長が必要と認める場合、取締役会に付議・報告します。
各取締役は、刻々と移りかわる気候変動関連の状況を把握するために、さまざまな機会や方法を通じて情報収集
を行い、知見を深めています。取締役会では気候変動に係るリスク・機会の課題を共有し、目標管理や課題解決に
向けた議論を行うほか、今後は気候変動対応ワーキンググループを通じ、2030年度目標達成に向けたマイルストー
ン設定を行います。
② リスク管理
当社グループは、業務執行に係るリスクの把握と管理を目的として「リスク管理規程」を定め、代表取締役社長
を責任者とする「リスク管理委員会」を設置し、潜在的なリスクの発生予防と危機発生に備えた体制を整備してい
ます。
気候変動対応ワーキンググループでは、気候変動に関するリスク(移行/物理)の特定・評価を行っています。
技術、製造、営業および管理部門の関係者が参加しており、リスク・機会の抽出、シナリオ分析および対応策の検
討を組織横断的に推進する体制を構築しています。本ワーキンググループは原則月に1回、その他緊急性に応じて
開催し、サステナビリティ委員会へ報告します。事業経営に影響すると思われる事案に関しては、委員会より取締
役会に速やかに報告し、審議されます。
リスク管理委員会で取り上げる対象リスクに気候変動リスクを追加し、リスクアセスメントおよび顕在化したリ
スク事象についての対策検討などの議論を機動的に行うことにより、グループ全体の対応に当たります。
③ 戦略
当社国内事業所を対象にScope1とScope2の分析を行っています。国内および海外子会社グループ企業のGHG排
出量については、今後モニタリングを進めながら順次対応していく予定です。Scope3については、排出量が大き
いと予測されるカテゴリ11とカテゴリ112の把握を進めてきました。2025年より他のカテゴリの把握を進めていま
す。
*1
:自社が購入した製品・サービスに伴うCO2排出量
*2
:自社が販売した製品の使用に伴うCO2排出量
(気候変動のリスク及び機会)
シナリオ分析は将来予測の不確実性を考慮し、複数のシナリオを参照して検討を行いました。2℃未満シナリオ
の下での対応では不十分との国際的な世論が形成されつつあり、1.5℃シナリオを用いて分析を実施しています。
一方、1.5 ℃シナリオへの対応では、物理的リスクへの意識が希薄化することから、現状の経済活動を継続した場
合に気温が上昇する4℃シナリオでの事業環境を想定しました。
また、環境リスク・機会の再分析を行い、中期・長期で取り組むアクションを以下のように見直しました。
・気候変動に対する全体像の整理と取組方針
・新規事業領域模索
・気候変動対応を起点としたBCPの強化
・LCA・Scope3(顧客・サプライヤとの連携含む)
― 16 ―
※参照したシナリオ
1.5℃シナリオ:(IEA) NZE 、 1.5℃ 特別報告書
4℃シナリオ:(IEA) STEPS
(IPCC) SSP1-1.9
(IPCC) SSP2-4.5 、 SSP3‐7.0
(リスク機会と事業インパクトの分析)
シナリオ
リスク機会
イベント
内容
財務イン
パクト
発生時期
▲▲
中期
▲▲▲
短期
▲▲
中期
▲▲
中期
▲▲▲
中期
▲
長期
▲
短期
▲▲
短期
▲▲▲
中期
▲▲
中期
・炭素税導入による原材料・資機材・エ
規制
カーボンプライ ネルギー・輸送費用等の上昇
シング
・国境炭素税の導入により製品輸出への
制約
EV化
リスク
市場
・従来の事業・製品(内燃機関関連部品向
け計測器)の需要縮小
・脱炭素化に伴う材料価格の高騰、調達
脱炭素化プレミ 難、代替品確保に伴うコスト発生
アム
・非化石エネルギーの調達難や調達コス
トの上昇
評判
1.5℃
脱炭素化対応の ・気候変動対応をはじめとするESG対
遅れ
EV化、電化・
市場
デジタル化
応の遅れは資金調達や取引関係に悪影響
・EVの新たな素材・部品への計測需要
が拡大・半導体利用が増加し、生産能力
が拡張
再生可能エネル ・再生可能エネルギー市場拡大に伴う計
機会
ギー市場拡大
測機器需要の拡大
生産設備
や資源の再利用により生産性向上と顧客
資源効
率エネ
・工場内の省エネ対策(設備やプロセス)
ルギー
の脱炭素化要望に対応
・LCA観点による環境負荷の低減によ
製品サ
低炭素製品・
り市場での製品評価や優位性が向上
ービス
サービス
・顧客の軽量化ニーズを実現捕捉(計測製
品需要拡大)
・リスク対策費用(BCP対応)の増加
リスク
4℃
激甚化災害の発・被災による物的損害と復旧費用の発生
現
・被災による操業停止(自社・サプライヤ
ー要因)
機会
凡例
物理
(急性)
レジリ
エンス
災害対応
・災害時における製品・サービスの安定
供給により顧客生産体制の維持に貢献
財務インパクト:▲▲▲ 大、▲▲ 中、▲ 小
発現時期:短期2022~2024、中期2025~2029、長期2030~
(グループ企業(国内および海外子会社)のGHG排出量のモニタリング)
当社グループ企業のうち生産拠点におけるScope1とScope2のGHG排出量の調査を開始しました。
(Scope3の開示に向けた取り組み)
当社のほとんどの製品は、部品・部材を調達し、自社で製造・販売、お客さまの現場で稼働しています。その
ため、バリューチェーン全体での温室効果ガス排出量を把握することが重要であると考えています。
2024年度より新たにScope3対応プロジェクトを発足し、カテゴリ1~カテゴリ15の把握を進めています。
― 17 ―
(機会に対する戦略)
1.気候変動に関連する半導体製造装置事業の機会
世界各国がカーボンニュートラルを目指す過程では、あらゆる産業分野において、
・生産活動の効率化・省エネルギー化
・脱炭素エネルギーへの転換
(主にデジタル化による施策)
(主に電化による施策)
が追求されると予想されます。
需要急拡大に応える、高精度な半導体製造装置
これらに伴いデジタル・情報通信技術の適用範囲は広がり、社会全体で活用される電子機器・電子部品などの数
量は急速に増加。構成要素である半導体デバイスの需要も持続的に増大し、当社が提供する半導体製造装置のニー
ズは今後も飛躍的に高まっていくことが見込まれます。
また、電子機器・電子部品などは、高機能化に伴い設計も複雑化し、製造工程に対する新たな課題解決ニーズも高
まります。当社は、このようなニーズに対応した製品群を開発・提供しています。例えば、高精度の温度制御や加
工を実現する装置は、AI/HPC向けロジック・メモリ需要やSAWフィルターやセンサの高度化に応え、高難易度化が
進む製造工程をサポートします。
次世代パワー半導体対応製品
一方、デジタル化・電化が進むことにより、
・IoT機器・AIの普及に伴うデータセンターの拡充、データ量・計算量の拡大 と消費電力の増大
・電気自動車(EV)向け電気モータの利用拡大による損失電力の増大
といった課題も同時に発生するため、半導体自体の省エネルギー化も両輪で推進する必要があります。高いエネル
ギー効率を実現する次世代パワー半導体(GaN、SiCなど)の普及が期待されており、当社も関連する技術・製品開
発を推進しています。
新たに生まれるニーズと当社の提供価値
カーボンニュートラルの実現に向けては、新たな課題が生まれるとともに、お客さまからのニーズも絶えず変化
していきます。当社は検査装置・加工装置に及ぶ広範な製品群で変わりゆくニーズに総合的に対応し、新たな価値
を提供し続けます。
予想される社会の変化
1
2
新たに生まれる課題
当社の提供価値(例)
検査時間の延伸
プロービングマシンのスループット向上
半導体製造装置の増設
半導体製造装置の安定供給
測定時の発熱量増加
高精度温度制御に対応したプロービングマシン
半導体デバイスの生産量増加
半導体デバイス設計の複雑化
加工精度の高度化
3
次世代パワー半導体の普及
難削材加工の需要増加
― 18 ―
高精度な高剛性研削盤、アブレーションレーザ
ダイシングマシン
高精度な高剛性研削盤、エッジグラインダ、CMP
装置
半導体製造装置事業の戦略と目標
気候変動関連の事業機会を的確に捉え、半導体製造装置事業を持続的に成長させるため、以下の戦略を実施しま
す。
① 需要増加に見合う適切な設備投資
急速に増加する半導体デバイス需要に対応するため、半導体製造装置の生産体制を着実に強化します。2023年7月
に飯能工場(埼玉県飯能市)が稼働を開始、2025年8月には名古屋工場(愛知県愛知郡)を竣工しました。2028年
には、東京都八王子市での新工場建設に着工します。
② お客さま志向を徹底した営業活動
当社の強みは徹底したお客さま志向であり、製造・技術・サービス・営業が一体となって、日々お客さまの声に
耳を傾けています。この取り組みにより、半導体製造装置の量的・質的なニーズをいち早く捉え、お客さまに満
足いただける製品・サービスを探求することで、お客さまと当社が共に成長できる関係を目指します。
③ 業界団体および共同研究への参画
当社は、日本半導体製造装置協会(SEAJ)の監事を務め、環境部会にて省エネルギー・省CO2の議論をリード
しています。また、国際半導体製造装置材料協会(SEMI)において、半導体気候関連コンソーシアムへ設立メン
バーとして参画しています。
さらに、次世代技術の開発にも積極的に取り組みます。産業部門・家庭部門の幅広い省エネに貢献するパワーエ
レクトロニクスの共同研究体であるつくばパワーエレクトロニクスコンステレーション(TPEC)の一員として、
研究開発や人財育成の取り組みに参画。東北大学国際集積エレクトロニクス研究開発センター(CIES)との研究
開発に参画、長岡パワーエレクトロニクス研究会にも参加しています。
このような取り組みを通して、中長期的・シーズ視点での製品開発にも尽力し、技術的なブレイクスルーやそれ
に伴う業界変革を捉えます。
上記①・②・③の方針を踏まえ、半導体製造装置事業の売上を2027年度までに1,400億円まで伸長させることを目標
とします(2025年度実績:1,279億円)。
また、業界で唯一「計測技術」を持つ半導体製造装置メーカーとして、両技術の融合にも取り組みます。半導体製
造装置に計測機器をビルトインすることで、より高精度の検査・加工を可能とし、唯一無二の価値を提供します。
― 19 ―
2.気候変動に関連する精密測定機器事業の機会
2050年のカーボンニュートラルを達成するためには、温室効果ガス排出量が大きい電力分野の脱炭素化だけでな
く、非電力分野(民生・産業・運輸)においても、省エネルギー化や電化をはじめとする多種多様な取り組みが必
要です。その中で重要な役割を果たす工業製品は、日々高精度化、高度化、複雑化しており、モノづくりを効率よ
く、安定して合理的に供給するには、形状や輪郭を管理し、長さや表面粗さを測定する精密測定機器事業が欠かせ
ません。当社の計測技術は、電力・非電力分野にかかわらず、幅広い領域でカーボンニュートラル施策の根幹を担
っています。
再生可能エネルギー分野の拡大に対応した、高機能精密測定機器事業
例えば再生可能エネルギーの主力電源化には、太陽光・風力・水力・地熱・バイオマスなどがあり、主力電源化
するには複数の電源を組み合わせた安定的かつ効率的な電力供給の実現が求められます。太陽光以外の多くはエネ
ルギーを取り出すために、大型で高精度、高効率なタービンやプロペラ、発電機などの回転体を必要とします。中
でも洋上風力発電は、成長性や経済波及効果から注目度の高い電源で、その発電効率を左右する重要部品が、数メ
ートル規模にもなる大型ベアリングやハウジング、プロペラなどです。真円度や円筒度、表面粗さ、内部の歪み・
傾きの有無を高精度に測定できれば、発電効率の向上と信頼性確保に直結します。当社は、独自の高精度計測技術
によってこれらの品質評価を実現し、風力発電の導入効果最大化に貢献。他の再生可能エネルギー分野でも、設備
の長寿命化・発電効率向上に寄与する計測を実現しています。
蓄電池産業の拡大による高速高精度な充放電試験システム製品
蓄電池は、電気自動車や航空宇宙産業の動力源や、太陽光・風力などの再生可能エネルギーの出力変動調整に用
いる定置用、5G通信基地局やデータセンターなどのバックアップ電源など、さまざまな用途で利用が拡大していま
す。短期的にはEV需要の停滞を受けて市場成長率は鈍化する見通しですが、PHEV/HEVの需要予測も上昇傾向にあ
り、着実に増加する成長市場であることには変わりありません。
当社はその二次電池の性能や信頼性を測定する「充放電試験システム」を開発・販売しています。当社の充放電試
験システムは二次電池のエネルギー性能を正確に計測するために、高速制御、高精度を特長としています。
また、放電エネルギーを一次電源へ回生する機能に加え、チャネル間でエネルギーをシェアする電力変換機能を搭
載。システム全体で、当社比最大30%の省エネルギーを実現しました。
充放電試験自体を受託する評価サービスも提供しており、電動車用バッテリーを中心とした二次電池の性能評価試
験の需要拡大に対応するため、福島県と愛知県に二次電池評価センターを開設しています。
電気自動車・半導体製造装置における計測技術
非電力分野の脱炭素化においては、「電動化による脱炭素エネルギーへの転換」と「デジタル化による効率化」
が大きな役割を果たします。
当社は三次元座標測定機やX線CT装置による計測技術を活用し、今後急速な市場拡大が見込まれる電気自動車の固有
部品、駆動モータユニットやインバータ、バッテリーの高精度な計測を支援、新エネルギー車の普及に貢献しま
す。
また、「デジタル化」を担う半導体デバイスメーカー、電子部品メーカー、半導体・電子部品製造装置メーカー、
同検査装置メーカーの開発・生産活動に必要不可欠な精密測定機器を提供し、半導体デバイスの高度化や需要拡大
を支えます。
― 20 ―
温度変化に強い計測製品群
世界各国が2050年カーボンニュートラルに向け掲げる目標が達成されたとしても、世界の平均気温は0.5~1℃上
昇する見通しで、気候変動対策が進展しなければ、4℃以上の平均気温上昇や極端な気象現象の発生確率が高まるこ
とが予想されます。
このようなリスクに対し、当社は測定環境の温度変化に強い計測製品群を提供しています。温度管理が困難な測定
環境下では、従来の精度保証環境温度を上回る恒常的な気温上昇にも一定程度対応。工場内における計測・検査プ
ロセスも柔軟に設計できるため、生産工程のより早い段階で計測・検査を行え、生産性向上にも貢献できます。
温度管理が可能な測定環境下であれば、保証環境温度の幅を広げ空調の設定温度を緩和することで、計測精度を保
ちながら省エネ・コスト削減に貢献できます。単位時間当たりの温度変化にも強いため、高コストな精密空調では
なく一般空調環境下でも高精度な測定が可能です。保証環境温度の幅が広がると、人体への負荷は増加するため、
当社の自動化技術を提案し解決していきます。
また、待機時には圧縮空気の供給を自動停止する機能(Air Saver機能)の搭載により、作業者の手間なく省エネに
貢献。既存当社設備にこの機能を後付けすることもできます。
複雑なエンジン部品形状の計測技術
航空機分野では、さらなる軽量化とエネルギー効率の向上に向け、機体構造やエンジン設計そのものの高度化が
重要な開発テーマとなっています。その代表例が、エンジンのブレードとローターディスクを一体化した「ブリス
ク」です。ブリスクは部品点数の削減、軽量化、空力性能向上に寄与しますが、複雑な三次元形状ゆえに製造精度
の確保が難しく、精密な品質評価が不可欠とされています。
当社が取り扱うカール・ツァイス社の三次元座標測定機「PRISMO fortis Aero」は、航空宇宙産業向けに設計され
た高剛性構造と高精度スキャニング技術を備え、ブリスクをはじめとする複雑形状部品の詳細な輪郭・形状測定を
短時間で実施可能です。接触式・非接触式センサを柔軟に組み合わせられるため、薄肉ブレードやエッジ部のよう
な高難度領域に対しても、安定した精度での測定を実現します。
新たに生まれるニーズと当社の提供価値
絶えず変化していく社会環境やお客さまニーズに対応しカーボンニュートラルを実現するために、当社は多彩な
計測技術・製品を通じ、社会の脱炭素への道のりを支援し続けます。
予想される社会の変化
1
再生可能エネルギーの主力電源化
2
蓄電池の普及と増加
3
電動化・デジタル化・自動化
4
地球温暖化による気温上昇
5
新たに生まれる課題
大型ベアリングの歪み・
傾き
電池の性能や信頼性
高速制御、高精度、低消
費電力、多機能化
測定環境の温度変化の拡
大
当社の提供価値(例)
高精度計測技術で品質評価
充放電試験システムによる性能評価試験
精密測定機器による高精度な計測
測定環境の温度変化に強い計測製品群
航空機の機体構造・エンジン設計の
複雑な三次元形状ゆえに 高難度領域に対する安定した精度での測
高度化
製造精度の確保が困難
― 21 ―
定
精密測定機器事業の戦略と目標
当社はカーボンニュートラル実現に向けた世界の動きを事業機会と捉え、精密測定機器事業の持続的な成長を実
現するために、以下の戦略を実行していきます。
① 電動化・デジタル化に貢献できる拠点拡充・設備増強
必然性を増す地球温暖化対策に応え、社会の電動化・デジタル化に貢献していくために、精密測定機器事業の拠
点の拡充および設備増強も視野に入れ、事業機会を逃さない投資を行っていきます。
② 製品のみならずソリューションを提供
当社の強みである精密測定技術を十全に活かすために、福島県石川郡や愛知県春日井市に設けた「二次電池評価
センター」で電池評価受託サービスを行うなど、製品提供にとどまらないソリューション展開を実施。より幅広
いお客さまのご要望にお応えし、持続可能な社会の実現に貢献します。
③ 社内外とのコラボレーションを推進
半導体製造装置事業が手掛ける機器に当事業の精密測定技術を組み込み、より高効率な半導体製造装置を供給し
ていくことで、カーボンニュートラルに不可欠な要素である電動化・デジタル化を加速していきます。またモノ
づくりの基準となるISO、JIS規格委員会への参加、大学や研究機関との共同開発、航空宇宙産業や自動車メーカ
ーからの二次電池性能評価試験受託など、社外と手を携えた電動化・デジタル化を目指す取り組みも拡大。脱炭
素化への一助を担います。
上記①・②・③の方針を踏まえ、精密測定機器事業の売上を2027年度までに450億円まで伸長させることを目標とし
ます(2025年度実績:390億円)。
また、業界で唯一「計測技術」を持つ半導体製造装置メーカーとして、両技術の融合によるシナジーの発揮も目指
します。
― 22 ―
(リスクに対する戦略)
1.BCP・BCMS強化
気候変動による自然災害などのリスクの高まりに加え、経済安全保障などの観点からも、有事の事業継続ニーズ
が高まっています。そうした背景を受け、当社では事業継続計画(BCP)および事業継続マネジメントシステム
(BCMS)の強化に取り組んでいます。
また、気候変動に伴う災害激甚化に備え、自社工場の操業停止、サプライヤーや協力会社の被災を想定し、以下
の計画・マネジメントを実施しています。
自社工場の被災想定
:当社工場(八王子、土浦、飯能)の浸水リスクを自治体のハザードマップなどを基に
評価し、浸水リスクが十分に小さいことを確認しています。
サプライヤー・協力会社:取引金額や代替不可能性など、当社事業への影響の大きさを考慮のうえ、自治体のハ
ザードマップや世界資源研究所(WRI)「Aqueduct Floods」などの評価ツールを用い
て浸水リスクを評価し、リスクが高いと判断したサプライヤーに対しては、対策の検
討を順次進めています。
2.Scope3(カテゴリー11)に対する戦略
LCAを元にScope3
カテゴリ1~カテゴリ15を算出した結果、半導体製造装置のカテゴリ1とカテゴリ11のイン
パクトが最も大きく、全体の70%を超えており、削減取り組みの重要度が高いことが分かりました。
半導体製造工程では、当社製品自体の電力消費に加えて、クリーンルームの維持や温度制御、半導体の洗浄に必
要な超純水の製造でもエネルギーが消費されます。
当社としても、製品のフットプリント(専有面積)を削減することにより、製品あたりで必要な空調のエネルギ
ー削減や、半導体の切削・加工をより少量の水(超純水)で行える製品開発などに取り組んでいます。
当社の新製品開発における設計原則には、「コンパクト化」「ライフサイクルでの省エネ設計」「省資源設計」
が含まれ、製品開発時に間接排出量に関するCO2排出も含めたLCAの評価と目標値の設定を行っています。
④ 目標・指標
当社グループは、2050年カーボンニュートラルを目指します。
当社単体では、2030年度達成に向けたCO2 (Scope1およびScope2)排出量削減目標を策定しています。
当社が排出する温室効果ガス(GHG)は、工場操業時に使用される購買電力換算分のCO2が大半を占めるため、
省電力に重点を置いた活動に取り組んでいます。
2018年度(基準年)より、設備の見直し、太陽光発電システム導入、低炭素電力導入などでCO2排出量の削
減に取り組みました。しかし、半導体需要の拡大による大幅な生産増や新工場の竣工、新ビジネスの開業などのた
め、2025年度の当社排出量は12,796t-co2となりました。(2018年度比3.9%増加)
今後は2030年度の目標値50%削減に向け、さらに省エネルギー活動の推進、太陽光発電システムの増設、非化
石証明書の活用などを進めます。
― 23 ―
(CO2排出量削減目標)
2030年目標:2030年度までに、Scope13およびScope24の排出量を50%削減(2018年度比)
対象範囲:当社単体
*3
:自社による温室効果ガスの直接排出(燃料の燃焼、自家発電、工業プロセスからの排出)
*4
:他社から供給された電気、熱の使用に伴う間接排出(例えば電力会社からの買電など)
(CO2排出量の実績と2030年度の目標)
2018年度
実績
2020年度
実績
2021年度
実績
2022年度
実績
2023年度
実績
2024年度
実績
2025年度
実績
2030年度
(目標)
排出量(t-CO2)
12,312
9,524
8,191
8,257
11,598
12,733
12,796
6,156
(2018年度比)
-
22.64%減
33.47%減
32.94%減
5.80%減
3.42%増
3.93%増
50.00%減
25,765
28,843
29,835
29,546
37,432
43,316
44,469
-
-
3,659
5,089
4,929
5,676
5,885
7,266
-
電力使用量(Mwh)
Scope2削減量
(t-CO2)
対象範囲:当社単体
2022年度まで
:
八王子工場、土浦工場
2023年度以降
:
八王子工場、土浦工場、飯能工場(7月竣工以降)、二次電池評価センター 福島サイト[旧古
殿工場](10月事業譲渡以降)
当社グループのサステナビリティへの取り組みに関する詳細は、当社ホームページにて開示しています。
https://www.accretech.com/jp/sustainability/index.html
― 24 ―
(4) 人的資本に関する戦略並びに指標及び目標
① 人財育成
従業員一人ひとりの成長は、当社グループが持続可能な成長を続ける上で不可欠なものであるという考えのも
と、下記のとおり人財育成方針を定めています。
(人財育成方針)
当社グループのミッションは、
「世界中の優れた技術・知恵・情報を融合して世界No.1の商品を創りだし、皆さまと共に大きく成長していく」
「WIN-WINの仕事で世界No.1の商品を創ろう」です。
そして、そのミッションを果たすために求められる人財像は、以下のとおりです。
・お客さまの課題に向き合い、お客さまの課題を解決することで高い信頼を得られる人財
・多様な価値観を受入れ、相手の視点でものを見ることで、お互いの強みを引き出し、協力し合うことがで
きる人財
・自らの思いを、技術や業務の革新につなげ、高い目標にチャレンジし、自律的に成長できる人財
当社グループは、最大の財産である従業員の成長を支援するため、以下の社内環境を整備し、施策を推進し
ます。
・従業員の成長段階に応じた教育研修をはじめとした教育プログラムの提供
・現場でのチャレンジの場や上司とのコミュニケーションによる支援の場の設定
・多様な人財が働きがいを感じ、活躍できる環境づくりや各種施策の推進
(研修制度)
当社では、技術・営業・製造・サービス・管理の職種ごとにキャリアパスを設定しており、「従業員一人ひ
とりが、自主性に基づき教育研修に参加できる環境・機会(プラットフォーム)を提供する」、「会社が、従
業員の成長タイミングに合わせ、必要な知識習得支援を行う」という考えに基づき、従業員の能力開発のため
のさまざまな研修制度を設けており、人財育成に取り組んでいます。
研修は、共通研修、階層別研修、部門別研修に分かれており、それぞれの研修において、従業員がお互いに
学びあう集合研修、実務を通じての成長を促すOJT、自律的な学びをサポートする自己啓発支援を実施して
います。
・共通研修
: 全社共通で求められる知識・スキルの習得を目的として実施
・階層別研修 : 各職階において担当業務を遂行する上で必要となるスキルの習得を目的として実施
・部門別研修 : 組織別、業務別に必要となる専門性の高い知識を各部門で実施
共通研修(主要テーマ)
時間
人財育成力研修
831.6
360度フィードバック振り返り研修
227.5
e-learning
2,636.8
計
3,695.9
― 25 ―
階層別研修(主要テーマ)
時間
新入社員研修
7,171.5
管理職研修
2,132.4
新任管理職向け研修
106.4
新任主任向け研修
290.1
新任主任補向け研修
502.8
新入社員1年目フォローアップ研修
512.1
新入社員3年目フォローアップ研修
580.9
ステップアップ研修
416.2
20代向けライフプランセミナー
74.0
計
11,786.4
部門別研修(主要テーマ)
下記研修をはじめ、各部門で必要に応じた教育を実施しています。
(社内)技術研修、機械設計研修、電気回路設計研修、SEAJ推奨安全教育
(外部)プログラミングセミナー、ソフトウェア関連セミナー、半導体関連セミナー
(自律人財の育成)
当社では、自律的に成長する従業員の育成に向け、上司に対して「人財育成力研修」を推進しています。そ
の研修を通じ、上司が「成長を促進する対話力」を身に付けることを目指しています。2026年3月末時点で、上
司の80.7%が本研修を受講しており、部下育成に取り組んでいます。今後も引き続き、新たに上司となった従
業員へ研修を実施していきます。
また、上司が自らの行動を客観的に振り返る機会として、360度フィードバックを年に一度実施するととも
に、振り返り研修会を実施しています。
(自己啓発支援)
自己啓発支援の一環として、e-learningおよび通信教育による学習機会を提供しています。e-learningにつ
いては、近年、学習コンテンツおよび提供形態を大幅に見直し、国内外で幅広く活用されているオンライン学
習サービスを導入しました。
本e-learningおよび通信教育では、ビジネス、技術、語学、資格取得対策など、幅広い分野にわたる多数の
講座を用意しており、従業員は自身のキャリア志向や習得したいスキルに応じて、講座を自由に選択し受講す
ることができます。e-learningは受講料を会社負担とし、通信教育については、修了者に対して受講料の全額
補助を行っています。
これらの制度を通じて、従業員一人ひとりの成長段階やニーズに応じた継続的なスキルアップを支援してい
ます。
② 多様性
当社グループは、多様な視点や発想が、互いを刺激しあって新たな価値を創造し、個人の能力の総和を超える相
乗効果を得ることができると考えています。そのため、年齢、性別、人種、宗教、出身国、障がい者等を理由とす
る一切の差別的行為を防止するとともに、多様な人財が、安全・健康で働ける職場の実現に努めています。
そして、従業員一人ひとりの個性が尊重され、自身の持つ能力を最大限発揮でき、やりがいを持って働ける環境
を構築していきます。
― 26 ―
(女性活躍の推進)
当社は、中核人財として女性が一層活躍できる組織の実現に向け、女性正社員の採用拡大及び職場環境の整
備が喫緊の課題であると認識し、「女性活躍推進に関する行動計画」(2021年度-2025年度)を策定のうえ、各
種施策を推進してきました。
その結果、2025年度末を目標として掲げていた各指標について、前倒しで達成することができました。これ
を受け、当社は新たに「女性活躍推進法に基づく行動計画」(2025年度-2026年度)を策定しました。
今後も、女性正社員の採用拡大を継続するとともに、これまで以上に女性の活躍を促進するための取り組み
を強化し、持続可能な組織づくりを目指していきます。
<女性活躍推進に関する行動計画(2021年度-2025年度)における目標>
・採用者に占める女性割合(正社員)
20%
・従業員に占める女性割合(正社員)
10%
<女性活躍推進法に基づく行動計画(2025年度-2026年度)における目標>
・管理職及び主任、主任補の女性を2025年3月比で1.5倍以上とする
・フルタイム労働者の平均所定外労働時間を25時間未満とする
上記行動計画は、当社ホームページにて開示しています。
https://www.accretech.com/jp/sustainability/esg/diversity.html
2021年度末
実績
2022年度末
実績
2023年度末
実績
2024年度末
実績
2025年度末
実績
採用者に占める女性割合(正社員)
17.0%
18.3%
22.1%
21.8%
16.9%
従業員に占める女性割合(正社員)
7.4%
8.5%
10.3%
11.6%
11.3%
管理職及び主任・主任補における女性人数の増加倍率
2025年度末
管理職
1.16 倍
主任・主任補
1.23 倍
(注)倍率は、2025年3月末時点の「管理職及び主任、主任補の女性人数」を1.00として算出しています。
2025年度
フルタイム労働者の平均所定外労
働時間
20.9 時間
管理職に占める女性割合、男性の育児休業取得率、男女賃金の格差につきましては、「第4 提出会社の状況
5 従業員の状況等」に記載しています。
<具体的な取り組み>
女性採用
・新卒採用活動において、女性学生を対象とした1day仕事研究を実施し、女性社員が登壇する機会を設け
ることで、当社における働き方やキャリア形成について具体的なイメージを持てるよう支援していま
す。
・女性求職者が安心して応募・選考に臨めるよう、採用ホームページ、会社説明会、面接等の各採用プロ
セスにおいて、女性社員が登場・関与する機会を拡充し、当社への理解促進および志望度向上を図って
います。
― 27 ―
女性社員のキャリア開発支援
・管理職向けの人財育成力研修において女性部下の育成に関する意識啓発を実施するとともに、研修で得
た知見を上司と部下との個別面談において活用し、女性社員のキャリア形成支援および女性活躍推進に
取り組んでいます。
・外部カウンセリングサービスを2022年4月より導入し、女性社員に限らず全従業員が利用可能な相談環
境を整備しています。
女性社員交流の場
・女性新入社員に対し、女性の先輩社員をパートナーとして選定し、定期的な面談等を通じた交流を促進
しています。
仕事とライフイベントの両立支援
・フレックスタイム制のコアタイムを廃止し、育児や介護等の事情に応じて柔軟な働き方を可能とするこ
とで、社員が長期的に働き続けられる環境づくりを推進しています。
(障がい者雇用の推進)
障がい者の方々が社会的に自立し活躍できる職場づくりに取り組んでいます。ハローワークとの連携や、就
労支援機関や特別支援学校等との協力により、個々の適性に合った業務や職場への就労支援を行っています。
<具体的な取り組み>
事業運営・雇用創出
・障がいのある社員が成長を実感し、会社への貢献を通じて働きがいを持って就業できる職場づくりを目
的として、2023年4月より、障がい者を中心とした職場を設置しています。さらに、当該職場を母体と
して、グループ全体における持続的な障がい者雇用の創出および定着支援、業務領域の拡大による活
躍機会の創出を目的に、2026年4月より、連結子会社を特例子会社化する取り組みを進めています。
・事業部門よりスキャン業務、組立業務等を受託し、事業活動を通じた安定的な雇用と業務品質の向上を
実現しています。
・管理職および指導員を配置し、障がいのある社員を含めた体制の拡充を図っています。
人財育成・教育
・障がいのある社員の業務スキル向上および安心して働ける職場環境づくりを目的として、安全教育、PC
研修、コミュニケーション研修、ストレスケア研修等を実施しています。
・指導員に対しては、障がい者支援スキル向上を目的とした研修や、職場内サポーター養成、ジョブコー
チ育成に関する研修を実施し、支援体制の高度化を図っています。
外部連携・地域との協力
・就労支援機関や特別支援学校等と連携し、職場見学や実習の受け入れを通じた相互理解の促進および雇
用機会の創出に取り組んでいます。
・地域企業との情報交換を継続的に行い、障がい者雇用に関する知見の共有と取り組みの充実を図ってい
ます。
2021年6月
2022年6月
2023年6月
2024年6月
2025年6月
障がい者雇用率
1.95%
2.07%
2.17%
2.43%
2.43%
法定雇用率
2.30%
2.30%
2.30%
2.50%
2.50%
(外国籍及び中途採用者雇用)
当社において中途採用人財は既に欠かせない戦力となっています。また当社は国籍に関わらず優秀な人財を
採用、登用しています。中途採用人財、外国籍人財いずれも多様な視点や発想及び海外との緊密な連携等に大
きな力を発揮しています。
当社の管理職における外国籍従業員割合は0.4%、同中途採用者割合は41.0%です。
― 28 ―
③ エンゲージメント
当社グループが変化の激しい事業環境の中で持続的な成長を実現していくためには、従業員一人ひとりが自身の
能力を最大限に発揮し、高いパフォーマンスを発揮できる環境を整備することが重要であると考えています。
当社では、従業員の創造力やチャレンジスピリットを育み、モチベーションの向上を図ることを目的として、改
善提案表彰、技術表彰、新事業企画提案表彰の制度を設けています。これらの受賞者については、社内報での特集
や成功事例報告会での発表の場を設けるなど、会社として創意工夫や新しい取り組みへの挑戦を積極的に評価する
姿勢を従業員に周知しています。
また、従業員のエンゲージメントの状態を定量的に把握するため、2023年3月よりエンゲージメントサーベイを
開始し、以降、年1回の頻度で継続的に実施しています。さらに、各職場の特性や課題に応じた、より効果的なエ
ンゲージメント向上施策を推進するため、事業・部門横断的な組織を立ち上げ、全社的な連携のもとで取り組みを
進めています。
④ 健康
当社グループは、人がその能力を最大限に発揮していきいきと働くためには、心身ともに健康で、家族も健やか
であることが大切であると考えています。当社グループでは、従業員とその家族の健康な生活を後押しし、長時間
労働を避けるための就労時間管理を厳格に行う等、働きやすい職場づくりに取り組んでいます。
(ストレスチェック実施)
当社は毎年、定期健康診断、人間ドック、婦人科健診など社員の健康チェックを実施し、有所見者への再検
査勧奨や特定保健指導を行っています。また、ストレスチェックについては、海外赴任者や出向者も含めて受
検率が99%を超えており、自身のメンタル不調に早く気づいてもらうきっかけとして運用が定着しています。
ストレスチェック結果については、法令に従った個人結果管理と本人へのフィードバック、高ストレス者への
産業医面談を実施しています。さらに、組織分析を行い、リスクコンプライアンス委員会及び安全衛生委員会
に報告の上、職場の環境改善に取り組んでいます。
(健康増進)
当社は、従業員が心身ともに健康で働けるよう専属産業医と連携し、面談等による従業員のフォローや所属
部門長へのフィードバック、健康トピックの動画配信、衛生講話ビデオ、社内報での健康増進コラム連載等を
進めています。
また、健康保険組合連合会東京連合会に「健康企業宣言」を行い、2020年8月に「健康優良企業銀」、2026
年3月に「健康優良企業金」を取得いたしました。
「健康企業宣言」は、当社ホームページにて開示しています。
https://www.accretech.com/jp/sustainability/esg/health.html
(ワークライフバランス)
当社グループでは、従業員一人ひとりが仕事と生活を両立しながら、その能力を最大限に発揮できる職場環
境の整備に取り組んでいます。
子育てや家族の介護、病気やケガなど、さまざまな事情を抱える従業員を支援するため、当社では法定基準
を大きく上回る独自の休業制度を設けています。
さらに、従業員が仕事と子育てを両立し、すべての従業員が安心して働ける環境を実現するため、「次世代
育成支援対策推進法」に基づく行動計画(2025年度-2026年度)を策定しました。
各種制度、並びに上記行動計画は、当社ホームページにて開示しています。
https://www.accretech.com/jp/sustainability/esg/work_life_balance.html
― 29 ―
3 【事業等のリスク】
当社は、業務執行に係るリスクの把握と管理を目的として「リスク管理規程」を定め、代表取締役社長を責任者と
する「リスク管理委員会」を設置し、潜在的なリスクの発生予防と危機発生に備えた体制整備を行っています。ま
た、リスクが発生したときは直ちに代表取締役社長を本部長とする「リスク対策本部」を設置し、リスクへの対応と
速やかな収拾に向けた活動を行う体制を整えています。
有価証券報告書に記載した事業の状況、経理の状況等に関する事項のうち、経営者が連結会社の財政状態、経営成
績及びキャッシュ・フローの状況に重要な影響を与える可能性があると認識している主要なリスクは、以下のとおり
です。当社グループにおいては、これらリスクの発生を防止又は分散、ヘッジすること等によりその回避ないし軽減
を図っていますが、予想を超える事態が生じた場合には、当社グループの業績に重大な影響が及ぶ可能性がありま
す。
なお、文中の将来に関する事項は、当連結会計年度末現在において当社グループが判断したものです。
(販売活動に係るリスク)
① 当社グループは、半導体製造装置と計測機器の事業を、日本・欧米・アジア等グローバルに展開していますが、
各事業での需要と供給のバランスの変動や、各地域の経済環境の悪化により、当社グループの業績に影響が及ぶ
可能性があります。
② 海外への販売については基本的に日本円建てを原則としていますが、一部の顧客への決済は米ドル又はユーロ等
の外国通貨建てとなっています。また、連結財務諸表作成のための海外連結子会社の財務諸表は所在国通貨で作
成されています。このため、為替レートに予期せぬ変動が生じた場合、当社グループの業績に影響が及ぶ可能性
があります。
③ 当社グループが海外へ販売する製品の一部は、日本の貿易管理令の定めるところにより輸出に際し許可を取得す
る必要があります。このため、貿易管理令対象製品の変更や関連法令の改正が行われた場合、当社グループの業
績に影響が及ぶ可能性があります。
④ 当社グループは海外売上高が過半を占めているため、日本と第3国、又は第3国間の貿易紛争により輸出入が困
難となる事象が発生した場合、当社グループの業績に影響が及ぶ可能性があります。
(生産・開発活動に係るリスク)
① 当社グループの事業分野では技術進化が著しく、先端技術の開発とその製品化への努力は競争力の維持・強化の
ために必要不可欠ですが、これらの開発並びに製品化の努力が成功に結びつかなかった場合は、当社グループの
業績に影響が及ぶ可能性があります。
② 当社グループは、生産活動の中断による損害を最小限に抑えるため、製造設備の定期的な防災点検、設備保守、
安全性を向上する設備投資、並びに事業継続計画に基づくグループ内の生産設備を使用した代替生産が可能な体
制作り等を進めていますが、突発的な事象により製造設備等が想定外の損害を被った場合は、当社グループの業
績に影響が及ぶ可能性があります。
③ 当社グループは、顧客納期の遵守の観点から、十分な生産スペースの確保、必要に応じた新工場の建設による増
床、部材等の安定在庫の確保に努めるとともに、製品の据付に係る従業員の整備等に努めています。しかしなが
ら、製品需要の想定以上の拡大により、生産スペースや部材等の不足、並びに据付に係る従業員の不足等が発生
した場合、納期の遅延が発生し、当社グループの業績に影響が及ぶ可能性があります。
④ 当社グループの生産活動には、高品質の部材やサービス等が適時・適量に供給されることが必要であり、所要の
在庫対応の他、安定調達のため極力複数の供給者からの購入体制をとっています。しかしながら、一部の基幹部
品は、その特殊性から調達先が限定又は切り替えが困難なものが存在します。当該部品の供給不足・納入遅延等
が発生した場合、当社グループの生産活動に支障が発生し、当社グループの業績に影響が及ぶ可能性がありま
す。
⑤ 当社グループは製品・サービスの品質や信頼性の向上に常に努力を払っていますが、予想し得ない当社製品の品
質上の欠陥により直接的・間接的損害を生じさせた場合、当社グループの社会的信用の失墜、賠償責任の負担、
対策費用の負担、更にはその影響による収益の減少等により当社グループの業績に影響が及ぶ可能性がありま
す。
― 30 ―
⑥ 生産・販売活動に係る部材やサービス等の価格高騰により、当社グループの業績に影響が及ぶ可能性がありま
す。
(知的財産に係るリスク)
当社グループの製品の多くは最先端技術を搭載した製品であり、その技術関係の保護については特別の配慮をし
ています。特に特許関係の権利帰属、商標・ブランドの保護等については会社の利益が損なわれないように施策を
講じていますが、日本及び海外において、やむを得ず第三者との権利関係をめぐる訴訟等が発生した場合、当社グ
ループの業績に影響が及ぶ可能性があります。
(情報流出に係るリスク)
当社グループは、事業活動における顧客等の機密情報並びに当社グループの技術・営業・その他事業に関する機
密情報を保有しています。当社グループは、「情報セキュリティ基本方針」に基づき、各国の法令に準拠しつつ、
情報セキュリティ規程の整備、各種情報セキュリティ対策及び教育・訓練を実施する等、情報の取扱いには細心の
注意を払っていますが、過失や盗難、外部からの攻撃等による不測の事態により情報が外部流出もしくは改ざんさ
れる可能性があります。万一このような事態が生じた場合には、当社グループの信用低下や影響を受けた方への補
償等により、当社グループの業績に影響が及ぶ可能性があります。
(環境規制に係るリスク)
当社グループは、国内外において、水質汚濁防止、大気汚染防止、廃棄物規制、環境規制、エネルギー問題、地
球温暖化対策及び製品含有化学物質管理等の環境に関する様々な規制の適用を受けています。当社グループは、環
境に与える負荷を低減し、かつ関連規則を遵守するため、製品の開発や製造工程において様々な施策に取り組んで
います。しかし施策で期待した成果が得られなかった場合や、これらの規則や運用の厳格化等が行われた場合に、
当社グループの生産活動に対する制約の発生、規則遵守対応に関する費用発生等によって、当社グループの業績に
影響を及ぼす可能性があります。
(コンプライアンスに係るリスク)
当社グループの事業は、関連する各国の各種法的規制の適用を受けています。そのため、内部統制システムを整
備するとともに、「コンプライアンス委員会」を設置し、法令遵守のみならず、役員・従業員が共有すべき倫理観、
規範等を「ACCRETECHグループ行動規範」として制定し、当社グループにおける行動指針の遵守並びに法令違反等の
予防に努めています。しかしながら、役職員個人による法令違反を含むコンプライアンス上の問題が発生した場合
には、当社グループの社会的信用や業績及び財政状況等に影響を及ぼす可能性があります。
(包括的なリスク)
① 当社グループは、全世界で事業活動を行っており、事業を展開する各国の法的規制、環境規制、関税を含む税務
基準等の適用を受けるほか、事業活動にあたり許認可を受ける必要があります。当社はそれらの規制・基準等を
遵守するほか、必要な許認可を受けることで事業活動を行っていますが、予期せぬ法的規制、環境規制、関税政
策、許認可手続の変更等により、当社グループの業績に影響が及ぶ可能性があります。
② 日本及び進出先各国並びに周辺各国で企業活動が停滞する水準の自然災害、疾病、テロ、戦争等が発生した場
合、営業活動、調達、生産、輸送、納入並びに間接処理が停滞し、結果として当社グループの業績に影響が及ぶ
可能性があります。
― 31 ―
4 【経営者による財政状態、経営成績及びキャッシュ・フローの状況の分析】
(1) 経営成績等の状況の概要
当連結会計年度における当社グループの財政状態、経営成績及びキャッシュ・フロー(以下、「経営成績等」とい
う。)の状況の概要は次のとおりです。
①
財政状態及び経営成績の状況
当連結会計年度の世界経済は、年度前半において米国では個人消費を中心に内需が底堅く堅調に推移し、日本お
よび欧州でも緩やかな持ち直しが見られるなど、全体として回復基調で推移しました。年度後半にかけては、通商
政策の緊迫化に伴うエネルギー関連コストの上昇リスクが意識されるなど、先行きリスクが高まる状況となりまし
た。
このような環境下で当社を取り巻く状況は、AIやテクノロジー関連の設備投資の増加により、生成AIを含む
HPC(High Performance Computing)関連の需要が高まり、半導体製造装置部門で前期比の増収につながりました。
計測機器部門でも国内のものづくり関連投資が安定推移したうえ、航空・宇宙・防衛分野の事業機会を新たに獲得
したことで、こちらも前期比で増収となりました。
インフレやエネルギー関連コストの上昇に伴い部材費や人件費が上昇したものの、既往ピークの売上高により営
業利益、経常利益も前期比で増加し、第2四半期に半導体製造装置部門の一部製品に関する不具合対策費用を特別
損失として計上したものの、純利益は前期比でほぼ同水準となりました。なお、中東情勢の悪化が当連結会計年度
に与えた影響は軽微でした。
その結果、当連結会計年度における業績は、売上高は166,839百万円(前年同期比10.8%増)となり、利益面は、
営業利益33,738百万円(同13.6%増)、経常利益34,825百万円(同16.3%増)、親会社株主に帰属する当期純利益は
24,739百万円(同3.5%減)となりました。
セグメントごとの経営成績は次のとおりです。
半導体製造装置
半導体製造装置部門の受注面では、期を通じてHBM(High Bandwidth Memory, 広帯域メモリ)向けプローバやAIパ
ッケージング工程に向けたグラインダの引き合いが底固く推移したこと、中国における高精度装置の要求が継続し
たこと等により前期比で増加しました。
売上面では、概ね顧客要求納期に沿った出荷を進めることができたことに加え、付加価値の高いプローバの出荷
も増加し、既往ピークを更新しました。地域別には、プローバは韓国、台湾、中国など、グラインダ・ダイサ等の
加工装置は台湾、中国、日本などで堅調でした。
こうしたなか、研究・開発面では、引き続き顧客の先進的ニーズに対応した製品開発や将来を見据えた要素技術
開発を進めました。生産面では、長期的な加工装置需要の拡大を見据えた名古屋工場が竣工し、生産キャパシティ
が増加しました。
この結果、当連結会計年度における当セグメントの業績は、売上高127,878百万円(前年同期比12.7%増)、営業
利益28,404百万円(同16.8%増)となりました。
計測機器
計測機器部門の受注面では、期を通じて既存設備の更新需要が安定的に推移したことや、後半にかけてハイブリ
ッド車生産に関連した追加投資、また航空・宇宙・防衛など成長が見込まれる業界向けの案件を獲得したこと等に
より、前年同期比で増加し、既往ピークを更新しました。
売上面では、獲得した受注を顧客要求納期に沿って計画的な出荷に繋げた結果、前期比で増加し、同様に既往ピ
ークを更新しました。
こうしたなか、研究・開発面では、引き続きオートメーション化に向けた汎用計測機器とロボットとのコラボレ
ーションの取り組みなどを進めたほか、半導体製造装置部門の製品とのシナジー効果を拡大させる施策を進めまし
た。
この結果、当連結会計年度における当セグメントの業績は、売上高38,960百万円(前年同期比5.1%増)、営業利
益5,333百万円(同1.1%減)となりました。
― 32 ―
次に当連結会計年度末時点の財政状態の概要を示すと次のとおりです。
当連結会計年度末時点の当社グループの財政状態は、資産合計250,533百万円(うち、流動資産174,607百万円、固
定資産75,925百万円)に対し、負債合計57,617百万円、純資産合計192,916百万円となりました。
i.資産
売上債権が増加したことや固定資産の取得などが主な要因となり、当連結会計年度末の資産の総額は、前連結
会計年度末に対し12,580百万円増加しました。
ⅱ.負債
未払法人税等、長期借入金、契約負債等が減少したことが主な要因となり、当連結会計年度末の負債の総額は
前連結会計年度末に対し4,106百万円減少しました。
ⅲ.純資産
「親会社株主に帰属する当期純利益」の計上により「株主資本」が増加したことが主な要因となり、当連結
会計年度末の純資産の総額は前連結会計年度末に対し16,686百万円増加しました。
この結果、当連結会計年度末の自己資本比率は、前連結会計年度末に比べ3.1ポイント増加し、76.3%となり
ました。
②
キャッシュ・フローの状況
当連結会計年度中「現金及び現金同等物」は1,463百万円減少し、当連結会計年度末の「現金及び現金同等物」
の残高は53,052百万円となりました。
以下、前連結会計年度末と比較して、その内容を営業、投資、財務の各活動別に示すと次のとおりです。
営業活動によるキャッシュ・フローは、その入金超の金額が前連結会計年度28,824百万円から当連結会計年度は
25,012百万円へと減少しました。これは主に「税金等調整前当期純利益」が前連結会計年度の34,275百万円から当
連結会計年度は33,186百万円へ減少したほか、法人税等の支払額10,758百万円、減価償却費5,582百万円、売上債
権の増加7,093百万円、棚卸資産の減少1,939百万円、製品不具合対策引当金の増加1,688百万円等によるもので
す。
投資活動によるキャッシュ・フローは、その金額が前連結会計年度の2,541百万円の入金超から当連結会計年度
は11,491百万円の支出超になりました。これは主に有形固定資産の取得による支出10,990百万円等によるもので
す。
財務活動によるキャッシュ・フローは、前連結会計年度13,991百万円の支出超から当連結会計年度15,674百万円
の支出超になりました。これは主に、配当金の支払額10,177百万円、長期借入金の返済による支出5,000百万円等
があったことによるものです。
― 33 ―
③
生産、受注及び販売の実績
a.生産実績
当連結会計年度における生産実績をセグメントごとに示すと次のとおりです。
セグメントの名称
生産高(百万円)
前年同期比(%)
半導体製造装置
118,160
+12.9
計測機器
32,009
+4.8
150,169
+11.0
合計
(注) 上記生産実績は販売価額によります。
b.受注実績
当連結会計年度における受注実績をセグメントごとに示すと次のとおりです。
セグメントの名称
受注高(百万円)
前年同期比(%)
受注残高(百万円)
前年同期比(%)
半導体製造装置
123,396
+14.6
65,149
△6.4
計測機器
39,700
+4.7
14,210
+5.5
163,096
+12.0
79,359
△4.5
合計
c.販売実績
当連結会計年度における販売実績をセグメントごとに示すと次のとおりです。
セグメントの名称
販売高(百万円)
前年同期比(%)
半導体製造装置
127,878
+12.7
計測機器
38,960
+5.1
166,839
+10.8
合計
(注) 主な相手先別の販売実績及び当該販売実績の総販売実績に対する割合
相手先別の販売実績が連結売上高の100分の10以上となる主要な販売先はないため記載を省略しています。
― 34 ―
(2) 経営者の視点による経営成績等の状況に関する分析・検討内容
経営者の視点による当社グループの経営成績等の状況に関する認識及び分析・検討内容は次のとおりです。
なお、文中の将来に関する事項は、当連結会計年度末現在において当社グループが判断したものです。
①
財政状態の状況に関する認識及び分析・検討内容
当連結会計年度末時点の財政状態の概要は「第2
ッシュ・フローの状況の分析
事業の状況
(1) 経営成績等の状況の概要
①
4
経営者による財政状態、経営成績及びキャ
財政状態及び経営成績の状況」に記載のとおり
ですが、業容の拡大に伴い、資産及び負債が急速に増加するなかでは総資産回転率を向上させ、収益性の確保に努
めることが肝要なことになると認識しています。
②
経営成績の状況に関する認識及び分析・検討内容
当社グループの営む半導体製造装置事業及び計測機器事業は、いずれも技術革新のテンポが早く、製品自体にも
高度に技術的な要求が求められる競争の激しい事業です。また、特に半導体製造装置事業におけるユーザーの属す
る半導体業界等は好不況のサイクルが大きな振幅をもって循環的に訪れる業界であり、当社グループの業績も過去
幾度となくその影響を受けてきました。このような事業環境の中にあっては継続的に製品開発を続け、市場動向の
影響を最小限にとどめることのできるような競争力の強い製品群をつくり続けていくことが何よりも重要なことで
あると認識しています。
ⅰ.売上高
当連結会計年度の「売上高」は、半導体製造装置事業が127,878百万円(前年同期比12.7%増)、計測機器事業
が38,960百万円(同5.1%増)、両事業合計で166,839百万円(同10.8%増)でした。
半導体製造装置部門の業績は、前期から続く生成AIを含むHPC関連装置の更なる拡大が続くと見込むほか、汎
用メモリや、ASIC(Application Specific Integrated Circuit、特定用途向け集積回路)を含むロジック半導体
の生産拡大に向けた顧客の投資が加速すると想定すること等により、概ね堅調に推移すると見込んでいます。こ
れら半導体デバイスの高度化に伴い、特に検査装置(プローバ)を中心に技術要求が高まっており、対応する高付
加価値製品の出荷比率が上昇すると想定しています。これに応えるため、研究・開発面では、顧客の最先端要求
に応えるべく製品開発とそれを支える要素技術をさらに強化・拡大していきます。販売面では、顧客ニーズを迅
速に把握して開発へ反映するため、海外のデモセンター設備の強化を進めます。生産面では、検査装置の製造を
担う飯能工場(埼玉県)の近隣に新工場を建設する取り組みを進めるほか、長期的な需要増を踏まえ、八王子市
(東京都)に新たな生産拠点を設立する準備を進めていきます。
計測機器部門の事業環境は、NEV(電気自動車)への移行が当初の想定より緩やかに推移することが充放電試験
システムの急速な普及に向かい風とみる一方、ハイブリッド車への回帰に伴う設備投資が加速すると見込まれま
す。また、当社が注力する分野である航空・宇宙・防衛分野、エネルギー分野や、半導体製造装置業界の活性化
に伴う引合いの増加も見込んでいます。さらに、当部門の先行指標となりうる工作機械の受注動向が緩やかな回
復基調を維持すると見込まれることから、全体としてゆるやかな成長基調が続くものと想定しています。当社
は、これらの需要を獲得するため、半導体製造装置部門とのシナジー拡大に向けた新製品・新機能の開発に注力
します。加えて、汎用・自動計測機器、充放電試験システム、X線CTシステムなど幅広い機器を組み合わせたオ
ートメーションの強化に努めています。
ⅱ.売上原価、販売費及び一般管理費
当連結会計年度の「売上原価」は97,978百万円、「販売費及び一般管理費」は35,122百万円でした。
「売上高」に対する「売上原価」の比率は前連結会計年度の58.5%に対し当連結会計年度は58.7%、「販売費及
び一般管理費」の比率は前連結会計年度の21.8%に対し当連結会計年度は21.1%でした。
ⅲ.営業損益
これらの結果、当連結会計年度の営業損益は33,738百万円(前年同期比13.6%増)の利益となりました。セグ
メント別の損益では、半導体製造装置事業が28,404百万円(同16.8%増)、計測機器事業が5,333百万円(同1.1%
減)の利益でした。
ⅳ.営業外収益、営業外費用
当連結会計年度の営業外収益は「受取配当金」「為替差益」「投資事業組合運用益」等により総額1,481百万
円、営業外費用は「支払利息」「支払補償金」等により総額394百万円でした。
― 35 ―
ⅴ.経常損益
これらの結果、当連結会計年度の経常損益は34,825百万円(前年同期比16.3%増)の利益となりました。
ⅵ.特別利益、特別損失
当連結会計年度の特別利益は「投資有価証券売却益」等により194百万円、特別損失は「製品不具合対策費」
により1,833百万円でした。
ⅶ.税金等調整前当期純損益
これらの結果、当連結会計年度の税金等調整前当期純損益は33,186百万円の利益となりました。
ⅷ.法人税等
当連結会計年度の「法人税等合計」の金額は8,354百万円で、「税金等調整前当期純利益」に対する割合は
25.2%でした。
ⅸ.非支配株主に帰属する当期純損益
当連結会計年度の非支配株主に帰属する当期純損益は92百万円の利益でした。
ⅹ.親会社株主に帰属する当期純利益
これらの結果、当連結会計年度の親会社株主に帰属する当期純損益は24,739百万円(前年同期比3.5%減)の利
益となりました。
③
キャッシュ・フローの状況の分析・検討内容並びに資本の財源及び資金の流動性に係る情報
当連結会計年度のキャッシュ・フローの状況は「第2
キャッシュ・フローの状況の分析
事業の状況
(1) 経営成績等の状況の概要
②
4
経営者による財政状態、経営成績及び
キャッシュ・フローの状況」に記載のとお
りですが、営業活動によるキャッシュ・フローを入金超過に維持しつつ、その資金を投資及び財務活動キャッシ
ュ・フローの出金超過分に使用できているものと考えています。また、こうして蓄積された資金については、新製
品開発と生産能力拡充を継続的に推し進めていくための開発投資、設備投資等に有効に活用していきます。
なお、当社グループは、設備投資計画に基づく所要の長期的資金は自己資金の他、主として銀行借入により調達
することを方針としており、安定的な資金の財源の確保のためには金融機関との良好な関係を維持していくことも
重要なことと認識しています。
④
重要な会計上の見積り及び当該見積りに用いた仮定
当社グループの連結財務諸表は、我が国において一般に公正妥当と認められている会計基準に基づき作成されて
います。この連結財務諸表の作成にあたっては、連結会計年度末時点における資産及び負債並びに連結会計期間に
おける収益及び費用の報告額に影響を及ぼす見積り及び仮定を用いています。これらは過去の実績をもとに将来の
予測を加味した上で、継続的かつ合理的、保守的な評価に重点を置き見積られたものとなっています。
(固定資産の減損処理)
当社グループは、固定資産のうち減損の兆候がある資産又は資産グループについて、当該資産又は資産グループ
から得られる割引前将来キャッシュ・フローの総額が帳簿価額を下回る場合には、帳簿価額を回収可能価額まで減
額し、当該減少額を減損損失として計上しています。減損の兆候の把握、減損損失の認識及び測定に当たっては慎
重に検討していますが、事業計画や市場環境の変化により、その見積り額の前提とした条件や仮定に変更が生じ減
少した場合、減損処理が必要となる可能性があります。
― 36 ―
5 【重要な契約等】
<提出会社>
相互代理店契約
相手方の名称
CARL ZEISS社(ドイツ)
契約内容
汎用計測機器製品に関する相互代理
店契約
契約期間
2025年12月1日より最長5年間
<連結子会社>
特記すべき事項はありません。
6 【研究開発活動】
当社グループの研究開発活動については、半導体製造装置及び計測機器の各製品全般にわたって、新型機種の開
発、現有製品の競争力向上のための製品改良、コア技術の創出に向けた要素技術開発、並びに半導体製造装置及び計
測機器のシナジーの最大化に向けた開発等を行っています。
当連結会計年度におけるグループ全体での研究開発費の総額は12,037百万円であり、セグメントごとにその具体的
活動内容を示すと次のとおりです。
a
半導体製造装置
半導体製造装置の分野では半導体デバイスや電子部品の高精度化、高機能化並びに高信頼性を求めてユーザー各
社の設備は多様化しています。また、積層化・微細化の進展に伴う高精度加工や検査、高スループット化の要求も
高まっています。当社グループはこれら市場ニーズに応えるため、製品改良・性能向上・新型機種の開発に努めて
います。
当連結会計年度における主な研究開発のテーマは、プロービングマシン、ウェーハダイシングマシン、各種研削
装置等の性能向上やプロセス開発、並びに新型機種の開発でした。
なお、当連結会計年度における当セグメントの研究開発費の総額は9,254百万円でした。
b
計測機器
精密測定分野では、高精度の測定ニーズの高まりに加え、NEV、半導体、宇宙・防衛・航空機分野など、測定対
象物の多角化が進んでいます。さらに、高精度測定の自動化要請も高まっており、これら市場ニーズに応えるため
各種製品の開発、改良に努めています。
当連結会計年度における主な研究開発のテーマは、精密測定機器類の改良・性能向上、並びに充放電試験システ
ムの開発等でした。
なお、当連結会計年度における当セグメントの研究開発費の総額は2,782百万円でした。
― 37 ―
第3 【設備の状況】
1 【設備投資等の概要】
当社グループの設備投資に対する方針は、半導体製造装置及び計測機器の両セグメントにおいて、将来に向けての
事業拡大と競争の激化に対処するため、生産能力の拡充及び生産の合理化・省力化を図ることを目的としています。
当連結会計年度の設備投資の総額は11,069百万円であり、その概要をセグメントごとに示すと次のとおりです。
(1) 半導体製造装置
当事業分野の設備投資は、市況及び顧客ニーズへの迅速な対応並びに製造技術の強化を目的として実施するもの
です。
当連結会計年度における主な設備投資の内容は、当社の生産能力や開発促進に向けた八王子新工場用地取得の手
付金972百万円、韓国子会社におけるデモセンター建設1,115百万円等であり、その総額は7,224百万円でした。
(2) 計測機器
当事業分野の設備投資は、サービスビジネス拡大と効率的かつフレキシブルな生産ラインの構築を目的として実
施するものです。
当連結会計年度における主な設備投資の内容は、当社における電池評価受託サービス増強に係る工場改修等947
百万円等であり、その総額は3,844百万円でした。
― 38 ―
2 【主要な設備の状況】
(1) 提出会社
2026年3月31日現在
帳簿価額(百万円)
事業所名
(所在地)
セグメントの
名称
本社・八王子工場
(東京都八王子市)
半導体製造装置
土浦工場
(茨城県土浦市)
設備の内容
合計
従業
員数
(名)
1,221
17,513
818
―
4
3,808
277
2,025
(51)
―
99
12,660
186
532
75
(56)
―
439
1,946
25
―
87
-
(-)
7
―
636
122
―
0
259
(4)
―
―
1,306
―
建物及び
構築物
機械装置
及び
運搬具
工具器具
及び備品
生産設備他
8,105
1,639
3,096
計測機器
生産設備他
3,040
227
飯能工場
(埼玉県飯能市)
半導体製造装置
生産設備他
10,010
古殿工場
(福島県古殿町)
計測機器
生産設備他
各営業所・出張所
半導体製造装置
計測機器
その他
半導体製造装置
計測機器
土地
(面積
千㎡)
リース
資産
建設
仮勘定
3,436
(37)
16
386
151
(17)
288
238
883
17
建物他
542
社員寮他
1,047
(注) 現在休止中の設備はありません。
(2) 国内子会社
2026年3月31日現在
会社名
事業所名
(所在地)
セグメントの
名称
帳簿価額(百万円)
土地
設備の内容建物及び 機械装置工具器具
リース
及び
(面積
構築物
及び備品
資産
運搬具
千㎡)
建設
仮勘定
合計
従業
員数
(名)
㈱東精 エ ン 本社・工場
ジ ニ ア リ ン (茨城県
グ
土浦市他)
半導体製造装置
生産設備他
計測機器
7,106
287
243
3,932
(77)
―
1
11,571
365
本社
㈱トーセー
(東京都
システムズ
八王子市)
半導体製造装置什器備品類
計測機器
他
4
―
1
―
(―)
―
―
5
194
㈱ ア ク レ ー 本社
テ ク ・ ク リ (東京都
エイト
八王子市)
半導体製造装置什器備品類
計測機器
他
―
―
0
―
(―)
―
―
0
1
本社
㈱東精ボッ
(東京都
クス
立川市)
計測機器
79
―
3
125
(1)
―
87
295
43
建物他
(注) 現在休止中の設備はありません。
― 39 ―
(3) 在外子会社
2026年3月31日現在
帳簿価額(百万円)
会社名
事業所名
(所在地)
セグメントの
名称
設備の
内容
機械装置
建物及び
工具器具
及び
構築物
及び備品
運搬具
土地
(面積
千㎡)
リース
資産
建設
仮勘定
合計
従業
員数
(名)
ACCRETECH
AMERICA INC.
本社
(米国 テキサ
半導体製造装置
ス州リチャー
ドソン市)
本社機能
他
85
14
18
-
(-)
100
17
236
51
ACCRETECH
(EUROPE)
GmbH
本社
(ドイツ バイ 半導体製造装置
エルン州ミュ 計測機器
ンヘン市)
本社機能
他
18
14
44
-
(-)
-
-
77
89
ACCRETECH
KOREA
CO.,LTD.
本社
半導体製造装置
(韓国京畿道
計測機器
華城市)
土地他
-
3
23
1,734
(6)
-
1,115
2,877
80
東精精密設備
(上海)有限
公司
本社
半導体製造装置
(中国上海
計測機器
市)
什器備品
類他
-
7
115
-
(-)
-
-
123
193
ACCRETECH
TAIWAN
CO.,LTD.
本社
半導体製造装置
(台湾新竹県
計測機器
竹北市)
本社機能
他
1,645
-
342
1,158
(5)
43
-
3,190
139
ACCRETECH
(MALAYSIA)
SDN.BHD.
本社
(マレーシア
半導体製造装置
セランゴール
計測機器
州プタリンジ
ャヤ市)
本社機能
他
35
56
6
144
(0)
30
84
357
52
ACCRETECH
ADAMAS
(THAILAND)
CO.,LTD.
本社
(タイ パトゥ
ムターニー県半導体製造装置
クローンルア
ン)
生産設備
他
274
55
13
310
(18)
0
8
662
117
ACCRETECH
(THAILAND)
CO.,LTD.
本社
(タイ サムッ
半導体製造装置
トプラカーン
計測機器
県バーンプリ
ー)
什器備品
類他
0
3
3
-
(-)
33
-
41
40
東精計量儀
(平湖)有限
公司
本社
半導体製造装置
(中国浙江省
計測機器
平湖市)
生産設備
他
183
6
0
-
(-)
-
-
191
12
TOSEI
(THAILAND)
CO.,LTD.
本社
(タイ チョン
ブリー県ムア 計測機器
ンチョンブリ
ー)
生産設備
他
84
27
26
73
(4)
-
-
211
49
ACCRETECH
SBS,INC.
本社
(米国 オレゴ 半導体製造装置
ン州ポートラ 計測機器
ンド市)
生産設備
他
1,833
59
28
507
(5)
6
13
2,447
37
(注) 1.現在休止中の設備はありません。
2.上記金額には消費税等は含まれていません。
― 40 ―
3 【設備の新設、除却等の計画】
(1) 重要な設備の新設等
設備の内容
会社名
提出会社
事業所名
(所在地)
セグメント
の名称
着工年月
完成予定
年月
952
未定
未定
未定
―
2026年5月
2028年3月
未定
952
4,515
2,849
2026年3月
2027年5月
4,515
2,849
種類
細目
八王子新工場
( 東京都八王子半導体製造装置
市)
土地
及び建物
新工場建設
未定
飯能新工場
半導体製造装置
(埼玉県飯能市)
土地
及び建物
新工場建設
合計
ACCRETECH
KOREA
CO.,LTD.
投資予定額
総額
(百万円)
デモセンター
(韓国京畿道
半導体製造装置
華城市)
土地
及び建物
デモセンター建設
合計
うち
既支出額
(百万円)
(注) 1.上記計画の所要資金は自己資金及び借入金でまかなう予定です。
2.完成後の能力増加に関しては数量的に算定することが困難なため記載を省略しています。
3.上記金額には消費税等は含まれていません。
(2) 重要な設備の除却等
経常的な設備更新のための除却等を除き、重要な設備の除却等の計画はありません。
― 41 ―
第4 【提出会社の状況】
1 【株式等の状況】
(1) 【株式の総数等】
① 【株式の総数】
種類
発行可能株式総数(株)
普通株式
110,501,100
計
110,501,100
② 【発行済株式】
事業年度末現在
発行数(株)
(2026年3月31日)
提出日現在
発行数(株)
(2026年6月19日)
普通株式
42,282,881
計
42,282,881
種類
(注)
上場金融商品取引所名
又は登録認可金融商品
取引業協会名
内容
42,284,981
東京証券取引所
プライム市場
単元株式数は100株
です。
42,284,981
―
―
1.提出日現在の発行数には、2026年6月1日からこの有価証券報告書提出日までの新株予約権の行使(旧商法
に基づき発行された新株予約権の権利行使を含む。)により発行された株式数は含まれていません。
2.2026年4月1日から2026年5月31日までの間に、新株予約権(ストック・オプション)の行使により2,100
株発行しています。
― 42 ―
(2) 【新株予約権等の状況】
① 【ストックオプション制度の内容】
第16回新株予約権
第17回新株予約権
決議年月日
2019年6月24日(定時株主総会)
2020年6月22日(定時株主総会)
付与対象者の区分及び人数(名)
当社取締役
当社使用人
子会社取締役
子会社使用人
当社取締役
当社使用人
子会社取締役
子会社使用人
新株予約権の数(個)※
新株予約権の目的となる株式の
種類、内容及び数(株)※
新株予約権の行使時の払込金額(円)
※
7
195
8
26
64 [54]
(注)1.
普通株式
124 [113]
(注)1.
普通株式
6,400 5,4001.
1株当たり
7
195
8
36
3,075
(注)2.
12,400 11,3001.
1株当たり
3,655
(注)2.
新株予約権の行使期間※
2021年8月3日~
2026年6月30日
新株予約権の行使により株式を発行
する場合の株式の発行価格及び資本
組入額(円)※
発行価格
資本組入額
新株予約権の行使の条件※
新株予約権者が新株予約権を放棄した場合には、新株予約権を行使できな
いものとします。
新株予約権の譲渡に関する事項※
新株予約権を譲渡するときは、当社取締役会の承認を要するものとしま
す。
組織再編成行為に伴う新株予約権の
交付に関する事項※
新株予約権の取得条項に関する事項
※
2023年7月31日~
2028年6月30日
3,075
(注)3.
(注)4.
(注)5.
― 43 ―
発行価格
資本組入額
3,655
(注)3.
2006年7月発行新株予約権
(株式報酬型)
決議年月日
2006年6月29日(定時株主総会)
付与対象者の区分及び人数(名)
当社取締役
当社使用人(役付執行役員)
6
12
22 [22]
(注)1.
新株予約権の数(個)※
新株予約権の目的となる株式の
種類、内容及び数(株)※
普通株式
新株予約権の行使時の払込金額※
1株当たり
新株予約権の行使期間※
2006年7月15日~
2026年7月14日
新株予約権の行使により株式を発行
する場合の株式の発行価格及び資本
組入額※
発行価格
資本組入額
新株予約権の行使の条件※
(注)8.
新株予約権の譲渡に関する事項※
新株予約権を譲渡するときは、当社
取締役会の承認を要するものとしま
す。
組織再編成行為に伴う新株予約権の
交付に関する事項※
新株予約権の取得条項に関する事項
※
2,200 2,2001.
1円
1円
(注)3.
(注)4.
(注)5.
2007年7月発行新株予約権
(株式報酬型)
2011年7月発行新株予約権
(株式報酬型)
決議年月日
2007年6月28日(取締役会)
付与対象者の区分及び人数(名)
当社取締役
当社使用人(役付執行役員)
6
12
24 [24]
(注)1.
新株予約権の数(個)※
2011年6月27日(取締役会)
当社取締役
当社使用人(役付執行役員)
6
2
80 [80]
(注)1.
新株予約権の目的となる株式の
種類、内容及び数(株)※
普通株式
新株予約権の行使時の払込金額※
1株当たり
新株予約権の行使期間※
2007年7月20日~
2027年7月19日
新株予約権の行使により株式を発行
する場合の株式の発行価格及び資本
組入額※
発行価格
資本組入額
新株予約権の行使の条件※
(注)8.
新株予約権の譲渡に関する事項※
新株予約権を譲渡するときは、当社取締役会の承認を要するものとしま
す。
組織再編成行為に伴う新株予約権の
交付に関する事項※
新株予約権の取得条項に関する事項
※
普通株式
2,400 2,4001.
1円
8,000 8,0001.
1株当たり
1円
2011年7月13日~
2031年7月12日
1円
(注)3.
(注)4.
(注)5.
― 44 ―
発行価格
資本組入額
1円
(注)3.
2012年7月発行新株予約権
(株式報酬型)
2013年7月発行新株予約権
(株式報酬型)
決議年月日
2012年7月6日(取締役会)
付与対象者の区分及び人数(名)
当社取締役
当社使用人(役付執行役員)
7
2
当社取締役
当社使用人(役付執行役員)
7
2
80 [80]
(注)1.
94 [94]
(注)1.
新株予約権の数(個)※
2013年7月5日(取締役会)
新株予約権の目的となる株式の
種類、内容及び数(株)※
普通株式
新株予約権の行使時の払込金額※
1株当たり
新株予約権の行使期間※
2012年7月24日~
2032年7月23日
新株予約権の行使により株式を発行
する場合の株式の発行価格及び資本
組入額※
発行価格
資本組入額
新株予約権の行使の条件※
(注)8.
新株予約権の譲渡に関する事項※
新株予約権を譲渡するときは、当社取締役会の承認を要するものとしま
す。
組織再編成行為に伴う新株予約権の
交付に関する事項※
新株予約権の取得条項に関する事項
※
普通株式
8,000 8,0001.
1円
9,400 9,4001.
1株当たり
1円
2013年7月23日~
2033年7月22日
1円
(注)3.
発行価格
資本組入額
1円
(注)3.
(注)4.
(注)5.
2014年7月発行新株予約権
(株式報酬型)
2015年7月発行新株予約権
(株式報酬型)
決議年月日
2014年7月4日(取締役会)
付与対象者の区分及び人数(名)
当社取締役
当社使用人(役付執行役員)
8
2
当社取締役
当社使用人(役付執行役員)
8
1
119 [119]
(注)1.
164 [164]
(注)1.
新株予約権の数(個)※
2015年7月7日(取締役会)
新株予約権の目的となる株式の
種類、内容及び数(株)※
普通株式
新株予約権の行使時の払込金額※
1株当たり
新株予約権の行使期間※
2014年7月23日~
2034年7月22日
新株予約権の行使により株式を発行
する場合の株式の発行価格及び資本
組入額※
発行価格
資本組入額
新株予約権の行使の条件※
(注)8.
新株予約権の譲渡に関する事項※
新株予約権を譲渡するときは、当社取締役会の承認を要するものとしま
す。
組織再編成行為に伴う新株予約権の
交付に関する事項※
新株予約権の取得条項に関する事項
※
普通株式
11,900 11,9001.
1円
16,400 16,4001.
1株当たり
1円
2015年7月23日~
2035年7月22日
1円
(注)3.
(注)4.
(注)5.
― 45 ―
発行価格
資本組入額
1円
(注)3.
2016年7月発行新株予約権
(株式報酬型)
2017年7月発行新株予約権
(株式報酬型)
決議年月日
2016年7月6日(取締役会)
付与対象者の区分及び人数(名)
当社取締役
当社使用人(役付執行役員)
8
1
当社取締役
当社使用人(役付執行役員)
7
3
164 [164]
(注)1.
177 [177]
(注)1.
新株予約権の数(個)※
2017年7月7日(取締役会)
新株予約権の目的となる株式の
種類、内容及び数(株)※
普通株式
新株予約権の行使時の払込金額※
1株当たり
新株予約権の行使期間※
2016年7月22日~
2036年7月21日
新株予約権の行使により株式を発行
する場合の株式の発行価格及び資本
組入額(円)※
発行価格
資本組入額
新株予約権の行使の条件※
(注)8.
新株予約権の譲渡に関する事項※
新株予約権を譲渡するときは、当社取締役会の承認を要するものとしま
す。
組織再編成行為に伴う新株予約権の
交付に関する事項※
新株予約権の取得条項に関する事項
※
普通株式
16,400 16,4001.
1円
17,700 17,7001.
1株当たり
1円
2017年7月25日~
2037年7月24日
1円
(注)3.
発行価格
資本組入額
1円
(注)3.
(注)4.
(注)5.
2018年7月発行新株予約権
(株式報酬型)
2019年8月発行新株予約権
(株式報酬型)
決議年月日
2018年7月6日(取締役会)
付与対象者の区分及び人数(名)
当社取締役
当社使用人(役付執行役員)
7
3
当社取締役
当社使用人(役付執行役員)
6
5
177 [177]
(注)1.
210 [210]
(注)1.
新株予約権の数(個)※
2019年7月18日(取締役会)
新株予約権の目的となる株式の
種類、内容及び数(株)※
普通株式
新株予約権の行使時の払込金額※
1株当たり
新株予約権の行使期間※
2018年7月24日~
2038年7月23日
新株予約権の行使により株式を発行
する場合の株式の発行価格及び資本
組入額(円)※
発行価格
資本組入額
新株予約権の行使の条件※
(注)8.
新株予約権の譲渡に関する事項※
新株予約権を譲渡するときは、当社取締役会の承認を要するものとしま
す。
組織再編成行為に伴う新株予約権の
交付に関する事項※
新株予約権の取得条項に関する事項
※
普通株式
17,700 17,7001.
1円
21,000 21,0001.
1株当たり
1円
2019年8月3日~
2039年8月2日
1円
(注)3.
(注)4.
(注)5.
― 46 ―
発行価格
資本組入額
1円
(注)3.
2020年7月発行新株予約権
(株式報酬型)
2021年7月発行新株予約権
(株式報酬型)
決議年月日
2020年7月15日(取締役会)
付与対象者の区分及び人数(名)
当社取締役
当社使用人(役付執行役員)
6
5
当社取締役
当社使用人(役付執行役員)
6
5
210 [210]
(注)1.
214 [214]
(注)1.
新株予約権の数(個)※
2021年7月7日(取締役会)
新株予約権の目的となる株式の
種類、内容及び数(株)※
普通株式
新株予約権の行使時の払込金額※
1株当たり
新株予約権の行使期間※
2020年7月31日~
2040年7月30日
新株予約権の行使により株式を発行
する場合の株式の発行価格及び資本
組入額(円)※
発行価格
資本組入額
新株予約権の行使の条件※
(注)8.
新株予約権の譲渡に関する事項※
新株予約権を譲渡するときは、当社取締役会の承認を要するものとしま
す。
組織再編成行為に伴う新株予約権の
交付に関する事項※
新株予約権の取得条項に関する事項
※
普通株式
21,000 21,0001.
1円
21,400 21,4001.
1株当たり
1円
2021年7月27日~
2051年7月26日
1円
(注)3
発行価格
資本組入額
1円
(注)3.
(注)4.
(注)5.
2022年7月発行新株予約権
(株式報酬型)
2023年7月発行新株予約権
(株式報酬型)
決議年月日
2022年7月22日(取締役会)
付与対象者の区分及び人数(名)
当社取締役
当社使用人(役付執行役員)
6
5
当社取締役
当社使用人(役付執行役員)
5
8
225 [225]
(注)1.
345 [345]
(注)1.
新株予約権の数(個)※
2023年7月24日(取締役会)
新株予約権の目的となる株式の
種類、内容及び数(株)※
普通株式
普通株式
新株予約権の行使時の払込金額※
1株当たり
新株予約権の行使期間※
2022年7月23日~
2052年7月22日
新株予約権の行使により株式を発行
する場合の株式の発行価格及び資本
組入額(円)※
発行価格
資本組入額
新株予約権の行使の条件※
(注)8.
新株予約権の譲渡に関する事項※
新株予約権を譲渡するときは、当社取締役会の承認を要するものとしま
す。
22,500 22,5001.
1円
34,500 34,5001.
1株当たり
1円
2023年7月25日~
2053年7月24日
1円
(注)3.
発行価格
資本組入額
1円
(注)3.
組織再編成行為に伴う新株予約権の
(注)4.
交付に関する事項※
新株予約権の取得条項に関する事項
(注)5.
※
※ 当事業年度の末日(2026年3月31日)における内容を記載しています。当事業年度の末日から提出日の前月末現在
(2026年5月31日)にかけて変更された事項については、提出日の前月末現在における内容を[ ]内に記載してお
り、その他の事項については当事業年度末日における内容から変更はありません。
― 47 ―
(注) 1.各新株予約権の目的たる株式の数(以下、付与株式数という。)は100株とします。ただし、付与株式数は以
下の定めにより調整を受けることがあります。
(付与株式数の調整)
当社が当社普通株式の分割又は併合を行う場合には、付与株式数を次の算式により調整し、調整の結果生
じる1株未満の端数は、これを切り捨てるものとします。
調整後付与株式数 = 調整前付与株式数 × 分割・併合の比率
また、その他付与株式数の調整をすることが適切な場合は、当該諸条件等を勘案の上、合理的な範囲で付
与株式数を調整できます。
2.各新株予約権の行使に際して出資される財産の価額は、各新株予約権を行使することにより交付を受けるこ
とができる株式1株当たりの払込金額(以下、「行使価額」という。)に付与株式数を乗じた金額とします。
ただし、以下の事由が生じた場合は、行使価額は次の算式により調整されるものとし、調整により生じる1
円未満の端数はこれを切り上げるものとします。
① 当社普通株式につき株式分割又は併合が行われる場合。
1
調整後行使価額 = 調整前行使価額 ×
分割・併合の比率
② 時価を下回る価額で当社普通株式につき、新株式を発行又は自己株式を処分する場合(新株予約権の行
使を除く。)。
新規発行(処分)株式数×1株当たり発行(処分)金額
既発行
+
株式数
時価
調整後
調整前
=
×
行使価額
行使価額
既発行株式数+新規発行(処分)株式数
③
その他、行使価額の調整を必要とするやむを得ない事由が生じた場合は、当該諸条件等を勘案の上、合
理的な範囲で行使価額を調整することができるものとします。
3.新株予約権の行使により株式を発行する場合における増加する資本金の額は、会社計算規則第17条第1項に
従い算出される資本金等増加限度額の2分の1の金額とし、計算の結果生じる1円未満の端数は、これを切
り上げるものとします。
4.当社が合併(当社が合併により消滅する場合に限る。)、吸収分割若しくは新設分割(それぞれ当社が分割会
社となる場合に限る。)、又は株式交換若しくは株式移転(それぞれ当社が完全子会社となる場合に限
る。)(以上を総称して以下、「組織再編行為」という。)をする場合において、組織再編行為の効力発生の
時点において残存する新株予約権(以下、「残存新株予約権」という。)を保有する新株予約権者に対し、そ
れぞれの場合につき、会社法第236条第1項第8号のイからホまでに掲げる株式会社(以下、「再編対象会
社」という。)の新株予約権を以下の条件に基づきそれぞれ交付するものとします。ただし、以下の条件に
沿って再編対象会社の新株予約権を交付する旨を、吸収合併契約、新設合併契約、吸収分割契約、新設分割
計画、株式交換契約又は株式移転計画において定めた場合に限るものとします。
① 交付する再編対象会社の新株予約権の数
残存新株予約権の新株予約権者が保有する残存新株予約権の数と同一の数をそれぞれ交付するものと
します。
② 新株予約権の目的である再編対象会社の株式の種類
再編対象会社の普通株式とします。
③ 新株予約権の目的である再編対象会社の株式の数
組織再編行為の条件等を勘案の上、上記「新株予約権の目的となる株式の数」に準じて決定します。
④ 新株予約権の行使に際して出資される財産の価額
交付される各新株予約権の行使に際して出資される財産の価額は、行使価額を組織再編の条件等を勘
案のうえ調整して得られる再編後払込金額に上記③に従って決定される当該新株予約権の目的である
再編対象会社の株式の数を乗じて得られる金額とします。
なお、株式報酬型として付与された新株予約権の再編後払込金額については、再編対象会社の株式1
株当たり1円とします。
⑤ 新株予約権を行使することができる期間
上記「新株予約権の行使期間」に定める開始日と組織再編行為の効力発生日のうちいずれか遅い日か
ら、上記「新株予約権の行使期間」に定める満了日までとします。
⑥ 譲渡による新株予約権の取得の制限
譲渡による新株予約権の取得については、再編対象会社の取締役会の決議による承認を要するものと
します。
⑦ 新株予約権の取得条項
上記「新株予約権の取得条項に関する事項」の内容に準じて決定します。
⑧ その他の新株予約権の行使の条件
上記「新株予約権の行使の条件」に準じて決定します。
― 48 ―
5.以下の①~⑤の議案につき当社株主総会で承認された場合(株主総会決議が不要の場合は、当社取締役会決
議又は代表執行役の決定がなされた場合)は、取締役会が別途定める日に、当社は無償で新株予約権を取得
することができます。
① 当社が消滅会社となる合併契約承認の議案
② 当社が分割会社となる分割契約若しくは分割計画承認の議案
③ 当社が完全子会社となる株式交換契約若しくは株式移転計画承認の議案
④ 当社の発行する全部の株式の内容として譲渡による当該株式の取得について当社の承認を要することに
ついての定めを設ける定款の変更承認の議案
⑤ 新株予約権の目的である株式の内容として譲渡による当該株式の取得について当社の承認を要すること
若しくは当該種類の株式について当社が株主総会の決議によってその全部を取得することについての定
めを設ける定款の変更承認の議案
6.付与対象者の区分ごとの具体的人数については、今後開催される当社取締役会において決定される予定で
す。
7.行使価額は、新株予約権の割当日の属する月の前月の各日の東京証券取引所における当社普通株式の終値の
平均値に1.025を乗じた金額又は割当日の前日の終値のいずれか高い金額とします。
8.① 新株予約権者は、当社の取締役(指名委員会等設置会社における執行役を含む。)及び役付執行役員のい
ずれの地位をも喪失した時に限り、新株予約権を行使できるものとします。ただしこの場合、新株予約
権者は地位を喪失した日の翌日(以下「権利行使開始日という。」)から当該権利行使開始日より7日を
経過する日(当該日が営業日でない場合には前営業日)までの間に限り、新株予約権を行使することがで
きます。
② 新株予約権者が死亡した場合、相続人が新株予約権を行使することができます。ただしこの場合、相続
人は、新株予約権者が死亡した日の翌日から6ヶ月を経過する日(当該日が営業日でない場合には前営
業日)までの間に限り、新株予約権を行使することができます。
② 【ライツプランの内容】
該当事項はありません。
③ 【その他の新株予約権等の状況】
該当事項はありません。
― 49 ―
(3) 【行使価額修正条項付新株予約権付社債券等の行使状況等】
該当事項はありません。
(4) 【発行済株式総数、資本金等の推移】
発行済株式
総数増減数
(株)
発行済株式
総数残高
(株)
資本金増減額
(百万円)
資本金残高
(百万円)
資本準備金
増減額
(百万円)
資本準備金
残高
(百万円)
2021年4月1日~
2022年3月31日
(注)1.
109,600
41,869,581
182
11,000
182
18,373
2022年4月1日~
2023年3月31日
(注)1.
33,700
41,903,281
63
11,064
63
18,436
2023年4月1日~
2024年3月31日
(注)1.
201,100
42,104,381
386
11,450
386
18,822
2024年4月1日~
2025年3月31日
(注)1.
65,700
42,170,081
122
11,573
122
18,945
年月日
2025年4月1日~
2026年3月31日
112,800
42,282,881
175
11,748
175
19,120
(注)1.
(注) 1.発行済株式総数、資本金及び資本準備金の増減の要因別内訳
発行済株式総数資本金増減額
資本準備金
年月日
増減理由
増減数(株)
(百万円)
増減額(百万円)
2021年4月1日~
2022年3月31日
ストック・オプションの新株
予約権の権利行使による増加
109,600
182
182
2022年4月1日~
2023年3月31日
ストック・オプションの新株
予約権の権利行使による増加
33,700
63
63
2023年4月1日~
2024年3月31日
ストック・オプションの新株
予約権の権利行使による増加
201,100
386
386
2024年4月1日~
2025年3月31日
ストック・オプションの新株
予約権の権利行使による増加
65,700
122
122
2025年4月1日~
2026年3月31日
ストック・オプションの新株
予約権の権利行使による増加
112,800
175
175
2.2026年4月1日から2026年5月31日までの間に、ストック・オプションの新株予約権の権利行使により、発
行済株式総数が2,100株、資本金及び資本準備金がそれぞれ4百万円増加しています。
(5) 【所有者別状況】
2026年3月31日現在
株式の状況(1単元の株式数100株)
区分
政府及び
地方公共
団体
金融機関
金融商品
取引業者
その他の
法人
外国法人等
個人以外
個人
個人
その他
計
単元未満
株式の状況
(株)
株主数
-
54
35
201
364
41
12,581
13,276
-
(人)
所有株式数
-
148,321
16,389
22,411
155,764
233
78,940
422,058
77,081
(単元)
所有株式数
-
35.14
3.88
5.31
36.91
0.06
18.70
100.00
-
の割合(%)
(注) 1.株主総会における議決権行使の基準日現在の状況について記載しています。
2.自己株式1,505,586株は、「個人その他」に15,055単元及び「単元未満株式の状況」に86株含めて記載して
います。なお、2026年3月31日現在の実保有残高は1,505,586株です。
3.「株式給付信託(BBT)」の信託財産として信託が保有する当社株式189,700株は、上記自己保有株式には含ま
れていません。
― 50 ―
(6) 【大株主の状況】
氏名又は名称
2026年3月31日現在
発行済株式(自己株式を
所有株式数
除く。)の総数に対する
(千株)
所有株式数の割合(%)
住所
日本マスタートラスト信託銀行㈱
東京都港区赤坂1-8-1
(信託口)
6,797
16.67
㈱日本カストディ銀行(信託口)
東京都中央区晴海1-8-12
4,382
10.75
JP MORGAN CHASE BANK 385642
(常任代理人㈱みずほ銀行決済営
業部)
THE CHASE MANHATTAN BANK N.A
(常任代理人㈱みずほ銀行決済営
業部)
公益財団法人精密測定技術振興財
団
25 BANK STREET, CANARY WHARF,
LONDON E14 5JP, UNITED KINGDOM
(東京都港区港南2-15-1)
WOOLGATE HOUSE COLEMAN STREET LONDON
EC2P 2HD. ENGLAND
(東京都港区港南2-15-1)
1,540
3.78
1,179
2.89
1,058
2.60
㈱みずほ銀行
東京都千代田区大手町1-5-5
672
1.65
ONE CONGRESS STREET, SUITE 1,
BOSTON MASSACHUSETTS
(東京都港区港南2-15-1)
657
1.61
569
1.40
560
1.37
559
1.37
17,978
44.09
STATE STREET BANK AND TRUST
COMPANY 505001
(常任代理人㈱みずほ銀行決済営
業部)
BNYM AS AGT/CLTS 10 PERCENT
(常任代理人㈱三菱UFJ銀行決済
事業部)
JP MORGAN CHASE BANK 385781
(常任代理人㈱みずほ銀行決済営
業部)
矢野
信太郎
東京都武蔵野市境南町3-1-6-203
240 GREENWICH STREET, NEW YORK, NEW
YORK 10286 U.S.A.
(東京都千代田区丸の内1-4-5)
25 BANK STREET CANARY WHARF
LONDON E14 5JP, UK
(東京都港区港南2-15-1)
東京都千代田区
計
-
(注) 1.株主総会における議決権行使の基準日現在の状況について記載しています。
2.なお、下記の法人より下記日付(報告書提出日)で公衆の縦覧に供されている大量保有報告書(変更報告書)に
おいて、以下の時点(報告義務発生日)で次のとおり当社株式を保有している旨記載されていますが、当社と
して2026年3月31日現在における実質所有の状況が確認できないため、上記「大株主の状況」には含めてい
ません。
氏名又は名称
住所
保有株券等の 株券等保有
報告書提出日
数(千株)
割合(%) (報告義務発生日)
三井住友トラスト・アセットマ 東京都港区芝公園1-1
ネジメント㈱ ※1
-1
2,205
5.22
2025年9月19日
(2025年9月15日)
ティー・ロウ・プライス・ジャ 東京都千代田区丸の内1
パン株式会社 ※2
-9-2
2,761
6.53
2026年1月9日
(2025年12月31日)
東京都千代田区大手町1
-5-5
4,879
11.54
2026年2月5日
(2026年1月29日)
東京都中央区日本橋1-
13-1
4,367
10.33
2026年3月30日
(2026年3月23日)
㈱みずほ銀行
野村證券㈱
※3
※4
※1 三井住友トラスト・アセットマネジメント㈱(保有株式1,445千株)、アモーヴァ・アセットマネジメ
ント㈱(同759千株)の共同保有に係る報告です。
※2 ティー・ロウ・プライス・ジャパン㈱(保有株式628千株)、ティー・ロウ・プライス・インターナシ
ョナル・リミテッド(同1,887千株)、ティー・ロウ・プライス・アソシエイツ,インク(同245千株)の共
同保有に係る報告です。
※3 ㈱みずほ銀行(保有株式672千株)、みずほ証券(株)(同82千株)、みずほ信託銀行㈱(同289千株)、アセ
ットマネジメントOne㈱(同3,673千株)、Asset Management One International Ltd.(同161千株)の共
同保有に係る報告です。
※4 野村證券㈱(保有株式537千株)、NOMURA INTERNATIONAL PLC(保有株式119千株)、野村アセットマネジ
メント㈱(同3,710千株)の共同保有に係る報告です。
― 51 ―
(7) 【議決権の状況】
① 【発行済株式】
2026年3月31日現在
区分
株式数(株)
議決権の数(個)
内容
無議決権株式
―
―
―
議決権制限株式(自己株式等)
―
―
―
議決権制限株式(その他)
―
―
―
(自己保有株式)
普通株式 1,505,500
普通株式
40,700,300
普通株式
77,081
―
―
407,003
―
―
―
発行済株式総数
42,282,881
―
―
総株主の議決権
―
407,003
―
完全議決権株式(自己株式等)
完全議決権株式(その他)
単元未満株式
(注) 1.株主総会における議決権行使の基準日現在の状況について記載しています。
2.「単元未満株式」欄の普通株式には、当社所有の自己株式86株が含まれています。
3.「完全議決権株式(その他)」欄の普通株式には、「株式給付信託(BBT)」の信託財産として信託が保有する
当社株式189,700株(議決権1,897個)が含まれています。なお、当該議決権の数189,700個は、議決権不行使と
なっています。
② 【自己株式等】
所有者の氏名
又は名称
(自己保有株式)
株式会社東京精密
所有者の住所
東京都八王子市石川町
2968番地2
計
―
2026年3月31日現在
所有株式数発行済株式総数に対
の合計
する所有株式数の割
(株)
合(%)
自己名義
所有株式数
(株)
他人名義
所有株式数
(株)
1,505,500
―
1,505,500
3.56
1,505,500
―
1,505,500
3.56
(注)1.株主総会における議決権行使の基準日現在の状況について記載しています。
2.「株式給付信託(BBT)」の信託財産として信託が保有する当社株式189,700株は、上記自己保有株式には含ま
れていません。
(8) 【役員・従業員株式所有制度の内容】
当社は、2024年6月21日開催の第101期定時株主総会決議に基づき、当社の取締役(監査等委員である取締役及び社
外取締役を除く)及び執行役員並びに当社の指定する子会社及び関連会社の一部の取締役(社外取締役を除く)及び執
行役員を対象に、取締役等の報酬と当社の業績及び株式価値との連動性をより明確にし、株価上昇によるメリットの
みならず、株価下落リスクまでも株主の皆様と共有することで、中長期的な業績の向上と企業価値の増大に貢献する
意識を高めることを目的として、業績連動型株式報酬制度「株式給付信託(BBT(Board Benefit Trust))」を導入し
ています。
(1) 取引の概要
本制度は、当社が拠出する金銭を原資として当社株式が信託(以下、本制度に基づき設定される信託を「本信
託」といいます。)を通じて取得され、対象役員に対して、当社が定める役員株式給付規程に従って、当社株式
及び当社株式を時価で換算した金額相当の金銭(以下「当社株式等」といいます。)が本信託を通じて給付され
る業績連動型株式報酬制度です。
なお、本制度においては、「第1給付」及び「第2給付」の2種類の給付を行うこととし、対象役員が当社株
式等の給付を受ける時期は、第1給付については原則として対象役員の退任時となり、第2給付については原則
として毎年一定の時期となります。
― 52 ―
(2) 信託に残存する自社の株式
信託に残存する当社株式を、当該信託における帳簿価額(付随費用の金額を除く。)により、純資産の部に自己
株式として計上しています。当期の連結決算日における当該自己株式の帳簿価額及び株式数は、それぞれ1,310
百万円、189,700株です。
― 53 ―
2 【自己株式の取得等の状況】
【株式の種類等】
会社法第155条第7号による普通株式の取得
(1) 【株主総会決議による取得の状況】
該当事項はありません。
(2) 【取締役会決議による取得の状況】
該当事項はありません。
(3) 【株主総会決議又は取締役会決議に基づかないものの内容】
区分
株式数(株)
価額の総額(百万円)
当事業年度における取得自己株式
474
6
当期間における取得自己株式
160
2
(注)
当期間における取得自己株式には、2026年6月1日からこの有価証券報告書提出日までの単元未満株式の買取
による株式数は含まれていません。
(4) 【取得自己株式の処理状況及び保有状況】
当事業年度
区分
当期間
処分価額の総額
(百万円)
株式数(株)
処分価額の総額
(百万円)
株式数(株)
引き受ける者の募集を行った
取得自己株式
―
―
―
―
消却の処分を行った取得自己株式
―
―
―
―
合併、株式交換、株式交付、
会社分割に係る移転を行った
取得自己株式
―
―
―
―
189,700
1,310
―
―
1,505,586
―
1,505,746
―
その他(株式給付信託に対する自己
株式の処分)
保有自己株式数
(注)1.当期間における保有自己株式数には、2026年6月1日からこの有価証券報告書提出日までの単元未満株式の
買取及び売渡に係る株式数は含まれていません。
2.「株式給付信託(BBT)」の信託財産として信託が保有する当社株式189,700株は、上記自己保有株式には含ま
れていません。
― 54 ―
3 【配当政策】
当社は、半導体製造装置と計測機器において最先端技術を駆使した世界No.1商品を提供することにより、企業価
値を高め、株主の皆様への継続的な利益還元を行うことを経営の最重要課題と考えております。
剰余金の配当につきましては、中間配当及び期末配当の年2回を基本的な方針とし、連結業績、財政状況、事業拡
大のための投資及び株主の皆様の長期的視点等を考慮して決定しています。
当期末の1株当たり配当は当期に計上した半導体製造装置部門の一部製品に関する不具合対策費用(特別損失)を控
除したものと仮定した利益、ならびに株主還元方針「連結配当性向40%程度」を踏まえ、151円とさせて頂くことを
予定しており、2025年12月8日実施済の中間配当金111円と合わせ、年間配当金262円とさせていただきました。な
お、次期以降の配当に関しては、業績に連動した利益配分を実施することを基本に、連結配当性向40%を目安に実施
していく考えであり、また安定的・継続的な配当という観点から連結利益水準にかかわらず年20円の配当は維持して
いく考えです。(但し、2期連続して赤字になるような場合には見直しの可能性があります。)
内部留保資金の使途については、景気変動の影響を大きく受ける製品群を有することから財務体質の健全性の維
持・強化には十分配慮しつつ、先進技術に関する研究開発や生産設備投資、情報システム投資、海外事業展開、新事
業分野開拓、M&A投資等に有効に活用していきたいと考えています。
なお、当社は「取締役会の決議によって、毎年9月30日の最終の株主名簿に記載又は記録された株主又は登録株式
質権者に対し、中間配当を行うことができる」旨、定款に定めており、中間配当については取締役会、期末配当につ
いては株主総会が配当の決定機関となっています。
なお、期末配当金151円について、2026年6月22日開催予定の定時株主総会で決議して実施する予定です。
(注)
基準日が当事業年度に属する剰余金の配当は以下のとおりです。
決議年月日
配当金の総額
(百万円)
2025年11月4日
取締役会
2026年6月22日
定時株主総会決議(予定)
― 55 ―
1株当たり配当額
(円)
4,525
111.00
6,157
151.00
4 【コーポレート・ガバナンスの状況等】
(1) 【コーポレート・ガバナンスの概要】
①
コーポレート・ガバナンスに関する基本的な考え方
当社のパーパス(存在意義)は「計測で未来を測り、半導体で未来を創る」です。このパーパスに基づき、「東
京精密グループは“夢のある未来”を築く一員であり続けます。」というビジョン(将来像)を掲げ、「世界中の
優れた技術・知恵・情報を融合して世界No.1の商品を創り出し、皆様と共に大きく成長していく」、「WIN-WIN
の仕事で世界No.1の商品を創ろう」をミッション(使命)としています。
このパーパス・ビジョン・ミッションを一語で表すコーポレートブランド「ACCRETECH(アクレーテク)」、
当社グループのバリュー(価値観)「お客さま、株主の皆さま、サプライヤーさま、従業員、地域社会、国際社会
など全てのステークホルダーとの間でWIN-WINの関係を創りあげ、持続可能な社会の実現に向け積極的に役割を
果たすとともに、企業価値の向上に努めます。」を通じ、「夢のある未来」の実現を目指します。その実現のた
めには、国際社会から信頼される企業市民として、公正で透明性の高い経営活動を展開していくためのコーポレ
ート・ガバナンスの充実が不可欠と認識し、以下5点の基本方針を掲げ取り組みます。
<基本方針>
②
ⅰ
透明・公正かつ迅速・果断な意思決定を行うため、取締役会の役割・責務の適切な遂行に努める。
ⅱ
株主の権利を尊重し、株主の平等性の確保に努める。
ⅲ
中長期的な株主利益を尊重する投資方針の株主との建設的な対話に努める。
ⅳ
株主以外のステークホルダーとの適切な協働に努める。
ⅴ
適切な情報開示と透明性の確保に努める。
企業統治の体制の概要及び当該体制を採用する理由
Ⅰ.企業統治の体制の概要
当社は、取締役会等の議論、議決に社外の視点からの助言・意見を取り入れた透明性の高い経営体制を採用
し、取締役会からの制度的な独立性を維持しつつ会計監査人及び監査室と連携を図ることにより、取締役の職
務執行に対する経営監督が十分に機能し、監査の実効性が確保されるものと考えることから監査等委員会設置
会社という形態を選択しています。
取締役会は6名の監査等委員でない取締役(うち2名は社外取締役)と4名の監査等委員である取締役(うち
3名は社外取締役)で構成され、毎月1回の定例取締役会の他、必要に応じて臨時取締役会も開催します。取
締役会では、法令、定款、取締役会規程等に定められた経営に関する重要事項や月次、期次、年次等の業務実
績等について審議を行うと共に、取締役相互の業務執行状況を監督します。
本書提出日現在、取締役会の議長は、代表取締役会長吉田均が務めており、その他の構成員は、代表取締
役社長木村龍一、取締役伯耆田貴浩、取締役 ロミプラダン、社外取締役高増潔、社外取締役森重哉、取
締役(監査等委員)秋本伸治、社外取締役(監査等委員)相良由里子、社外取締役(監査等委員)川﨑素子、
社外取締役(監査等委員)髙山清子です。
なお、当社は2026年6月22日開催予定の定時株主総会の議案として、「取締役(監査等委員である取締役を
除く。)6名選任の件」を提案しており、当該議案が原案通り承認可決されますと、取締役6名(うち社外取
締役2名)となる予定です。
監査等委員会は、内部監査部門である監査室や会計監査人等と連携し、取締役会の意思決定過程、取締役の
業務執行状況等について監査します。
本書提出日現在、監査等委員会委員長は、取締役(監査等委員)秋本伸治が務めており、その他の構成員
は、社外取締役(監査等委員)相良由里子、社外取締役(監査等委員)川﨑素子、社外取締役(監査等委員)
髙山清子です。
なお、当社は2026年6月22日開催予定の定時株主総会の議案として、「監査等委員である取締役1名選任の
件」を提案しており、当該議案が原案通り承認可決されますと、監査等委員である取締役4名(うち社外取締
役3名)となる予定です。
また、当社では以下の委員会や制度を設け、コーポレート・ガバナンスの体制を十全なものとすべく努めて
います。その名称及び各構成員の数、各機関の長の役職氏名、機能・目的等は以下のとおりです。
― 56 ―
機関の長
機関名(又は制度名)
構成人員数
目的・機能
役職名
氏名
コンプライアンス委員会
25名
業務会社
執行役員
カンパニー長
加藤
朝史
コンプライアンスに関する社内状況の把握
と評価、また社内教育推進等を行います。
リスク管理委員会
26名
代表取締役社長
木村
龍一
業務執行に係るリスクの把握と管理、また
対策本部としての活動を行います。
情報セキュリティ委員会
22名
業務会社
執行役員
カンパニー長
加藤
当社の有する情報資産に対する改竄、破壊、
朝史漏洩等からの保護、防衛策の検討と状況把
握、また教育、監査等を行います。
サステナビリティ委員会
48名
代表取締役会長
内部通報制度
―
―
吉田
均
企業活動全プロセスにおける人権尊重、地
球環境へ与える影響等について評価し、当
社グループが負う責任を自覚し、社会的役
割の確実な遂行に努めるための状況把握と
評価、教育推進等を行います。
不正行為等の早期発見と是正のため、法令
や会社規程等に違反又はそのおそれがある
行為を通報し、相談できる制度。通報者は
通報をもって不利益を蒙らないよう保護さ
れています。
Ⅱ.当該体制を採用する理由
取締役会の機能向上を図り、経営の透明性、効率性を高め、企業価値の向上を図ることを目的として、コー
ポレート・ガバナンス体制をより一層充実させるため。
③
企業統治に関するその他の事項
Ⅰ.当社は2006年5月開催の取締役会において決議した、以下に記す内部統制システムの基本方針(最新改訂
2026年5月)に基づき、企業統治の体制を構築し、運用しています。
1.業務運営の基本方針
当社は、「世界中の優れた技術・知恵・情報を融合して世界No.1の商品を創り出し、皆様と共に大きく
成長していく。」という企業理念を経営の拠り所としています。株主の皆様、お客様、お取引先、使用人等
全てのステークホルダーの方々との間で、WIN-WINの関係を創り上げ、長期的に成長を持続させていくため
に、より一層、コーポレート・ガバナンスとコンプライアンスの強化に取り組み、経営の健全性と透明性を
確保し、グループ経営を行っていきます。
2.当社及び子会社の取締役及び使用人の職務執行が法令及び定款に適合することを確保するための体制
ⅰ
当社及び子会社の取締役会は、業務執行を全体として適正かつ健全に行うために、コーポレート・ガバ
ナンスを一層強化する観点から、実効性ある内部統制システムの構築と法令・定款遵守の体制の確立に努
めます。
ⅱ
当社は、当社及び子会社の役員・社員の職務の執行が法令や社会規範、定款及び社内規程に適合し、か
つ社会的責任を果たすための規範となる「ACCRETECHグループ行動規範」を制定し、当社及び子会社の役
員・社員への企業倫理意識の浸透・定着を図っています。
ⅲ
当社は、当社及び子会社の役員・社員のすべての事業活動におけるコンプライアンス体制の整備及び問
題点の把握・対処のため、当社及び子会社にコンプライアンス統括責任者、コンプライアンス統括管理者
を配置のうえ、業務会社カンパニー長を責任者とする「コンプライアンス委員会」を設置しています。
ⅳ
万一コンプライアンスに関連する事態が発生した場合には、その内容がコンプライアンス統括責任者か
ら「コンプライアンス委員会」を通じ、取締役会及び監査等委員会に報告される体制を構築します。
ⅴ
当社は、社長直属の監査室を設置します。監査室は、当社及び子会社に対し、法令・定款及び社内規程
等への準拠性、企業倫理に照らした適切性、管理・運営の有効性および効率性の検証を目的として内部監
査を実施します。
ⅵ
当社は、当社及び子会社における社会規範、企業倫理に反する行為についての通報や相談に応じるた
め、内部通報制度を設けます。内部通報制度に関しては、通報者の保護を図るとともに透明性を維持した
的確な対処の体制を整備します。
ⅶ
当社の監査等委員会は、内部統制システムの有効性と機能を監査します。
― 57 ―
3.当社の取締役の職務執行に係る情報の保存及び管理に関する体制
ⅰ
当社の取締役は、職務執行に係る情報・文書を「情報セキュリティ基本方針」の定めるところに従い適
切に管理し保存します。
ⅱ
当社の各取締役より閲覧の要求があるときには、これを閲覧に供します。
4.当社及び子会社の損失の危険の管理に関する規程その他の体制
ⅰ
当社は、潜在的なリスクの発生予防に努めるとともに、リスクが顕在したときは代表取締役社長以下全
員が一丸となって迅速且つ冷静に対応します。
ⅱ
当社は、当社及び子会社における業務執行に係るリスクの把握と管理を目的として「リスク管理規程」
を定め、代表取締役社長を責任者とする「リスク管理委員会」を設置します。リスク管理委員会は、リス
ク管理規程に基づき、潜在的なリスクの発生予防と危機発生に備えた体制整備を行います。
ⅲ
監査室の監査により、当社及び子会社において法令・定款違反、社内規程違反又はその他の事由に基づ
く損失の危険のある業務執行行為が発見された場合には、監査室長は直ちに代表取締役社長に報告しま
す。取締役会による是正・改善に関する指示に基づき、監査室はその改善進捗状況を確認します。
ⅳ
リスクが発生したときは、必要に応じ、直ちに代表取締役社長を本部長とする「リスク対策本部」を設
置し、リスクへの対応と速やかな収拾に向けた活動を行います。
5.当社及び子会社の取締役の職務執行が効率的に行われることを確保する体制
ⅰ
当社及び子会社の取締役会は、取締役会規程等に基づき、経営の方針その他経営に関する重要事項の決
定、及び取締役の業務執行状況の監督等を行います。その際には、議題に関する十分な資料が全役員に配
布される体制をとります。
ⅱ
当社は、製品開発計画におけるスピーディな意思決定や市場動向への迅速かつ柔軟な対応等のため、執
行役員制度を採用しています。定例の経営執行会議や執行役員会議により、業務計画の進捗状況について
監督等を行います。
ⅲ
当社及び子会社は、日常の職務執行に際しては、職務権限規程及び業務分掌規程等に基づき権限と責任
の委譲を行い、業務を遂行しています。
6.その他の当社及び子会社における業務の適正を確保するための体制
ⅰ
当社は「子会社の東京精密への申請事項と報告事項に関する規程」等を定め、子会社の重要な事項につ
いては当社への報告がなされるほか、規程に則り当社代表取締役社長決裁あるいは当社の取締役会での付
議承認等を要する体制としています。
ⅱ
当社は、子会社に必要な支援指導を行うほか、必要に応じて当社の取締役・使用人を、子会社の取締役
及び監査役として派遣し、業務執行に対する監督・監査を行います。
ⅲ
当社の代表取締役社長直属の経営支援室は、子会社に内在する諸問題又は重大なリスク情報等を採り上
げ、当社及び子会社全体の利益の観点から、当社及び子会社における情報の共有と業務執行の適正を確保
することに努めます。
ⅳ
経営支援室は、子会社に損失の危険が発生し、これを把握した場合には、直ちに発見された損失の危険
の内容、発生する損失の程度及び当社に対する影響等について、取締役会及び担当部署に報告します。
ⅴ
監査等委員会並びに監査室は、当社と子会社に関する不適切な取引又は会計処理の防止、早期発見に努
めます。このため当社及び子会社の監査等委員、監査役、監査室は必要に応じて十分な情報交換を行いま
す。
7.財務報告の信頼性を確保するための体制
ⅰ
当社は、当社及び子会社における信頼性のある財務報告作成に対するリスクに対応して、これを十分に
軽減する統制活動を確保するための方針として「財務報告に係る内部統制の基本方針」を制定します。
ⅱ
当社及び子会社は、自らの業務遂行にあたり、職務分離による牽制、日常的モニタリング等を実施し、
財務報告の適正性の確保に努めます。
ⅲ
内部統制委員会は、当社及び子会社の財務報告に係る内部統制の整備・運用状況について、その有効性
評価を実施し、確認を行います。監査室は内部統制委員会による評価について、必要に応じて検証しま
す。
ⅳ
財務状況に重要な影響を及ぼす可能性が高いと認められる事項等について取締役(監査等委員である取
締役を除く。)、監査等委員及び会計監査人間で適切に情報共有を行います。
― 58 ―
8.当社の監査等委員会の職務を補助すべき使用人を置くことに関する事項
当社は、監査等委員会の業務を補助するために、監査等委員会の指揮命令下で必要に応じて使用人に補助
業務を担当させます。
9.当社の監査等委員会の職務を補助すべき使用人の他の取締役(監査等委員である取締役を除く。)からの
独立性及び当該使用人に対する監査等委員会からの指示の実効性の確保に関する事項
ⅰ
前項の補助使用人は、監査等委員会からの指揮命令事項に関しては、補助使用人の属する組織の上長等
の指揮命令を受けません。
ⅱ
監査等委員会の職務を補助すべき使用人の任命・異動については監査等委員会の同意を必要とします。
ⅲ
監査等委員会の職務を補助すべき使用人の評価については監査等委員会の意見を聴取します。
10.当社及び子会社の取締役及び使用人並びに子会社の監査役から当社の監査等委員会への報告に関する体制
ⅰ
当社及び子会社の取締役及び使用人並びに子会社の監査役は、当社の監査等委員会の定めるところに従
い、監査等委員会の要請に応じて必要な報告及び情報提供を行います。
ⅱ
前項の報告及び情報提供としての主なものは次のとおりとします。
・当社の内部統制システムに関わる活動状況
・監査室による評価・検証の結果
・子会社の監査役及び内部監査部門等の活動状況
・当社の重要な会計方針、会計基準及びその変更
・業績及び業績見込みの発表内容、重要開示書類の内容
・内部通報制度の運用及び通報の内容
・監査等委員会から要求された社内稟議書及び会議議事録の回付
ⅲ
当社及び子会社は、当社及び子会社の取締役及び使用人並びに子会社の監査役に対し、当社の監査等委
員会への報告及び情報提供を理由に不利な取扱いを受けないことを、周知するとともに遵守します。
11.その他監査等委員会の監査が実効的に行われることを確保するための体制
ⅰ
当社の代表取締役は監査等委員と可能な限り会合を持ち、業務報告とは別に会社運営に関する意見交換
のほか、意思の疎通を図ります。
ⅱ
当社の取締役会は、業務の適正を確保する上で重要な経営執行会議等の業務執行の会議への監査等委員
の出席を確保します。
ⅲ
当社は、監査等委員の職務執行に必要な費用又は債務は当社負担とし、会社法に基づく費用の前払い等
の請求があった場合は、担当部署において確認の上、速やかにこれに応じます。
12.反社会的勢力との関係遮断のための基本的な考え方とその整備状況
ⅰ
当社及び子会社は、反社会的勢力と一切の関係を持ちません。反社会的勢力から接触を受けた時は、警
察等関係機関に情報を提供するとともに、暴力的な要求・不当な要求に対しては弁護士等然るべき機関と
連携し、組織的に対処します。
ⅱ
当社及び子会社は、「ACCRETECHグループ行動規範」に反社会的勢力との関係遮断を定めています。さ
らに、所轄警察署及び株主名簿管理人等から関連情報を収集して不測の事態に備え、最新の動向を把握す
るよう努めています。また、反社会的勢力に対する対応は、担当部門を定め、必要に応じて外部機関と連
携して対処します。
Ⅱ.取締役(業務執行取締役等である者を除く)との間に締結した会社法第427条第1項に規定する契約の内容の
概要
当社は、社外取締役の高増潔、森重哉、監査等委員である取締役の秋本伸治及び相良由里子、川﨑素子、髙
山清子との間に会社法第427条第1項に規定する契約を締結しており、その内容の概要は以下のとおりです。
なお、当社は2026年6月22日開催予定の定時株主総会の議案として、「取締役(監査等委員である取締役を
除く。)6名選任の件」及び「監査等委員である取締役1名選任の件」を提案しており、当該議案が共に原案
通り承認可決されますと、取締役6名(うち社外取締役2名)及び監査等委員である取締役4名(うち社外取
締役3名)となる予定です。
― 59 ―
1.責任限度額
社外取締役又は監査等委員である取締役としての任務を怠り、会社法第423条第1項に違反し、会社に損
害を与えた場合においても、当該職務を行うにつき善意で且つ重大な過失がないときは、会社に対して負う
損害賠償額の上限を、会社法第425条第1項が定める額の合計額とします。
2.責任限定要件の判断
当該の社外取締役又は監査等委員である取締役の行為が、上記の責任限定要件を充足するか否かについて
は、会社がこれを判断するものとします。
3.株主総会の承認
当該の社外取締役又は監査等委員である取締役の行為が、会社に対し上記の責任限度額を超える損害を与
えたものであったにもかかわらず、本契約により損害賠償責任の限定を受けた場合、当該の社外取締役又は
監査等委員である取締役は株主総会の承認を得ることなく、会社から退職慰労金その他法務省令で定める財
産上の利益を受けることができません。
4.当該契約の失効
当該の社外取締役又は監査等委員である取締役が、当社又は当社の子会社の業務を執行する取締役又は執
行役又は支配人その他の使用人に就任したときは、当該契約は将来に向かってその効力を失います。
Ⅲ.役員等賠償責任保険契約の内容の概要
当社は取締役全員を被保険者とする役員等賠償保険契約を締結しており、被保険者である取締役がその職務
の執行に関し責任を負うこと又は当該責任の追及に係る請求を受けることによって生ずることのある損害が補
填されます。ただし、故意又は重過失に起因して生じた当該損害は補填されない等の免責事由があります。保
険料は全額当社が負担しています。
Ⅳ.補償契約の内容の概要
当社は取締役全員と会社法第430条の2第1項に規定する補償契約を締結しており、同項第1号の費用及び
同項第2号の損失を法令の定める範囲内において当社が補償することとしています。
Ⅴ.株主総会決議事項を取締役会で決議することができることとしている事項
1.当社は、経営環境の変化に対応したフレキシブルな資本政策の遂行を可能とするため、「会社法第165条
第2項の規定により、取締役会の決議によって同条第1項に定める市場取引等により自己の株式を取得する
ことができる」旨を定款で定めています。
2.当社は、株主への機動的な利益還元を行うことを目的として、「取締役会の決議によって、毎年9月30日
の最終の株主名簿に記載又は記録された株主又は登録株式質権者に対し、中間配当を行うことができる」旨
を定款で定めています。
Ⅵ.定款に定める取締役の員数
当社は定款での定めにより、取締役(監査等委員である取締役を除く。)の員数は15名以内、監査等委員であ
る取締役の員数は5名以内とするとしています。
Ⅶ.定款に定める取締役の選任決議要件
当社は定款での定めにより、取締役の選任決議は「議決権を行使することができる株主の議決権の3分の1
以上を有する株主が出席し、その議決権の過半数をもって行う」及び「累積投票によらないものとする」とし
ています。
Ⅷ.株主総会の特別決議要件
当社は、株主総会における特別決議の定足数を緩和することにより、株主総会を円滑に運営することを目的
として、「会社法第309条第2項に定める決議は、議決権を行使することができる株主の議決権の3分の1以
上を有する株主が出席し、その議決権の3分の2以上をもって行う」旨を定款で定めています。
― 60 ―
④
取締役会の活動状況
当事業年度において当社は取締役会を16回開催しており、個々の取締役の出席状況は次のとおりです。
氏名
開催回数
出席回数
吉田
均
16回
16回
木村
龍一
16回
16回
川村
浩一(注)1.
4回
4回
伯耆田
貴浩
16回
16回
塚田
修一(注)1.
4回
4回
ロミ プラダン
16回
16回
高増
潔
16回
16回
森
重哉
16回
16回
秋本
伸治
16回
16回
相良
由里子
16回
16回
須永
真樹(注)1.
4回
4回
川﨑
素子
16回
16回
髙山
清子(注)2.
12回
12回
(注)1.川村浩一氏、塚田修一氏、須永真樹氏については、2025年6月23日開催の第102期定時株主総会終結
の時をもって退任していますので、在任時に開催された取締役会の出席状況を記載しています。
2.髙山清子氏については、2025年6月23日開催の第102期定時株主総会において、新たに取締役に選任
されましたので、取締役の就任後に開催された取締役会の出席状況を記載しています。
取締役会における主な検討事項は次のとおりです。
テーマ
経営戦略
主な検討事項
中期経営計画の進捗状況、事業計画、重要な営業施策、子会社に関する事項等
コーポレート・ガバナ 株主総会関連、コーポレート・ガバナンスの強化、監査報告、内部監査状況報告、
ンス
取締役会実効性評価報告、投資家面談報告等
決算・財務
決算関連、予算・資金計画、配当関連、政策保有株式の売却、自己株式取得等
サステナビリティ
サステナビリティ関連
その他
人事・組織に関する事項、重要な規程の改廃等
― 61 ―
(2) 【役員の状況】
①
役員一覧
①-1.2026年6月19日(有価証券報告書提出日)現在の当社の役員の状況は、以下のとおりです。
男性7名
女性3名 (役員のうち女性の比率30%)
役職名
氏名
代表取締役
会長
吉
田
代表取締役
社長CEO
木
村
取締役
半導体社
執行役員カンパニー
伯耆田
長兼業務会社情報シ
ステム室長兼事業戦
略室長
生年月日
均
1959年11月26日生
龍
一
1962年12月30日生
貴
浩
1962年4月24日生
略歴
1983年4月
2002年4月
2005年6月
2007年10月
2011年6月
2015年4月
2022年4月
2025年6月
1986年4月
2005年4月
2005年6月
2007年8月
2011年6月
2015年4月
2019年4月
2022年4月
2025年6月
1986年7月
1995年10月
2010年4月
2012年4月
2014年4月
2015年6月
2015年10月
2023年7月
2025年4月
1991年1月
取締役
(非常勤)
取締役
(非常勤)
取締役
(非常勤)
ロミ
高
森
プラダン
増
潔
重
哉
1968年8月10日生
1954年10月8日生
1959年8月18日生
当社入社
計測社執行役員
取締役に就任
計測社執行役員社長
代表取締役に就任
代表取締役社長CEOに就任
代表取締役会長CEOに就任
代表取締役会長(現任)
当社入社
半導体社執行役員
取締役に就任
半導体社執行役員社長
代表取締役に就任
代表取締役副社長COOに就任
半導体社カンパニー長
代表取締役社長COOに就任
代表取締役社長CEOに就任(現任)
㈱ワイ・デー・ケー入社
当社入社
半導体社執行役員
半導体社技術部門テスト技術部長
半導体社執行役員常務
取締役に就任(現任)
業務会社情報システム室長(現任)
半導体社技術部門長
半導体社執行役員カンパニー長(現任)
事業戦略室長(現任)
米国California Energy Commission入社
1992年10月
2000年8月
2001年3月
㈱ブリヂストン入社
米国Teradyne Inc.入社
ACCRETECH AMERICA INC.( 当社米国子会
社)入社
2012年4月
2013年4月
同社取締役副社長
当社半導体社執行役員兼 World Wideア
カウント統括(現任)
2016年6月
ACCRETECH AMERICA INC.プレジデント(現
任)
2023年6月
当社取締役(非常勤)に就任(現任)
1982年4月
1987年10月
東京大学工学部精密機械工学科助手
東京電機大学工学部精密機械工学科助教
授
英国ウォーリック大学客員研究員
東京大学大学院工学系研究科精密機械工
学専攻(現、精密工学専攻)教授
公益社団法人精密工学会会長
当社取締役(監査等委員)
東京大学名誉教授(現任)
当社取締役(非常勤)に就任(現任)
㈱東芝大分工場工場長
㈱ジャパンセミコンダクター 取締役社長
㈱ニューフレアテクノロジー 常勤監査役
当社取締役(非常勤)に就任(現任)
1990年3月
2001年11月
2020年3月
2020年6月
2020年6月
2021年6月
2014年4月
2016年4月
2021年6月
2023年6月
― 62 ―
任期
所有株式数
(千株)
(注)3
10
(注)3
4
(注)3
4
(注)3
0
(注)3
(注)3
役職名
取締役
(監査等委員)
取締役
(監査等委員)
(非常勤)
氏名
生年月日
秋
本
伸
治
1963年11月29日生
相
良
由里子
1974年9月6日生
略歴
1987年4月
2000年4月
2002年4月
2007年4月
2018年6月
2019年6月
2001年10月
当社入社
企画部人事企画室長
業務会社人事室長
業務会社執行役員人事室長
監査役に就任
取締役(監査等委員)に就任(現任)
弁護士登録
中村合同特許法律事務所入所
弁理士登録
中村合同特許法律事務所経営パートナー
(現任)
当社取締役(監査等委員)に就任(現任)
日油㈱社外取締役(監査等委員)(現任)
2005年8月
2013年1月
2019年6月
2021年6月
2016年6月
取締役
(監査等委員)
(非常勤)
2019年6月
川
﨑
素
子
1961年1月24日生
2021年6月
2024年6月
1997年4月
富士フイルムホールディングス㈱経営企
画部CSRグループ長
富士フイルム㈱CSR推進部長
富士フイルムホールディングス㈱執行役
員ESG推進部長兼総務部長
富士フイルム㈱執行役員ESG推進部長
富士フイルムホールディングス㈱常勤監
査役(現任)
富士フイルム㈱常勤監査役(現任)
当社取締役(監査等委員)に就任(現任)
㈱荏原製作所入社
2001年10月
取締役
(監査等委員)
(非常勤)
2019年1月
監査法人トーマツ(現、有限責任監査法
人トーマツ)入所
公認会計士登録(日本公認会計士協会東
京会所属)
髙山清子公認会計士事務所代表(現任)
2020年1月
2022年12月
2024年6月
2025年6月
リーガレックス合同会社業務執行役員
㈱SHOEI社外取締役(現任)
㈱MIXI社外監査役(現任)
当社取締役(監査等委員)に就任(現任)
2005年7月
髙
山
清
子
1975年2月6日生
計
任期
所有株式数
(千株)
(注)4
3
(注)4
(注)5
(注)4
20
(注) 1.取締役高増潔、森重哉は社外取締役です。
2.取締役相良由里子、川﨑素子及び髙山清子は社外取締役(監査等委員)です。
3.2025年6月23日開催の定時株主総会の終結の時から1年以内に終了する事業年度のうち最終のものに関する
定時株主総会の終結の時まで。
4.2025年6月23日開催の定時株主総会の終結の時から2年以内に終了する事業年度のうち最終のものに関する
定時株主総会の終結の時まで。
5.2024年6月21日開催の定時株主総会の終結の時から2年以内に終了する事業年度のうち最終のものに関する
定時株主総会の終結の時まで。
― 63 ―
①-2.2026年6月22日開催予定の定時株主総会の議案(決議事項)として、「取締役(監査等委員である取締役
を除く。)6名選任の件」及び「監査等委員である取締役1名選任の件」を提案しており、当該議案が共に
原案通り承認可決されますと、当社の役員の状況及びその任期は、以下のとおりとなる予定です。
なお、役員の役職等については、当該定時株主総会の直後に開催が予定される取締役会の決議事項の内容
(役職等)を含めて記載しています。
男性7名
女性3名 (役員のうち女性の比率30%)
役職名
氏名
代表取締役
会長
吉
田
代表取締役
社長CEO
木
村
取締役
半導体社
執行役員カンパニー
伯耆田
長兼業務会社情報シ
ステム室長兼事業戦
略室長
生年月日
均
1959年11月26日生
龍
一
1962年12月30日生
貴
浩
1962年4月24日生
略歴
1983年4月
2002年4月
2005年6月
2007年10月
2011年6月
2015年4月
2022年4月
2025年6月
1986年4月
2005年4月
2005年6月
2007年8月
2011年6月
2015年4月
2019年4月
2022年4月
2025年6月
1986年7月
1995年10月
2010年4月
2012年4月
2014年4月
2015年6月
2015年10月
2023年7月
2025年4月
1991年1月
取締役
(非常勤)
取締役
(非常勤)
取締役
(非常勤)
ロミ
高
森
プラダン
増
潔
重
哉
1968年8月10日生
1954年10月8日生
1959年8月18日生
当社入社
計測社執行役員
取締役に就任
計測社執行役員社長
代表取締役に就任
代表取締役社長CEOに就任
代表取締役会長CEOに就任
代表取締役会長(現任)
当社入社
半導体社執行役員
取締役に就任
半導体社執行役員社長
代表取締役に就任
代表取締役副社長COOに就任
半導体社カンパニー長
代表取締役社長COOに就任
代表取締役社長CEOに就任(現任)
㈱ワイ・デー・ケー入社
当社入社
半導体社執行役員
半導体社技術部門テスト技術部長
半導体社執行役員常務
取締役に就任(現任)
業務会社情報システム室長(現任)
半導体社技術部門長
半導体社執行役員カンパニー長(現任)
事業戦略室長(現任)
米国California Energy Commission入社
1992年10月
2000年8月
2001年3月
㈱ブリヂストン入社
米国Teradyne Inc.入社
ACCRETECH AMERICA INC.( 当社米国子会
社)入社
2012年4月
2013年4月
同社取締役副社長
当社半導体社執行役員兼 World Wideア
カウント統括(現任)
2016年6月
ACCRETECH AMERICA INC.プレジデント(現
任)
2023年6月
当社取締役(非常勤)に就任(現任)
1982年4月
1987年10月
東京大学工学部精密機械工学科助手
東京電機大学工学部精密機械工学科助教
授
英国ウォーリック大学客員研究員
東京大学大学院工学系研究科精密機械工
学専攻(現、精密工学専攻)教授
公益社団法人精密工学会会長
当社取締役(監査等委員)
東京大学名誉教授(現任)
当社取締役(非常勤)に就任(現任)
㈱東芝大分工場工場長
㈱ジャパンセミコンダクター 取締役社長
㈱ニューフレアテクノロジー 常勤監査役
当社取締役(非常勤)に就任(現任)
1990年3月
2001年11月
2020年3月
2020年6月
2020年6月
2021年6月
2014年4月
2016年4月
2021年6月
2023年6月
― 64 ―
任期
所有株式数
(千株)
(注)3
10
(注)3
4
(注)3
4
(注)3
0
(注)3
(注)3
役職名
取締役
(監査等委員)
取締役
(監査等委員)
(非常勤)
氏名
生年月日
秋
本
伸
治
1963年11月29日生
相
良
由里子
1974年9月6日生
略歴
1987年4月
2000年4月
2002年4月
2007年4月
2018年6月
2019年6月
2001年10月
当社入社
企画部人事企画室長
業務会社人事室長
業務会社執行役員人事室長
監査役に就任
取締役(監査等委員)に就任(現任)
弁護士登録
中村合同特許法律事務所入所
弁理士登録
中村合同特許法律事務所経営パートナー
(現任)
当社取締役(監査等委員)に就任(現任)
日油㈱社外取締役(監査等委員)(現任)
2005年8月
2013年1月
2019年6月
2021年6月
2016年6月
取締役
(監査等委員)
(非常勤)
2019年6月
川
﨑
素
子
1961年1月24日生
2021年6月
2024年6月
1997年4月
富士フイルムホールディングス㈱経営企
画部CSRグループ長
富士フイルム㈱CSR推進部長
富士フイルムホールディングス㈱執行役
員ESG推進部長兼総務部長
富士フイルム㈱執行役員ESG推進部長
富士フイルムホールディングス㈱常勤監
査役(現任)
富士フイルム㈱常勤監査役(現任)
当社取締役(監査等委員)に就任(現任)
㈱荏原製作所入社
2001年10月
取締役
(監査等委員)
(非常勤)
2019年1月
監査法人トーマツ(現、有限責任監査法
人トーマツ)入所
公認会計士登録(日本公認会計士協会東
京会所属)
髙山清子公認会計士事務所代表(現任)
2020年1月
2022年12月
2024年6月
2025年6月
リーガレックス合同会社業務執行役員
㈱SHOEI社外取締役(現任)
㈱MIXI社外監査役(現任)
当社取締役(監査等委員)に就任(現任)
2005年7月
髙
山
清
子
1975年2月6日生
計
任期
所有株式数
(千株)
(注)4
3
(注)4
(注)5
(注)4
20
(注) 1.取締役高増潔、森重哉は社外取締役です。
2.取締役相良由里子、川﨑素子及び髙山清子は社外取締役(監査等委員)です。
3.2026年6月22日開催の定時株主総会の終結の時から1年以内に終了する事業年度のうち最終のものに関する
定時株主総会の終結の時まで。
4.2025年6月23日開催の定時株主総会の終結の時から2年以内に終了する事業年度のうち最終のものに関する
定時株主総会の終結の時まで。
5.2026年6月22日開催の定時株主総会の終結の時から2年以内に終了する事業年度のうち最終のものに関する
定時株主総会の終結の時まで。
― 65 ―
②
社外役員の状況
Ⅰ. 社外取締役の員数並びに当社との人的関係、資本的関係又は取引関係その他の利害関係
1.社外取締役5名
なお、当社は、2026年6月22日開催予定の定時株主総会の議案(決議事項)として、「取締役(監査等委
員である取締役を除く。)6名選任の件」及び「監査等委員である取締役1名選任の件」を提案してお
り、当該議案が共に原案通り承認可決されますと、当社の社外取締役(監査等委員である取締役除く)は
2名、社外取締役(監査等委員)は3名となります。
2.提出会社との関係
取引関係
その他の利害関係
特に記載すべき事項は
高増
潔
該当ありません
0株
ありません
社外取締役
特に記載すべき事項は
森
重哉
該当ありません
0株
ありません
特に記載すべき事項は
相良由里子
該当ありません
0株
ありません
社外取締役
特に記載すべき事項は
川﨑素子
該当ありません
0株
(監査等委員)
ありません
特に記載すべき事項は
髙山清子
該当ありません
0株
ありません
・社外取締役高増潔氏は東京大学名誉教授ですが、同氏及び同大学と当社との間には記載すべき取引関係又
区分
氏名
人的関係
資本的関係
(当社株式の所有株式数)
は利害関係はありません。
・
社外取締役森重哉氏は㈱ジャパンセミコンダクター出身ですが、同社と当社との間には、当社より同社へ
・
社外取締役(監査等委員)相良由里子氏は弁護士及び弁理士資格を有し、現在、特許法律事務所の経営パー
の製品売上の取引関係が存在しますが僅少でありその他の利害関係はありません。
トナーに就任していますが、同氏及び同事務所と当社との間には記載すべき取引関係又は利害関係はあり
ません。
・
社外取締役(監査等委員)川﨑素子氏は富士フイルムホールディングス㈱及び富士フイルム㈱の現任の常勤
監査役ですが、同社と当社との間には、当社より同社への製品売上の取引関係が存在しますが僅少であり
その他の利害関係はありません。
・
社外取締役(監査等委員)髙山清子氏は公認会計士資格を有し、現在、公認会計士事務所の代表に就任して
いますが、同氏及び同事務所と当社との間には記載すべき取引関係又は利害関係はありません。
③
社外取締役による監査と内部監査及び会計監査との相互連携並びに内部統制部門との関係
Ⅰ. 社外取締役が提出会社の企業統治において果たす機能と役割
1.社外取締役(監査等委員である者を除く)は取締役会をはじめとする諸会議に出席し、専門的知識とこれま
での組織運営の経験を活かして、取締役会による意思決定及び業務執行取締役の職務執行を監督する機能
を果たします。
2.監査等委員である社外取締役は取締役会をはじめとする諸会議に出席し、それぞれの高い見識と豊富な実
務経験を活かして、内部統制システムの有効性と機能について監査します。
3.社外取締役は、一般株主との利益相反を生ずるおそれがない独立性の立場からその機能を果たします。
Ⅱ. 社外取締役の選任状況
1.社外取締役選任の際に当社からの独立性に関する基準を設けており、一般株主との利益相反の生ずるおそ
れがなく、また会社の経営に対し中立的立場からの意見表明が可能であるような、特定の利害関係者との
関連の無い候補者を選任する方針をとっています。
2.社外取締役(監査等委員である者を除く)の各位は、産業、金融等の諸分野でこれまで培ってこられた豊富
な経営経験、専門的知識、幅広い知見等が当社の経営、人財育成等に活かしてもらえるものとして選任さ
れています。
3.監査等委員である社外取締役の各位は、企業、研究機関等の諸分野で培われた高い見識と豊富な実務経験
とで当社の監査体制の一層の強化に実力を発揮してもらえるものとして選任されています。
― 66 ―
Ⅲ. 社外取締役による監査と内部監査及び会計監査との相互連携並びに内部統制部門との関係
1.社外取締役(監査等委員である者を除く)は、取締役会その他の重要会議への出席を通じて、業務執行取締
役とは異なる視点から取締役の職務執行を監督し、必要な意見を述べます。
2.監査等委員である社外取締役は、監査等委員会の構成員として監査等委員会の機能の一翼を担い、取締役
会、監査室等の機関又は部門との相互関係を持ちます。
3.監査等委員会は、会社決算報告が会社の状況を正しく反映しているかどうかの検討に際しては、会計監査
人からの報告、説明も受けています。監査等委員会と会計監査人とは2ヶ月に1回の頻度で、会計監査に
関する体制、計画、実施状況等に関する報告、検討の会合を設け、緊密な相互連携に努めています。ま
た、監査等委員会と監査室とは2ヶ月に1回程度の頻度で報告、検討の会合を設けています。
― 67 ―
(3)【監査の状況】
①
監査等委員会監査の状況
当社の監査等委員会は、社内監査等委員1名及び社外監査等委員3名から構成されています。社内監査等委員
である秋本伸治氏は当社の人事関連部門の経験が長く、担当役員として会社の経営に携わり、コンプライアンス
委員や内部統制委員として、法務・リスクマネジメント及び人事・労務・人材開発の知見を有しています。社外
監査等委員である相良由里子氏は弁護士として法令についてグローバルで高度な能力・知見並びに知的財産に関
する深い見識を有しています。社外監査等委員である川﨑素子氏は、企業経営で長年にわたりCSR業務、ESG活動
推進及びコンプライアンス・リスクマネジメント業務に携わった経験に加え、事業会社での監査役の経験を踏ま
えたガバナンス等の深い見識・知見を有しています。社外監査等委員である髙山清子氏は公認会計士としての幅
広い経験から、財務及び会計に関しても相当程度の知見を有しています。
監査等委員は年間を通じ、取締役会をはじめとする重要会議への出席、業務執行状況の聴取、重要決裁書類の
閲覧といった手続きを通じて会社の行う業務執行、会計処理、財産管理等に関し監査を行い、法令違反、忠実義
務違反等の行為の有無のチェックを行っています。また、会計監査人及び監査室と定期的に会合を持ち、必要な
報告を受けるとともに、意見交換することにより意思疎通を図っています。
なお、当社は2026年6月22日開催予定の定時株主総会の議案として、「監査等委員である取締役1名選任の
件」を提案しており、当該議案が原案通り承認可決されますと、監査等委員である取締役4名(うち社外取締役
3名)となる予定です。
当事業年度において当社は監査等委員会を14回開催しており、個々の監査等委員の出席状況は次のとおりで
す。
氏
名
開催回数
出席回数
秋本
伸治
14回
14回
相良
由里子
14回
14回
須永
真樹
4回
4回
川﨑
素子
14回
14回
髙山
清子
10回
10回
(注)1.須永真樹氏は、2025年6月23日開催の第102期定時株主総会終結の時をもって退任していますので、
在任時に開催された監査等委員会の出席状況を記載しています。
2.髙山清子氏は、2025年6月23日開催の第102期定時株主総会において、新たに監査等委員に選任さ
れましたので、監査等委員の就任後に開催された監査等委員会の出席状況を記載しています。
監査等委員会における主要な議題は、次のとおりです。
・監査方針・監査計画の決定
・監査報告書
・四半期・決算短信の監査
・会計監査人の再任・不再任の決定
・監査法人の報酬の承認
・取締役の人事・報酬についての意見の決定
・事業報告・株主総会議案の監査
・内部統制システムの監査
・海外子会社の業務に関するヒアリング
・重要稟議の監査
― 68 ―
②
内部監査の状況
監査室は、代表取締役社長直轄の組織として室員4名から構成されており、当社および当社グループ会社の
「組織」・「制度」・「管理体制」・「業務」が、法令、経営方針および諸規程に準拠し、有効的かつ効率的に
運営されているかを独立的かつ客観的に検証・評価・助言します。これより、会社の内部統制体制を充実させる
とともに、不正・誤謬の未然防止、適切な管理体制の構築、財産の保全、業務活動の改善向上等を通じて経営効
率を増進と各組織の付加価値向上に資することを目的として内部監査を実施しています。『内部監査基本規程』
に基づき、ガバナンス、リスクマネジメント及びコントロールを評価・診断した内部監査結果は、代表取締役社
長、取締役会及び監査等委員会に報告しています。監査室の監査により、法令違反、定款違反、社内規程違反又
はその他の事由に基づく損失の危険のある業務執行行為が発見された場合は、監査室長は直ちに代表取締役社
長、取締役会及び監査等委員会に報告し、取締役会による是正・改善に関する指示に基づき、監査室はその改善
進捗状況を確認します。当事業年度において、監査室による内部監査17件を実施し、各監査結果を代表取締役社
長、取締役会及び監査等委員会に報告しました。取締役会、代表取締役社長への報告に加えて、監査内容を監査
等委員会及び経営執行会議に報告し、本社部署・工場・営業所及び子会社の状況や要改善点を社内共有するとと
もに、要改善点の改善状況をフォローして取締役会に報告しています。
― 69 ―
③
会計監査の状況
Ⅰ.監査法人の名称
EY新日本有限責任監査法人
Ⅱ.継続監査期間
41年間
Ⅲ.業務を執行した公認会計士の氏名
指定有限責任社員
業務執行社員
指定有限責任社員
業務執行社員
寶
野
裕
昭
牧
野
幸
享
Ⅳ.監査業務に係る補助者の構成
公認会計士7名
④
その他19名
監査報酬の内容等
Ⅰ.監査公認会計士等に対する報酬の内容
前連結会計年度
区分
当連結会計年度
監査証明業務に
基づく報酬(百万円)
非監査業務に
基づく報酬(百万円)
監査証明業務に
基づく報酬(百万円)
非監査業務に
基づく報酬(百万円)
提出会社
39
-
40
-
連結子会社
20
-
18
-
計
59
-
59
-
Ⅱ.監査公認会計士等と同一のネットワーク(Ernst & Young)に対する報酬の内容(Ⅰを除く)
前連結会計年度
区分
当連結会計年度
監査証明業務に
基づく報酬(百万円)
非監査業務に
基づく報酬(百万円)
監査証明業務に
基づく報酬(百万円)
非監査業務に
基づく報酬(百万円)
提出会社
-
-
-
8
連結子会社
40
23
43
17
計
40
23
43
25
Ⅲ.その他の重要な報酬の内容
該当事項はありません。
Ⅳ.監査公認会計士等の提出会社に対する非監査業務の内容
前連結会計年度(自
2024年4月1日
至
2025年3月31日)
至
2026年3月31日)
該当事項はありません。
当連結会計年度(自
2025年4月1日
該当事項はありません。
Ⅴ.監査公認会計士等と同一のネットワークに属しているErnst & Youngに対する非監査業務の内容
前連結会計年度(自
2024年4月1日
至
2025年3月31日)
会計・税務に関する指導・助言業務等
当連結会計年度(自
2025年4月1日
至
2026年3月31日)
会計・税務に関する指導・助言業務等
― 70 ―
Ⅵ.監査報酬の決定方針
当社の監査公認会計士等に対する監査報酬の決定方針については特に定められたものはありませんが、会社
の規模等から予定される監査日数、監査延べ人員数等の見積りを基礎とし、会社と監査法人協議の上で決定し
ています。
Ⅶ.監査法人の選定方針と理由
当社がグローバルに営む広範・多岐な業務内容に対応して、一定の規模と世界的なネットワークを有し、効
率的な監査業務を実施できる体制が整備されていること、また監査期間や監査要領、監査費用等も合理的で妥
当であること、更にはこれまでの監査実績等を考慮して、総合的に判断しています。
Ⅷ.監査等委員会による監査法人の評価
当社の監査等委員会は、日本監査役協会が公表する「会計監査人の評価及び選定基準策定に関する監査役等
の実務指針」に基づき、監査法人に対して評価を行っており、同法人による会計監査は従前から適正に行われ
ていることを確認しています。
― 71 ―
(4) 【役員の報酬等】
Ⅰ.役員の報酬等の額又はその算定方法の決定に関する方針に係る事項
当社は「コーポレート・ガバナンス基本方針」において、役員の報酬等の額の決定に関する方針及び手続を定
めており、その内容は以下のとおりです。
1.基本方針
ⅰ
企業理念実現に向けて適切に機能することを目的とします。
ⅱ
各役員が担う役割・責任や成果に応じた報酬体系とします。
ⅲ
業績及び中長期的な企業価値・株主価値向上を動機付ける報酬体系とします。
ⅳ
経済情勢や当社業績、外部調査等を踏まえ、適時適切に見直しを行います。
ⅴ
客観性・透明性の高い決定プロセスとします。
2.報酬体系
ⅰ
監査等委員でなく社外取締役でない取締役(以下、「業務執行を担う取締役」という)の報酬は、固定報
酬である「基本報酬」と変動報酬である「業績連動賞与」「株式報酬」で構成します。
ⅱ
監査等委員及び社外取締役の報酬は、業務執行の監督および監査の職責に鑑み、「基本報酬」のみとしま
す。
ⅲ
取締役に対して支払う「基本報酬」は、在任中に毎月支給する固定金銭報酬とします。基本報酬と業績連
動賞与をあわせた年間支払総額は株主総会で承認された上限額の範囲内とします。「基本報酬」は、個々
の取締役に対し、役位別報酬基準額(*1)に基づき支給します。
(*1)役位別報酬基準額:代表取締役社長を基準として役位に応じて定める報酬割合に基づく報酬額で
報酬案検討会が策定し指名・報酬委員会にて決定
ⅳ
業務執行を担う取締役に対して支払う「業績連動賞与」は、在任中毎年一定の時期に支給する短期業績連
動金銭報酬とします。基本報酬と業績連動賞与をあわせた年間支払総額は株主総会で承認された上限額の
範囲内とします。個々の業務執行を担う取締役に対して支払う「業績連動賞与」は、以下の算式で算出し
ます。
基本賞与支給額(*2)×会社業績係数(*3)×カンパニー業績係数等(*4)
(*2)基本賞与支給額:連結当期純利益×0.6%×基本報酬割合
基本報酬割合:業務執行を担う取締役の基本報酬総額に占める各取締役の基本報酬の割合
(*3)会社業績係数:年度営業利益計画の達成状況に対応した係数
計画比±10%以下:1
+10%超30%以下:1.1
-30%以上-10%未満:0.9
+30%超50%以下:1.2
-50%以上-30%未満:0.8
+50%超:1.3
-50%未満:0.7
(但し前年度比減益の場合は1以下とします)
(*4)カンパニー業績係数等:カンパニー業績、その他事項での顕著な実績を総合評価(0.9~1.1)
ⅴ
業務執行を担う取締役に対して支払う「株式報酬」は、株主との利益共有可能な中長期インセンティブと
して支給します。株式報酬は第1給付および第2給付により構成されており、取締役に対しては役員株式
給付規程に基づいてポイントが付与され、一定の要件を満たした場合に保有ポイント数に応じて1ポイン
ト当たり当社株式1株に換算された株式等が給付されます。当社の取締役に付与されるポイントの合計は
株主総会で承認された上限の範囲内とします。個々の業務執行を担う取締役に対して付与するポイント
は、第1給付と第2給付それぞれについて、以下のとおり算出します。
A.
第1給付のポイント 役位別に定めるポイント(*5)
B.
第2給付のポイント 役位別に定めるポイント(*5)×資本効率係数(*6)×ESG係数(*7)×
中期業績係数(*8)
(*5)役位別に定めるポイント:役位別報酬基準額を参考に報酬案検討会が策定し指名・報酬委員会で
決定
(*6)資本効率係数:直近3年平均連結ROE15%以上:1.2
同10%以上15%未満:1
(*7)ESG係数:ESG活動への取組状況を評価(指名・報酬委員会による評価
(*8)中期業績係数:中期営業利益目標の達成状況に対応した係数
基本係数:1
中期営業利益目標達成時:2
― 72 ―
同10%未満:0.8
0.9~1.1)
3.報酬決定プロセス
ⅰ
取締役会は、取締役報酬について、代表取締役と取締役の一部で構成する報酬案検討会を設置し、報酬体
系案や役位別報酬基準案等の策定を委嘱します。
ⅱ
報酬案検討会が策定した取締役報酬案等(役位別報酬基準額等)および各取締役の基本報酬、業績連動賞
与、株式報酬は、透明性・客観性を高めるため、監査等委員および社外取締役で構成する指名・報酬委員
会で協議のうえ決定します。
ⅲ
監査等委員である取締役報酬については、監査等委員である取締役の協議により決定します。
Ⅱ.提出会社の役員区分ごとの報酬等の総額、報酬等の種類別の総額及び対象となる役員の員数
当事業年度(自
2025年4月1日
至
2026年3月31日)
報酬等の種類別の総額(百万円)
役員区分
対象となる
左記のうち 役員の員数
譲渡制限付株株式給付信託
業績連動報酬
非金銭報酬
(名)
式報酬
(BBT)
等
報酬等の総額
(百万円)
基本報酬
481
147
148
8
177
185
6
23
23
-
-
-
-
1
42
42
-
-
-
-
6
取締役
(監査等委員及び社
外取締役を除く)
取締役(監査等委
員)(社外取締役を
除く)
社外取締役
(注)1.社外取締役の員数には、2025年6月23日開催の第102期定時株主総会終結の時をもって退任した2名が含まれ
ています。
2.取締役(監査等委員である取締役を除く。)の報酬の限度額は、第101期定時株主総会(2024年6月21日開
催)において、年額700百万円以内(うち社外取締役は70百万円以内)と、別枠として業績連動型株式報酬制
度「株式給付信託」(監査等委員である取締役及び社外取締役を除く。)の導入が決議されています。非金
銭報酬等は、報酬の対象期間に応じて、複数年にわたって費用を計上する業績連動型株式報酬制度「株式給
付信託」および譲渡制限付株式報酬の当事業年度の費用計上額です。当該株主総会終結時の取締役(監査等
委員である取締役を除く。)の員数は8名(うち社外取締役は2名)です。
3.監査等委員である取締役の報酬の限度額は、第96期定時株主総会(2019年6月24日開催)において、年額60
百万円以内と決議されています。当該株主総会終結時の監査等委員である取締役の員数は4名です。
4.取締役(監査等委員である取締役を除く。)の個人別報酬は、報酬の基本方針・体系・決定プロセスに基づ
き、指名・報酬委員会での諮問を受けて取締役会で決定されており、基本方針に沿うものであると判断して
います。
5.業績連動報酬にかかる指標は、株主の皆様への利益還元に直結する親会社株主に帰属する当期純利益によっ
ています。
Ⅲ.提出会社の役員ごとの連結報酬等の総額等
氏名
連結報酬等
の総額
役員区分会社区分
(百万円)
基本報酬
連結報酬等の種類別の額(百万円)
譲渡制限付株式給付信託左記のうち、
業績連動報酬
株式報酬
(BBT) 非金銭報酬等
吉田
均
169
取締役
提出会社
53
54
2
59
61
木村
龍一
189
取締役
提出会社
60
61
2
65
67
(注)1.連結報酬等の総額が1億円以上である者に限定して記載しています。
2.記載金額は百万円未満を切り捨てて表示しています。
Ⅳ.使用人兼務役員の使用人給与のうち重要なもの
重要なものはありません。
― 73 ―
(5) 【株式の保有状況】
①
投資株式の区分の基準及び考え方
株式価値の変動又は配当受領によって利益を得ることを目的として保有する株式を純投資目的である投資株
式、それ以外の株式を純投資目的以外の目的である投資株式(政策保有株式)に区分しています。
②
保有目的が純投資目的以外の目的である投資株式
ⅰ
保有方針及び保有の合理性を検証する方法並びに個別銘柄の保有の適否に関する取締役会等における検証の
内容
取締役会は、政策保有株式についてリスク/リターンを踏まえた中長期的な経済合理性及び定性面等を総
合的に検証し、検証の結果、保有意義が認められない政策保有株式については原則として縮減する方針と
し、中長期的な企業価値向上に資すると判断する場合には保有を継続することとします。
ⅱ
銘柄数及び貸借対照表計上額
貸借対照表計上額
(百万円)
銘柄数
非上場株式
1
79
非上場株式以外の株式
21
3,270
(当事業年度において株式数が増加した銘柄)
株式数の増加に係る取得
価額の合計額(百万円)
銘柄数
株式数の増加の理由
非上場株式
-
-
-
非上場株式以外の株式
2
3
取引先持株会を通じた株式の取得
(当事業年度において株式数が減少した銘柄)
株式数の減少に係る売却
価額の合計額(百万円)
銘柄数
非上場株式
-
-
非上場株式以外の株式
3
365
― 74 ―
ⅲ
特定投資株式及びみなし保有株式の銘柄ごとの株式数、貸借対照表計上額等に関する情報
特定投資株式
銘柄
当事業年度
前事業年度
株式数(株)
株式数(株)
貸借対照表計上額貸借対照表計上額
(百万円)
(百万円)
176,741
176,741
㈱みずほフィナンシ
ャルグループ
1,075
715
400,000
400,000
旭ダイヤモンド工業
㈱
472
332
112,000
112,000
東亜建設工業㈱
341
145
60,000
60,000
THK㈱
274
217
200,000
100,000
TPR㈱
㈱三菱UFJフィナンシ
ャル・グループ
㈱トミタ
㈱山善
英和㈱
㈱めぶきフィナンシ
ャルグループ
ミクロン精密㈱
日本電計㈱
佐藤商事㈱
大豊工業㈱
㈱筑波銀行
サンケン電気㈱
オークマ㈱
黒田精工㈱
杉本商事㈱
第一生命ホールディ
ングス㈱
㈱三井住友フィナン
シャルグループ
京セラ㈱
㈱ニコン
245
231
80,000
208
133,633
80,000
160
132,918
163
180
80,000
114
29,040
74
56,756
67
30,000
62
23,026
160,000
210
29,040
64
56,756
41
30,000
45
21,703
55
39
14,834
34
20,000
20
28,000
15
2,000
14
2,998
10
8,150
8
4,000
5
3,200
4
27
0
-
-
-
-
14,834
22
20,000
11
28,000
7
2,000
13
2,998
10
8,150
8
4,000
5
3,200
3
27
0
124,000
207
897
1
保有目的、業務提携等の概要、
定量的な保有効果
及び株式数が増加した理由
当社の株式の
保有の有無
(保有目的)取引関係の安定・維持
(定量的な保有効果)(注)1.
有
同上
有
同上
無
同上
有
(保有目的)取引関係の安定・維持
(定量的な保有効果)(注)1.
(増加した理由)2025年9月26日付で
普通株式1株につき2株の割合で株
式分割したことによる増加
(保有目的)取引関係の安定・維持
(定量的な保有効果)(注)1.
(保有目的)取引関係の安定・維持
(定量的な保有効果)(注)1.
(増加した理由)取引先持株会を通じ
た株式の取得
(保有目的)取引関係の安定・維持
(定量的な保有効果)(注)1.
有
有
有
無
同上
有
同上
有
同上
無
(保有目的)取引関係の安定・維持
(定量的な保有効果)(注)1.
(増加した理由)取引先持株会を通じ
た株式の取得
(保有目的)取引関係の安定・維持
(定量的な保有効果)(注)1.
有
有
同上
無
同上
有
同上
無
同上
無
同上
有
同上
有
同上
有
同上
有
同上
無
同上
無
― 75 ―
みなし保有株式
銘柄
当事業年度
前事業年度
株式数(株)
株式数(株)
保有目的、業務提携等の概要、
定量的な保有効果
及び株式数が増加した理由
貸借対照表計上額貸借対照表計上額
(百万円)
(百万円)
32,400
32,400 (保有目的)取引関係の安定・維持
㈱三井住友フィナン
(定量的な保有効果)(注)1.
シャルグループ
162
122 議決権行使権限を保有しています。
当社の株式の
保有の有無
有
10,000
10,000
同上
無
24
13
5,100
5,100
沖電気工業㈱
同上
無
13
5
(注) 1.定量的評価(スクリーニング)の実施
・総合採算(配当+取引関連収益)と株主資本コストとの比較判定
・累積株式保有リターン(株式時価+累積配当-取得価額)の正負判定
・信用面(格付、コンプライアンス問題等)の検証
2.貸借対照表計上額の上位銘柄を選定する段階で特定投資株式とみなし保有株式との合算は行っていません。
イノテック㈱
③
保有目的が純投資目的である投資株式
該当事項はありません。
― 76 ―
5 【従業員の状況等】
(1) 【人材戦略に関する基本方針等】
①
基本方針
当社グループは「計測で未来を測り、半導体で未来を創る」というパーパスのもと、長期ビジョン2050で掲げ
る「高度な技術力と豊かな創造性で未体験の未来を切り拓く」存在を目指しています。その実現に向けた価値創
出の源泉であり、最も重要な基盤が人的資本です。
当社を取り巻く事業環境が高度化・複雑化する中、持続的な成長と継続的な価値創出の実現には、多様な人財
を確保するとともに、一人ひとりの力を最大限に引き出し、組織として結集させることが不可欠であると考えて
います。
当社グループは経営戦略実現のための人財戦略として、従業員一人ひとりの成長を促すとともに、その力を最
大限に発揮できる組織・職場環境の構築を推進します。
②
人財戦略
当社グループは、昨年策定した中期経営計画(2025-2027)を、持続的成長に向けた基盤強化のフェーズと位
置付けています。本計画期間は、10年後に「当社の製品やサービスがなければモノを作れない、測れない」とい
うポジションを確立するための重要な期間です。
計画の実現にあたっては、下表のとおり、事業戦略の遂行を支えるうえで必要となる人財および組織を特定し、
それらの確保を最優先課題と認識しています。
具体的な施策、進捗状況および詳細については、当社ホームページにて開示しています。
https://www.accretech.com/jp/sustainability/esg/society.html
③
従業員の給与その他の給付の額及び内容の決定に関する方針
従業員に対する給与・賞与、その他の給付に関しては、必要な人財を確保するための積極的な投資と位置づけ
ています。従業員の給与において、基本給をはじめとした基幹部分は、スキルや専門性のみならず、マインドや
価値観も含めた総合的な成長と貢献度に応じて決定します。さらに、家族構成や住宅事情など福利的な要素によ
る手当も支給します。定期昇給の他、2026年4月には物価水準の上昇に応じたベースアップ15,000円(組合員)を実
施しました。成長に応じた賃金引上げにより、高い志を持ってやりがいを感じながら仕事に取り組むことを促し
ています。また、水準に関しても豊かな生活を基礎に安心して働ける環境が築けるように各種統計や社会情勢を
参考に決定しています。
賞与については業績に応じた配分により、夏と冬の年2回の支給を基本としています。さらに2026年4月には業
績貢献に報いるための追加賞与として期間賞与を支給しました。
― 77 ―
(2) 【従業員の状況】
(1) 連結会社の状況
2026年3月31日現在
セグメントの名称
従業員数(名)
1,666
(758)
1,002
(462)
222
(110)
2,890
(1,330)
半導体製造装置
計測機器
全社(共通)
合計
(注) 1.従業員数は就業人員数です。
2.従業員数欄の(外書)は、臨時従業員の年間平均雇用人員数です。
(2) 提出会社の状況
従業員数(名)
平均年齢(歳)
1,428
(861)
平均勤続年数(年)
38.5
平均年間給与(円)
9.5
セグメントの名称
2026年3月31日現在
平均年間給与の対前
事業年度増減率(%)
8,276,412
5.7
従業員数(名)
991
(614)
354
(189)
83
(58)
1,428
(861)
半導体製造装置
計測機器
全社(共通)
合計
(注) 1.従業員数は就業人員数です。
2.従業員数欄の(外書)は、臨時従業員の年間平均雇用人員数です。
3.平均年間給与は、賞与及び基準外賃金を含んでいます。
4.前連結会計年度末に比べ従業員数が136名増加しています。主な理由は、業容の拡大に伴い採用が増加した
こと及び国内子会社からの事業譲受によるものです。
(3) 労働組合の状況
当社の労働組合はJAMに加盟しています。なお、労使関係について特記すべき事項はありません。
(4) 使用人その他の従業員のみを対象とした役員・従業員株式所有制度の内容
当社は使用人その他の従業員のみを対象とした役員・従業員株式所有制度を導入しています。当該役員・従業員
株式所有制度の内容について「1
株式等の状況(8)役員・従業員株式所有制度の内容」に記載しています。
― 78 ―
(5) 管理職に占める女性労働者の割合、男性労働者の育児休業取得率及び労働者の男女の賃金の差異
① 提出会社
当事業年度
管理職に占める
女性労働者
の割合(%)
(注)1.
男性労働者の
育児休業取得率
(%) (注)2.
2.9
80.8
労働者の男女の賃金の差異(%)(注)1.
正規雇用
労働者
全労働者
60.6
パート・
有期労働者
76.6
64.2
(注) 1.「女性の職業生活における活躍の推進に関する法律」(平成27年法律第64号)の規定に基づき算出したもの
です。
2.「育児休業、介護休業等育児又は家族介護を行う労働者の福祉に関する法律」(平成3年法律第76号)の規
定に基づき、「育児休業、介護休業等育児又は家族介護を行う労働者の福祉に関する法律施行規則」(平成
3年労働省令第25号)第71条の6第1号における育児休業等の取得割合を算出したものです。
3.正規雇用労働者 :社外への出向者、社外からの受入出向者、年度途中での入社・退職者、休職者を除く。
4.パート・有期労働者 :契約社員、パート、嘱託社員。
5.賃金 :通勤手当等を除く。
6.男女の賃金差異について、正規雇用労働者においては、主として資格別人員構成の違いに起因するもので
す。当社では、これまで女性正社員の割合が相対的に低いとの課題を認識しており、行動計画に基づき数値
目標を設定したうえで採用強化を進めてまいりました。その結果、女性正社員の人数および割合は年々増加
傾向にあるものの、積極的に新卒採用を行っていることから、現時点では女性社員の多くが若年層および非
管理職層に属しており、資格別人員構成の違いが賃金差異として表れております(女性社員のうち37.9%が
直近10年間で採用した新卒社員)。なお、同一資格内で比較した場合には、男女間で概ね同水準であり、階
層によっては女性が上回っているケースも見られます。
パート・有期労働者においては、雇用形態ごとの人員構成の違いによるものです。男性有期労働者の多くが
定年後の嘱託社員であるのに対し、女性有期労働者の多くはパート社員であるためです。
② 連結子会社
当事業年度
名称
管理職に占める
男性労働者の
女性労働者
育児休業取得率
の割合(%)
(%) (注)2.
(注)1.
労働者の男女の賃金の差異(%)(注)1.
全労働者
正規雇用
労働者
パート・
有期労働者
㈱東精エンジニアリング
0.0
84.6
45.8
86.3
58.0
㈱トーセーシステムズ
0.0
66.6
75.4
76.3
85.5
(注) 1.「女性の職業生活における活躍の推進に関する法律」(平成27年法律第64号)の規定に基づき算出したもの
です。
2.「育児休業、介護休業等育児又は家族介護を行う労働者の福祉に関する法律」(平成3年法律第76号)の規
定に基づき、「育児休業、介護休業等育児又は家族介護を行う労働者の福祉に関する法律施行規則」(平成
3年労働省令第25号)第71条の6第1号における育児休業等の取得割合を算出したものです。
3.正規雇用労働者 :社外への出向者、社外からの受入出向者、年度途中での入社・退職者、休職者を除く。
4.パート・有期労働者 :契約社員、パート、嘱託社員。
5.賃金 :通勤手当等を除く。
6.男女の賃金差異については、男性の賃金に対する女性の割合を記載しています。なお、同一資格における男
女間の差異はなく、資格別人員構成の差によるものです。
― 79 ―
第5 【経理の状況】
1
連結財務諸表及び財務諸表の作成方法について
(1) 当社の連結財務諸表は、「連結財務諸表の用語、様式及び作成方法に関する規則」 (昭和51年大蔵省令第28号)に
基づいて作成しています。
(2) 当社の財務諸表は、「財務諸表等の用語、様式及び作成方法に関する規則」 (昭和38年大蔵省令第59号。以下
「財務諸表等規則」という。)に基づいて作成しています。
また、当社は特例財務諸表提出会社に該当し、財務諸表等規則第127条の規定により財務諸表を作成しています。
2
監査証明について
当社は、金融商品取引法第193条の2第1項の規定に基づき、連結会計年度(2025年4月1日から2026年3月31日ま
で)の連結財務諸表及び事業年度(2025年4月1日から2026年3月31日まで)の財務諸表について、EY新日本有限責任
監査法人による監査を受けています。
3
連結財務諸表等の適正性を確保するための特段の取組について
当社は連結財務諸表等の適正性を確保するための特段の取組として、公益財団法人財務会計基準機構への加入、監
査法人等主催の講習会への参加、会計専門誌の定期購読等を通じて、会計基準等の内容及びその変更について適時か
つ正確に把握し、理解するような体制をとっています。
― 80 ―
1 【連結財務諸表等】
(1)【連結財務諸表】
①【連結貸借対照表】
(単位:百万円)
前連結会計年度
(2025年3月31日)
資産の部
流動資産
現金及び預金
受取手形、売掛金及び契約資産
電子記録債権
商品及び製品
仕掛品
原材料及び貯蔵品
その他
貸倒引当金
流動資産合計
固定資産
有形固定資産
建物及び構築物
減価償却累計額
建物及び構築物(純額)
機械装置及び運搬具
減価償却累計額
機械装置及び運搬具(純額)
工具、器具及び備品
減価償却累計額
工具、器具及び備品(純額)
土地
リース資産
減価償却累計額
リース資産(純額)
建設仮勘定
有形固定資産合計
無形固定資産
のれん
リース資産
その他
無形固定資産合計
投資その他の資産
投資有価証券
長期貸付金
退職給付に係る資産
繰延税金資産
その他
貸倒引当金
投資その他の資産合計
固定資産合計
資産合計
54,541
33,122
6,687
2,856
40,053
26,603
5,523
△46
169,341
※1
53,073
42,524
5,353
3,416
40,373
24,232
5,717
△83
174,607
※1
48,425
△20,824
27,600
11,742
△9,291
2,451
13,834
△9,223
4,611
13,439
1,381
△633
747
5,125
53,975
57,906
△22,924
34,982
12,575
△9,880
2,694
15,471
△10,290
5,180
13,691
1,006
△605
401
2,996
59,946
224
17
3,486
3,729
183
3
3,001
3,189
※2
― 81 ―
当連結会計年度
(2026年3月31日)
3,246
138
2,936
4,104
※2
591
△112
10,906
68,610
237,952
4,307
25
3,655
4,220
※2
582
12,790
75,925
250,533
※2
(単位:百万円)
前連結会計年度
(2025年3月31日)
負債の部
流動負債
支払手形及び買掛金
電子記録債務
短期借入金
1年内返済予定の長期借入金
リース債務
未払法人税等
契約負債
賞与引当金
役員賞与引当金
製品不具合対策引当金
その他
流動負債合計
固定負債
長期借入金
リース債務
役員退職慰労引当金
退職給付に係る負債
資産除去債務
その他
固定負債合計
負債合計
純資産の部
株主資本
資本金
資本剰余金
利益剰余金
自己株式
株主資本合計
その他の包括利益累計額
その他有価証券評価差額金
為替換算調整勘定
退職給付に係る調整累計額
その他の包括利益累計額合計
新株予約権
非支配株主持分
純資産合計
負債純資産合計
― 82 ―
当連結会計年度
(2026年3月31日)
8,301
8,364
1,300
5,000
327
5,826
6,789
2,655
19
8,348
46,933
9,085
8,443
1,300
5,000
261
4,054
6,486
3,453
1,688
8,105
47,879
13,000
456
54
811
104
361
14,789
61,723
8,000
151
64
782
105
633
9,737
57,617
11,573
23,161
141,546
△8,430
167,850
11,748
23,336
156,094
△8,362
182,816
1,030
4,306
1,034
6,371
950
1,056
176,229
237,952
1,534
5,209
1,475
8,218
662
1,218
192,916
250,533
②【連結損益計算書及び連結包括利益計算書】
【連結損益計算書】
売上高
売上原価
売上総利益
販売費及び一般管理費
営業利益
営業外収益
受取利息
受取配当金
投資事業組合運用益
為替差益
受取補償金
補助金収入
その他
営業外収益合計
営業外費用
支払利息
輸送事故による損失
固定資産除売却損
為替差損
支払補償金
その他
営業外費用合計
経常利益
特別利益
投資有価証券売却益
新株予約権戻入益
固定資産売却益
特別利益合計
特別損失
割増退職金
関係会社清算損
製品不具合対策費
特別損失合計
税金等調整前当期純利益
法人税、住民税及び事業税
法人税等調整額
法人税等合計
当期純利益
非支配株主に帰属する当期純利益
親会社株主に帰属する当期純利益
前連結会計年度
(自 2024年4月1日
至 2025年3月31日)
※1
150,534
※2、※4
88,081
62,453
※3、※4
32,750
29,703
(単位:百万円)
当連結会計年度
(自 2025年4月1日
至 2026年3月31日)
※1
166,839
※2、※4
97,978
68,860
※3、※4
35,122
33,738
64
258
66
220
59
251
921
63
236
221
646
21
89
202
1,481
202
81
0
247
152
684
29,939
214
19
3
67
89
394
34,825
179
10
4,303
4,493
191
3
194
117
※7
40
158
34,275
9,329
△798
8,531
25,744
106
25,637
1,833
1,833
33,186
8,945
△590
8,354
24,831
92
24,739
※5
※6
― 83 ―
※8
【連結包括利益計算書】
当期純利益
その他の包括利益
その他有価証券評価差額金
為替換算調整勘定
退職給付に係る調整額
その他の包括利益合計
包括利益
(内訳)
親会社株主に係る包括利益
非支配株主に係る包括利益
前連結会計年度
(自 2024年4月1日
至 2025年3月31日)
25,744
(単位:百万円)
当連結会計年度
(自 2025年4月1日
至 2026年3月31日)
24,831
40
796
△95
※1
741
26,486
503
973
440
1,917
26,749
26,214
271
― 84 ―
※1
26,586
162
③【連結株主資本等変動計算書】
前連結会計年度(自 2024年4月1日
至 2025年3月31日)
(単位:百万円)
株主資本
資本金
当期首残高
資本剰余金
利益剰余金
11,450
22,593
124,705
122
122
自己株式
△7,983
株主資本合計
150,765
当期変動額
新株の発行
245
剰余金の配当
△8,796
△8,796
親会社株主に帰属
する当期純利益
25,637
25,637
自己株式の取得
自己株式の処分
444
△1,383
△1,383
936
1,381
その他
-
株主資本以外の項目
の当期変動額(純
額)
-
当期変動額合計
当期末残高
122
567
16,841
△446
17,084
11,573
23,161
141,546
△8,430
167,850
退職給付
に係る
調整累計額
その他の
包括利益
累計額合計
新株予約権
非支配株主
持分
純資産合計
1,130
5,794
1,082
784
158,427
その他の包括利益累計額
その他
有価証券
評価差額金
当期首残高
989
為替換算
調整勘定
3,674
当期変動額
新株の発行
245
剰余金の配当
△8,796
親会社株主に帰属
する当期純利益
25,637
自己株式の取得
△1,383
自己株式の処分
1,381
その他
株主資本以外の項目
の当期変動額(純
額)
当期変動額合計
当期末残高
-
40
631
△95
576
△131
271
716
40
631
△95
576
△131
271
17,801
1,030
4,306
1,034
6,371
950
1,056
176,229
― 85 ―
当連結会計年度(自 2025年4月1日
至 2026年3月31日)
(単位:百万円)
株主資本
資本金
当期首残高
資本剰余金
利益剰余金
11,573
23,161
141,546
175
175
自己株式
株主資本合計
△8,430
167,850
当期変動額
新株の発行
剰余金の配当
親会社株主に帰属
する当期純利益
350
△10,177
△10,177
24,739
24,739
自己株式の取得
自己株式の処分
0
その他
△3
△3
71
71
△14
△14
株主資本以外の項目
の当期変動額(純
額)
当期変動額合計
当期末残高
-
175
175
14,547
67
14,965
11,748
23,336
156,094
△8,362
182,816
退職給付
に係る
調整累計額
その他の
包括利益
累計額合計
新株予約権
非支配株主
持分
純資産合計
1,034
6,371
950
1,056
176,229
その他の包括利益累計額
その他
有価証券
評価差額金
当期首残高
1,030
為替換算
調整勘定
4,306
当期変動額
新株の発行
350
剰余金の配当
△10,177
親会社株主に帰属
する当期純利益
24,739
自己株式の取得
△3
自己株式の処分
71
その他
株主資本以外の項目
の当期変動額(純
額)
当期変動額合計
当期末残高
△14
503
903
440
1,847
△288
162
1,721
503
903
440
1,847
△288
162
16,686
1,534
5,209
1,475
8,218
662
1,218
192,916
― 86 ―
④【連結キャッシュ・フロー計算書】
前連結会計年度
(自 2024年4月1日
至 2025年3月31日)
営業活動によるキャッシュ・フロー
税金等調整前当期純利益
減価償却費
のれん償却額
退職給付に係る負債の増減額(△は減少)
役員退職慰労引当金の増減額(△は減少)
貸倒引当金の増減額(△は減少)
受取利息及び受取配当金
支払利息
補助金収入
支払補償金
受取補償金
投資有価証券売却損益(△は益)
投資事業組合運用損益(△は益)
訴訟損失引当金の増減額(△は減少)
固定資産売却損益(△は益)
割増退職金
関係会社清算損
売上債権の増減額(△は増加)
棚卸資産の増減額(△は増加)
仕入債務の増減額(△は減少)
契約負債の増減額(△は減少)
製品不具合対策引当金の増減額(△は減少)
その他
小計
利息及び配当金の受取額
利息の支払額
補助金の受取額
割増退職金の支払額
補償金の受取額
法人税等の支払額
その他
営業活動によるキャッシュ・フロー
投資活動によるキャッシュ・フロー
定期預金の預入による支出
定期預金の払戻による収入
有形固定資産の取得による支出
有形固定資産の売却による収入
無形固定資産の取得による支出
投資有価証券の取得による支出
投資有価証券の売却による収入
関係会社株式の取得による支出
投資事業組合への出資による支出
投資事業組合からの分配による収入
貸付けによる支出
貸付金の回収による収入
敷金及び保証金の差入による支出
敷金及び保証金の回収による収入
その他
投資活動によるキャッシュ・フロー
― 87 ―
(単位:百万円)
当連結会計年度
(自 2025年4月1日
至 2026年3月31日)
34,275
5,105
49
△130
10
14
△322
202
△59
△220
△179
△66
△960
△4,303
117
40
3,033
△2,089
△958
△3,185
4,141
34,513
324
△192
59
△117
220
△5,942
△40
28,824
33,186
5,582
45
35
9
△81
△300
214
△89
67
△21
△191
△221
3
△7,093
1,939
△209
△548
1,688
1,555
35,572
300
△212
89
21
△10,758
25,012
△435
458
△9,574
12,017
△660
△3
647
△11
101
△0
0
△14
16
2,541
△31
35
△10,990
33
△643
△3
364
△500
△35
281
△0
1
△10
10
△4
△11,491
前連結会計年度
(自 2024年4月1日
至 2025年3月31日)
財務活動によるキャッシュ・フロー
長期借入金の返済による支出
リース債務の返済による支出
ストックオプションの行使による収入
配当金の支払額
自己株式の売却による収入
自己株式の取得による支出
財務活動によるキャッシュ・フロー
現金及び現金同等物に係る換算差額
現金及び現金同等物の増減額(△は減少)
現金及び現金同等物の期首残高
現金及び現金同等物の期末残高
△5,000
△317
124
△8,796
1,381
△1,383
△13,991
404
17,779
36,736
※1
54,516
― 88 ―
(単位:百万円)
当連結会計年度
(自 2025年4月1日
至 2026年3月31日)
△5,000
△559
65
△10,177
1
△3
△15,674
689
△1,463
54,516
※1
53,052
【注記事項】
(連結財務諸表作成のための基本となる重要な事項)
1.連結の範囲に関する事項
(1) 連結子会社の数
連結子会社の名称
16社
(株)東精エンジニアリング
(株)トーセーシステムズ
(株)アクレーテク・クリエイト
(株)東精ボックス
(株)アクレーテク・ファイナンス
ACCRETECH AMERICA INC.
ACCRETECH (EUROPE) GmbH
ACCRETECH KOREA CO., LTD.
東精精密設備(上海)有限公司
ACCRETECH TAIWAN CO., LTD.
ACCRETECH (MALAYSIA) SDN. BHD.
ACCRETECH ADAMAS (THAILAND) CO., LTD.
ACCRETECH (THAILAND) CO., LTD.
東精計量儀(平湖)有限公司
TOSEI (THAILAND) CO., LTD.
ACCRETECH SBS, INC.
(株)アクレーテク・パワトロシステムは会社清算したため、連結の範囲から除外しています。
(2) 非連結子会社の名称等
ACCRETECH (SINGAPORE) PTE. LTD.
ACCRETECH VIETNAM CO., LTD.
PT ACCRETECH INDONESIA
ACCRETECH-TOSEI DO BRASIL LTDA.
PT TOSEI INDONESIA
TOSEI PHILIPPINES CORPORATION
TOSEI ENGINEERING PRIVATE LIMITED
TOSEI MEXICO S.A.DE.C.V.
ACCRETECH-TOSEI HUNGARY KFT.
東精精密設備(平湖)有限公司
ACCRETECH-SBS UK LTD.
連結の範囲から除いた理由は、上記11社がいずれも小規模会社であり、合計の総資産、売上高、当期純損益(持
分に見合う額)及び利益剰余金(持分に見合う額)等の金額がいずれも僅少であり、連結財務諸表に重要な影響を及
ぼさないためです。
― 89 ―
2.持分法の適用に関する事項
(1) 持分法を適用した非連結子会社はありません。
持分法を適用していない非連結子会社については、それぞれの当期純損益(持分に見合う額)及び利益剰余金(持
分に見合う額)等の金額がいずれも僅少であり、連結財務諸表に重要な影響を及ぼさず、かつ全体としても重要性
がないため、これらの会社に対する投資については、持分法を適用せず原価法により評価しています。
(2) 持分法を適用した関連会社はありません。
持分法を適用していない関連会社については、当期純損益(持分に見合う額)及び利益剰余金(持分に見合う額)
等の金額がいずれも僅少であり、連結財務諸表に重要な影響を及ぼさず、かつ重要性がないため、当該会社に対
する投資については、持分法を適用せず原価法により評価しています。
3.連結子会社の事業年度等に関する事項
連結子会社のうち下記6社の期末決算日は12月31日であり、連結財務諸表の作成に当たっては、これら6社の期
末決算日である12月31日現在の財務諸表を使用し、連結決算日との間に生じた重要な取引については、連結上必要
な調整を行っています。
なお、その他の連結子会社の決算日は連結決算日と一致しています。
期末決算日が連結決算日と異なる連結子会社
東精精密設備(上海)有限公司
ACCRETECH ADAMAS (THAILAND) CO., LTD.
ACCRETECH (THAILAND) CO., LTD.
東精計量儀(平湖)有限公司
TOSEI (THAILAND) CO., LTD.
ACCRETECH SBS, INC.
4.会計方針に関する事項
(1) 重要な資産の評価基準及び評価方法
①
有価証券
(ⅰ) 子会社株式及び関連会社株式
移動平均法による原価法
(ⅱ) その他有価証券
市場価格のない株式等以外のもの
時価法(評価差額は全部純資産直入法により処理し、売却原価は移動平均法による原価法により算定)
市場価格のない株式等
移動平均法による原価法
②
棚卸資産
当社及び国内連結子会社は、通常の販売目的で保有する棚卸資産の評価基準及び評価方法については、主と
して総平均法による原価法(収益性の低下に基づく簿価切下げの方法)ですが、在外連結子会社においては先入
先出法による低価法を採用しています。
(2) 重要な減価償却資産の減価償却の方法
①
有形固定資産(リース資産を除く)
当社及び国内連結子会社は定率法を採用しています。ただし、1998年4月1日以降取得した建物(建物附属設
備は除く)並びに2016年4月1日以降取得した建物附属設備及び構築物については定額法を採用しています。
また、在外連結子会社においては定額法を採用しています。
主な耐用年数は以下のとおりです。
建物及び構築物
8年 ~ 50年
機械装置及び運搬具
4年 ~ 12年
― 90 ―
②
無形固定資産(リース資産を除く)
自社利用のソフトウエアについては社内における利用可能期間に基づく定額法、その他の無形固定資産につ
いても定額法を採用しています。
③
リース資産
所有権移転外ファイナンス・リース取引に係るリース資産については、リース期間を耐用年数とし、残存価
額を零とする定額法を採用しています。
(3) 重要な引当金の計上基準
①
貸倒引当金
債権の貸倒れの損失に備えるため、一般債権については貸倒実績率により、貸倒懸念債権等特定債権につい
ては個別に回収可能性を検討し、回収不能見込額を計上しています。
②
賞与引当金
当社及び国内連結子会社は、従業員に対する賞与の支払いに備えるため、支給見込額基準により計上してい
ます。
③
役員賞与引当金
国内連結子会社は、役員に対して支給する賞与の支出に充てるため、当連結会計年度における支給見込額に
基づき計上しています。
④
役員退職慰労引当金
国内連結子会社は、役員の退任時に支出が予測される役員退職慰労金の支払いに備えるため、内規に基づく
期末支払見込額を計上しています。
⑤
製品不具合対策引当金
一部製品において発生した不具合に対し、将来発生すると見込まれる対策費用を合理的に見積もり計上して
います。
(4) 退職給付に係る会計処理の方法
①
退職給付見込額の期間帰属方法
退職給付債務の算定にあたり、退職給付見込額を当連結会計年度末までの期間に帰属させる方法については、
給付算定式基準によっています。
②
数理計算上の差異及び過去勤務費用の処理方法
数理計算上の差異については、各連結会計年度の発生時における従業員の平均残存勤務期間以内の一定の年
数(10年)による按分額をそれぞれ発生の翌連結会計年度より費用処理し、過去勤務費用については、各連結会
計年度の発生時における従業員の平均残存勤務期間以内の一定の年数(10年)による按分額を費用処理していま
す。
(5) 重要な収益及び費用の計上基準
当社グループは、下記の5ステップアプローチに基づき、収益を認識しています。
ステップ1:顧客との契約の識別
ステップ2:契約における履行義務の識別
ステップ3:取引価格の算定
ステップ4:履行義務への取引価格の配分
ステップ5:履行義務充足による収益の認識
当社グループは、半導体製造装置事業において、ウェーハプロービングマシン、ウェーハダイシングマシン等
半導体製造工程で使用される加工・検査装置の販売、計測機器事業においては、三次元座標測定機、表面粗さ・
輪郭形状測定機等の精密測定機器類の販売を行っています。また、製品に関連した保証、修理・保守、移設等の
サービス業務を提供しています。
当社及び連結子会社の顧客との契約から生じる収益に関する主要な事業における主な履行義務の内容及び当該
履行義務を充足する通常の時点(収益を認識する通常の時点)は以下のとおりです。
(ⅰ)
製品の販売
製品の販売については、当該製品の支配が顧客に移転した時点で、当該製品と交換に受け取ると見込ま
れる金額で収益を認識しています。
顧客への製品の引渡の際に据付を要する製品については、製品を顧客に引き渡した後に、契約に基づく
― 91 ―
製品の仕様を満たした状態で顧客の指定する場所に製品の据付を完了した時点で、顧客が製品に対する支
配を獲得し、履行義務が充足されたと判断して収益を認識しています。
顧客への製品の引渡の際に据付を要しない製品は、国内販売においては、出荷時から製品の支配が顧客
に移転される時までの期間が通常の期間である場合、出荷時に収益を認識しています。
なお、顧客との契約に基づき製品販売に一定期間のワランティサービスが含まれている場合は、製品の
引き渡しによる履行義務と当該サービスによる履行義務を識別し、それぞれの履行義務を充足した時点で
収益を認識しています。
(ⅱ)
サービスの提供
有償サービス業務については、履行義務が一時点で充足される場合にはサービス提供完了時点において
収益を認識しています。
製品保守の履行義務を一定期間負う契約の場合には、保守契約期間に応じて均等按分し、収益を認識し
ています。
また、収益は、取引の対価は契約金額に基づいて測定しており、主に受注時から履行義務を充足するまでの期
間に前受金の受領、または履行義務充足後の支払を要求しています。顧客に支払われる売上リベート等がある場
合、取引価格から控除しています。なお、履行義務充足後の支払いは、履行義務の充足時点から主に1年以内に
受領しており、長期にわたるものはないため、重要な金融要素は含んでいません。
(6) 重要な外貨建の資産又は負債の本邦通貨への換算の基準
外貨建金銭債権債務は、連結決算日の直物為替相場により円貨に換算し、換算差額は損益として処理していま
す。なお、在外連結子会社等の資産・負債は決算日の直物為替相場により円貨に換算し、収益及び費用は期中平
均相場により円貨に換算し、換算差額は純資産の部における為替換算調整勘定及び非支配株主持分に含めていま
す。
(7) のれんの償却方法及び償却期間
のれんの償却については、その個別案件ごとに判断し、合理的な年数(10年)で償却しています。
(8) 連結キャッシュ・フロー計算書における資金の範囲
連結キャッシュ・フロー計算書における資金(現金及び現金同等物)は、手許現金、随時引き出し可能な預金及
び容易に換金可能であり、かつ価値の変動について僅少なリスクしか負わない取得日から3ヶ月以内に償還期限
の到来する短期投資からなっています。
(9) その他連結財務諸表作成のための重要な事項
①
資産に係る控除対象外消費税等の会計処理
資産に係る控除対象外消費税及び地方消費税は当連結会計年度の費用として処理しています。
②
グループ通算制度の適用
グループ通算制度を適用しています。
(重要な会計上の見積り)
該当事項はありません。
― 92 ―
(未適用の会計基準等)
(リースに関する会計基準等)
・「リースに関する会計基準」(企業会計基準第34号
2024年9月13日
企業会計基準委員会)
・「リースに関する会計基準の適用指針」(企業会計基準適用指針第33号
2024年9月13日
企業会計基準委員
会)等
(1) 概要
企業会計基準委員会において、日本基準を国際的に整合性あるものとする取組みの一環として、借手の全ての
リースについて資産及び負債を認識するリースに関する会計基準の開発に向けて、国際的な会計基準を踏まえた
検討が行われ、基本的な方針として、IFRS第16号の単一の会計処理モデルを基礎とするものの、IFRS第16号の全
ての定めを採り入れるのではなく、主要な定めのみを採り入れることにより、簡素で利便性が高く、かつ、IFRS
第16号の定めを個別財務諸表に用いても、基本的に修正が不要となることを目指したリース会計基準等が公表さ
れました。
借手の会計処理として、借手のリースの費用配分の方法については、IFRS第16号と同様に、リースがファイナ
ンス・リースであるかオペレーティング・リースであるかにかかわらず、全てのリースについて使用権資産に係
る減価償却費及びリース負債に係る利息相当額を計上する単一の会計処理モデルが適用されます。
(2) 適用予定日
2028年3月期の期首より適用予定です。
(3) 当該会計基準等の適用による影響
「リースに関する会計基準」等の適用による連結財務諸表に与える影響額については、現時点で評価中です。
(後発事象に関する会計基準等)
・「後発事象に関する会計基準」(企業会計基準第41号
2026年1月9日
・「後発事象に関する会計基準の適用指針」(企業会計基準第35号
企業会計基準委員会)
2026年1月9日
企業会計基準委員会)
(1) 概要
「後発事象に関する会計基準」等は、後発事象の定義、会計処理及び開示等を取り扱う包括的な会計基準を設
定することを優先的な課題とし、日本公認会計士協会
監査・保証基準委員会
監査基準報告書560実務指針第1
号「後発事象に関する会計基準」で示されている会計に関する内容を原則として踏襲して企業会計基準委員会に
移管することを基本的な方針として、表現の見直し及び後発事象の評価期間の整理を行うとともに、財務諸表の
公表の承認に関する注記を新たに求める等、後発事象に関する会計処理及び開示について定めたものです。
(2) 適用予定日
2028年3月期の期首より適用予定です。
(追加情報)
(取締役等に信託を通じて自社の株式を交付する取引)
当社は、当社の取締役(監査等委員である取締役及び社外取締役を除く)及び執行役員並びに当社の指定する子
会社及び関連会社の一部の取締役(社外取締役を除く)及び執行役員を対象に、取締役等の報酬と当社の業績及び
株式価値との連動性をより明確にし、株価上昇によるメリットのみならず、株価下落リスクまでも株主の皆様と
共有することで、中長期的な業績の向上と企業価値の増大に貢献する意識を高めることを目的として、業績連動
型株式報酬制度「株式給付信託(BBT(Board Benefit Trust))」を導入しています。本制度に関する会計処理に
ついては、「従業員等に信託を通じて自社の株式を交付する取引に関する実務上の取扱い」(実務対応報告第30号
2015年3月26日)に準じています。
(1) 取引の概要
本制度は、当社が拠出する金銭を原資として当社株式が信託(以下、本制度に基づき設定される信託を「本信
託」といいます。)を通じて取得され、対象役員に対して、当社が定める役員株式給付規程に従って、当社株式
及び当社株式を時価で換算した金額相当の金銭(以下「当社株式等」といいます。)が本信託を通じて給付され
る業績連動型株式報酬制度です。
なお、本制度においては、「第1給付」及び「第2給付」の2種類の給付を行うこととし、対象役員が当社株
― 93 ―
式等の給付を受ける時期は、第1給付については原則として対象役員の退任時となり、第2給付については原則
として毎年一定の時期となります。
(2) 信託に残存する自社の株式
信託に残存する当社株式を、当該信託における帳簿価額(付随費用の金額を除く。)により、純資産の部に自
己株式として計上しています。当該自己株式の帳簿価額及び株式数は、前連結会計年度末1,381百万円、200,000
株、当連結会計年度末1,310百万円、189,700株です。
(連結貸借対照表関係)
※1
受取手形、売掛金及び契約資産のうち、顧客との契約から生じた債権及び契約資産の金額は、連結財務諸表「注
記事項(収益認識関係)3.(1) 契約資産及び契約負債の残高等」に記載しています。
※2
非連結子会社及び関連会社に対するもの
投資有価証券
前連結会計年度
(2025年3月31日)
457百万円
当連結会計年度
(2026年3月31日)
957百万円
183百万円
183百万円
その他の投資その他の資産(出資金)
(連結損益計算書関係)
※1
顧客との契約から生じる収益
売上高については、顧客との契約から生じる収益及びそれ以外の収益を区分して記載していません。顧客との契
約から生じる収益の金額は、連結財務諸表「注記事項(収益認識関係) 1.顧客との契約から生じる収益を分解し
た情報」に記載しています。
※2
通常の販売目的で保有する棚卸資産の収益性低下による簿価切下額
前連結会計年度
(自 2024年4月1日
至 2025年3月31日)
売上原価
※3
431百万円
当連結会計年度
2025年4月1日
2026年3月31日)
791百万円
販売費及び一般管理費の主要な費目及び金額
前連結会計年度
2024年4月1日
2025年3月31日)
(自
至
※4
(自
至
(自
至
当連結会計年度
2025年4月1日
2026年3月31日)
研究開発費
10,354百万円
12,037百万円
従業員給料手当
6,731百万円
6,971百万円
賞与引当金繰入額
1,672百万円
2,545百万円
役員退職慰労引当金繰入額
10百万円
9百万円
役員賞与引当金繰入額
21百万円
21百万円
退職給付費用
31百万円
47百万円
貸倒引当金繰入額
19百万円
△21百万円
一般管理費及び当期製造費用に含まれている研究開発費
前連結会計年度
(自 2024年4月1日
至 2025年3月31日)
研究開発費
10,354百万円
― 94 ―
(自
至
当連結会計年度
2025年4月1日
2026年3月31日)
12,037百万円
※5
固定資産売却益
前連結会計年度(自
2024年4月1日
至
2025年3月31日)
当社における日野工場用地の売却により発生したものです。
当連結会計年度(自
2025年4月1日
至
2026年3月31日)
至
2025年3月31日)
該当事項はありません。
※6
割増退職金
前連結会計年度(自
2024年4月1日
非連結子会社であった悌艾斯意技術発展(上海)有限公司の清算により発生したものです。
当連結会計年度(自
2025年4月1日
至
2026年3月31日)
至
2025年3月31日)
該当事項はありません。
※7
関係会社清算損
前連結会計年度(自
2024年4月1日
主に非連結子会社であった悌艾斯意技術発展(上海)有限公司の清算により発生したものです。
当連結会計年度(自
2025年4月1日
至
2026年3月31日)
至
2025年3月31日)
至
2026年3月31日)
該当事項はありません。
※8
製品不具合対策費
前連結会計年度(自
2024年4月1日
該当事項はありません。
当連結会計年度(自
2025年4月1日
半導体製造装置の一部製品において確認された不具合の対策費用として計上したものです。
― 95 ―
(連結包括利益計算書関係)
※1
その他の包括利益に係る組替調整額並びに法人税等及び税効果額
前連結会計年度
2024年4月1日
2025年3月31日)
当連結会計年度
2025年4月1日
2026年3月31日)
(自
至
(自
至
その他有価証券評価差額金
当期発生額
305百万円
1,167百万円
組替調整額
△246百万円
△412百万円
法人税等及び税効果調整前
法人税等及び税効果額
58百万円
755百万円
△17百万円
△251百万円
40百万円
503百万円
796百万円
973百万円
その他有価証券評価差額金
為替換算調整勘定
当期発生額
組替調整額
法人税等及び税効果調整前
-
-
796百万円
973百万円
法人税等及び税効果額
-
-
為替換算調整勘定
796百万円
973百万円
退職給付に係る調整額
当期発生額
組替調整額
127百万円
△249百万円
858百万円
△214百万円
△122百万円
26百万円
△95百万円
644百万円
△204百万円
440百万円
741百万円
1,917百万円
法人税等及び税効果調整前
法人税等及び税効果額
退職給付に係る調整額
その他の包括利益合計
(連結株主資本等変動計算書関係)
前連結会計年度(自
2024年4月1日
至
2025年3月31日)
1.発行済株式に関する事項
株式の種類
当連結会計年度期首
普通株式(株)
増加
42,104,381
減少
65,700
当連結会計年度末
-
42,170,081
(注) 増加数65,700株は、ストック・オプションの新株予約権の権利行使によるものです。
2.自己株式に関する事項
株式の種類
普通株式(株)
当連結会計年度期首
1,705,058
増加
減少
200,231
当連結会計年度末
200,000
1,705,289
(注)1.増加数200,231株は、業績連動型株式報酬制度「株式給付信託(BBT(Board Benefit Trust))」による取得
200,000株、単元未満株式の買取231株によるものです。減少数200,000株は業績連動型株式報酬制度「株式給付
信託(BBT(Board Benefit Trust))」による自己株式の処分200,000株によるものです。
2.当連結会計年度末の自己株式数には、業績連動型株式報酬制度「株式給付信託(BBT(Board Benefit Trust))」
の信託財産として㈱日本カストディ銀行が保有する当社株式200,000株が含まれています。
― 96 ―
3.新株予約権等に関する事項
会社名
提出会社
内訳
第15回新株予約権
(ストック・オプション)
(2018年発行)
第16回新株予約権
(ストック・オプション)
(2019年発行)
第17回新株予約権
(ストック・オプション)
(2020年発行)
2006年7月発行
新株予約権
(株式報酬型ストック・
オプション)
2007年7月発行
新株予約権
(株式報酬型ストック・
オプション)
2011年7月発行
新株予約権
(株式報酬型ストック・
オプション)
2012年7月発行
新株予約権
(株式報酬型ストック・
オプション)
2013年7月発行
新株予約権
(株式報酬型ストック・
オプション)
2014年7月発行
新株予約権
(株式報酬型ストック・
オプション)
2015年7月発行
新株予約権
(株式報酬型ストック・
オプション)
2016年7月発行
新株予約権
(株式報酬型ストック・
オプション)
2017年7月発行
新株予約権
(株式報酬型ストック・
オプション)
2018年7月発行
新株予約権
(株式報酬型ストック・
オプション)
目的となる
株式の種類当連結会計
年度期首
目的となる株式の数(株)
増加
減少
当連結会計
年度末残高
当連結会計 (百万円)
年度末
-
-
4
-
-
6
-
-
22
-
-
10
-
-
9
-
-
15
-
-
10
-
-
24
-
-
24
-
-
43
-
-
43
-
-
82
-
-
74
― 97 ―
会社名
提出会社
目的となる
株式の種類当連結会計
年度期首
内訳
2019年8月発行
新株予約権
(株式報酬型ストック・
オプション)
2020年7月発行
新株予約権
(株式報酬型ストック・
オプション)
2021年7月発行
新株予約権
(株式報酬型ストック・
オプション)
2022年7月発行
新株予約権
(株式報酬型ストック・
オプション)
2023年7月発行
新株予約権
(株式報酬型ストック・
オプション)
合計
目的となる株式の数(株)
増加
減少
当連結会計
年度末残高
当連結会計 (百万円)
年度末
-
-
59
-
-
86
-
-
114
-
-
92
-
-
224
-
-
950
4.配当に関する事項
(1) 配当金支払額
決議
配当金の総額
(百万円)
株式の種類
1株当たり配当額
(円)
基準日
効力発生日
2024年6月21日
普通株式
4,161
103.00 2024年3月31日
2024年6月24日
定時株主総会
2024年11月1日
普通株式
4,634
114.00 2024年9月30日
2024年12月9日
取締役会
(注)2024年11月1日開催取締役会で決議した配当金の総額には、信託が保有する自社の株式に対する配当金22百万円
が含まれています。
(2) 基準日が当連結会計年度に属する配当のうち、配当の効力発生日が翌連結会計年度となるもの
配当金の総額 1株当たり
決議
株式の種類
配当の原資
基準日
効力発生日
(百万円)
配当額(円)
2025年6月23日
普通株式
利益剰余金
5,652
139.00 2025年3月31日 2025年6月24日
定時株主総会
(注)2025年6月23日開催定時株主総会で決議した配当金の総額には、信託が保有する自社の株式に対する配当金27百
万円が含まれています。
当連結会計年度(自
2025年4月1日
至
2026年3月31日)
1.発行済株式に関する事項
株式の種類
当連結会計年度期首
普通株式(株)
増加
42,170,081
減少
112,800
当連結会計年度末
-
42,282,881
(注) 増加数112,800株は、ストック・オプションの新株予約権の権利行使によるものです。
2.自己株式に関する事項
株式の種類
普通株式(株)
当連結会計年度期首
増加
1,705,289
減少
297
当連結会計年度末
10,300
1,695,286
(注)1.増加数297株は、単元未満株式によるものです。減少数10,300株は業績連動型株式報酬制度「株式給付信託
(BBT(Board Benefit Trust))」による自己株式の処分によるものです。
2.業績連動型株式報酬制度「株式給付信託(BBT(Board Benefit Trust))」の信託財産として㈱日本カストディ銀
行が保有する当社株式が前連結会計年度末200,000株、当連結会計年度末189,700株自己株式数に含まれていま
す。
― 98 ―
3.新株予約権等に関する事項
会社名
提出会社
内訳
第16回新株予約権
(ストック・オプション)
(2019年発行)
第17回新株予約権
(ストック・オプション)
(2020年発行)
2006年7月発行
新株予約権
(株式報酬型ストック・
オプション)
2007年7月発行
新株予約権
(株式報酬型ストック・
オプション)
2011年7月発行
新株予約権
(株式報酬型ストック・
オプション)
2012年7月発行
新株予約権
(株式報酬型ストック・
オプション)
2013年7月発行
新株予約権
(株式報酬型ストック・
オプション)
2014年7月発行
新株予約権
(株式報酬型ストック・
オプション)
2015年7月発行
新株予約権
(株式報酬型ストック・
オプション)
2016年7月発行
新株予約権
(株式報酬型ストック・
オプション)
2017年7月発行
新株予約権
(株式報酬型ストック・
オプション)
2018年7月発行
新株予約権
(株式報酬型ストック・
オプション)
目的となる
株式の種類当連結会計
年度期首
目的となる株式の数(株)
増加
減少
当連結会計
年度末残高
当連結会計 (百万円)
年度末
-
-
3
-
-
11
-
-
10
-
-
9
-
-
11
-
-
8
-
-
18
-
-
19
-
-
34
-
-
33
-
-
56
-
-
50
― 99 ―
会社名
提出会社
目的となる
株式の種類当連結会計
年度期首
内訳
2019年8月発行
新株予約権
(株式報酬型ストック・
オプション)
2020年7月発行
新株予約権
(株式報酬型ストック・
オプション)
2021年7月発行
新株予約権
(株式報酬型ストック・
オプション)
2022年7月発行
新株予約権
(株式報酬型ストック・
オプション)
2023年7月発行
新株予約権
(株式報酬型ストック・
オプション)
合計
目的となる株式の数(株)
増加
減少
当連結会計
年度末残高
当連結会計 (百万円)
年度末
-
-
41
-
-
60
-
-
72
-
-
57
-
-
162
-
-
662
4.配当に関する事項
(1) 配当金支払額
決議
2025年6月23日
定時株主総会
2025年11月4日
取締役会
配当金の総額
(百万円)
株式の種類
1株当たり配当額
(円)
基準日
効力発生日
普通株式
5,652
139.00
2025年3月31日
2025年6月24日
普通株式
4,525
111.00
2025年9月30日
2025年12月8日
(注)1.2025年6月23日開催定時株主総会で決議した配当金の総額には、信託が保有する自社の株式に対する配当金
27百万円が含まれています。
2.2025年11月4日開催取締役会で決議した配当金の総額には、信託が保有する自社の株式に対する配当金21百
万円が含まれています。
(2) 基準日が当連結会計年度に属する配当のうち、配当の効力発生日が翌連結会計年度となるもの
2026年6月22日開催の定時株主総会の議案として、次のとおり付議する予定です。
決議
株式の種類
配当の原資
配当金の総額
(百万円)
1株当たり
配当額(円)
基準日
効力発生日
2026年6月22日
普通株式
利益剰余金
6,157
151.00 2026年3月31日 2026年6月23日
定時株主総会
(注)2026年6月22日開催定時株主総会決議に付議する予定の配当金の総額には、信託が保有する自社の株式に対する
配当金28百万円が含まれています。
(連結キャッシュ・フロー計算書関係)
※1
現金及び現金同等物の期末残高と連結貸借対照表に掲記されている科目の金額との関係
現金及び預金勘定
預入期間が3か月を超える定期預金
現金及び現金同等物
前連結会計年度
(自 2024年4月1日
至 2025年3月31日)
54,541百万円
△25百万円
54,516百万円
― 100 ―
当連結会計年度
(自 2025年4月1日
至 2026年3月31日)
53,073百万円
△21百万円
53,052百万円
(リース取引関係)
1.ファイナンス・リース取引
(借主側)
所有権移転外ファイナンス・リース取引
①
リース資産の内容
②
リース資産の減価償却の方法
主として、車両及び半導体製造装置事業における生産設備(器具備品)です。
連結財務諸表作成のための基本となる重要な事項「4.会計方針に関する事項
(2) 重要な減価償却資産の減価
償却の方法」に記載のとおりです。
2.オペレーティング・リース取引
(借主側)
オペレーティング・リース取引のうち解約不能のものに係る未経過リース料
前連結会計年度
(2025年3月31日)
19百万円
当連結会計年度
(2026年3月31日)
19百万円
1年超
441百万円
422百万円
合計
460百万円
441百万円
1年以内
(金融商品関係)
1.金融商品の状況に関する事項
(1) 金融商品に対する取組方針
当社グループは半導体製造装置及び計測機器の製造販売事業を行うための設備投資計画に基づき、所要の長期的
資金は自己資金の他、主として銀行借入により調達する方針としています。短期的な運転資金は銀行借入により調
達し、一時的な余裕資金は安全性の高い金融資産で運用する方針としています。
デリバティブ取引はリスク回避の手段としてのみ利用し、投機的な取引は行わない方針をとっています。
(2) 金融商品の内容及びそのリスク
営業債権である受取手形及び売掛金、電子記録債権は顧客の信用リスクに晒されており、グローバルに事業を展
開していることから生じている外貨建ての営業債権は、為替の変動リスクにも晒されています。投資有価証券は取
引先企業との業務又は資本提携等に関連する株式であり、市場価格の変動リスクに晒されています。
営業債務である支払手形及び買掛金、電子記録債務は1年以内に支払期日の到来するものがほとんどです。借入
金、リース債務等の有利子負債のうちの一部は変動金利であるため金利の変動リスクに晒されています。
(3) 金融商品に係るリスク管理体制
①
信用リスク(取引先の契約不履行等に係るリスク)の管理
当社では、債権管理に関する諸規程に従い、経理部門と営業部門が協同で主要な取引先ごとの期日並びに残高
等の債権管理を行うとともに、取引先の財務状況の悪化等による回収懸念の早期把握やその軽減に努めていま
す。連結子会社についても当社と同様の管理を行っています。
②
市場リスク(為替や金利等の変動リスク)の管理
当社では、投資有価証券について定期的に時価や発行体の財務状況等を把握するとともに、保有状況について
も発行体との取引関係を勘案して、必要に応じた見直しを行っています。
③
資金調達に係る流動性リスク(支払期日に支払いを実行できなくなるリスク)の管理
当社では、受注、生産、販売等に関する業務計画に基づき経理室が適時に資金繰り計画を作成・更新すること
を通じて、手元流動性を適正水準に維持することに努め、流動性リスクの管理を図っています。また、連結子会
社についても当社と同様の管理を行っています。
(4) 金融商品の時価等に関する事項についての補足説明
金融商品の時価の算定においては変動要因を織り込んでいるため、異なる前提条件等を採用することにより、当
該価額が変動することもあります。
― 101 ―
2.金融商品の時価等に関する事項
連結貸借対照表計上額、時価及びこれらの差額については、次のとおりです。
前連結会計年度(2025年3月31日)
(単位:百万円)
連結貸借対照表
計上額
時価
差額
(1)投資有価証券
その他有価証券
(2)長期借入金(1年内返済予定分を含む)
2,677
2,677
-
18,000
17,981
△19
(注)1.「現金及び預金」「受取手形及び売掛金」「電子記録債権」「支払手形及び買掛金」「電子記録債務」「短
期借入金」については、現金であること、及び短期間で決済されるため時価が帳簿価額に近似するものである
ことから、記載を省略しています。
(注)2.市場価格のない株式等は「(1)投資有価証券」には含まれていません。当該金融商品の連結貸借対照表計上額
は以下のとおりです。
(単位:百万円)
区分
2025年3月31日
投資有価証券(非上場株式)
457
投資事業組合等への出資金
111
(注)3.金銭債権の連結決算日後の償還予定額
(単位:百万円)
1年超
5年以内
1年以内
受取手形
5年超
10年以内
10年超
153
-
-
-
売掛金
32,968
-
-
-
電子記録債権
6,687
-
-
-
合計
39,809
-
-
-
3年超
4年以内
(単位:百万円)
4年超
5年以内
(注)4.短期借入金及び長期借入金の連結決算日後の返済予定額
1年以内
1年超
2年以内
2年超
3年以内
短期借入金
1,300
-
-
-
-
長期借入金
5,000
5,000
5,000
3,000
-
合計
6,300
5,000
5,000
3,000
-
― 102 ―
当連結会計年度(2026年3月31日)
(単位:百万円)
連結貸借対照表
計上額
時価
差額
(1)投資有価証券
その他有価証券
(2)長期借入金(1年内返済予定分を含む)
3,270
3,270
-
13,000
12,806
△193
(注)1.「現金及び預金」「受取手形及び売掛金」「電子記録債権」「支払手形及び買掛金」「電子記録債務」「短
期借入金」については、現金であること、及び短期間で決済されるため時価が帳簿価額に近似するものである
ことから、記載を省略しています。
(注)2.市場価格のない株式等は「(1)投資有価証券」には含まれていません。当該金融商品の連結貸借対照表計上額
は以下のとおりです。
(単位:百万円)
区分
2026年3月31日
投資有価証券(非上場株式)
957
投資事業組合等への出資金
79
(注)3.金銭債権の連結決算日後の償還予定額
(単位:百万円)
1年超
5年以内
1年以内
受取手形
5年超
10年以内
10年超
6
-
-
-
売掛金
42,228
-
-
-
電子記録債権
5,353
-
-
-
合計
47,587
-
-
-
3年超
4年以内
(単位:百万円)
4年超
5年以内
(注)4.短期借入金及び長期借入金の連結決算日後の返済予定額
1年以内
1年超
2年以内
2年超
3年以内
短期借入金
1,300
-
-
-
-
長期借入金
5,000
5,000
3,000
-
-
合計
6,300
5,000
3,000
-
-
3.金融商品の時価のレベルごとの内訳等に関する事項
金融商品の時価を、時価の算定に係るインプットの観察可能性及び重要性に応じて、以下の3つのレベルに分類
しています。
レベル1の時価:観察可能な時価の算定に係るインプットのうち、同一の資産又は負債の活発な市場における
(無調整の)相場価格により算定した時価
レベル2の時価:観察可能な時価の算定に係るインプットのうち、レベル1のインプット以外の直接又は間接的
に観察可能なインプットを用いて算定した時価
レベル3の時価:重要な観察できないインプットを使用して算定した時価
時価の算定に重要な影響を与えるインプットを複数使用している場合には、それらのインプットがそれぞれ属す
るレベルのうち、時価の算定における優先順位が最も低いレベルに時価を分類しています。
― 103 ―
(1) 時価で連結貸借対照表に計上している金融商品
前連結会計年度(2025年3月31日)
時価(百万円)
区分
レベル1
レベル2
レベル3
合計
投資有価証券
その他有価証券
株式
資産計
2,677
-
-
2,677
2,677
-
-
2,677
当連結会計年度(2026年3月31日)
時価(百万円)
区分
レベル1
レベル2
レベル3
合計
投資有価証券
その他有価証券
株式
資産計
3,270
-
-
3,270
3,270
-
-
3,270
(2) 時価で連結貸借対照表に計上している金融商品以外の金融商品
前連結会計年度(2025年3月31日)
時価(百万円)
区分
レベル1
長期借入金(1年内返済予定分を含む)
負債計
レベル2
レベル3
合計
-
17,981
-
17,981
-
17,981
-
17,981
当連結会計年度(2026年3月31日)
時価(百万円)
区分
レベル1
長期借入金(1年内返済予定分を含む)
負債計
レベル2
レベル3
合計
-
12,806
-
12,806
-
12,806
-
12,806
(注) 時価の算定に用いた評価技法及び時価の算定に係るインプットの説明
投資有価証券
上場株式は相場価格を用いて評価しています。上場株式は活発な市場で取引されているため、その時価をレ
ベル1の時価に分類しています。一方で、上場株式以外の株式は、市場での取引頻度が低く、活発な市場にお
ける相場価格とは認められないため、その時価をレベル2の時価に分類しています。
長期借入金
元利金の合計額と当該債務の残存期間及び信用リスクを加味した利率を基に、割引現在価値法により算定し
ており、レベル2の時価に分類しています。
― 104 ―
(有価証券関係)
1.その他有価証券
前連結会計年度(2025年3月31日)
区分
連結貸借対照表計上額
(単位:百万円)
差額
取得原価
連結貸借対照表計上額が取得
原価を超えるもの
株式
小計
2,670
1,145
1,524
2,670
1,145
1,524
7
7
△0
連結貸借対照表計上額が取得
原価を超えないもの
株式
小計
7
7
△0
合計
2,677
1,152
1,524
当連結会計年度(2026年3月31日)
区分
連結貸借対照表計上額
(単位:百万円)
差額
取得原価
連結貸借対照表計上額が取得
原価を超えるもの
株式
小計
3,270
981
2,288
3,270
981
2,288
連結貸借対照表計上額が取得
原価を超えないもの
株式
-
-
-
小計
-
-
-
合計
3,270
981
2,288
2.連結会計年度中に売却したその他有価証券
前連結会計年度(自
2024年4月1日
区分
至
2025年3月31日)
売却額
(単位:百万円)
売却損の合計額
売却益の合計額
株式
647
179
-
その他
101
66
-
749
246
-
合計
当連結会計年度(自
2025年4月1日
区分
至
2026年3月31日)
売却額
(単位:百万円)
売却損の合計額
売却益の合計額
株式
365
191
-
その他
281
221
0
646
412
0
合計
3.減損処理を行った有価証券
前連結会計年度(自
2024年4月1日
至
2025年3月31日)
至
2026年3月31日)
該当事項はありません。
当連結会計年度(自
2025年4月1日
該当事項はありません。
― 105 ―
(退職給付関係)
1.採用している退職給付制度の概要
当社は積立型の退職一時金制度及び積立型の確定給付企業年金制度並びに確定拠出企業年金制度を設けており、退
職一時金制度には退職給付信託を設定しています。
国内連結子会社は非積立型の退職一時金制度を設けており、一部の国内および在外連結子会社は、積立型の確定給
付企業年金制度又は確定拠出企業年金制度も設けています。
なお、国内連結子会社が有する退職一時金制度及び確定給付企業年金制度は、原則法及び簡便法(退職給付に係る期
末自己都合要支給額を退職給付債務とする方法)により退職給付に係る負債及び退職給付費用を計算しています。
2.確定給付制度(簡便法を適用した制度を除く。)
(1) 退職給付債務の期首残高と期末残高の調整表
退職給付債務の期首残高
前連結会計年度
(自 2024年4月1日
至 2025年3月31日)
5,587
(単位:百万円)
当連結会計年度
(自 2025年4月1日
至 2026年3月31日)
5,248
500
478
勤務費用
利息費用
34
51
数理計算上の差異の発生額
△175
△665
退職給付の支払額
△697
△355
退職給付債務の期末残高
5,248
4,757
前連結会計年度
(自 2024年4月1日
至 2025年3月31日)
7,503
(単位:百万円)
当連結会計年度
(自 2025年4月1日
至 2026年3月31日)
7,507
64
63
数理計算上の差異の発生額
△47
193
事業主からの拠出額
184
191
退職給付の支払額
△196
△183
年金資産の期末残高
7,507
7,772
(2) 年金資産の期首残高と期末残高の調整表
年金資産の期首残高
期待運用収益
(3) 退職給付債務及び年金資産の期末残高と連結貸借対照表に計上された退職給付に係る負債及び退職給付に係る資
産の調整表
前連結会計年度
(2025年3月31日)
4,539
(単位:百万円)
当連結会計年度
(2026年3月31日)
4,054
△7,507
△7,772
△2,968
△3,718
709
703
△2,258
△3,014
退職給付に係る負債
678
640
退職給付に係る資産
△2,936
△3,655
連結貸借対照表に計上された負債と資産の純額
△2,258
△3,014
積立型制度の退職給付債務
年金資産
非積立型制度の退職給付債務
連結貸借対照表に計上された負債と資産の純額
― 106 ―
(4) 退職給付費用及びその内訳項目の金額
勤務費用
前連結会計年度
(自 2024年4月1日
至 2025年3月31日)
500
(単位:百万円)
当連結会計年度
(自 2025年4月1日
至 2026年3月31日)
478
利息費用
34
51
期待運用収益
△64
△63
数理計算上の差異の費用処理額
△249
△214
確定給付制度に係る退職給付費用
220
252
(5) 退職給付に係る調整額
退職給付に係る調整額に計上した項目(法人税等及び税効果控除前)の内訳は次のとおりです。
(単位:百万円)
前連結会計年度
当連結会計年度
(自 2024年4月1日
(自 2025年4月1日
至 2025年3月31日)
至 2026年3月31日)
数理計算上の差異
△122
644
合計
△122
644
(6) 退職給付に係る調整累計額
退職給付に係る調整累計額に計上した項目(法人税等及び税効果控除前)の内訳は次のとおりです。
(単位:百万円)
前連結会計年度
当連結会計年度
(2025年3月31日)
(2026年3月31日)
未認識数理計算上の差異
1,507
2,151
合計
1,507
2,151
(7) 年金資産に関する事項
①
年金資産の主な内訳
年金資産合計に対する主な分類ごとの比率は、次のとおりです。
前連結会計年度
(2025年3月31日)
預金
62%
当連結会計年度
(2026年3月31日)
60%
株式
12%
13%
一般勘定
16%
18%
債券
6%
5%
その他
4%
4%
合計
100%
100%
(注) 年金資産合計には、企業年金制度に対して設定した退職給付信託が前連結会計年度64%、当連結会計年度
63%含まれています。
②
長期期待運用収益率の設定方法
年金資産の長期期待運用収益率を決定するため、現在及び予想される年金資産の配分と、年金資産を構成する
多様な資産からの現在及び将来期待される長期の収益率を考慮しています。
― 107 ―
(8) 数理計算上の計算基礎に関する事項
前連結会計年度
(自 2024年4月1日
至 2025年3月31日)
0.8%
割引率
当連結会計年度
(自 2025年4月1日
至 2026年3月31日)
2.4%
長期期待運用収益率
年金資産
2.5%
2.5%
退職給付信託
0.0%
0.0%
0.1%~3.6%
0.1%~3.6%
予想昇給率
3.簡便法を適用した確定給付制度
(1) 簡便法を適用した制度の、退職給付に係る負債の期首残高と期末残高の調整表
退職給付に係る負債の期首残高
前連結会計年度
(自 2024年4月1日
至 2025年3月31日)
125
(単位:百万円)
当連結会計年度
(自 2025年4月1日
至 2026年3月31日)
133
21
24
△13
△15
133
142
退職給付費用
退職給付の支払額
退職給付に係る負債の期末残高
(2) 退職給付債務及び年金資産の期末残高と連結貸借対照表に計上された退職給付に係る負債及び退職給付に係る資
産の調整表
非積立型制度の退職給付債務
133
(単位:百万円)
当連結会計年度
(2026年3月31日)
142
連結貸借対照表に計上された負債と資産の純額
133
142
退職給付に係る負債
133
142
連結貸借対照表に計上された負債と資産の純額
133
142
前連結会計年度
(自 2024年4月1日
至 2025年3月31日)
21
(単位:百万円)
当連結会計年度
(自 2025年4月1日
至 2026年3月31日)
24
前連結会計年度
(自 2024年4月1日
至 2025年3月31日)
225
(単位:百万円)
当連結会計年度
(自 2025年4月1日
至 2026年3月31日)
243
前連結会計年度
(2025年3月31日)
(3) 退職給付費用
簡便法で計算した退職給付費用
4.確定拠出制度
当社及び連結子会社の確定拠出制度への要拠出額
― 108 ―
(ストック・オプション等関係)
(ストック・オプション)
1.ストック・オプションにかかる費用計上額及び科目名
該当事項はありません。
2.権利不行使による失効により利益に計上した金額及び科目名
科目名
前連結会計年度
(自 2024年4月1日
至 2025年3月31日)
(単位:百万円)
当連結会計年度
(自 2025年4月1日
至 2026年3月31日)
10
3
新株予約権戻入益(特別利益)
― 109 ―
3.ストック・オプションの内容、規模及びその変動状況
提出会社
(1) ストック・オプションの内容
第15回新株予約権
付与対象者の区分及び人数(名)
当社取締役
当社使用人
子会社取締役
子会社使用人
8
183
8
18
株式の種類別のストック・オプショ
ンの数(株)
普通株式
付与日
2018年7月23日
権利確定条件
権利行使時点において、当社又は当社の子会社又は関連会社の取締役、監
査役又は使用人のいずれの地位をも喪失していないこと。
ただし、取締役又は監査役の任期満了による退任、定年又は会社都合によ
る使用人の地位の喪失及びこれらに類する事由による場合は除く。
対象勤務期間
2018年7月23日から2020年7月23日
権利行使期間
2020年7月24日から2025年6月30日
74,500
第16回新株予約権
付与対象者の区分及び人数(名)
当社取締役
当社使用人
子会社取締役
子会社使用人
7
195
8
26
株式の種類別のストック・オプショ
ンの数(株)
普通株式
付与日
2019年8月2日
権利確定条件
権利行使時点において、当社又は当社の子会社又は関連会社の取締役、監
査役又は使用人のいずれの地位をも喪失していないこと。
ただし、取締役又は監査役の任期満了による退任、定年又は会社都合によ
る使用人の地位の喪失及びこれらに類する事由による場合は除く。
対象勤務期間
2019年8月2日から2021年8月2日
権利行使期間
2021年8月3日から2026年6月30日
77,800
第17回新株予約権
付与対象者の区分及び人数(名)
当社取締役
当社使用人
子会社取締役
子会社使用人
7
195
8
36
株式の種類別のストック・オプショ
ンの数(株)
普通株式
付与日
2020年7月30日
権利確定条件
権利行使時点において、当社又は当社の子会社又は関連会社の取締役、監
査役又は使用人のいずれの地位をも喪失していないこと。
ただし、取締役又は監査役の任期満了による退任、定年又は会社都合によ
る使用人の地位の喪失及びこれらに類する事由による場合は除く。
対象勤務期間
2020年7月30日から2023年7月30日
権利行使期間
2023年7月31日から2028年6月30日
79,900
― 110 ―
2005年6月発行新株予約権(株式報酬型)
付与対象者の区分及び人数(名)
当社取締役
当社使用人(役付執行役員)
株式の種類別のストック・オプショ
ンの数(株)
普通株式
付与日
2005年6月29日
権利確定条件
対象勤務期間
権利行使期間
7
11
47,000
原則として当社の取締役及び役付執行役員のいずれの地位をも喪失した
時。
権利確定日を合理的に予測することが困難なため、対象勤務期間はないも
のとみなしています。
2005年6月30日から2025年6月30日
2006年7月発行新株予約権(株式報酬型)
付与対象者の区分及び人数(名)
当社取締役
当社使用人(役付執行役員)
株式の種類別のストック・オプショ
ンの数(株)
普通株式
付与日
2006年7月14日
権利確定条件
対象勤務期間
権利行使期間
6
12
29,600
原則として当社の取締役及び役付執行役員のいずれの地位をも喪失した
時。
権利確定日を合理的に予測することが困難なため、対象勤務期間はないも
のとみなしています。
2006年7月15日から2026年7月14日
2007年7月発行新株予約権(株式報酬型)
付与対象者の区分及び人数(名)
当社取締役
当社使用人(役付執行役員)
株式の種類別のストック・オプショ
ンの数(株)
普通株式
付与日
2007年7月19日
権利確定条件
対象勤務期間
権利行使期間
6
12
32,000
原則として当社の取締役及び役付執行役員のいずれの地位をも喪失した
時。
権利確定日を合理的に予測することが困難なため、対象勤務期間はないも
のとみなしています。
2007年7月20日から2027年7月19日
2011年7月発行新株予約権(株式報酬型)
付与対象者の区分及び人数(名)
当社取締役
当社使用人(役付執行役員)
株式の種類別のストック・オプショ
ンの数(株)
普通株式
付与日
2011年7月12日
権利確定条件
対象勤務期間
権利行使期間
6
2
33,100
原則として当社の取締役及び役付執行役員のいずれの地位をも喪失した
時。
権利確定日を合理的に予測することが困難なため、対象勤務期間はないも
のとみなしています。
2011年7月13日から2031年7月12日
― 111 ―
2012年7月発行新株予約権(株式報酬型)
付与対象者の区分及び人数(名)
当社取締役
当社使用人(役付執行役員)
株式の種類別のストック・オプショ
ンの数(株)
普通株式
付与日
2012年7月23日
権利確定条件
対象勤務期間
権利行使期間
7
2
35,600
原則として当社の取締役及び役付執行役員のいずれの地位をも喪失した
時。
権利確定日を合理的に予測することが困難なため、対象勤務期間はないも
のとみなしています。
2012年7月24日から2032年7月23日
2013年7月発行新株予約権(株式報酬型)
付与対象者の区分及び人数(名)
当社取締役
当社使用人(役付執行役員)
株式の種類別のストック・オプショ
ンの数(株)
普通株式
付与日
2013年7月22日
権利確定条件
対象勤務期間
権利行使期間
7
2
35,100
原則として当社の取締役及び役付執行役員のいずれの地位をも喪失した
時。
権利確定日を合理的に予測することが困難なため、対象勤務期間はないも
のとみなしています。
2013年7月23日から2033年7月22日
2014年7月発行新株予約権(株式報酬型)
付与対象者の区分及び人数(名)
当社取締役
当社使用人(役付執行役員)
株式の種類別のストック・オプショ
ンの数(株)
普通株式
付与日
2014年7月22日
権利確定条件
対象勤務期間
権利行使期間
8
2
38,100
原則として当社の取締役及び役付執行役員のいずれの地位をも喪失した
時。
権利確定日を合理的に予測することが困難なため、対象勤務期間はないも
のとみなしています。
2014年7月23日から2034年7月22日
2015年7月発行新株予約権(株式報酬型)
付与対象者の区分及び人数(名)
当社取締役
当社使用人(役付執行役員)
株式の種類別のストック・オプショ
ンの数(株)
普通株式
付与日
2015年7月22日
権利確定条件
対象勤務期間
権利行使期間
8
1
36,100
原則として当社の取締役及び役付執行役員のいずれの地位をも喪失した
時。
権利確定日を合理的に予測することが困難なため、対象勤務期間はないも
のとみなしています。
2015年7月23日から2035年7月22日
― 112 ―
2016年7月発行新株予約権(株式報酬型)
付与対象者の区分及び人数(名)
当社取締役
当社使用人(役付執行役員)
株式の種類別のストック・オプショ
ンの数(株)
普通株式
付与日
2016年7月21日
権利確定条件
対象勤務期間
権利行使期間
8
1
37,000
原則として当社の取締役及び役付執行役員のいずれの地位をも喪失した
時。
権利確定日を合理的に予測することが困難なため、対象勤務期間はないも
のとみなしています。
2016年7月22日から2036年7月21日
2017年7月発行新株予約権(株式報酬型)
付与対象者の区分及び人数(名)
当社取締役
当社使用人(役付執行役員)
株式の種類別のストック・オプショ
ンの数(株)
普通株式
付与日
2017年7月24日
権利確定条件
対象勤務期間
権利行使期間
7
3
41,900
原則として当社の取締役及び役付執行役員のいずれの地位をも喪失した
時。
権利確定日を合理的に予測することが困難なため、対象勤務期間はないも
のとみなしています。
2017年7月25日から2037年7月24日
2018年7月発行新株予約権(株式報酬型)
付与対象者の区分及び人数(名)
当社取締役
当社使用人(役付執行役員)
株式の種類別のストック・オプショ
ンの数(株)
普通株式
付与日
2018年7月23日
権利確定条件
対象勤務期間
権利行使期間
7
3
42,300
原則として当社の取締役及び役付執行役員のいずれの地位をも喪失した
時。
権利確定日を合理的に予測することが困難なため、対象勤務期間はないも
のとみなしています。
2018年7月24日から2038年7月23日
2019年8月発行新株予約権(株式報酬型)
付与対象者の区分及び人数(名)
当社取締役
当社使用人(役付執行役員)
株式の種類別のストック・オプショ
ンの数(株)
普通株式
付与日
2019年8月2日
権利確定条件
対象勤務期間
権利行使期間
6
5
44,200
原則として当社の取締役及び役付執行役員のいずれの地位をも喪失した
時。
権利確定日を合理的に予測することが困難なため、対象勤務期間はないも
のとみなしています。
2019年8月3日から2039年8月2日
― 113 ―
2020年7月発行新株予約権(株式報酬型)
付与対象者の区分及び人数(名)
当社取締役
当社使用人(役付執行役員)
株式の種類別のストック・オプショ
ンの数(株)
普通株式
付与日
2020年7月30日
権利確定条件
対象勤務期間
権利行使期間
6
5
44,500
原則として当社の取締役及び役付執行役員のいずれの地位をも喪失した
時。
権利確定日を合理的に予測することが困難なため、対象勤務期間はないも
のとみなしています。
2020年7月31日から2040年7月30日
2021年7月発行新株予約権(株式報酬型)
付与対象者の区分及び人数(名)
当社取締役
当社使用人(役付執行役員)
株式の種類別のストック・オプショ
ンの数(株)
普通株式
付与日
2021年7月26日
権利確定条件
対象勤務期間
権利行使期間
6
5
45,800
原則として当社の取締役及び役付執行役員のいずれの地位をも喪失した
時。
権利確定日を合理的に予測することが困難なため、対象勤務期間はないも
のとみなしています。
2021年7月27日から2051年7月26日
2022年7月発行新株予約権(株式報酬型)
付与対象者の区分及び人数(名)
当社取締役
当社使用人(役付執行役員)
株式の種類別のストック・オプショ
ンの数(株)
普通株式
付与日
2022年7月22日
権利確定条件
対象勤務期間
権利行使期間
6
5
48,300
原則として当社の取締役及び役付執行役員のいずれの地位をも喪失した
時。
権利確定日を合理的に予測することが困難なため、対象勤務期間はないも
のとみなしています。
2022年7月23日から2052年7月22日
2023年7月発行新株予約権(株式報酬型)
付与対象者の区分及び人数(名)
当社取締役
当社使用人(役付執行役員)
株式の種類別のストック・オプショ
ンの数(株)
普通株式
付与日
2023年7月24日
権利確定条件
対象勤務期間
権利行使期間
5
8
53,800
原則として当社の取締役及び役付執行役員のいずれの地位をも喪失した
時。
権利確定日を合理的に予測することが困難なため、対象勤務期間はないも
のとみなしています。
2023年7月25日から2053年7月24日
― 114 ―
(2) ストック・オプションの規模及びその変動状況
①
ストック・オプションの数
第15回
第16回
第17回
新株予約権新株予約権新株予約権
権利確定前
前連結会計年度末(株)
-
-
-
付与(株)
-
-
-
失効(株)
-
-
-
権利確定(株)
-
-
-
未確定残(株)
-
-
-
8,000
10,600
24,100
権利確定(株)
-
-
-
権利行使(株)
2,300
4,200
11,700
失効(株)
5,700
-
-
-
6,400
12,400
権利確定後
前連結会計年度末(株)
未行使残(株)
2005年
2006年
2007年
2011年
2012年
2013年
2014年
6月発行
7月発行
7月発行
7月発行
7月発行
7月発行
7月発行
新株予約権
新株予約権
新株予約権
新株予約権
新株予約権
新株予約権
新株予約権
(株式報酬型) (株式報酬型) (株式報酬型) (株式報酬型) (株式報酬型) (株式報酬型) (株式報酬型)
権利確定前
前連結会計年度末(株)
3,200
2,200
2,400
10,500
10,500
12,400
14,900
付与(株)
-
-
-
-
-
-
-
失効(株)
3,200
-
-
-
-
-
-
権利確定(株)
-
-
-
2,500
2,500
3,000
3,000
未確定残(株)
-
2,200
2,400
8,000
8,000
9,400
11,900
前連結会計年度末(株)
-
-
-
-
-
-
-
権利確定(株)
-
-
-
2,500
2,500
3,000
3,000
権利行使(株)
-
-
-
2,500
2,500
3,000
3,000
失効(株)
-
-
-
-
-
-
-
未行使残(株)
-
-
-
-
-
-
-
権利確定後
― 115 ―
2015年
2016年
2017年
2018年
2019年
2020年
2021年
7月発行
7月発行
7月発行
7月発行
8月発行
7月発行
7月発行
新株予約権
新株予約権
新株予約権
新株予約権
新株予約権
新株予約権
新株予約権
(株式報酬型) (株式報酬型) (株式報酬型) (株式報酬型) (株式報酬型) (株式報酬型) (株式報酬型)
権利確定前
前連結会計年度末
(株)
20,600
21,500
25,900
26,300
30,000
30,300
34,000
付与(株)
-
-
-
-
-
-
-
失効(株)
-
-
-
-
-
-
-
権利確定(株)
4,200
5,100
8,200
8,600
9,000
9,300
12,600
未確定残(株)
16,400
16,400
17,700
17,700
21,000
21,000
21,400
-
-
-
-
-
-
-
権利確定(株)
4,200
5,100
8,200
8,600
9,000
9,300
12,600
権利行使(株)
4,200
5,100
8,200
8,600
9,000
9,300
12,600
失効(株)
-
-
-
-
-
-
-
未行使残(株)
-
-
-
-
-
-
-
権利確定後
前連結会計年度末
(株)
2022年
2023年
7月発行
7月発行
新株予約権
新株予約権
(株式報酬型) (株式報酬型)
権利確定前
前連結会計年度末
(株)
35,800
47,800
付与(株)
-
-
失効(株)
-
-
権利確定(株)
13,300
13,300
未確定残(株)
22,500
34,500
-
-
権利確定(株)
13,300
13,300
権利行使(株)
13,300
13,300
失効(株)
-
-
未行使残(株)
-
-
権利確定後
前連結会計年度末
(株)
― 116 ―
②
単価情報
第15回
第16回
第17回
新株予約権新株予約権新株予約権
権利行使価格
(円)
行使時平均株価
(円)
付与日における
公正な評価単価
(円)
4,073
3,075
3,655
8,511
11,702
12,003
611
568
917
2005年
2006年
2007年
2011年
2012年
2013年
2014年
6月発行
7月発行
7月発行
7月発行
7月発行
7月発行
7月発行
新株予約権
新株予約権
新株予約権
新株予約権
新株予約権
新株予約権
新株予約権
(株式報酬型) (株式報酬型) (株式報酬型) (株式報酬型) (株式報酬型) (株式報酬型) (株式報酬型)
権利行使価格
(円)
行使時平均株価
(円)
付与日における
公正な評価単価
(円)
1
1
1
1
1
1
1
-
-
-
8,701
8,701
8,701
8,701
-
4,944
4,046
1,431
1,036
1,957
1,672
2015年
2016年
2017年
2018年
2019年
2020年
2021年
7月発行
7月発行
7月発行
7月発行
8月発行
7月発行
7月発行
新株予約権
新株予約権
新株予約権
新株予約権
新株予約権
新株予約権
新株予約権
(株式報酬型) (株式報酬型) (株式報酬型) (株式報酬型) (株式報酬型) (株式報酬型) (株式報酬型)
権利行使価格
(円)
行使時平均株価
(円)
付与日における
公正な評価単価
(円)
1
1
1
1
1
1
1
8,701
8,701
8,701
8,701
8,701
8,701
8,701
2,129
2,022
3,182
2,841
1,986
2,860
3,367
2022年
2023年
7月発行
7月発行
新株予約権
新株予約権
(株式報酬型) (株式報酬型)
権利行使価格
(円)
行使時平均株価
(円)
付与日における
公正な評価単価
(円)
1
1
8,701
8,701
2,572
4,705
4.当連結会計年度に付与されたストック・オプションの公正な評価単価の見積方法
該当事項はありません。
5.ストック・オプションの権利確定数の見積方法
基本的には、将来の失効数の合理的な見積りは困難であるため、実績の失効数のみを反映させる方法を採用してい
ます。
― 117 ―
(譲渡制限付株式報酬)
当社は、取締役等の報酬として譲渡制限付株式報酬制度を導入しています。
なお、当該取引は会社法第202条の2に基づいて、取締役等の報酬等として金銭の払込み等を要しないで株式の発行等
をする取引ではないため、「取締役の報酬等として株式を無償交付する取引に関する取扱い」(実務対応報告第41号
2021年1月28日)の適用はありません。
1.譲渡制限付株式報酬に係る費用計上額及び科目名
前連結会計年度
(自 2024年4月1日
至 2025年3月31日)
一般管理費
当連結会計年度
(自 2025年4月1日
至 2026年3月31日)
50百万円
30百万円
2.譲渡制限付株式報酬の内容
2022年8月付与譲渡制限付株式報酬
付与対象者の区分及び数
当社取締役
当社使用人(役付執行役員)
子会社取締役
子会社使用人
譲渡制限株式の数
普通株式
付与日
2022年8月17日
譲渡制限期間
2022年8月17日~2025年8月16日 (注)1.
7
21
5
1
16,480株
解除条件
(注)2.
2023年7月付与譲渡制限付株式報酬
付与対象者の区分及び数
当社取締役
当社使用人(役付執行役員)
子会社取締役
子会社使用人
譲渡制限株式の数
普通株式
付与日
2023年7月24日
譲渡制限期間
2023年7月24日~2026年7月23日 (注)1.
解除条件
6
19
6
1
7,940株
(注)2.
(注) 1.上記に定める譲渡制限期間において、割当対象者は、当該割当対象者に割り当てられた譲渡制限付株式(以
下、「本割当株式」という。)につき、第三者に対して譲渡、質権の設定、譲渡担保権の設定、生前贈与、遺
贈その他一切の処分行為をすることができません。
2.当社は、譲渡制限付株式の割当てを受けた対象取締役が、譲渡制限期間の開始日以降、最初に到来する当社
の定時株主総会の開催日まで継続して、当社又は当社関係会社の取締役、監査役、執行役員又は使用人のいずれ
かの地位にあったことを条件として、本割当株式の全部につき、譲渡制限期間が満了した時点をもって譲渡制限
を解除します。
ただし、当該対象取締役が、当社取締役会が正当と認める理由により、譲渡制限期間が満了する前に当社及び
当社関係会社の取締役、監査役、執行役員及び使用人のいずれの地位からも退任又は退職した場合には、譲渡制
限を解除する本割当株式の数及び譲渡制限を解除する時期を、必要に応じて合理的に調整するものとします。
― 118 ―
3.譲渡制限付株式報酬の規模及びその変動状況
(1)
株式数
2022年8月付与
譲渡制限付株式報酬
前連結会計年度末(株)
2023年7月付与
譲渡制限付株式報酬
15,760
7,940
付与(株)
-
-
没収(株)
-
-
権利確定(株)
15,760
-
未確定残(株)
-
7,940
(2)
単価情報
2022年8月付与
譲渡制限付株式報酬
付与日における
公正な評価単価(円)
2023年7月付与
譲渡制限付株式報酬
4,645
8,180
4.公正な評価単価の見積方法
恣意性を排除した価格とするため、当社取締役会決議の直前営業日の東京証券取引所における当社普通株式の終値
としています。
5.権利確定株式数の見積方法
基本的には、将来の没収数の合理的な見積りは困難であるため、実績の没収数のみを反映させる方法を採用してい
ます。
6.業績連動型株式報酬制度「株式給付信託(BBT)」
当社は、2024年6月21日開催の第101期定時株主総会決議に基づき、当社の取締役(監査等委員である取締役及び社
外取締役を除く)及び執行役員並びに当社の指定する子会社及び関連会社の一部の取締役(社外取締役を除く)及び執行
役員を対象に、取締役等の報酬と当社の業績及び株式価値との連動性をより明確にし、株価上昇によるメリットのみ
ならず、株価下落リスクまでも株主の皆様と共有することで、中長期的な業績の向上と企業価値の増大に貢献する意
識を高めることを目的として、業績連動型株式報酬制度「株式給付信託(BBT(=Board Benefit Trust))」を導入し
ています。当該報酬制度の概要は、前記「第4
提出会社の状況
1
株式等の状況(8)役員・従業員株式所有制
度の内容」に記載しています。本制度は報酬として株式の交付又は金銭の支払いを行うものであるため行使価格はあ
りません。役員株式給付規程に基づき、本制度の対象者に付与されたポイントを基礎とした当社株式等の給付見込み
額を費用として認識しています。
株式報酬に係る費用に関する事項
役員株式給付規程に基づき、本制度の対象者に付与されたポイントを基礎とした当社株式等の給付見込み額を費用
として認識しています。株式報酬に係る当連結会計年度の費用の認識額は365百万円です。
― 119 ―
(税効果会計関係)
1.繰延税金資産及び繰延税金負債の発生の主な原因別の内訳
(単位:百万円)
当連結会計年度
(2026年3月31日)
前連結会計年度
(2025年3月31日)
繰延税金資産
有形固定資産
1,667
1,175
棚卸資産
1,043
1,465
退職給付に係る負債
259
278
退職給付信託運用損益
1,186
1,191
賞与引当金
655
863
税務上の繰越欠損金 (注2)
投資有価証券
新株予約権
412
178
289
-
136
203
未払費用
573
548
未払事業税
308
286
製品不具合対策引当金
-
532
その他
620
632
7,195
7,313
将来減算一時差異等の合計に係る評価性引当額
△435
△315
税務上の繰越欠損金に係る評価性引当額 (注2)
△412
-
評価性引当額(注1)
△848
△315
繰延税金資産合計
6,347
6,997
△1,067
△1,154
繰延税金資産小計
繰延税金負債
在外子会社留保利益
退職給付信託設定益
△34
△34
退職給付に係る資産
△450
△662
資産除去債務に対応する除去費用
△28
△27
その他有価証券評価差額金
△454
△705
その他
△205
△192
△2,242
△2,777
4,104
4,220
繰延税金負債合計
繰延税金資産又は繰延税金負債(△)の純額
(注)1.評価性引当額が532百万円減少しています。この減少の主な内容は、連結子会社である株式会社アクレーテ
ク・パワトロシステムの清算が結了したことにより、税務上の繰越欠損金に係る評価性引当額が減少したこ
とによるものです。
2.税務上の繰越欠損金及びその繰延税金資産の繰越期限別の金額
前連結会計年度(2025年3月31日)
1年超
1年以内
2年以内
税務上の繰越欠損金
(単位:百万円)
2年超
3年以内
3年超
4年以内
4年超
5年以内
5年超
合計
39
39
-
28
38
266
412
評価性引当額
△39
△39
-
△28
△38
△266
△412
繰延税金資産
-
-
-
-
-
-
-
当連結会計年度(2026年3月31日)
該当事項はありません。
― 120 ―
2.法定実効税率と税効果会計適用後の法人税等の負担率との差異の原因となった主な項目別の内訳
前連結会計年度
(2025年3月31日)
30.62%
当連結会計年度
(2026年3月31日)
30.62%
租税特別措置に係る法人税の特別控除額
△3.67
△6.96
連結子会社との税率差異
△1.07
△1.22
評価性引当額の増減
△2.04
△1.02
住民税均等割
0.18
0.18
交際費等の永久差異項目
0.59
0.89
連結子会社清算による影響
-
0.70
連結財務諸表提出会社の法定実効税率
(調整)
その他
0.28
1.98
税効果会計適用後の法人税等の負担率
24.89
25.18
3.法人税及び地方法人税の会計処理又はこれらに関する税効果会計の会計処理
当社及び国内連結子会社は、グループ通算制度を適用しています。また、「グループ通算制度を適用する場合の会
計処理及び開示に関する取扱い」(実務対応報告第42号 2021年8月12日)に従って、法人税及び地方法人税の会計処
理又はこれらに関する税効果会計の会計処理並びに開示を行っています。
(資産除去債務関係)
資産除去債務の総額に重要性が乏しいため注記を省略しています。
(収益認識関係)
1.顧客との契約から生じる収益を分解した情報
収益認識の時期別に分解した売上高と各セグメントの売上高との関連は次のとおりです。
当社グループは、「半導体製造装置」「計測機器」の2つを報告セグメントとしています。
当社グループの収益は、「一定時点で移転される財」「一定の期間にわたり移転される財」の2種類に分解し認
識します。
前連結会計年度(自
2024年4月1日至
2025年3月31日)
(単位:百万円)
報告セグメント
半導体製造装置
一時点で移転される財
113,413
36,816
150,230
67
236
304
113,481
37,053
150,534
一定の期間にわたり移転される財
顧客との契約から生じる収益
当連結会計年度(自
2025年4月1日至
合計
計測機器
2026年3月31日)
(単位:百万円)
報告セグメント
半導体製造装置
一時点で移転される財
127,827
38,707
166,535
50
252
303
127,878
38,960
166,839
一定の期間にわたり移転される財
顧客との契約から生じる収益
合計
計測機器
2.顧客との契約から生じる収益を理解するための基礎となる情報
「連結財務諸表作成のための基本となる重要な事項
4.会計方針に関する事項(5) 重要な収益及び費用の計上
基準」をご参照ください。
― 121 ―
3.顧客との契約に基づく履行義務の充足と当該契約から生じるキャッシュ・フローとの関係並びに当連結会計年度
末において存在する顧客との契約から翌連結会計年度以降に認識すると見込まれる収益の金額及び時期に関する情
報
(1) 契約資産及び契約負債の残高等
前連結会計年度(自 2024年4月1日至
2025年3月31日)
(単位:百万円)
期首残高
期末残高
顧客との契約から生じた債権
受取手形
281
153
売掛金
35,216
32,460
電子記録債権
7,303
6,687
-
508
42,801
39,809
9,981
6,789
契約資産
合計
契約負債
(注)契約負債は、主に顧客との販売契約における支払条件に基づいて、顧客から受け取った前受金に関するもので
す。契約負債は、収益の認識に伴い取り崩されます。当連結会計年度に認識された収益の額のうち期首現在の契
約負債残高に含まれていた額は9,460百万円です。
当連結会計年度(自
2025年4月1日至
2026年3月31日)
(単位:百万円)
期首残高
期末残高
顧客との契約から生じた債権
受取手形
153
6
売掛金
32,460
42,228
電子記録債権
6,687
5,353
508
289
39,809
47,877
6,789
6,486
契約資産
合計
契約負債
(注)契約負債は、主に顧客との販売契約における支払条件に基づいて、顧客から受け取った前受金に関するもので
す。契約負債は、収益の認識に伴い取り崩されます。当連結会計年度に認識された収益の額のうち期首現在の契
約負債残高に含まれていた額は6,185百万円です。
(2)残存履行義務に配分した取引価格
当社グループにおいて、当初に予想される契約期間が1年超の重要な取引がないため、実務上の便法を適用
し、残存履行義務に関する情報は開示していません。また、顧客との契約から生じる対価の中に、取引価格に
含まれていない重要な金額はありません。
― 122 ―
(セグメント情報等)
【セグメント情報】
1.報告セグメントの概要
(1) 報告セグメントの決定方法
当社の報告セグメントは、当社の構成単位のうち分離された財務情報が入手可能であり、取締役会が経営資源
の配分の決定及び業績を評価するために、定期的に検討を行う対象となっているものです。
当社では、半導体社及び計測社の社内カンパニーそれぞれが取り扱う製品・サービスについて国内及び海外の
包括的な戦略を立案し、事業活動を展開しています。
従って、当社は社内カンパニーを基礎とした製品・サービス別のセグメントから構成されており、「半導体製
造装置」及び「計測機器」の2つを報告セグメントとしています。
「半導体製造装置」は、半導体製造工程で使用される加工・検査装置を製造販売し、「計測機器」は、三次元
座標測定機、表面粗さ・輪郭形状測定機等の精密測定機器類を製造販売しています。
(2) 各報告セグメントに属する主要製品
半導体製造装置……ウェーハプロービングマシン、ウェーハダイシングマシン、ポリッシュ・グラインダー、
ウェーハマニュファクチャリングマシン、 CMP装置、精密切断ブレード
計測機器……………三次元座標測定機、真円度・円柱形状測定機、表面粗さ・輪郭形状測定機、マシンコン
トロールゲージ、各種自動測定・選別・組立機
2.報告セグメントごとの売上高、利益又は損失、資産、負債その他の項目の金額の算定方法
報告されている事業セグメントの会計処理の方法は、「連結財務諸表作成のための基本となる重要な事項」にお
ける記載と概ね同一であり、報告セグメントの利益は営業利益ベースの数値です。
― 123 ―
3.報告セグメントごとの売上高、利益又は損失、資産、負債その他の項目の金額に関する情報
前連結会計年度(自
2024年4月1日
至
2025年3月31日)
(単位:百万円)
報告セグメント
半導体製造装置
計測機器
連結財務諸表
計上額
(注)2
調整額
(注)1
計
売上高
外部顧客への売上高
113,481
37,053
150,534
-
150,534
セグメント間の内部
売上高又は振替高
-
-
-
-
-
計
113,481
37,053
150,534
-
150,534
セグメント利益
24,311
5,392
29,703
-
29,703
セグメント資産
179,567
56,960
236,528
1,424
237,952
3,670
1,435
5,105
-
5,105
9
39
49
-
49
その他の項目
減価償却費
のれんの償却額
有形固定資産及び
6,590
3,655
10,245
-
10,245
無形固定資産の増加額
(注) 1.セグメント資産の調整額は、各報告セグメントに配分していない全社資産である長期投資資金(その他有価
証券)等です。
2.セグメント利益は、連結損益計算書の営業利益と一致しています。
当連結会計年度(自
2025年4月1日
至
2026年3月31日)
(単位:百万円)
報告セグメント
半導体製造装置
計測機器
連結財務諸表
計上額
(注)2
調整額
(注)1
計
売上高
外部顧客への売上高
127,878
38,960
166,839
-
166,839
セグメント間の内部
売上高又は振替高
-
-
-
-
-
計
127,878
38,960
166,839
-
166,839
セグメント利益
28,404
5,333
33,738
-
33,738
セグメント資産
190,102
57,777
247,880
2,652
250,533
3,840
1,741
5,582
-
5,582
6
39
45
-
45
その他の項目
減価償却費
のれんの償却額
有形固定資産及び
7,224
3,844
11,069
-
11,069
無形固定資産の増加額
(注) 1.セグメント資産の調整額は、各報告セグメントに配分していない全社資産である長期投資資金(その他有価
証券)等です。
2.セグメント利益は、連結損益計算書の営業利益と一致しています。
― 124 ―
【関連情報】
前連結会計年度(自
2024年4月1日
至
2025年3月31日)
1.製品及びサービスごとの情報
セグメント情報に同様の情報を開示しているため、記載を省略しています。
2.地域ごとの情報
(1) 売上高
(単位:百万円)
東アジア
日本
38,185
(注)
中国
台湾
韓国
その他
51,391
17,030
13,530
東南アジア
その他地域
13,973
16,421
合計
(計)
1
81,954
150,534
売上高は顧客の所在地を基礎とし、国又は地域に分類しています。
(2) 有形固定資産
(単位:百万円)
日本
台湾
44,033
その他地域
3,320
合計
6,621
53,975
3.主要な顧客ごとの情報
外部顧客への売上高のうち、連結損益計算書の売上高の10%以上を占める相手先はありません。
当連結会計年度(自
2025年4月1日
至
2026年3月31日)
1.製品及びサービスごとの情報
セグメント情報に同様の情報を開示しているため、記載を省略しています。
2.地域ごとの情報
(1) 売上高
(単位:百万円)
東アジア
日本
39,664
(注)
中国
台湾
韓国
44,853
29,641
16,746
その他
73
東南アジア
その他地域
13,590
22,268
91,315
売上高は顧客の所在地を基礎とし、国又は地域に分類しています。
(2) 有形固定資産
(単位:百万円)
日本
47,937
台湾
3,451
その他地域
8,557
合計
(計)
合計
59,946
3.主要な顧客ごとの情報
外部顧客への売上高のうち、連結損益計算書の売上高の10%以上を占める相手先はありません。
― 125 ―
166,839
【報告セグメントごとの固定資産の減損損失に関する情報】
前連結会計年度(自
2024年4月1日
至
2025年3月31日)
至
2026年3月31日)
該当事項はありません。
当連結会計年度(自
2025年4月1日
該当事項はありません。
【報告セグメントごとののれんの償却額及び未償却残高に関する情報】
前連結会計年度(自
2024年4月1日
至
2025年3月31日)
(単位:百万円)
報告セグメント
全社・消去
半導体製造装置
当期末残高
(注)
計測機器
6
合計
計
218
224
-
224
のれんの償却額に関しては、セグメント情報に同様の情報を開示しているため、記載を省略しています。
当連結会計年度(自
2025年4月1日
至
2026年3月31日)
(単位:百万円)
報告セグメント
全社・消去
半導体製造装置
当期末残高
(注)
0
計測機器
合計
計
183
183
-
183
のれんの償却額に関しては、セグメント情報に同様の情報を開示しているため、記載を省略しています。
【報告セグメントごとの負ののれん発生益に関する情報】
該当事項はありません。
― 126 ―
【関連当事者情報】
1.関連当事者との取引
前連結会計年度(自
2024年4月1日
至
2025年3月31日)
(1) 連結財務諸表提出会社と関連当事者との取引
連結財務諸表提出会社の役員及びその主要株主(個人の場合に限る。)等
該当事項はありません。
連結財務諸表提出会社の重要な子会社の役員及びその近親者
種類
会社等の名称
又は氏名
所在地
子会社
役員
ウォルフ ガング
ボナッツ
-
資本金
又は
出資金
(百万円)
事業の内容
又は職業
子会社
- 代表取締役
議決権等
の所有
(被所有)
割合(%)
関連当事者
との関係
取引の内容
取引金額
(百万円)
科目
期末残高
(百万円)
(被所有)
直接0.00
-
ストック・
オプション
の行使
10
-
-
(注)第15回新株予約権、第16回新株予約権及び第17回新株予約権の当連結会計年度における権利行使を記載してい
ます。なお、取引金額には、当連結会計年度におけるストック・オプションの権利行使による付与株式数に払込
金額を乗じた金額を記載しています。
当連結会計年度(自
2025年4月1日
至
2026年3月31日)
該当事項はありません。
2.重要な関連会社に関する注記
該当事項はありません。
― 127 ―
(1株当たり情報)
前連結会計年度
(自 2024年4月1日
至 2025年3月31日)
1株当たり純資産額
当連結会計年度
(自 2025年4月1日
至 2026年3月31日)
4,305.52円
4,706.73円
1株当たり当期純利益金額
633.75円
610.02円
潜在株式調整後1株当たり当期純利益金額
628.31円
606.14円
(注)
1. 株主資本において自己株式として計上されている「株式給付信託(BBT)」に残存する自社の株式は、1株
当たり当期純利益金額の算定上、期中平均株式数の計算において控除する自己株式に含めています。1株当
たり純資産額の算定上、控除した当該自己株式の期末株式数は、前連結会計年度末200,000株、当連結会計年
度末189,700株です。1株当たり当期純利益金額の算定上、控除した当該自己株式の期中平均株式数は、前連
結会計年度200,000株、当連結会計年度193,541株です。
2. 1株当たり当期純利益金額及び潜在株式調整後1株当たり当期純利益金額の算定上の基礎
前連結会計年度
当連結会計年度
(自 2024年4月1日
(自 2025年4月1日
至 2025年3月31日)
至 2026年3月31日)
1株当たり当期純利益金額
親会社株主に帰属する当期純利益(百万円)
25,637
24,739
-
-
25,637
24,739
40,453,797
40,554,349
-
-
普通株式増加数(株)
350,017
259,791
(うち新株予約権(株))
(350,017)
(259,791)
-
-
普通株主に帰属しない金額(百万円)
普通株式に係る親会社株主に帰属する
当期純利益(百万円)
普通株式の期中平均株式数(株)
潜在株式調整後1株当たり当期純利益金額
親会社株主に帰属する
当期純利益調整額(百万円)
希薄化効果を有しないため、潜在株式調整後
1株当たり当期純利益金額の算定に含まれな
かった潜在株式の概要
3.1株当たり純資産額の算定上の基礎
前連結会計年度
(2025年3月31日)
純資産の部の合計額(百万円)
純資産の部の合計額から控除する金額
(百万円)
(うち新株予約権(百万円))
(うち非支配株主持分(百万円))
普通株式に係る期末の純資産額(百万円)
1株当たり純資産額の算定に用いられた期末
の普通株式の数(株)
(重要な後発事象)
該当事項はありません。
― 128 ―
当連結会計年度
(2026年3月31日)
176,229
192,916
2,007
1,881
(950)
(662)
(1,056)
(1,218)
174,221
191,035
40,464,792
40,587,595
⑤ 【連結附属明細表】
【社債明細表】
該当事項はありません。
【借入金等明細表】
当期首残高
(百万円)
区分
当期末残高
(百万円)
平均利率
(%)
返済期限
短期借入金
1,300
1,300
1.76
-
1年内返済予定の長期借入金
5,000
5,000
1.49
-
1年内返済予定のリース債務
327
261
1.23
-
13,000
8,000
1.52
456
151
1.42
20,084
14,713
-
長期借入金
(1年内返済予定のものを除く。)
リース債務
(1年内返済予定のものを除く。)
合計
2027年6月25日から
2028年12月25日まで
2027年5月31日から
2030年9月28日まで
-
(注) 1.「平均利率」については、借入金等の期末残高に対する加重平均利率を記載しています。
2.長期借入金及びリース債務(1年内返済予定のものを除く。)の連結決算日後5年以内における1年ごとの返
済予定額は以下のとおりです。
1年超2年以内
2年超3年以内
3年超4年以内
4年超5年以内
区分
(百万円)
(百万円)
(百万円)
(百万円)
長期借入金
5,000
3,000
-
-
リース債務
73
33
8
36
合計
5,073
3,033
8
36
【資産除去債務明細表】
当連結会計年度期首及び当連結会計年度末における資産除去債務の金額が、当連結会計年度期首及び当連結
会計年度末における負債及び純資産の合計額の100分の1以下であるため、連結財務諸表規則第92条の2の規定
により記載を省略しています。
― 129 ―
(2) 【その他】
当連結会計年度における半期情報等
第1四半期
連結累計期間
売上高
税金等調整前中間(四半
期)(当期)純利益金額
親会社株主に帰属する
中間(四半期)(当期)純利
益金額
1株当たり中間(四半
期)(当期)純利益金額
(会計期間)
中間連結会計期間
第3四半期
連結累計期間
当連結会計年度
(百万円)
30,876
77,070
112,971
166,839
(百万円)
4,465
12,964
19,808
33,186
(百万円)
3,229
9,612
14,148
24,739
(円)
79.77
237.18
348.97
610.02
第1四半期
連結会計期間
第2四半期
連結会計期間
第3四半期
連結会計期間
第4四半期
連結会計期間
1株当たり
(円)
79.77
157.32
112.74
260.01
四半期純利益金額
(注)1.第1四半期連結累計期間及び第3四半期連結累計期間に係る財務情報に対するレビュー :無
2.当社は、「株式給付信託(BBT)」を導入しており、当該信託が保有する当社株式を、1株当たり四半期(当
期)純利益の算定上、期中平均株式数の計算において控除する自己株式数に含めています。
― 130 ―
2 【財務諸表等】
(1)【財務諸表】
①【貸借対照表】
(単位:百万円)
前事業年度
(2025年3月31日)
資産の部
流動資産
現金及び預金
受取手形
電子記録債権
売掛金
商品及び製品
仕掛品
原材料及び貯蔵品
未収消費税等
その他
流動資産合計
固定資産
有形固定資産
建物
構築物
機械及び装置
工具、器具及び備品
土地
建設仮勘定
その他
有形固定資産合計
無形固定資産
ソフトウエア
その他
無形固定資産合計
投資その他の資産
投資有価証券
関係会社株式
関係会社出資金
長期貸付金
前払年金費用
繰延税金資産
その他
貸倒引当金
投資その他の資産合計
固定資産合計
資産合計
35,284
103
5,782
※1
31,599
1,540
36,405
23,484
4,345
※1
2,298
140,844
33,628
0
4,389
※1
42,066
1,677
37,244
20,726
4,405
※1
2,697
146,836
23,314
506
1,954
3,820
5,948
491
49
36,086
23,123
505
2,150
4,343
5,948
1,765
46
37,883
2,405
44
2,449
2,050
29
2,080
2,789
3,925
285
10,366
1,500
4,199
209
△2,950
20,325
58,862
199,707
3,350
4,425
285
※1
9,412
1,637
4,588
210
-
23,911
63,875
210,712
※1
― 131 ―
当事業年度
(2026年3月31日)
(単位:百万円)
当事業年度
(2026年3月31日)
前事業年度
(2025年3月31日)
負債の部
流動負債
支払手形
電子記録債務
買掛金
短期借入金
1年内返済予定の長期借入金
リース債務
未払金
未払費用
未払法人税等
賞与引当金
契約負債
製品不具合対策引当金
その他
流動負債合計
固定負債
長期借入金
リース債務
資産除去債務
その他
固定負債合計
負債合計
純資産の部
株主資本
資本金
資本剰余金
資本準備金
その他資本剰余金
資本剰余金合計
利益剰余金
利益準備金
その他利益剰余金
別途積立金
繰越利益剰余金
利益剰余金合計
自己株式
株主資本合計
評価・換算差額等
その他有価証券評価差額金
評価・換算差額等合計
新株予約権
純資産合計
負債純資産合計
※1
※1
※1
― 132 ―
67
7,312
12,591
1,390
5,000
21
3,715
2,153
4,520
1,522
5,438
-
162
43,896
※1
※1
※1
1
8,051
13,459
1,390
5,000
13
3,822
2,335
2,976
1,865
4,275
1,688
188
45,069
13,000
18
104
313
13,437
57,333
8,000
14
105
570
8,690
53,760
11,573
11,748
18,945
477
19,423
19,120
477
19,598
728
728
5,000
112,098
117,826
△8,430
140,392
5,000
126,042
131,771
△8,362
154,755
1,030
1,030
950
142,373
199,707
1,534
1,534
662
156,951
210,712
②【損益計算書】
売上高
売上原価
売上総利益
販売費及び一般管理費
営業利益
営業外収益
受取利息及び配当金
為替差益
投資事業組合運用益
その他
営業外収益合計
営業外費用
支払利息
固定資産除売却損
輸送事故による損失
為替差損
その他
営業外費用合計
経常利益
特別利益
投資有価証券売却益
固定資産売却益
新株予約権戻入益
貸倒引当金戻入額
関係会社清算益
特別利益合計
特別損失
製品不具合対策費
特別損失合計
税引前当期純利益
法人税、住民税及び事業税
法人税等調整額
法人税等合計
当期純利益
前事業年度
(自 2024年4月1日
至 2025年3月31日)
※1、※2
128,647
※1
82,804
45,842
※3
24,219
21,623
3,188
-
66
259
3,514
※1
(単位:百万円)
当事業年度
(自 2025年4月1日
至 2026年3月31日)
※1、※2
143,826
※1
91,407
52,419
※3
27,525
24,893
4,262
247
221
138
4,870
※1
201
10
62
180
62
517
24,620
241
7
19
-
26
294
29,469
※1
※4
-
4,303
10
-
-
4,314
-
-
28,934
6,720
△783
5,936
22,998
― 133 ―
※1
191
-
3
※5
1,748
※6
16
1,959
※7
1,833
1,833
29,594
6,113
△640
5,472
24,122
③【株主資本等変動計算書】
前事業年度(自 2024年4月1日
至 2025年3月31日)
(単位:百万円)
株主資本
資本剰余金
資本金
資本準備金
利益剰余金
その他利益剰余金
その他
資本剰余金
資本剰余金
合計
利益準備金
33
18,855
728
利益剰余金
合計
別途積立金
繰越利益
剰余金
5,000
97,896
103,624
剰余金の配当
△8,796
△8,796
当期純利益
22,998
22,998
14,202
14,202
112,098
117,826
当期首残高
11,450
18,822
122
122
当期変動額
新株の発行
122
自己株式の取得
自己株式の処分
444
444
株主資本以外の項目
の当期変動額(純
額)
当期変動額合計
当期末残高
122
122
444
567
11,573
18,945
477
19,423
株主資本
当期首残高
728
5,000
評価・換算差額等
評価・換算
差額等合計
純資産合計
株主資本合計
その他
有価証券
評価差額金
新株予約権
自己株式
△7,983
125,947
989
989
1,082
128,019
当期変動額
新株の発行
245
245
剰余金の配当
△8,796
△8,796
当期純利益
22,998
22,998
自己株式の取得
△1,383
△1,383
△1,383
自己株式の処分
936
1,381
1,381
株主資本以外の項目
の当期変動額(純
額)
当期変動額合計
当期末残高
40
40
△131
△90
△446
14,445
40
40
△131
14,354
△8,430
140,392
1,030
1,030
950
142,373
― 134 ―
当事業年度(自 2025年4月1日
至 2026年3月31日)
(単位:百万円)
株主資本
資本剰余金
資本金
資本準備金
利益剰余金
その他利益剰余金
その他
資本剰余金
資本剰余金
合計
利益準備金
477
19,423
728
利益剰余金
合計
別途積立金
繰越利益
剰余金
5,000
112,098
117,826
剰余金の配当
△10,177
△10,177
当期純利益
24,122
24,122
13,944
13,944
126,042
131,771
当期首残高
11,573
18,945
175
175
当期変動額
新株の発行
175
自己株式の取得
自己株式の処分
0
0
株主資本以外の項目
の当期変動額(純
額)
当期変動額合計
当期末残高
175
175
0
175
11,748
19,120
477
19,598
株主資本
当期首残高
728
5,000
評価・換算差額等
評価・換算
差額等合計
純資産合計
株主資本合計
その他
有価証券
評価差額金
新株予約権
自己株式
△8,430
140,392
1,030
1,030
950
142,373
当期変動額
新株の発行
350
350
剰余金の配当
△10,177
△10,177
当期純利益
24,122
24,122
自己株式の取得
△3
△3
△3
自己株式の処分
71
71
71
株主資本以外の項目
の当期変動額(純
額)
当期変動額合計
当期末残高
503
503
△288
215
67
14,362
503
503
△288
14,578
△8,362
154,755
1,534
1,534
662
156,951
― 135 ―
【注記事項】
(重要な会計方針)
1.資産の評価基準及び評価方法
(1) 有価証券
①
子会社株式及び関連会社株式
移動平均法による原価法
②
その他有価証券
市場価格のない株式等以外のもの
時価法(評価差額は全部純資産直入法により処理し、売却原価は移動平均法による原価法により算定)
市場価格のない株式等
移動平均法による原価法
(2) 棚卸資産
通常の販売目的で保有する棚卸資産の評価基準及び評価方法については、主として総平均法による原価法(収益性
の低下に基づく簿価切下げの方法)によっています。
2.固定資産の減価償却の方法
(1) 有形固定資産(リース資産を除く)
定率法によっています。ただし、1998年4月1日以降取得した建物(建物附属設備は除く)並びに2016年4月1日
以降取得した建物附属設備及び構築物については定額法を採用しています。
主な耐用年数は以下のとおりです。
建物
8年~50年
機械装置
7年~12年
(2) 無形固定資産(リース資産を除く)
①
自社利用のソフトウエア
②
その他の無形固定資産
社内における利用可能期間に基づく定額法によっています。
定額法によっています。
(3) リース資産
所有権移転外ファイナンス・リース取引に係るリース資産については、リース期間を耐用年数とし、残存価額を
零とする定額法を採用しています。
3.引当金の計上基準
(1) 貸倒引当金
債権の貸倒の損失に備えるため、一般債権については貸倒実績率により、貸倒懸念債権等特定債権については個
別に回収可能性を検討し、回収不能見込額を計上しています。
(2) 賞与引当金
従業員に対する賞与の支払いに備えるため、支給見込額基準により計上しています。
(3) 退職給付引当金
従業員の退職給付に備えるため、当事業年度末における退職給付債務及び年金資産の見込額に基づき計上してい
ます。
①
退職給付見込額の期間帰属方法
退職給付債務の算定にあたり、退職給付見込額を当事業年度末までの期間に帰属させる方法については、給付
算定式基準によっています。
②
数理計算上の差異及び過去勤務費用の費用処理方法
過去勤務債務については、各事業年度の発生時における従業員の平均残存勤務期間以内の一定の年数(10年)に
よる定額法により費用処理しています。 また、数理計算上の差異については、各事業年度の発生時における従業員の平
均残存勤務期間以内の一定の年数(10年)による定額法により按分した額を、 それぞれ発生の翌事業年度より費用処理
しています。
― 136 ―
(4) 製品不具合対策引当金
一部製品において発生した不具合に対し、将来発生すると見込まれる対策費用を合理的に見積もり計上していま
す。
4.収益及び費用の計上基準
当社グループは、下記の5ステップアプローチに基づき、収益を認識しています。
ステップ1:顧客との契約の識別
ステップ2:契約における履行義務の識別
ステップ3:取引価格の算定
ステップ4:履行義務への取引価格の配分
ステップ5:履行義務充足による収益の認識
当社は、半導体製造装置事業において、ウェーハプロービングマシン、ウェーハダイシングマシン等半導体製造
工程で使用される加工・検査装置の販売、計測機器事業においては、三次元座標測定機、表面粗さ・輪郭形状測定
機等の精密測定機器類の販売を行っています。また、製品に関連した保証、修理・保守、移設等のサービス業務を
提供しています。
当社の顧客との契約から生じる収益に関する主要な事業における主な履行義務の内容及び当該履行義務を充足す
る通常の時点(収益を認識する通常の時点)は以下のとおりです。
(ⅰ) 製品の販売
製品の販売については、当該製品の支配が顧客に移転した時点で、当該製品と交換に受け取ると見込まれ
る金額で収益を認識しています。
顧客への製品の引渡の際に据付を要する製品については、製品を顧客に引き渡した後に、契約に基づく製
品の仕様を満たした状態で顧客の指定する場所に製品の据付を完了した時点で、顧客が製品に対する支配を
獲得し、履行義務が充足されたと判断して収益を認識しています。
顧客への製品の引渡の際に据付を要しない製品は、国内販売においては、出荷時から製品の支配が顧客に
移転される時までの期間が通常の期間である場合、出荷時に収益を認識しています。
なお、顧客との契約に基づき製品販売に一定期間のワランティサービスが含まれている場合は、製品の引
き渡しによる履行義務と当該サービスによる履行義務を識別し、それぞれの履行義務を充足した時点で収益
を認識しています。
(ⅱ) サービスの提供
有償サービス業務については、履行義務が一時点で充足される場合にはサービス提供完了時点において収
益を認識しています。
製品保守の履行義務を一定期間負う契約の場合には、保守契約期間に応じて均等按分し、収益を認識して
います。
また、収益は、取引の対価は契約金額に基づいて測定しており、主に受注時から履行義務を充足するまでの期間
に前受金の受領、または履行義務充足後の支払いを要求しています。顧客に支払われる売上リベート等がある場合、
取引価格から控除しています。なお、履行義務充足後の支払いは、履行義務の充足時点から主に1年以内に受領し
ており、長期にわたるものはないため、重要な金融要素は含んでいません。
5.その他財務諸表作成のための基本となる重要な事項
(1) 重要な外貨建の資産又は負債の本邦通貨への換算の基準
外貨建金銭債権債務は、決算日の直物為替相場により円貨に換算し、換算差額は損益として処理しています。
(2) 資産に係る控除対象外消費税等の会計処理
資産に係る控除対象外消費税及び地方消費税は当事業年度の費用として処理しています。
(3) グループ通算制度の適用
グループ通算制度を適用しています。
(4) 退職給付に係る会計処理
退職給付に係る未認識数理計算上の差異及び未認識過去勤務費用の会計処理の方法は、連結財務諸表におけるこ
れらの会計処理の方法と異なっています。
― 137 ―
(表示方法の変更)
(損益計算書関係)
前事業年度において、「営業外収益」の「その他」に含めていた「投資事業組合運用益」は金額的重要性が増し
たため、当事業年度より独立掲記することとしています。この表示方法の変更を反映させるため、前事業年度の財
務諸表の組替えを行っています。
この結果、前事業年度の損益計算書において、「営業外収益」の「その他」に表示していた325百万円は、「投資
事業組合運用益」66百万円、「その他」259百万円として組み替えています。
(追加情報)
(取締役等に信託を通じて自社の株式を交付する取引 )
株式給付信託に係る取引について、「1 連結財務諸表等 (1)連結財務諸表
を記載しているため、注記を省略しています。
― 138 ―
注記事項(追加情報)に同一の内容
(貸借対照表関係)
※1.
関係会社に対する金銭債権及び金銭債務
短期金銭債権
前事業年度
(2025年3月31日)
12,563百万円
当事業年度
(2026年3月31日)
14,867百万円
長期金銭債権
10,339百万円
9,387百万円
短期金銭債務
9,401百万円
9,072百万円
前事業年度
(自 2024年4月1日
至 2025年3月31日)
当事業年度
(自 2025年4月1日
至 2026年3月31日)
売上高
26,448百万円
42,259百万円
仕入高
14,481百万円
14,246百万円
3,199百万円
4,156百万円
前事業年度
(自 2024年4月1日
至 2025年3月31日)
当事業年度
(自 2025年4月1日
至 2026年3月31日)
半導体製造装置
105,715百万円
118,663百万円
計測機器
22,932百万円
25,163百万円
(損益計算書関係)
※1.関係会社との取引高
営業取引による取引高
営業取引以外の取引による取引高
※2.セグメント別売上高
※3.販売費及び一般管理費の主要な費目
前事業年度
(自 2024年4月1日
至 2025年3月31日)
当事業年度
(自 2025年4月1日
至 2026年3月31日)
研究開発費
9,621百万円
12,037百万円
販売手数料
5,106百万円
5,333百万円
減価償却費
631百万円
736百万円
賞与引当金繰入額
464百万円
515百万円
7百万円
25百万円
販売費
44%
41%
一般管理費
56%
59%
退職給付引当金繰入額
おおよその割合
※4.固定資産売却益
前事業年度(自
2024年4月1日
至
2025年3月31日)
日野工場用地の売却により発生したものです。
当事業年度(自
2025年4月1日
至
2026年3月31日)
至
2025年3月31日)
至
2026年3月31日)
該当事項はありません。
※5.貸倒引当金戻入額
前事業年度(自
2024年4月1日
該当事項はありません。
当事業年度(自
2025年4月1日
株式会社アクレーテク・パワトロシステムに対する貸付金に係る貸倒引当金を取り崩したことによるものです。
― 139 ―
※6.関係会社清算益
前事業年度(自
2024年4月1日
至
2025年3月31日)
至
2026年3月31日)
該当事項はありません。
当事業年度(自
2025年4月1日
連結子会社であった株式会社アクレーテク・パワトロシステムの清算により発生したものです。
※7.製品不具合対策費
前事業年度(自
2024年4月1日
至
2025年3月31日)
至
2026年3月31日)
該当事項はありません。
当事業年度(自
2025年4月1日
半導体製造装置の一部製品において確認された不具合の対策費用として計上したものです。
(有価証券関係)
子会社株式及び関連会社株式は、市場価格のない株式等のため、子会社株式及び関連会社株式の時価を記載して
いません。
なお、市場価格のない株式等の子会社株式及び関連会社株式の貸借対照表計上額は次のとおりです。
(単位:百万円)
区分
前事業年度
(2025年3月31日)
当事業年度
(2026年3月31日)
子会社株式
3,790
3,790
関連会社株式
135
635
計
3,925
4,425
― 140 ―
(税効果会計関係)
1.繰延税金資産及び繰延税金負債の発生の主な原因別の内訳
前事業年度
(2025年3月31日)
(単位:百万円)
当事業年度
(2026年3月31日)
繰延税金資産
有形固定資産
1,477
1,086
退職給付信託運用損益
1,186
1,191
棚卸資産
765
1,112
投資有価証券
391
128
賞与引当金
466
587
貸倒引当金
929
-
新株予約権
289
203
未払費用
448
506
未払事業税
265
248
製品不具合対策引当金
-
532
165
251
繰延税金資産小計
その他
6,385
5,848
評価性引当額(注)
△1,538
△315
繰延税金資産合計
4,847
5,532
その他有価証券評価差額金
△454
△705
退職給付信託設定益
△34
△34
資産除去債務に対応する除去費用
△28
△27
その他
繰延税金負債
△129
△176
繰延税金負債合計
△648
△944
繰延税金資産の純額
4,199
4,588
(注)評価性引当額の減少額1,222百万円は、主に連結子会社である株式会社アクレーテク・パワトロシステム
の清算が結了したことにより、貸倒引当金に係る評価性引当額が減少したことに伴うものであります。
2.法定実効税率と税効果会計適用後の法人税等の負担率との差異の原因となった主な項目別の内訳
財務諸表提出会社の法定実効税率
前事業年度
(2025年3月31日)
30.62%
当事業年度
(2026年3月31日)
30.62%
(調整)
受取配当金等の永久差異項目
△3.11
△4.00
租税特別措置に係る法人税の特別控除額
△3.94
△7.37
評価性引当額の増減
△3.18
△4.13
住民税均等割
0.13
0.13
交際費等の永久差異項目
0.01
0.26
連結子会社清算による影響
-
2.11
その他
△0.01
0.87
税効果会計適用後の法人税等の負担率
20.52
18.49
― 141 ―
3.法人税及び地方法人税の会計処理またはこれらに関する税効果会計の会計処理
当社はグループ通算制度を適用しています。また、「グループ通算制度を適用する場合の会計処理及び開示に関
する取扱い」(実務対応報告第42号 2021年8月12日)に従って、法人税及び地方法人税の会計処理またはこれらに
関する税効果会計の会計処理並びに開示を行っています。
(収益認識関係)
顧客との契約から生じる収益を理解するための基礎となる情報は、連結財務諸表「注記事項(収益認識関係)」
に同一の内容を記載しているため、注記を省略しています。
(重要な後発事象)
該当事項はありません。
― 142 ―
④ 【附属明細表】
【有形固定資産等明細表】
(単位:百万円)
区分
資産の種類
建物
1,238
15
1,413
23,123
17,249
506
60
1
60
505
895
機械及び装置
1,954
738
7
535
2,150
6,721
工具、器具及 び
備品
3,820
1,913
230
1,160
4,343
7,614
土地
5,948
-
-
-
5,948
-
建設仮勘定
491
3,410
2,135
-
1,765
-
その他
49
24
0
28
46
182
36,086
7,385
2,389
3,197
37,883
32,664
2,405
577
1
930
2,050
-
44
-
-
14
29
-
2,449
577
1
944
2,080
-
計
ソフトウエア
無形固定資産
減価償却
累計額
23,314
構築物
有形固定資産
当期首残高当期増加額当期減少額当期償却額当期末残高
その他
計
(注)「建設仮勘定」の「当期末残高」のうち主なものは、みよし工場改修439百万円、八王子新工場関連972百万円
です。
【引当金明細表】
(単位:百万円)
科目
当期首残高
当期増加額
当期減少額
当期末残高
貸倒引当金
2,950
-
2,950
-
賞与引当金
1,522
1,865
1,522
1,865
-
2,103
414
1,688
製品不具合対策引当金
(2) 【主な資産及び負債の内容】
連結財務諸表を作成しているため、記載を省略しています。
(3) 【その他】
該当事項はありません。
― 143 ―
第6 【提出会社の株式事務の概要】
事業年度
4月1日から3月31日まで
定時株主総会
6月中
基準日
3月31日
剰余金の配当の基準日
9月30日
3月31日
1単元の株式数
100株
単元未満株式の買取り・
売渡し
取扱場所
株主名簿管理人
取次所
買取・売渡手数料
(特別口座)
東京都千代田区丸の内一丁目3番3号 みずほ信託銀行株式会社
(特別口座)
東京都千代田区丸の内一丁目3番3号 みずほ信託銀行株式会社
(特別口座)
みずほ信託銀行株式会社全国各支店
みずほ証券株式会社本店及び全国各支店
本店証券代行部
株式の売買の委託に係る手数料相当額として別途定める金額
公告掲載方法
当会社の公告方法は、電子公告とします。
ただし、事故その他やむを得ない事由によって電子公告による公告をすることができ
ない場合は、日本経済新聞に掲載して行います。
なお、電子公告は当社ホームページ上に掲載しています。
(ホームページアドレス https://www.accretech.com/)
株主に対する特典
なし
(注)「単元未満株式についての権利」に関する定款での定めは以下のとおりです。当会社の株主は、その有する単元
未満株式について、次に掲げる権利以外の権利を行使することができません。
1.会社法第189条第2項各号に掲げる権利
2.会社法第166条第1項の規定により請求をする権利
3.株主の有する株式数に応じて募集株式の割当て及び募集新株予約権の割当てを受ける権利
4.次条(定款第10条単元未満株式の売渡請求)に定める請求をする権利
― 144 ―
第7 【提出会社の参考情報】
1 【提出会社の親会社等の情報】
当社には、金融商品取引法第24条の7第1項に規定する親会社等はありません。
2 【その他の参考情報】
当事業年度の開始日から有価証券報告書提出日までの間に次の書類を提出しています。
(1) 有価証券報告書及びその添付書類並びにその確認書
事業年度第102期(自 2024年4月1日至 2025年3月31日)
2025年6月20日
関東財務局長に提出
(2) 内部統制報告書
2025年6月20日
関東財務局長に提出
(3) 半期報告書及びその確認書
第103期中(自 2025年4月1日
至
2025年9月30日)
(4) 臨時報告書
企業内容等の開示に関する内閣府令第19条第2項第9号の2(株主総会に
おける議決権行使の結果)の規定に基づく臨時報告書
― 145 ―
2025年11月5日
関東財務局長に提出
2025年6月27日
関東財務局長に提出
第二部【提出会社の保証会社等の情報】
該当事項はありません。
― 146 ―
独立監査人の監査報告書及び内部統制監査報告書
2026年6月19日
株式会社東京精密
取締役会
御中
EY新日本有限責任監査法人
東京事務所
指定有限責任社員
業務執行社員
公認会計士
寶
野
裕
昭
指定有限責任社員
業務執行社員
公認会計士
牧
野
幸
享
<連結財務諸表監査>
監査意見
当監査法人は、金融商品取引法第193条の2第1項の規定に基づく監査証明を行うため、「経理の状況」に掲げら
れている株式会社東京精密の2025年4月1日から2026年3月31日までの連結会計年度の連結財務諸表、すな
わち、連結貸借対照表、連結損益計算書、連結包括利益計算書、連結株主資本等変動計算書、連結キャッシュ・フロー
計算書、連結財務諸表作成のための基本となる重要な事項、その他の注記及び連結附属明細表について監査を行った。
当監査法人は、上記の連結財務諸表が、我が国において一般に公正妥当と認められる企業会計の基準に準拠して、株
式会社東京精密及び連結子会社の2026年3月31日現在の財政状態並びに同日をもって終了する連結会計年度の経
営成績及びキャッシュ・フローの状況を、全ての重要な点において適正に表示しているものと認める。
監査意見の根拠
当監査法人は、我が国において一般に公正妥当と認められる監査の基準に準拠して監査を行った。監査の基準におけ
る当監査法人の責任は、「連結財務諸表監査における監査人の責任」に記載されている。当監査法人は、我が国におけ
る職業倫理に関する規定(社会的影響度の高い事業体の財務諸表監査に適用される規定を含む。)に従って、会社及び
連結子会社から独立しており、また、監査人としてのその他の倫理上の責任を果たしている。当監査法人は、意見表明
の基礎となる十分かつ適切な監査証拠を入手したと判断している。
― 147 ―
監査上の主要な検討事項
監査上の主要な検討事項とは、当連結会計年度の連結財務諸表の監査において、監査人が職業的専門家として特に重
要であると判断した事項である。監査上の主要な検討事項は、連結財務諸表全体に対する監査の実施過程及び監査意見
の形成において対応した事項であり、当監査法人は、当該事項に対して個別に意見を表明するものではない。
半導体製造装置事業における売上高の期間帰属の適切性
監査上の主要な検討事項の
内容及び決定理由
監査上の対応
注記事項(セグメント情報等)に記載のとおり、株式
当監査法人は、据付作業を伴う半導体製造装置の売上
会社東京精密の当連結会計年度の連結損益計算書に計上
高(以下、半導体製造装置の売上高)の期間帰属の適切
されている売上高166,839百万円の77%を占める127,878
性を検討するため、主に以下の監査手続を実施した。
百万円は、半導体製造装置セグメントの売上高であり、 (1) 内部統制の評価
その主たる部分は需要家の工場における据付作業を伴う
ものである。
半導体製造装置の売上高の計上に係る内部統制の整備
及び運用状況を評価した。評価に当たっては、特に半導
半導体製造装置事業は技術革新のテンポが速く、業界体製造装置の据付等の完了が確認できる証憑と照合する
特有の構造的な景気循環があり、製品自体にも高度な技 ことにより、適切な会計期間に帰属した売上高であるこ
術水準が求められる競争の激しい事業である。また、需
とを確認する統制に焦点を当てた。
要家は半導体の需給に応じ生産調整するため、装置の据 (2) 金額が多額な半導体製造装置の売上高について、以
付作業を実施する時期は需要家の内部及び外部経営環境
の影響を受ける。半導体製造装置事業の需要動向の変動
下の監査手続を実施した。
① 契約書もしくは注文書から取引内容を理解し、適切
により、需要家から納期の延期などが要請され、装置の な方針により売上高が計上されていることを確かめた。
据付作業が予定通りに実施できないケースが発生する可
② 売上明細と、据付作業の社内報告書、需要家から入
能性があり、売上計上時期の判断に慎重な検討が求めら 手した据付作業完了の報告書、顧客からの発注書及び請
れることが想定された。さらに、据付作業を実施する半求書等とを照合し、据付の事実を確認し、適切な期間に
導体製造装置売上は、1台あたりの金額が相対的に大き 売上が計上されていることを確かめた。
くなる傾向にある。また、顧客への販売条件の関係で特
③ 売上計上後に発生した原価のデータを閲覧し、売上
に期末月に据付等の完了が多く発生することから、期末計上後に多額の原価が発生していないことを確かめた。
月において売上高の期間帰属を誤った場合には財務数値
に与える影響は大きいものとなる。
以上から、当監査法人は、据付作業を伴う半導体製造
装置の売上高の期間帰属の適切性が、当連結会計年度の
連結財務諸表監査において特に重要であり、「監査上の
主要な検討事項」に該当すると判断した。
その他の記載内容
その他の記載内容は、有価証券報告書に含まれる情報のうち、連結財務諸表及び財務諸表並びにこれらの監査報告書
以外の情報である。経営者の責任は、その他の記載内容を作成し開示することにある。また、監査等委員会の責任は、
その他の記載内容の報告プロセスの整備及び運用における取締役の職務の執行を監視することにある。
当監査法人の連結財務諸表に対する監査意見の対象にはその他の記載内容は含まれておらず、当監査法人はその他の
記載内容に対して意見を表明するものではない。
連結財務諸表監査における当監査法人の責任は、その他の記載内容を通読し、通読の過程において、その他の記載内
容と連結財務諸表又は当監査法人が監査の過程で得た知識との間に重要な相違があるかどうか検討すること、また、そ
のような重要な相違以外にその他の記載内容に重要な誤りの兆候があるかどうか注意を払うことにある。
当監査法人は、実施した作業に基づき、その他の記載内容に重要な誤りがあると判断した場合には、その事実を報告
することが求められている。
その他の記載内容に関して、当監査法人が報告すべき事項はない。
― 148 ―
連結財務諸表に対する経営者及び監査等委員会の責任
経営者の責任は、我が国において一般に公正妥当と認められる企業会計の基準に準拠して連結財務諸表を作成し適正
に表示することにある。これには、不正又は誤謬による重要な虚偽表示のない連結財務諸表を作成し適正に表示するた
めに経営者が必要と判断した内部統制を整備及び運用することが含まれる。
連結財務諸表を作成するに当たり、経営者は、継続企業の前提に基づき連結財務諸表を作成することが適切であるか
どうかを評価し、我が国において一般に公正妥当と認められる企業会計の基準に基づいて継続企業に関する事項を開示
する必要がある場合には当該事項を開示する責任がある。
監査等委員会の責任は、財務報告プロセスの整備及び運用における取締役の職務の執行を監視することにある。
連結財務諸表監査における監査人の責任
監査人の責任は、監査人が実施した監査に基づいて、全体としての連結財務諸表に不正又は誤謬による重要な虚偽表
示がないかどうかについて合理的な保証を得て、監査報告書において独立の立場から連結財務諸表に対する意見を表明
することにある。虚偽表示は、不正又は誤謬により発生する可能性があり、個別に又は集計すると、連結財務諸表の利
用者の意思決定に影響を与えると合理的に見込まれる場合に、重要性があると判断される。
監査人は、我が国において一般に公正妥当と認められる監査の基準に従って、監査の過程を通じて、職業的専門家と
しての判断を行い、職業的懐疑心を保持して以下を実施する。
・
不正又は誤謬による重要な虚偽表示リスクを識別し、評価する。また、重要な虚偽表示リスクに対応した監査手続
を立案し、実施する。監査手続の選択及び適用は監査人の判断による。さらに、意見表明の基礎となる十分かつ適切
な監査証拠を入手する。
・
連結財務諸表監査の目的は、内部統制の有効性について意見表明するためのものではないが、監査人は、リスク評
価の実施に際して、状況に応じた適切な監査手続を立案するために、監査に関連する内部統制を検討する。
・
経営者が採用した会計方針及びその適用方法の適切性、並びに経営者によって行われた会計上の見積りの合理性及
び関連する注記事項の妥当性を評価する。
・
経営者が継続企業を前提として連結財務諸表を作成することが適切であるかどうか、また、入手した監査証拠に基
づき、継続企業の前提に重要な疑義を生じさせるような事象又は状況に関して重要な不確実性が認められるかどうか
結論付ける。継続企業の前提に関する重要な不確実性が認められる場合は、監査報告書において連結財務諸表の注記
事項に注意を喚起すること、又は重要な不確実性に関する連結財務諸表の注記事項が適切でない場合は、連結財務諸
表に対して除外事項付意見を表明することが求められている。監査人の結論は、監査報告書日までに入手した監査証
拠に基づいているが、将来の事象や状況により、企業は継続企業として存続できなくなる可能性がある。
・
連結財務諸表の表示及び注記事項が、我が国において一般に公正妥当と認められる企業会計の基準に準拠している
かどうかとともに、関連する注記事項を含めた連結財務諸表の表示、構成及び内容、並びに連結財務諸表が基礎とな
る取引や会計事象を適正に表示しているかどうかを評価する。
・
連結財務諸表に対する意見表明の基礎となる、会社及び連結子会社の財務情報に関する十分かつ適切な監査証拠を
入手するために、連結財務諸表の監査を計画し実施する。監査人は、連結財務諸表の監査に関する指揮、監督及び査
閲に関して責任がある。監査人は、単独で監査意見に対して責任を負う。
監査人は、監査等委員会に対して、計画した監査の範囲とその実施時期、監査の実施過程で識別した内部統制の重要
な不備を含む監査上の重要な発見事項、及び監査の基準で求められているその他の事項について報告を行う。
監査人は、監査等委員会に対して、独立性についての我が国における職業倫理に関する規定を遵守したこと、並びに
監査人の独立性に影響を与えると合理的に考えられる事項、及び阻害要因を除去するための対応策を講じている場合又
は阻害要因を許容可能な水準にまで軽減するためのセーフガードを適用している場合はその内容について報告を行う。
監査人は、監査等委員会と協議した事項のうち、当連結会計年度の連結財務諸表の監査で特に重要であると判断した
事項を監査上の主要な検討事項と決定し、監査報告書において記載する。ただし、法令等により当該事項の公表が禁止
されている場合や、極めて限定的ではあるが、監査報告書において報告することにより生じる不利益が公共の利益を上
回ると合理的に見込まれるため、監査人が報告すべきでないと判断した場合は、当該事項を記載しない。
― 149 ―
<内部統制監査>
監査意見
当監査法人は、金融商品取引法第193条の2第2項の規定に基づく監査証明を行うため、株式会社東京精密の2026年3
月31日現在の内部統制報告書について監査を行った。
当監査法人は、株式会社東京精密が2026年3月31日現在の財務報告に係る内部統制は有効であると表示した上記の内
部統制報告書が、我が国において一般に公正妥当と認められる財務報告に係る内部統制の評価の基準に準拠して、財務
報告に係る内部統制の評価結果について、全ての重要な点において適正に表示しているものと認める。
監査意見の根拠
当監査法人は、我が国において一般に公正妥当と認められる財務報告に係る内部統制の監査の基準に準拠して内部統
制監査を行った。財務報告に係る内部統制の監査の基準における当監査法人の責任は、「内部統制監査における監査人
の責任」に記載されている。当監査法人は、我が国における職業倫理に関する規定(社会的影響度の高い事業体の財務
諸表監査に適用される規定を含む。)に従って、会社及び連結子会社から独立しており、また、監査人としてのその他
の倫理上の責任を果たしている。当監査法人は、意見表明の基礎となる十分かつ適切な監査証拠を入手したと判断して
いる。
内部統制報告書に対する経営者及び監査等委員会の責任
経営者の責任は、財務報告に係る内部統制を整備及び運用し、我が国において一般に公正妥当と認められる財務報告
に係る内部統制の評価の基準に準拠して内部統制報告書を作成し適正に表示することにある。
監査等委員会の責任は、財務報告に係る内部統制の整備及び運用状況を監視、検証することにある。
なお、財務報告に係る内部統制により財務報告の虚偽の記載を完全には防止又は発見することができない可能性があ
る。
内部統制監査における監査人の責任
監査人の責任は、監査人が実施した内部統制監査に基づいて、内部統制報告書に重要な虚偽表示がないかどうかにつ
いて合理的な保証を得て、内部統制監査報告書において独立の立場から内部統制報告書に対する意見を表明することに
ある。
監査人は、我が国において一般に公正妥当と認められる財務報告に係る内部統制の監査の基準に従って、監査の過程
を通じて、職業的専門家としての判断を行い、職業的懐疑心を保持して以下を実施する。
・
内部統制報告書における財務報告に係る内部統制の評価結果について監査証拠を入手するための監査手続を実施す
る。内部統制監査の監査手続は、監査人の判断により、財務報告の信頼性に及ぼす影響の重要性に基づいて選択及び
適用される。
・
財務報告に係る内部統制の評価範囲、評価手続及び評価結果について経営者が行った記載を含め、全体としての内
部統制報告書の表示を検討する。
・
内部統制報告書における財務報告に係る内部統制の評価結果に関する十分かつ適切な監査証拠を入手するために、
内部統制の監査を計画し実施する。監査人は、内部統制報告書の監査に関する指揮、監督及び査閲に関して責任があ
る。監査人は、単独で監査意見に対して責任を負う。
監査人は、監査等委員会に対して、計画した内部統制監査の範囲とその実施時期、内部統制監査の実施結果、識別し
た内部統制の開示すべき重要な不備、その是正結果、及び内部統制の監査の基準で求められているその他の事項につい
て報告を行う。
監査人は、監査等委員会に対して、独立性についての我が国における職業倫理に関する規定を遵守したこと、並びに
監査人の独立性に影響を与えると合理的に考えられる事項、及び阻害要因を除去するための対応策を講じている場合又
は阻害要因を許容可能な水準にまで軽減するためのセーフガードを適用している場合はその内容について報告を行う。
― 150 ―
<報酬関連情報>
当監査法人及び当監査法人と同一のネットワークに属する者に対する、会社及び子会社の監査証明業務に基づく報酬
及び非監査業務に基づく報酬の額は、「提出会社の状況」に含まれるコーポレート・ガバナンスの状況等 (3)【監査の
状況】に記載されている。
利害関係
会社及び連結子会社と当監査法人又は業務執行社員との間には、公認会計士法の規定により記載すべき利害関係はな
い。
以
(注) 1.上記の監査報告書の原本は当社(有価証券報告書提出会社)が別途保管しています。
2.XBRLデータは監査の対象には含まれていません。
― 151 ―
上
独立監査人の監査報告書
2026年6月19日
株式会社東京精密
取締役会
御中
EY新日本有限責任監査法人
東京事務所
指定有限責任社員
業務執行社員
公認会計士
寶
野
裕
昭
指定有限責任社員
業務執行社員
公認会計士
牧
野
幸
享
<財務諸表監査>
監査意見
当監査法人は、金融商品取引法第193条の2第1項の規定に基づく監査証明を行うため、「経理の状況」に掲げら
れている株式会社東京精密の2025年4月1日から2026年3月31日までの第103期事業年度の財務諸表、す
なわち、貸借対照表、損益計算書、株主資本等変動計算書、重要な会計方針、その他の注記及び附属明細表について監
査を行った。
当監査法人は、上記の財務諸表が、我が国において一般に公正妥当と認められる企業会計の基準に準拠して、株式会
社東京精密の2026年3月31日現在の財政状態及び同日をもって終了する事業年度の経営成績を、全ての重要な点
において適正に表示しているものと認める。
監査意見の根拠
当監査法人は、我が国において一般に公正妥当と認められる監査の基準に準拠して監査を行った。監査の基準におけ
る当監査法人の責任は、「財務諸表監査における監査人の責任」に記載されている。当監査法人は、我が国における職
業倫理に関する規定(社会的影響度の高い事業体の財務諸表監査に適用される規定を含む。)に従って、会社から独立
しており、また、監査人としてのその他の倫理上の責任を果たしている。当監査法人は、意見表明の基礎となる十分か
つ適切な監査証拠を入手したと判断している。
― 152 ―
監査上の主要な検討事項
監査上の主要な検討事項とは、当事業年度の財務諸表の監査において、監査人が職業的専門家として特に重要である
と判断した事項である。監査上の主要な検討事項は、財務諸表全体に対する監査の実施過程及び監査意見の形成におい
て対応した事項であり、当監査法人は、当該事項に対して個別に意見を表明するものではない。
半導体製造装置事業における売上高の期間帰属の適切性
監査上の主要な検討事項の
内容及び決定理由
監査上の対応
注記事項(損益計算書関係)に記載のとおり、株式会
当監査法人は、据付作業を伴う半導体製造装置の売上
社東京精密の当事業年度の損益計算書に計上されている
高(以下、半導体製造装置の売上高)の期間帰属の適切
売上高143,826百万円の83%を占める118,663百万円は、性を検討するため、主に以下の監査手続を実施した。
半導体製造装置セグメントの売上高であり、その主たる (1) 内部統制の評価
部分は需要家の工場における据付作業を伴うものであ
る。
半導体製造装置の売上高の計上に係る内部統制の整備
及び運用状況を評価した。評価に当たっては、特に半導
半導体製造装置事業は技術革新のテンポが速く、業界体製造装置の据付等の完了が確認できる証憑と照合する
特有の構造的な景気循環があり、製品自体にも高度な技 ことにより、適切な会計期間に帰属した売上高であるこ
術水準が求められる競争の激しい事業である。また、需
とを確認する統制に焦点を当てた。
要家は半導体の需給に応じ生産調整するため、装置の据 (2) 金額が多額な半導体製造装置の売上高について、以
付作業を実施する時期は需要家の内部及び外部経営環境
の影響を受ける。半導体製造装置事業の需要動向の変動
下の監査手続を実施した。
①
契約書もしくは注文書から取引内容を理解し、適
により、需要家から納期の延期などが要請され、装置の 切な方針により売上高が計上されていることを確かめ
据付作業が予定通りに実施できないケースが発生する可 た。
能性があり、売上計上時期の判断に慎重な検討が求めら
②
売上明細と、据付作業の社内報告書、需要家から
れることが想定された。さらに、据付作業を実施する半入手した据付作業完了の報告書、顧客からの発注書及び
導体製造装置売上は、1台あたりの金額が相対的に大き 請求書等とを照合し、据付の事実を確認し、適切な期間
くなる傾向にある。また、顧客への販売条件の関係で特 に売上が計上されていることを確かめた。
に期末月に据付等の完了が多く発生することから、期末
③
売上計上後に発生した原価のデータを閲覧し、売
月において売上高の期間帰属を誤った場合には財務数値上計上後に多額の原価が発生していないことを確かめ
に与える影響は大きいものとなる。
た。
以上から、当監査法人は、据付作業を伴う半導体製造
装置の売上高の期間帰属の適切性が、当事業年度の財務
諸表監査において特に重要であり、「監査上の主要な検
討事項」に該当すると判断した。
その他の記載内容
その他の記載内容は、有価証券報告書に含まれる情報のうち、連結財務諸表及び財務諸表並びにこれらの監査報告書
以外の情報である。経営者の責任は、その他の記載内容を作成し開示することにある。また、監査等委員会の責任は、
その他の記載内容の報告プロセスの整備及び運用における取締役の職務の執行を監視することにある。
当監査法人の財務諸表に対する監査意見の対象にはその他の記載内容は含まれておらず、当監査法人はその他の記載
内容に対して意見を表明するものではない。
財務諸表監査における当監査法人の責任は、その他の記載内容を通読し、通読の過程において、その他の記載内容と
財務諸表又は当監査法人が監査の過程で得た知識との間に重要な相違があるかどうか検討すること、また、そのような
重要な相違以外にその他の記載内容に重要な誤りの兆候があるかどうか注意を払うことにある。
当監査法人は、実施した作業に基づき、その他の記載内容に重要な誤りがあると判断した場合には、その事実を報告
することが求められている。
その他の記載内容に関して、当監査法人が報告すべき事項はない。
― 153 ―
財務諸表に対する経営者及び監査等委員会の責任
経営者の責任は、我が国において一般に公正妥当と認められる企業会計の基準に準拠して財務諸表を作成し適正に表
示することにある。これには、不正又は誤謬による重要な虚偽表示のない財務諸表を作成し適正に表示するために経営
者が必要と判断した内部統制を整備及び運用することが含まれる。
財務諸表を作成するに当たり、経営者は、継続企業の前提に基づき財務諸表を作成することが適切であるかどうかを
評価し、我が国において一般に公正妥当と認められる企業会計の基準に基づいて継続企業に関する事項を開示する必要
がある場合には当該事項を開示する責任がある。
監査等委員会の責任は、財務報告プロセスの整備及び運用における取締役の職務の執行を監視することにある。
財務諸表監査における監査人の責任
監査人の責任は、監査人が実施した監査に基づいて、全体としての財務諸表に不正又は誤謬による重要な虚偽表示が
ないかどうかについて合理的な保証を得て、監査報告書において独立の立場から財務諸表に対する意見を表明すること
にある。虚偽表示は、不正又は誤謬により発生する可能性があり、個別に又は集計すると、財務諸表の利用者の意思決
定に影響を与えると合理的に見込まれる場合に、重要性があると判断される。
監査人は、我が国において一般に公正妥当と認められる監査の基準に従って、監査の過程を通じて、職業的専門家と
しての判断を行い、職業的懐疑心を保持して以下を実施する。
・
不正又は誤謬による重要な虚偽表示リスクを識別し、評価する。また、重要な虚偽表示リスクに対応した監査手続
を立案し、実施する。監査手続の選択及び適用は監査人の判断による。さらに、意見表明の基礎となる十分かつ適切
な監査証拠を入手する。
・
財務諸表監査の目的は、内部統制の有効性について意見表明するためのものではないが、監査人は、リスク評価の
実施に際して、状況に応じた適切な監査手続を立案するために、監査に関連する内部統制を検討する。
・
経営者が採用した会計方針及びその適用方法の適切性、並びに経営者によって行われた会計上の見積りの合理性及
び関連する注記事項の妥当性を評価する。
・
経営者が継続企業を前提として財務諸表を作成することが適切であるかどうか、また、入手した監査証拠に基づき、
継続企業の前提に重要な疑義を生じさせるような事象又は状況に関して重要な不確実性が認められるかどうか結論付
ける。継続企業の前提に関する重要な不確実性が認められる場合は、監査報告書において財務諸表の注記事項に注意
を喚起すること、又は重要な不確実性に関する財務諸表の注記事項が適切でない場合は、財務諸表に対して除外事項
付意見を表明することが求められている。監査人の結論は、監査報告書日までに入手した監査証拠に基づいているが、
将来の事象や状況により、企業は継続企業として存続できなくなる可能性がある。
・
財務諸表の表示及び注記事項が、我が国において一般に公正妥当と認められる企業会計の基準に準拠しているかど
うかとともに、関連する注記事項を含めた財務諸表の表示、構成及び内容、並びに財務諸表が基礎となる取引や会計
事象を適正に表示しているかどうかを評価する。
監査人は、監査等委員会に対して、計画した監査の範囲とその実施時期、監査の実施過程で識別した内部統制の重要
な不備を含む監査上の重要な発見事項、及び監査の基準で求められているその他の事項について報告を行う。
監査人は、監査等委員会に対して、独立性についての我が国における職業倫理に関する規定を遵守したこと、並びに
監査人の独立性に影響を与えると合理的に考えられる事項、及び阻害要因を除去するための対応策を講じている場合又
は阻害要因を許容可能な水準にまで軽減するためのセーフガードを適用している場合はその内容について報告を行う。
監査人は、監査等委員会と協議した事項のうち、当事業年度の財務諸表の監査で特に重要であると判断した事項を監
査上の主要な検討事項と決定し、監査報告書において記載する。
ただし、法令等により当該事項の公表が禁止されている場合や、極めて限定的ではあるが、監査報告書において報告す
ることにより生じる不利益が公共の利益を上回ると合理的に見込まれるため、監査人が報告すべきでないと判断した場
合は、当該事項を記載しない。
― 154 ―
<報酬関連情報>
報酬関連情報は、連結財務諸表の監査報告書に記載されている。
利害関係
会社と当監査法人又は業務執行社員との間には、公認会計士法の規定により記載すべき利害関係はない。
以
(注) 1.上記の監査報告書の原本は当社(有価証券報告書提出会社)が別途保管しています。
2.XBRLデータは監査の対象には含まれていません。
― 155 ―
上
【表紙】
【提出書類】
内部統制報告書
【根拠条文】
金融商品取引法第24条の4の4第1項
【提出先】
関東財務局長
【提出日】
2026年6月19日
【会社名】
株式会社東京精密
【英訳名】
TOKYO SEIMITSU CO., LTD.
【代表者の役職氏名】
代表取締役社長CEO
木村龍一
【最高財務責任者の役職氏名】
執行役員常務CFO
小泉公人
【本店の所在の場所】
東京都八王子市石川町2968番地2
【縦覧に供する場所】
株式会社東京証券取引所
(東京都中央区日本橋兜町2番1号)
1 【財務報告に係る内部統制の基本的枠組みに関する事項】
当社代表取締役社長CEO 木村龍一及び執行役員常務CFO 小泉公人は、当社の財務報告に係る内部統制の整
備及び運用に責任を有しており、企業会計審議会の公表した「財務報告に係る内部統制の評価及び監査の基準並びに
財務報告に係る内部統制の評価及び監査に関する実施基準の改訂について(意見書)」に示されている内部統制の基本
的枠組みに準拠して財務報告に係る内部統制を整備及び運用しています。
なお、内部統制は、内部統制の各基本的要素が有機的に結びつき、一体となって機能することで、その目的を合理
的な範囲で達成しようとするものであり、このため、財務報告に係る内部統制により財務報告の虚偽の記載を完全に
は防止又は発見することができない可能性があります。
2 【評価の範囲、基準日及び評価手続に関する事項】
財務報告に係る内部統制の評価は、当連結会計年度の末日である2026年3月31日を基準日として行われており、評
価に当たっては、一般に公正妥当と認められる財務報告に係る内部統制の評価の基準に準拠しました。
本評価においては、連結ベースでの財務報告全体に重要な影響を及ぼす内部統制(全社的な内部統制)の評価を行っ
た上で、その結果を踏まえて、評価対象とする業務プロセスを選定しています。当該業務プロセスの評価においては、
選定された業務プロセスを分析した上で、財務報告の信頼性に重要な影響を及ぼす統制上の要点を識別し、当該統制
上の要点について整備及び運用状況を評価することによって、内部統制の有効性に関する評価を行いました。財務報
告に係る内部統制の評価の範囲は、当社及び連結子会社について、財務報告の信頼性に及ぼす影響の重要性の観点か
ら必要な範囲を決定しました。財務報告の信頼性に及ぼす影響の重要性は、金額的及び質的影響並びにその発生可能
性を考慮して決定しており、当社及び連結子会社6社を対象として行った全社的な内部統制の評価結果を踏まえ、業
務プロセスに係る内部統制の評価範囲を合理的に決定しました。なお、連結子会社10社については、金額的及び質的
影響並びにその発生可能性の観点から僅少であると判断し、全社的な内部統制の評価範囲には含めていません。
業務プロセスに係る内部統制の評価範囲については、当社グループは半導体製造装置及び計測機器の製造販売を主
な事業内容としており、事業活動の規模を表す指標として売上高が適切であると判断し、重要な事業拠点の選定にあ
たっては売上高(連結会社間取引消去後)を用いています。各事業拠点の連結会計年度の売上高(連結会社間取引消去
後)の金額が高い拠点から合算していき、連結会計年度の連結売上高の概ね2/3に達している1事業拠点を「重要な
事業拠点」としました。選定した重要な事業拠点においては、当社グループの事業の特性等を踏まえ、企業の事業目
的に大きく関わる勘定科目として売上高、売掛金及び棚卸資産に至る業務プロセスを評価の対象としました。
さらに、選定した重要な事業拠点にかかわらず、それ以外の事業拠点をも含めた範囲について、重要な虚偽記載の
発生可能性が高く、見積りや予測を伴う重要な勘定科目に係る業務プロセスやリスクが大きい取引を行っている事業
又は業務に係る業務プロセスを、財務報告への影響を勘案して重要性の大きい業務プロセスとして評価対象に追加し
ています。当連結会計年度においては、製品不具合対策引当金に係る業務プロセス等を個別に評価対象に追加しまし
た。
3 【評価結果に関する事項】
上記の評価の結果、当連結会計年度末日時点において、当社の財務報告に係る内部統制は有効であると判断しまし
た。
4 【付記事項】
該当事項はありません。
5 【特記事項】
該当事項はありません。
【表紙】
【提出書類】
確認書
【根拠条文】
金融商品取引法第24条の4の2第1項
【提出先】
関東財務局長
【提出日】
2026年6月19日
【会社名】
株式会社東京精密
【英訳名】
TОKYО
【代表者の役職氏名】
代表取締役社長CEО
木
村
龍
一
【最高財務責任者の役職氏名】
執行役員常務CFО
小
泉
公
人
【本店の所在の場所】
東京都八王子市石川町2968番地2
【縦覧に供する場所】
株式会社東京証券取引所
SEIMITSU
CО.,
(東京都中央区日本橋兜町2番1号)
LTD
1 【有価証券報告書の記載内容の適正性に関する事項】
当社代表取締役社長CEО 木村龍一及び当社執行役員常務CFО 小泉公人は、当社の第103期(自
1日
至
2025年4月
2026年3月31日)の有価証券報告書の記載内容が金融商品取引法令に基づき適正に記載されていることを確
認いたしました。
2 【特記事項】
確認に当たり、特記すべき事項はありません。

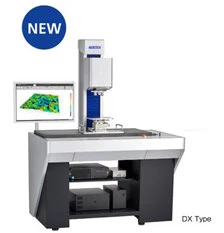
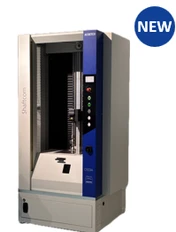
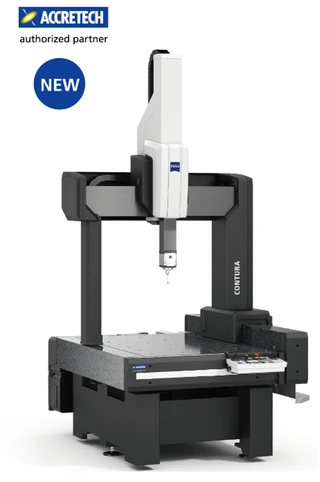
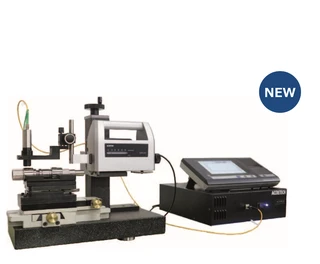
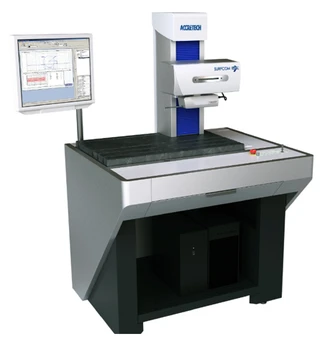

 (160KB)


