訂正発行登録書
Bull 0
Bear 0
Routine
Fiscal year ends March
Quarters are offset from the calendar — Q1 is Apr–Jun
|
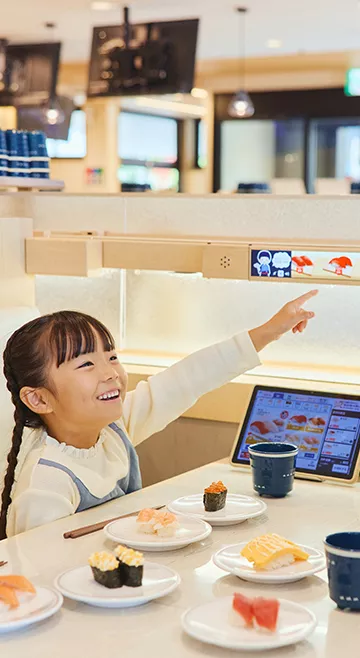
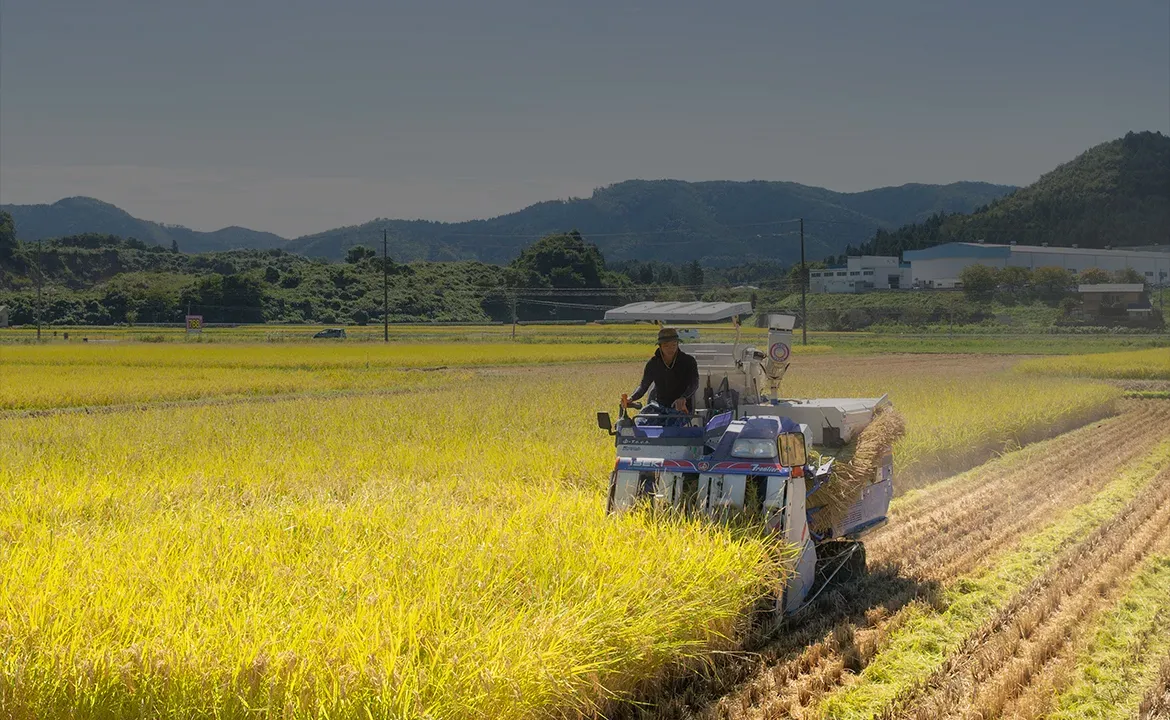
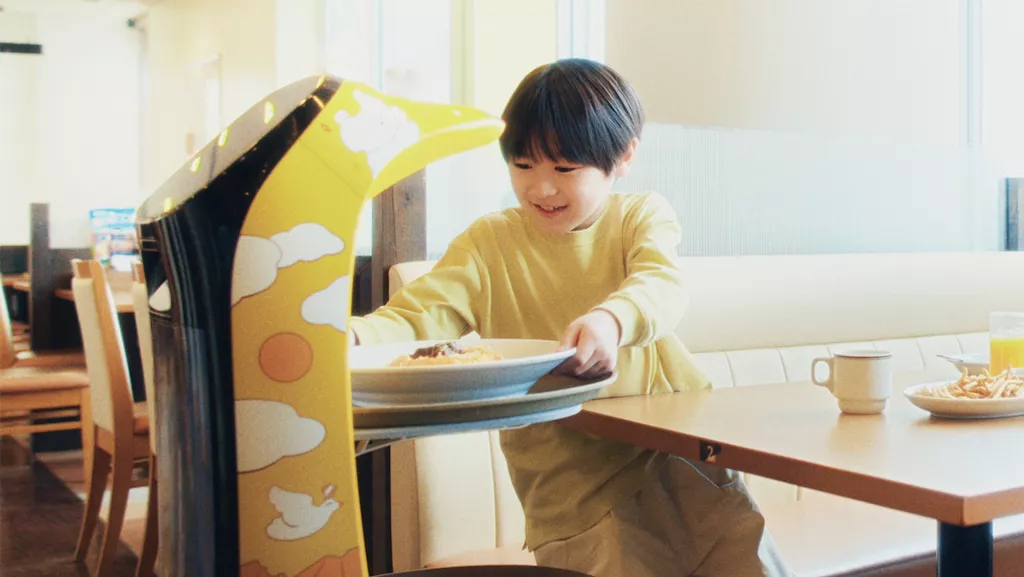
Zensho Holdings Co., Ltd. is a food service company operating a diversified portfolio of restaurant chains and retail businesses. Its core segments include the Global Sukiya segment, which operates the gyudon chain Sukiya in Japan, China, Southeast Asia, and Latin America; the Global Hamazushi segment, running the sushi chain Hamazushi in Japan and China; and the Global Mid-Meal segment, managing takeout sushi and Asian cuisine brands such as AFC, ZENSHI, sushicircle, SNOWFOX, and Taiko in Europe and the United States. The Global Fast Food segment features the oden and udon chain Nakau, the hamburger chain Zettai, and the ramen chain Denmaru, alongside The Chicken Rice Shop in Malaysia. The Restaurant segment includes the family restaurant CoCo's, the steakhouse Big Boy, the pasta chain Jolly Pasta, and the yakiniku restaurant Jukusei Yakiniku Ichiban. Additional operations comprise the retail segment with the supermarket Joy Mart and the produce distributor United Veggies, as well as support services provided by subsidiaries such as GFF for food manufacturing, Zensho Shoji for procurement, and Global Fresh Supply for logistics. The group also engages in elder care and agricultural production through subsidiaries like Teru and Zensho Rice. Summarised from the annual report, fiscal year ended Mar 2026 |
Industry Restaurants | Homepage zensho.co.jp |
| Sector Consumer Cyclical | IR page zensho.co.jp/jp/ir | |
|
Tags
gyudon, sushi, fast food, family restaurants, ramen, yakiniku, supermarkets, food logistics, elder care, franchise operations, Sukiya, Hamazushi, AFC, ZENSHI, sushicircle, SNOWFOX, Bento, Taiko, YO!, SNOWFRUIT, Nakau, Zettai, Denmaru, Katsu-an, Kuboiya, The Chicken Rice Shop, CoCo's, Big Boy, Victoria Station, Jolly Pasta, Jukusei Yakiniku Ichiban, Olive no Oka, Kayaya Yohhei, Joy Mart, United Veggies, GFF, Zensho Shoji, Global Fresh Supply, Techno Construction, Global Table Supply, Trona Japan, Sunvish, Teru, Zensho Rice, Advanced Fresh Concepts Corp., Sushi Circle Gastronomie GmbH, Wonderfield TopCo Limited, TCRS Restaurants Sdn.Bhd., ZENSHO (THAILAND) CO. LTD., ZENSHO DO BRASIL COMERCIO DE ALIMENTOS LTDA, Quansheng F&B (Shanghai) Co. Ltd., Taiwan Shan Shang Co. Ltd.
|
Press page zensho.co.jp/jp/news |
Metrics
| Valuation | |
|---|---|
| Market cap | ¥ 1.809T |
| Market cap (USD) | $ 11.306B |
| P/E | 31.05 |
| PEG | 0.61 |
| P/BV | 4.99 |
| P/S | 1.35 |
| P/OCF | 14.17 |
| P/FCF | 76.92 |
| Dividend yield | 0.71% |
| Turnover / mcap | — |
| Returns | |
|---|---|
| ROE | 15.7% |
| ROI | 8.0% |
| ROIC | 9.6% |
| Profit margin | 3.6% |
| Growth | |
|---|---|
| Revenue growing | Yes |
| Profits growing | Yes |
| Revenue up 3y | Yes |
| Revenue up 5y | Yes |
| Earnings growth 3y (net profit CAGR) | 51.2% |
| Quality | |
|---|---|
| Profitable | Yes |
| Margin expanding | No |
| Buying back stock | No |
| Diluting (TTM) | Yes |
| Debt/Equity | — |
| Podcast bulls (TTM) | Sign up |
| Podcast bears (TTM) | Sign up |
| Podcast sentiment (TTM) | Sign up |
| Podcast sentiment % (TTM) | Sign up |
| News sentiment (TTM) | 0 |
| Quality score | 5.6% |
| Insiders | |
|---|---|
| Buys, 1w | Sign up |
| Buys, 1m | Sign up |
| Buys, 1y | Sign up |
| Sells, 1w | Sign up |
| Sells, 1m | Sign up |
| Sells, 1y | Sign up |
Sign up to see this company's insider trades
| Figure | FY 2026 | FY 2025 | FY 2024 | FY 2023 | FY 2022 | FY 2021 | FY 2020 | FY 2019 | FY 2018 | FY 2017 | FY 2016 | FY 2015 | FY 2014 | FY 2013 |
|---|---|---|---|---|---|---|---|---|---|---|---|---|---|---|
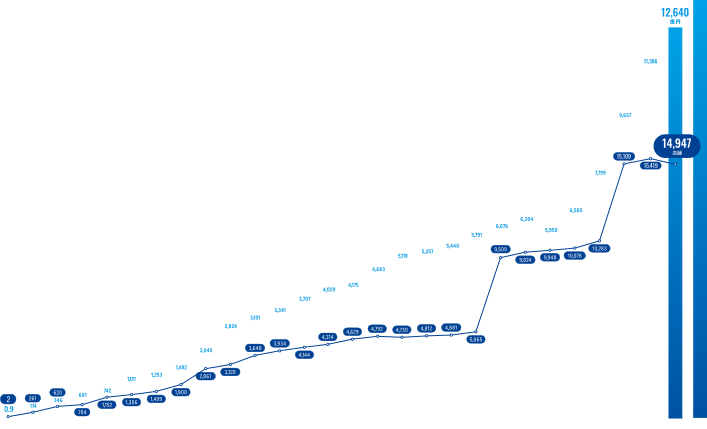
| Revenue | 1.264T | 1.137T | 965.778B | 779.964B | 658.503B | 595.048B | 630.435B | 607.679B | 579.108B | 544.028B | 525.709B | 511.81B | 468.377B | 417.577B |
| Net profit | 45.812B | 39.29B | 30.693B | 13.265B | 13.869B | 2.259B | 11.978B | 9.924B | 8.001B | 8.443B | 4.026B | -11.138B | 1.103B | 5.058B |
| Free cash flow | 20.754B | 15.158B | 43.89B | 20.578B | 16.654B | 8.265B | 8.565B | 10.319B | 13.142B | 16.593B | 8.49B | — | — | — |
| Figure | FY 2026 | FY 2025 | FY 2024 | FY 2023 | FY 2022 | FY 2021 | FY 2020 | FY 2019 | FY 2018 | FY 2017 | FY 2016 | FY 2015 | FY 2014 | FY 2013 |
|---|---|---|---|---|---|---|---|---|---|---|---|---|---|---|
| Share price | 9.18K | 8.053K | 6.444K | 3.928K | 2.862K | 2.832K | 2.062K | 2.563K | 2.423K | 1.865K | 1.348K | 1.011K | 1.011K | 1.241K |
| Price performance 12m | 0.14 | 0.25 | 0.64 | 0.37 | 0.01 | 0.37 | -0.2 | 0.06 | 0.3 | 0.38 | 0.33 | 0 | -0.19 | — |
Filed figures
Lines the statements and their notes report beside the headline figures, read from the filings' XBRL as filed (no restatement applied), with figures computed from one filing's own lines. Cash-flow lines carry their cash direction: an outflow is negative. Each period links to its filing; a figure's period, report date and tag are in its tooltip.
| Figure | Mar 2017 | Mar 2018 | Mar 2019 | Mar 2020 | Mar 2021 | Mar 2022 | Mar 2023 | Mar 2024 | Mar 2025 | Mar 2026 |
|---|---|---|---|---|---|---|---|---|---|---|
| Balance sheet detail | ||||||||||
| Trade receivables (JPY) | 6.4B | 8.14B | 14.3B | 13.9B | 22.4B | 24.5B | 28.7B | 46.7B | 53.3B | 58.7B |
| ↳ YoY growth | +17.6% | +27.2% | +75.8% | -2.6% | +60.7% | +9.2% | +17.5% | +62.5% | +14.1% | +10.0% |
| ↳ 5y CAGR | +32.7% | +30.8% | +28.7% | +26.7% | +30.8% | +21.2% | ||||
| Borrowings, current (JPY) | 51.1B | 38.1B | 27.9B | 26.7B | 57.5B | 29.8B | 23.8B | 34.3B | 36.8B | 26.5B |
| Borrowings, non-current (JPY) | 86.1B | 99B | 168B | 154B | 138B | 167B | 193B | 239B | 263B | 279B |
| Bonds payable (JPY) | 15.5B | 15.6B | 28.8B | 27.2B | 25.6B | 20B | 25B | 15B | 35B | 50B |
| Lease liabilities (JPY) | 11B | 13.2B | 16.4B | 20.8B | 33.2B | 33.6B | 35.7B | 56.3B | 66B | 85.7B |
| Cash and deposits (JPY) | 22.3B | 26.1B | 57.2B | 28.9B | 37.6B | 42.4B | 64.7B | 82.2B | 79.7B | 128B |
| Intangible assets (JPY) | 21.9B | 21.2B | 54.7B | 58.8B | 58.2B | 62.9B | 65.4B | 220B | 216B | 229B |
| Net debt (borrowings + leases - cash) (JPY) | 126B | 124B | 155B | 173B | 191B | 188B | 188B | 248B | 286B | 263B |
| Cash flow detail | ||||||||||
| Operating cash flow (JPY) | 37B | 37.2B | 33.1B | 33.6B | 29.7B | 45.4B | 53.1B | 86B | 79B | 101B |
| Purchases of property, plant and equipment (JPY) | -20B | -22.9B | -21.6B | -24B | -20.3B | -27.5B | -31B | -40.1B | -61.5B | -78B |
| Purchases of intangible assets (JPY) | -491M | -1.09B | -1.24B | -1.03B | -1.14B | -1.26B | -1.52B | -1.98B | -2.28B | -2.42B |
| Change in receivables (cash effect) (JPY) | -987M | -1.72B | -210M | 309M | -8.21B | -706M | -3.47B | -8.2B | -6.88B | -2.34B |
| Change in inventories (cash effect) (JPY) | -431M | 2.11B | -4.57B | -309M | 2.55B | -12.7B | -3.28B | -1.27B | -22.5B | -13.3B |
| Change in payables (cash effect) (JPY) | 609M | 314M | -851M | -2.37B | 4.1B | 1.16B | 1.69B | 3.32B | 13.3B | 1.23B |
| Dividends paid (cash effect) (JPY) | -2.08B | -2.67B | -2.63B | -2.8B | -3.06B | -3.19B | -3.48B | -5.6B | -11B | -12.6B |
| Share buybacks (cash effect) (JPY) | -2B | -4B | -2B | -2.5B | -3.57B | -13M | -1.08B | -6.8B | -10M | -1.91B |
| Interest paid (cash effect) (JPY) | -1.09B | -859M | -1.14B | -1.99B | -2.2B | -2.65B | -2.84B | -4B | -5.22B | -7.57B |
| Income taxes paid (cash effect) (JPY) | -4.43B | -6.5B | -3.54B | -6.85B | -4.87B | -4.78B | -18.5B | -5.2B | -22.8B | -28.5B |
| Operating cash flow before change in receivables (JPY) | 38B | 38.9B | 33.3B | 33.3B | 37.9B | 46.1B | 56.6B | 94.2B | 85.8B | 104B |
| Free cash flow (OCF - PPE - intangibles) (JPY) | 16.6B | 13.1B | 10.3B | 8.57B | 8.27B | 16.7B | 20.6B | 43.9B | 15.2B | 20.8B |
| Income detail | ||||||||||
| Research and development expense (JPY) | — | — | — | — | — | — | 556M | 682M | 485M | 945M |
| Total comprehensive income (JPY) | 11.3B | 6.94B | 9.74B | 8.59B | 5.32B | 22.1B | 18.2B | 40.8B | 37.3B | 66.4B |
| Comprehensive income to owners (JPY) | 10.4B | 6.41B | 9.31B | 8.93B | 5.4B | 22B | 18.1B | 40.8B | 37.3B | 66.4B |
| Segments | ||||||||||
| Global Fastfood · Segment revenue (JPY) | — | — | — | — | — | — | 155B | 244B | 314B | 113B |
| ↳ YoY growth | +57.2% | +28.9% | -64.1% | |||||||
| Global Fastfood · Segment operating income (JPY) | — | — | — | — | — | — | 7.32B | 14B | 29.2B | 3.31B |
| Global Hamazushi · Segment revenue (JPY) | — | — | — | — | — | — | 170B | 197B | 249B | 320B |
| ↳ YoY growth | +16.3% | +26.1% | +28.9% | |||||||
| Global Hamazushi · Segment operating income (JPY) | — | — | — | — | — | — | 8.42B | 11.4B | 21.4B | 26.8B |
| Global Prepared Food · Segment revenue (JPY) | — | — | — | — | — | — | — | — | 210B | 222B |
| ↳ YoY growth | +5.7% | |||||||||
| Global Prepared Food · Segment operating income (JPY) | — | — | — | — | — | — | — | — | 25.6B | 27.4B |
| Global Sukiya · Segment revenue (JPY) | — | — | — | — | — | — | 224B | 266B | 296B | 315B |
| ↳ YoY growth | +18.5% | +11.5% | +6.3% | |||||||
| Global Sukiya · Segment operating income (JPY) | — | — | — | — | — | — | 5.25B | 18.5B | 24.5B | 9.32B |
| Headoffice And Support · Segment revenue (JPY) | — | — | — | — | — | — | 312B | 359B | 413B | 492B |
| ↳ YoY growth | +14.8% | +15.1% | +19.2% | |||||||
| Headoffice And Support · Segment operating income (JPY) | — | — | — | — | — | — | 3.51B | 3.95B | -7.42B | 2.78B |
| Restaurant · Segment revenue (JPY) | — | — | — | — | — | — | 118B | 141B | 156B | 171B |
| ↳ YoY growth | +20.0% | +10.9% | +9.7% | |||||||
| Restaurant · Segment operating income (JPY) | — | — | — | — | — | — | -448M | 7.42B | 11.4B | 13B |
| Retail · Segment revenue (JPY) | — | — | — | — | — | — | 78.7B | 79B | 76.8B | 78B |
| ↳ YoY growth | +0.3% | -2.7% | +1.6% | |||||||
| Retail · Segment operating income (JPY) | — | — | — | — | — | — | -2.29B | -924M | -1.79B | -1.03B |
| Reported | Jun 30, 2017 | Jun 25, 2018 | Jun 24, 2019 | Jun 29, 2020 | Jun 28, 2021 | Jun 27, 2022 | Jun 28, 2024 | Jun 28, 2024 | Jun 25, 2026 | Jun 25, 2026 |
Sign up to see institutional holdings
Sign UpPodcast Mentions
Sign up to see podcast mentions and sentiment
Sign UpTimely disclosures published on TDnet, newest first, titles as filed in Japanese. The link opens the disclosure on TDnet. Filings with EDINET (periodic reports, extraordinary reports, offerings, holding and buy-back reports), newest first, titles as filed in Japanese. The link opens the filing on EDINET. Press releases from the company's own website, newest first.



























































Prompts
Click prompts to add them under the company line, click again to take one out, then copy the result into your AI chat. Shared by Asian Century Stocks and Uncovered Thai Stocks. Thank you.
Zensho Holdings Co., Ltd. (ticker 7550), listed in Japan.
Copied
ETFs Holding Zensho Holdings Co., Ltd.
Exchange-traded funds whose newest published daily portfolio holds one of the company's listings, largest weight first.
| ETF | Weight in ETF | Shares | Market value | As of |
|---|---|---|---|---|
| AVIV | 0.13% | 32,200 | $ 2.753M | Nov 16, 2026 |
| DIHP | 0.12% | 100,800 | $ 7.915M | Nov 12, 2026 |
| DFAI | 0.04% | 82,400 | $ 6.47M | Nov 12, 2026 |
| AVDE | 0.03% | 68,967 | $ 5.897M | Nov 16, 2026 |
| DXIV | 0.03% | 900 | $ 70.666K | Nov 12, 2026 |
| DFAX | 0.03% | 41,837 | $ 3.285M | Nov 12, 2026 |
| DFIC | 0.02% | 48,500 | $ 3.808M | Nov 12, 2026 |