|
Daiichikosho Co., Ltd. is a Japanese entertainment company that operates in the commercial karaoke sector. Its core business involves the sale and leasing of commercial karaoke equipment and the provision of audio and video content for networked karaoke systems. The company also manages karaoke rooms and food and beverage establishments, and engages in the production and sale of music and video software. The group serves domestic and international markets, including operations in Korea and China through subsidiaries. Key subsidiaries include Japan Crown Co., Ltd., Tokuma Japan Communications Co., Ltd., and Crest Co., Ltd., which support the music software and other business segments such as parking and real estate leasing. Summarised from the annual report, fiscal year ended Mar 2026 |
Industry Leisure | Homepage dkkaraoke.co.jp |
| Sector Consumer Cyclical | IR page dkkaraoke.co.jp | |
|
Tags
karaoke equipment, karaoke rooms, music software, video content, food and beverage, networked karaoke, commercial entertainment, Japan Crown Co. Ltd., Tokuma Japan Communications Co. Ltd., Crest Co. Ltd., DK Finance Co. Ltd., Korea Daiichikosho Co. Ltd., Daiichikosho (Shanghai) Electronics Co. Ltd.
|
Press page dkkaraoke.co.jp/news/newsletter |
Metrics
| Valuation | |
|---|---|
| Market cap | ¥ 189.69B |
| Market cap (USD) | $ 1.186B |
| P/E | 11.36 |
| PEG | 0.47 |
| P/BV | 1.47 |
| P/S | 1.14 |
| P/OCF | 6.46 |
| P/FCF | 20.53 |
| Dividend yield | 3.7% |
| Turnover / mcap | — |
| Returns | |
|---|---|
| ROE | 13.1% |
| ROI | 8.8% |
| ROIC | 6.8% |
| Profit margin | 9.8% |
| Growth | |
|---|---|
| Revenue growing | Yes |
| Profits growing | No |
| Revenue up 3y | Yes |
| Revenue up 5y | Yes |
| Earnings growth 3y (net profit CAGR) | 24.1% |
| Quality | |
|---|---|
| Profitable | Yes |
| Margin expanding | No |
| Buying back stock | Yes |
| Diluting (TTM) | No |
| Debt/Equity | — |
| Podcast bulls (TTM) | Sign up |
| Podcast bears (TTM) | Sign up |
| Podcast sentiment (TTM) | Sign up |
| Podcast sentiment % (TTM) | Sign up |
| News sentiment (TTM) | 6 |
| Quality score | 44.4% |
| Insiders | |
|---|---|
| Buys, 1w | Sign up |
| Buys, 1m | Sign up |
| Buys, 1y | Sign up |
| Sells, 1w | Sign up |
| Sells, 1m | Sign up |
| Sells, 1y | Sign up |
Sign up to see this company's insider trades
| Figure | FY 2026 | FY 2025 | FY 2024 | FY 2023 | FY 2022 | FY 2021 | FY 2020 | FY 2019 | FY 2018 | FY 2017 | FY 2016 | FY 2015 | FY 2014 | FY 2013 |
|---|---|---|---|---|---|---|---|---|---|---|---|---|---|---|
| Revenue | 162.95B | 153.02B | 146.746B | 128.156B | 94.787B | 93.316B | 146.297B | 143.833B | 141.37B | 140.64B | 141.31B | 133.111B | 130.587B | 128.901B |
| Net profit | 15.889B | 18.178B | 12.568B | 8.32B | 5.196B | -18.782B | 12.555B | 15.6B | 13.115B | 11.115B | 12.599B | 13.65B | 13.084B | 12.819B |
| Free cash flow | 4.582B | 5.892B | -22.1B | 14.208B | 8.919B | -1.181B | 9.584B | 10.491B | 20.714B | 12.653B | 3.907B | — | — | — |
| Figure | FY 2026 | FY 2025 | FY 2024 | FY 2023 | FY 2022 | FY 2021 | FY 2020 | FY 2019 | FY 2018 | FY 2017 | FY 2016 | FY 2015 | FY 2014 | FY 2013 |
|---|---|---|---|---|---|---|---|---|---|---|---|---|---|---|
| Share price | 1.689K | 1.723K | 1.941K | 2.185K | 3.478K | 2.887K | 2.887K | 5.656K | 5.635K | 4.471K | 4.906K | 3.734K | 3.125K | 2.529K |
| Price performance 12m | -0.02 | -0.11 | -0.11 | -0.37 | 0.2 | 0 | -0.49 | 0 | 0.26 | -0.09 | 0.31 | 0.19 | 0.24 | — |
Filed figures
Lines the statements and their notes report beside the headline figures, read from the filings' XBRL as filed (no restatement applied), with figures computed from one filing's own lines. Cash-flow lines carry their cash direction: an outflow is negative. Each period links to its filing; a figure's period, report date and tag are in its tooltip.
| Figure | Mar 2017 | Mar 2018 | Mar 2019 | Mar 2020 | Mar 2021 | Mar 2022 | Mar 2023 | Mar 2024 | Mar 2025 | Mar 2026 |
|---|---|---|---|---|---|---|---|---|---|---|
| Balance sheet detail | ||||||||||
| Trade receivables (JPY) | 6.79B | 5.13B | 5.21B | 4.76B | 3.55B | 4.13B | 5.37B | 5.89B | 5.99B | 6.99B |
| ↳ YoY growth | -4.5% | -24.4% | +1.4% | -8.6% | -25.5% | +16.4% | +30.1% | +9.8% | +1.6% | +16.7% |
| ↳ 5y CAGR | -13.0% | -9.5% | +0.9% | +2.5% | +4.7% | +14.5% | ||||
| Borrowings, current (JPY) | 17.7B | 4.02B | 9.76B | 2.79B | 18B | 6.1B | 13.5B | 12.9B | 12.4B | 3.2B |
| Borrowings, non-current (JPY) | 19.8B | 19.1B | 11.9B | 11B | 32.1B | 41.7B | 31.1B | 51.5B | 41.1B | 51.7B |
| Bonds payable (JPY) | 10B | 6.5B | 6.5B | — | — | — | — | — | — | — |
| Cash and deposits (JPY) | 62B | 45.5B | 57.2B | 48B | 68.5B | 68.2B | 71.8B | 49.7B | 41.9B | 48.8B |
| Intangible assets (JPY) | 7.13B | 10.3B | 10.4B | 10.2B | 6.23B | 6.86B | 6.66B | 11.3B | 11B | 13.6B |
| Net debt (borrowings + leases - cash) (JPY) | -24.6B | -22.4B | -35.5B | -34.2B | -18.4B | -20.4B | -27.2B | 14.7B | 11.6B | 6.04B |
| Cash flow detail | ||||||||||
| Operating cash flow (JPY) | 33.1B | 33.3B | 30.2B | 28.2B | 7.76B | 18.2B | 24.9B | 26.8B | 24.7B | 25.1B |
| Purchases of property, plant and equipment (JPY) | -16.8B | -12.6B | -15.3B | -14.3B | -5.8B | -6.26B | -7.46B | -45.7B | -15.1B | -16.8B |
| Purchases of intangible assets (JPY) | -3.59B | -3.88B | -4.47B | -4.22B | -3.14B | -2.99B | -3.2B | -3.17B | -3.71B | -3.72B |
| Change in receivables (cash effect) (JPY) | 318M | 1.69B | -77M | 434M | 1.5B | -554M | -1.23B | -714M | -125M | -918M |
| Change in inventories (cash effect) (JPY) | 41M | -69M | 784M | -2.32B | -1.07B | 1.36B | -4.14B | 404M | -2.54B | -204M |
| Change in payables (cash effect) (JPY) | -680M | 18M | 48M | 1.47B | -2.52B | 7M | 2.33B | -663M | -430M | -1.57B |
| Dividends paid (cash effect) (JPY) | -6.21B | -6.28B | -6.38B | -6.31B | -6.36B | -6.16B | -6.17B | -6.1B | -6.04B | -5.93B |
| Share buybacks (cash effect) (JPY) | -2.17B | -1B | -1.68B | -1.72B | -6.37B | 0.00 | 0.00 | -6B | -4B | -1.88B |
| Interest paid (cash effect) (JPY) | -278M | -321M | -160M | -115M | -198M | -199M | -173M | -138M | -431M | -415M |
| Income taxes paid (cash effect) (JPY) | -6.89B | -6.11B | -8.11B | -9.84B | -2.01B | -1.03B | -2.79B | -4.72B | -7.32B | -7.95B |
| Operating cash flow before change in receivables (JPY) | 32.8B | 31.6B | 30.3B | 27.7B | 6.26B | 18.7B | 26.1B | 27.5B | 24.8B | 26B |
| Free cash flow (OCF - PPE - intangibles) (JPY) | 12.7B | 16.8B | 10.5B | 9.58B | -1.18B | 8.92B | 14.2B | -22.1B | 5.89B | 4.58B |
| Income detail | ||||||||||
| Total comprehensive income (JPY) | 14.4B | 13.5B | 15.3B | 11.6B | -17.5B | 5.17B | 9.02B | 13.3B | 18.8B | 15.2B |
| Comprehensive income to owners (JPY) | 14.3B | 13.4B | 15.2B | 11.5B | -17.6B | 5.14B | 8.98B | 13.2B | 18.8B | 15B |
| Provision for credit losses (JPY) | — | — | — | — | 64M | — | — | — | — | — |
| Credit cost ratio (credit losses / average receivables) (%) | — | — | — | — | 1.5% | — | — | — | — | — |
| Reported | Jun 27, 2017 | Jun 26, 2018 | Jun 25, 2019 | Jun 30, 2020 | Jun 29, 2021 | Jun 28, 2022 | Jun 27, 2023 | Jun 25, 2024 | Jun 24, 2025 | Jun 25, 2026 |
Sign up to see institutional holdings
Sign UpPodcast Mentions
Sign up to see podcast mentions and sentiment
Sign UpTimely disclosures published on TDnet, newest first, titles as filed in Japanese. The link opens the disclosure on TDnet. Filings with EDINET (periodic reports, extraordinary reports, offerings, holding and buy-back reports), newest first, titles as filed in Japanese. The link opens the filing on EDINET. Press releases from the company's own website, newest first.






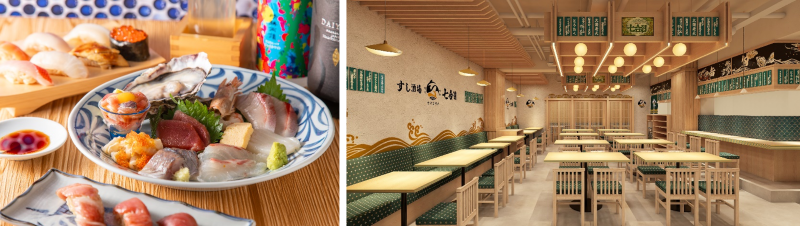
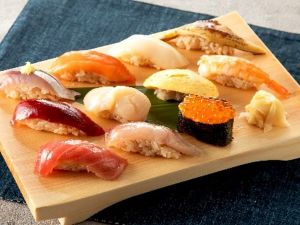 Various Sushi: ¥99–¥759
 We want everyone to try it, so we set the price as low as possible
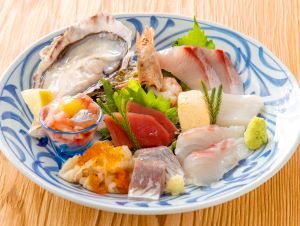
Assorted Sashimi Platter: ¥1,639
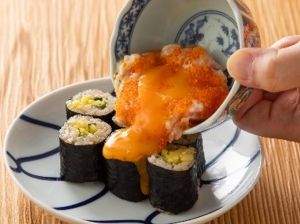 Local Specialty: Drinkable Torotaku Roll: ¥869
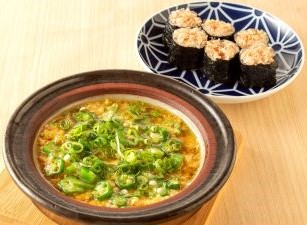 Various sushi restaurant ajillo dishes served with sushi rolls
From 869 yen
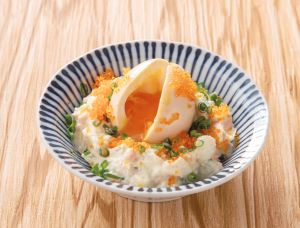 Gyo-Raiko! Potato Salad: ¥649
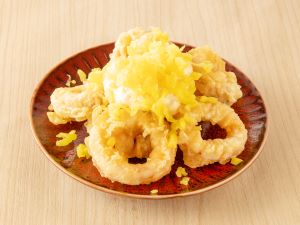 Squid Ring Tempura with Takuan Tartar Sauce: ¥649
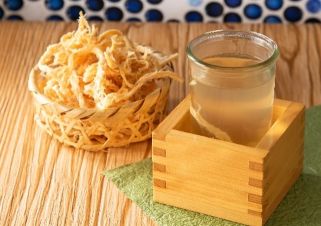 Sushi restaurant dashi-mixed drinks (sake and shochu)
539 yen
 Assorted shochu and oolong tea highballs
429 yen






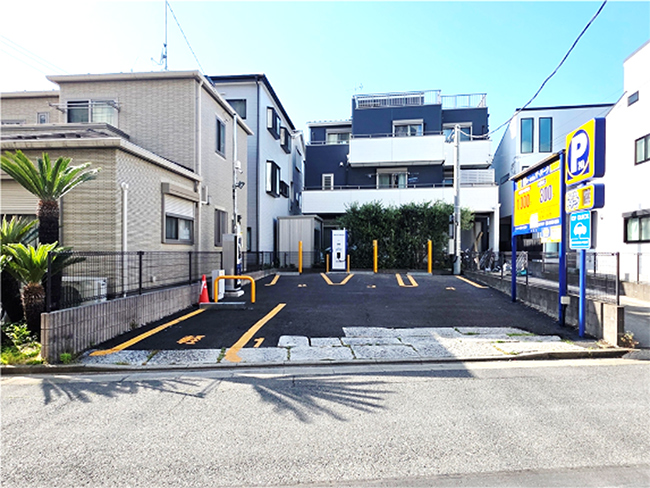
 50kW output fast charger



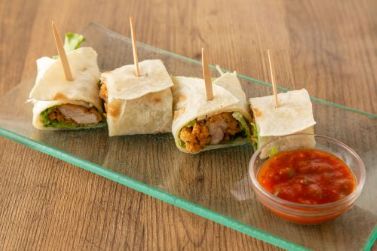 Fried chicken roll pintxos
605 yen
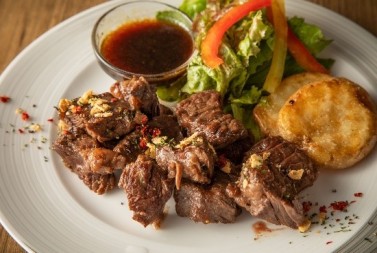 Diced steak from Angus beef skirt
1,859 yen
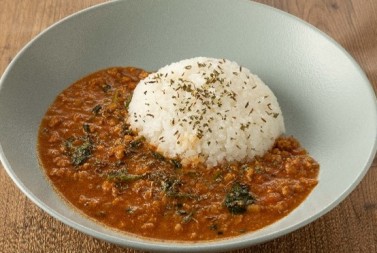 REGALO Special! Authentic Spice Curry
1,155 yen
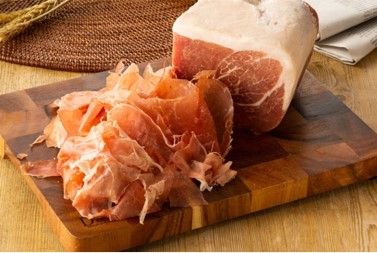 Carved Jamón Serrano (Image)
913 yen
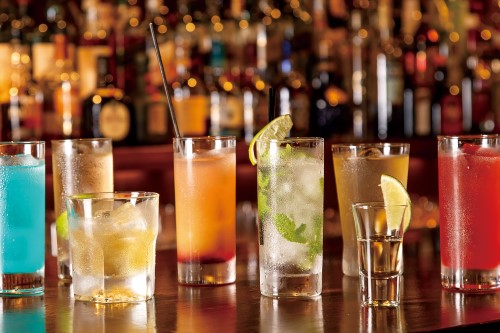 Various drinks
From 495 yen
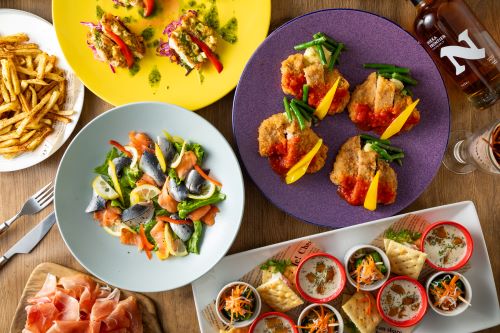 Various Party Packages (Concept)
All-you-can-drink for 2 hours, all-you-can-throw 4,400 yen~



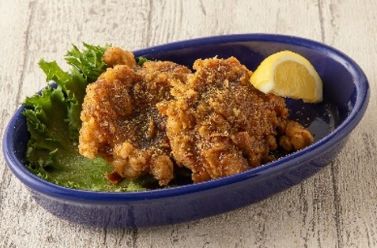 Homemade fried chicken, 2 pieces
550 yen
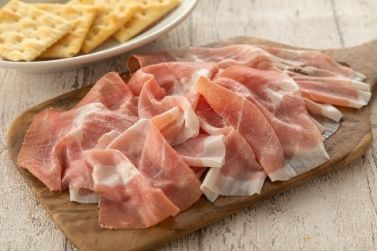 Carved Jamón Serrano (Image)
935 yen
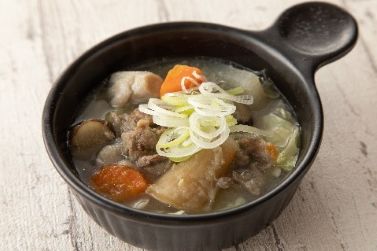 Salt-braised stew that pairs well with highballs
649 yen
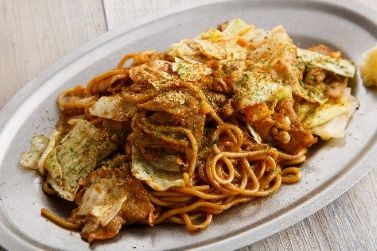 Special Yakisoba
869 yen
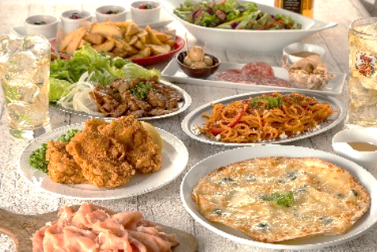 Party course with all-you-can-drink option
From 3,300 yen
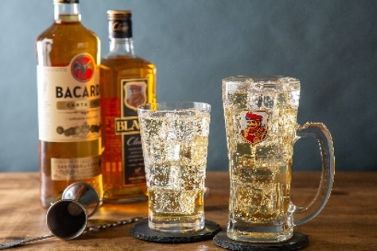 Various highballs
From 517 yen
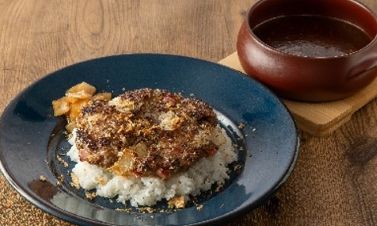 Specialty! Crumbled Coarsely Ground Hamburger Curry
1,190 yen
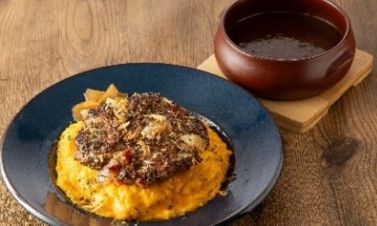 Omelet with Crumbled Coarsely Ground Hamburger Curry
1,490 yen
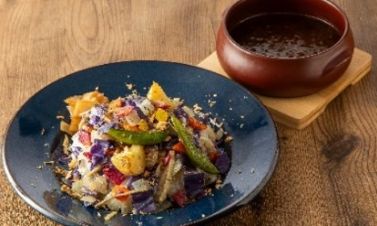 Half a Day's Serving of Vegetable Curry
1,090 yen

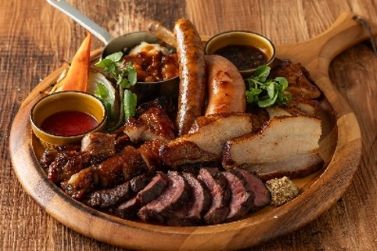 Seven-item meat platter
3,839 yen
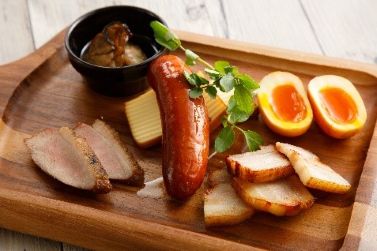 Assortment of six house-smoked items
1,639 yen
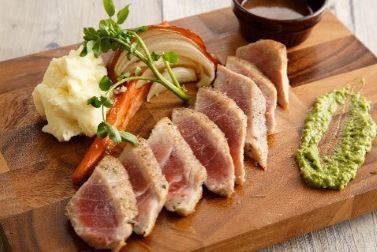 Medium Fatty Tuna Rare Steak
1,309 yen
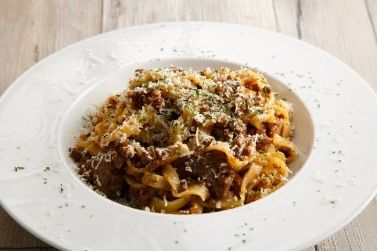 Rich beef ragù pasta for grown-ups
869 yen
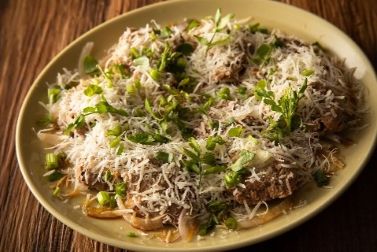 Sous Vide Chicken Liver Carpaccio
¥2,739
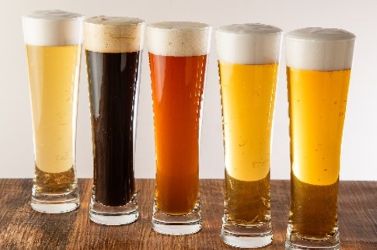 Craft Beer
Small: From ¥649 / Large: From ¥869
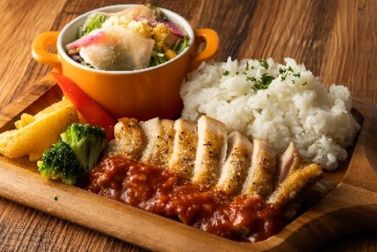 Weekly Meat Plate
1,090 yen
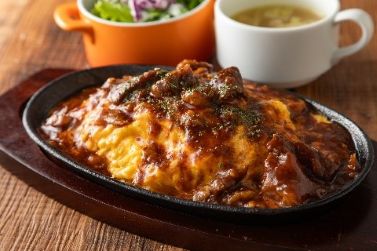 Sizzling Cheese Omelet Rice with Beef Tendon Braised in Red Wine
1,390 yen
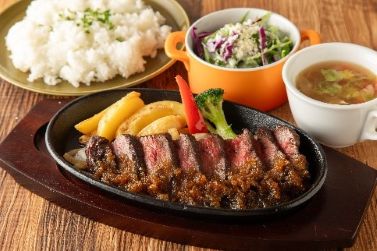 Hanging Tender Steak with Onion Sauce
¥1,690




Prompts
Click prompts to add them under the company line, click again to take one out, then copy the result into your AI chat. Shared by Asian Century Stocks and Uncovered Thai Stocks. Thank you.
ETFs Holding Daiichikosho Co., Ltd.
Exchange-traded funds whose newest published daily portfolio holds one of the company's listings, largest weight first.
| ETF | Weight in ETF | Shares | Market value | As of |
|---|---|---|---|---|
| AVDV | 0.09% | 1,439,900 | $ 16.635M | Nov 16, 2026 |
| AVDS | 0.04% | 11,500 | $ 132.861K | Nov 16, 2026 |
| DXIV | 0.03% | 6,100 | $ 69.278K | Nov 12, 2026 |
| DFIS | 0.02% | 112,764 | $ 1.281M | Nov 12, 2026 |
| AVSD | 0.02% | 7,200 | $ 83.182K | Nov 16, 2026 |
| DFIC | 0.01% | 137,865 | $ 1.566M | Nov 12, 2026 |
| AVDE | 0.01% | 129,100 | $ 1.492M | Nov 16, 2026 |
| DFAX | 0.01% | 62,100 | $ 705.276K | Nov 12, 2026 |
| DFAI | 0.00% | 43,300 | $ 491.762K | Nov 12, 2026 |