自己株式の取得状況に関するお知らせ
Bull 1
Bear 0
Capital return
7435
Fiscal year ends April
Quarters are offset from the calendar — Q1 is May–Jul
|
Nadex Co., Ltd. is a Japanese industrial solutions provider specializing in resistance welding control devices, which hold a top market share in the domestic automotive industry. The company operates through five business segments: Process Solutions, offering laser processing, dissimilar material joining, and IT-based manufacturing techniques; Factory Automation, providing robotics and FA systems for labor-saving and automation; System Integration, delivering customized production systems from concept to implementation; Control Components, selling electronic and electrical control parts along with board design and control panel manufacturing; and Smart Energy, focusing on EV charging station construction and monitoring systems. Key subsidiaries include N.Dex Products, Tamari Kogyo, N.Y.TEC, Techno System, Welding Technology Corp., Uptime EV Charger, Inc., Nadex Mexicana, and various entities in China and Southeast Asia. The company serves the automotive sector and broader manufacturing industries across Japan, North America, China, and Southeast Asia. Summarised from the annual report, fiscal year ended Apr 2026 |
Industry Specialty Industrial Machinery | Homepage nadex.co.jp |
| Sector Industrials | IR page nadex.co.jp | |
|
Tags
resistance welding, laser processing, robotics, factory automation, system integration, ev charging, control components, automotive manufacturing, dissimilar material joining, N.Dex Products, Tamari Kogyo, N.Y.TEC, Techno System, Fujix, Hangzhou Fujix Machinery Manufacturing Co. Ltd., Welding Technology Corp., Uptime EV Charger Inc., Nadex Mexicana S.A. de C.V., Naden Jushu Equipment (Shanghai) Co. Ltd., Nadex Engineering Co. Ltd., Nadex (Thailand) Co. Ltd., PT. Nadesco Indonesia, PT. Nadesco Engineering Indonesia
|
Press page nadex.co.jp/news |
Metrics
| Valuation | |
|---|---|
| Market cap | ¥ 12.523B |
| Market cap (USD) | $ 78.27M |
| P/E | 17.54 |
| PEG | — |
| P/BV | 0.61 |
| P/S | 0.34 |
| P/OCF | 4.52 |
| P/FCF | 6.43 |
| Dividend yield | 2.2% |
| Turnover / mcap | — |
| Returns | |
|---|---|
| ROE | 3.3% |
| ROI | 3.2% |
| ROIC | 3.2% |
| Profit margin | 1.8% |
| Growth | |
|---|---|
| Revenue growing | No |
| Profits growing | No |
| Revenue up 3y | No |
| Revenue up 5y | No |
| Earnings growth 3y (net profit CAGR) | -20.5% |
| Quality | |
|---|---|
| Profitable | Yes |
| Margin expanding | Yes |
| Buying back stock | Yes |
| Diluting (TTM) | No |
| Debt/Equity | — |
| Podcast bulls (TTM) | Sign up |
| Podcast bears (TTM) | Sign up |
| Podcast sentiment (TTM) | Sign up |
| Podcast sentiment % (TTM) | Sign up |
| News sentiment (TTM) | 3 |
| Quality score | -16.7% |
| Insiders | |
|---|---|
| Buys, 1w | Sign up |
| Buys, 1m | Sign up |
| Buys, 1y | Sign up |
| Sells, 1w | Sign up |
| Sells, 1m | Sign up |
| Sells, 1y | Sign up |
Sign up to see this company's insider trades
| Figure | FY 2026 | FY 2025 | FY 2024 | FY 2023 | FY 2022 | FY 2021 | FY 2020 | FY 2019 | FY 2018 | FY 2017 | FY 2016 | FY 2015 | FY 2014 | FY 2013 |
|---|---|---|---|---|---|---|---|---|---|---|---|---|---|---|
| Revenue | 36.838B | 36.891B | 34.389B | 36.163B | 34.581B | 30.736B | 31.379B | 32.913B | 34.284B | 31.134B | 30.278B | 31.41B | 22.964B | 18.846B |
| Net profit | 659.721M | 251.788M | 813.946M | 1.315B | 935.092M | 560.204M | 574.138M | 1.107B | 1.457B | 1.256B | 719.463M | 1.393B | 718.68M | 1.029B |
| Free cash flow | 1.946B | 1.436B | -167.253M | 503.822M | 439.604M | 1.3B | 455.134M | -294.688M | 4.866B | 243.932M | 718.301M | — | — | — |
| Figure | FY 2026 | FY 2025 | FY 2024 | FY 2023 | FY 2022 | FY 2021 | FY 2020 | FY 2019 | FY 2018 | FY 2017 | FY 2016 | FY 2015 | FY 2014 | FY 2013 |
|---|---|---|---|---|---|---|---|---|---|---|---|---|---|---|
| Share price | 1.068K | 880.88 | 1.066K | 1.009K | 658.54 | 713.86 | 662.61 | 851.37 | 1.235K | 758.88 | 479.46 | 979.27 | 601.43 | 537.39 |
| Price performance 12m | 0.21 | -0.17 | 0.06 | 0.53 | -0.08 | 0.08 | -0.22 | -0.31 | 0.63 | 0.58 | -0.51 | 0.63 | 0.12 | — |
Filed figures
Lines the statements and their notes report beside the headline figures, read from the filings' XBRL as filed (no restatement applied), with figures computed from one filing's own lines. Cash-flow lines carry their cash direction: an outflow is negative. Each period links to its filing; a figure's period, report date and tag are in its tooltip.
| Figure | Apr 2017 | Apr 2018 | Apr 2019 | Apr 2020 | Apr 2021 | Apr 2022 | Apr 2023 | Apr 2024 | Apr 2025 | Apr 2026 |
|---|---|---|---|---|---|---|---|---|---|---|
| Balance sheet detail | ||||||||||
| Trade receivables (JPY) | 9.97B | 9.83B | 9.76B | 9.66B | 8.93B | 18.8B | 17.9B | 19B | 19B | 16.3B |
| ↳ YoY growth | +4.9% | -1.4% | -0.6% | -1.1% | -7.5% | +110.1% | -4.5% | +6.0% | +0.1% | -14.0% |
| ↳ 5y CAGR | -1.2% | +13.5% | +12.8% | +14.2% | +14.5% | +12.9% | ||||
| Borrowings, current (JPY) | 626M | 415M | 256M | 2.63B | 355M | 314M | 293M | 1.24B | 230M | 20M |
| Borrowings, non-current (JPY) | 35.3M | — | — | 1.71B | 1.23B | 921M | 408M | 168M | 38.3M | 18.3M |
| Lease liabilities (JPY) | 133M | 39.4M | 3.47M | 36.4M | 48.7M | 33.3M | 35M | 117M | 83.9M | 57.5M |
| Cash and deposits (JPY) | 4.05B | 6.66B | 5.93B | 6.2B | 5.2B | 4.87B | 5.08B | 4.48B | 3.63B | 4.76B |
| Intangible assets (JPY) | 1.23B | 898M | 712M | 2.86B | 2.46B | 2.13B | 1.64B | 1.37B | 1.55B | 1.52B |
| Net debt (borrowings + leases - cash) (JPY) | -3.25B | -6.2B | -5.67B | -1.82B | -3.56B | -3.6B | -4.34B | -2.96B | -3.28B | -4.67B |
| Cash flow detail | ||||||||||
| Operating cash flow (JPY) | 578M | 5.08B | -156M | 972M | 1.48B | 921M | 730M | 41.6M | 2.03B | 2.77B |
| Purchases of property, plant and equipment (JPY) | -292M | -212M | -139M | -447M | -180M | -481M | -226M | -209M | -399M | -564M |
| Purchases of intangible assets (JPY) | -41.8M | -42.8M | -41.6M | -70.7M | -52.3M | -81M | -41.4M | -24M | -192M | -262M |
| Change in receivables (cash effect) (JPY) | -490M | 122M | 91.6M | 660M | 835M | -1.92B | 194M | -256M | -137M | 2.32B |
| Change in inventories (cash effect) (JPY) | 38.7M | -465M | -288M | -278M | 419M | -869M | -490M | -856M | 480M | 953M |
| Change in payables (cash effect) (JPY) | -1.51B | 2.99B | -1.72B | -1.22B | -362M | 1.44B | -725M | 44.2M | -7.92M | -1.25B |
| Dividends paid (cash effect) (JPY) | -149M | -315M | -415M | -314M | -111M | -214M | -344M | -398M | -308M | -287M |
| Share buybacks (cash effect) (JPY) | -96,000 | -100M | — | — | — | — | -37,000 | -700M | -401M | -387M |
| Interest paid (cash effect) (JPY) | -14.2M | -8.49M | -2.35M | -8.52M | -15.6M | -15.8M | -6.77M | -8.55M | -10.3M | -8.23M |
| Income taxes paid (cash effect) (JPY) | -450M | -818M | -722M | -349M | -292M | -588M | -598M | -779M | -291M | -935M |
| Operating cash flow before change in receivables (JPY) | 1.07B | 4.96B | -247M | 312M | 645M | 2.84B | 535M | 298M | 2.16B | 450M |
| Free cash flow (OCF - PPE - intangibles) (JPY) | 244M | 4.82B | -336M | 455M | 1.25B | 359M | 462M | -191M | 1.44B | 1.95B |
| Income detail | ||||||||||
| Research and development expense (JPY) | 373M | 404M | 344M | 381M | 347M | 376M | 355M | 363M | 240M | 164M |
| ↳ 5y CAGR | -3.9% | +0.2% | -2.6% | +1.1% | -8.8% | -13.9% | ||||
| Total comprehensive income (JPY) | 1.34B | 1.47B | 1.19B | 457M | 907M | 1.48B | 1.82B | 1.78B | 34.1M | 2.31B |
| Comprehensive income to owners (JPY) | 1.34B | 1.46B | 1.16B | 386M | 911M | 1.47B | 1.8B | 1.77B | -198,000 | 2.2B |
| Provision for credit losses (JPY) | -3.07M | 817,000 | 131,000 | 2.63M | 86,000 | 5.33M | 7.36M | 2.71M | 61.1M | -26.4M |
| Credit cost ratio (credit losses / average receivables) (%) | 0.0% | 0.0% | 0.0% | 0.0% | 0.0% | 0.0% | 0.0% | 0.0% | 0.3% | 0.1% |
| Segments | ||||||||||
| North America · Segment revenue (JPY) | — | — | 4.52B | 3.11B | 3.32B | 4.16B | 4.63B | 3.84B | 3.81B | 6.81B |
| ↳ YoY growth | -31.1% | +6.7% | +25.2% | +11.2% | -16.9% | -0.8% | +78.8% | |||
| North America · Segment operating income (JPY) | — | — | 394M | 187M | 353M | 522M | 591M | 464M | 108M | 148M |
| Southeast Asia · Segment revenue (JPY) | — | — | 1.28B | 3.84B | 952M | 1.67B | 1.54B | 1.48B | 2.35B | 2.63B |
| ↳ YoY growth | +200.6% | -75.2% | +75.8% | -8.2% | -3.9% | +59.0% | +11.9% | |||
| Southeast Asia · Segment operating income (JPY) | — | — | 127M | 252M | -12.3M | 106M | 83.1M | 81.1M | 131M | 179M |
| Reported | Jul 26, 2017 | Jul 25, 2018 | Jul 29, 2020 | Jul 29, 2020 | Jul 28, 2021 | Jul 27, 2022 | Jul 26, 2023 | Jul 24, 2024 | Jul 28, 2025 | Jul 27, 2026 |
Sign up to see institutional holdings
Sign UpPodcast Mentions
Sign up to see podcast mentions and sentiment
Sign UpTimely disclosures published on TDnet, newest first, titles as filed in Japanese. The link opens the disclosure on TDnet. Filings with EDINET (periodic reports, extraordinary reports, offerings, holding and buy-back reports), newest first, titles as filed in Japanese. The link opens the filing on EDINET. Press releases from the company's own website, newest first.
自己株券買付状況報告書(法24条の6第1項に基づくもの)
Bull 1
Bear 0
Routine
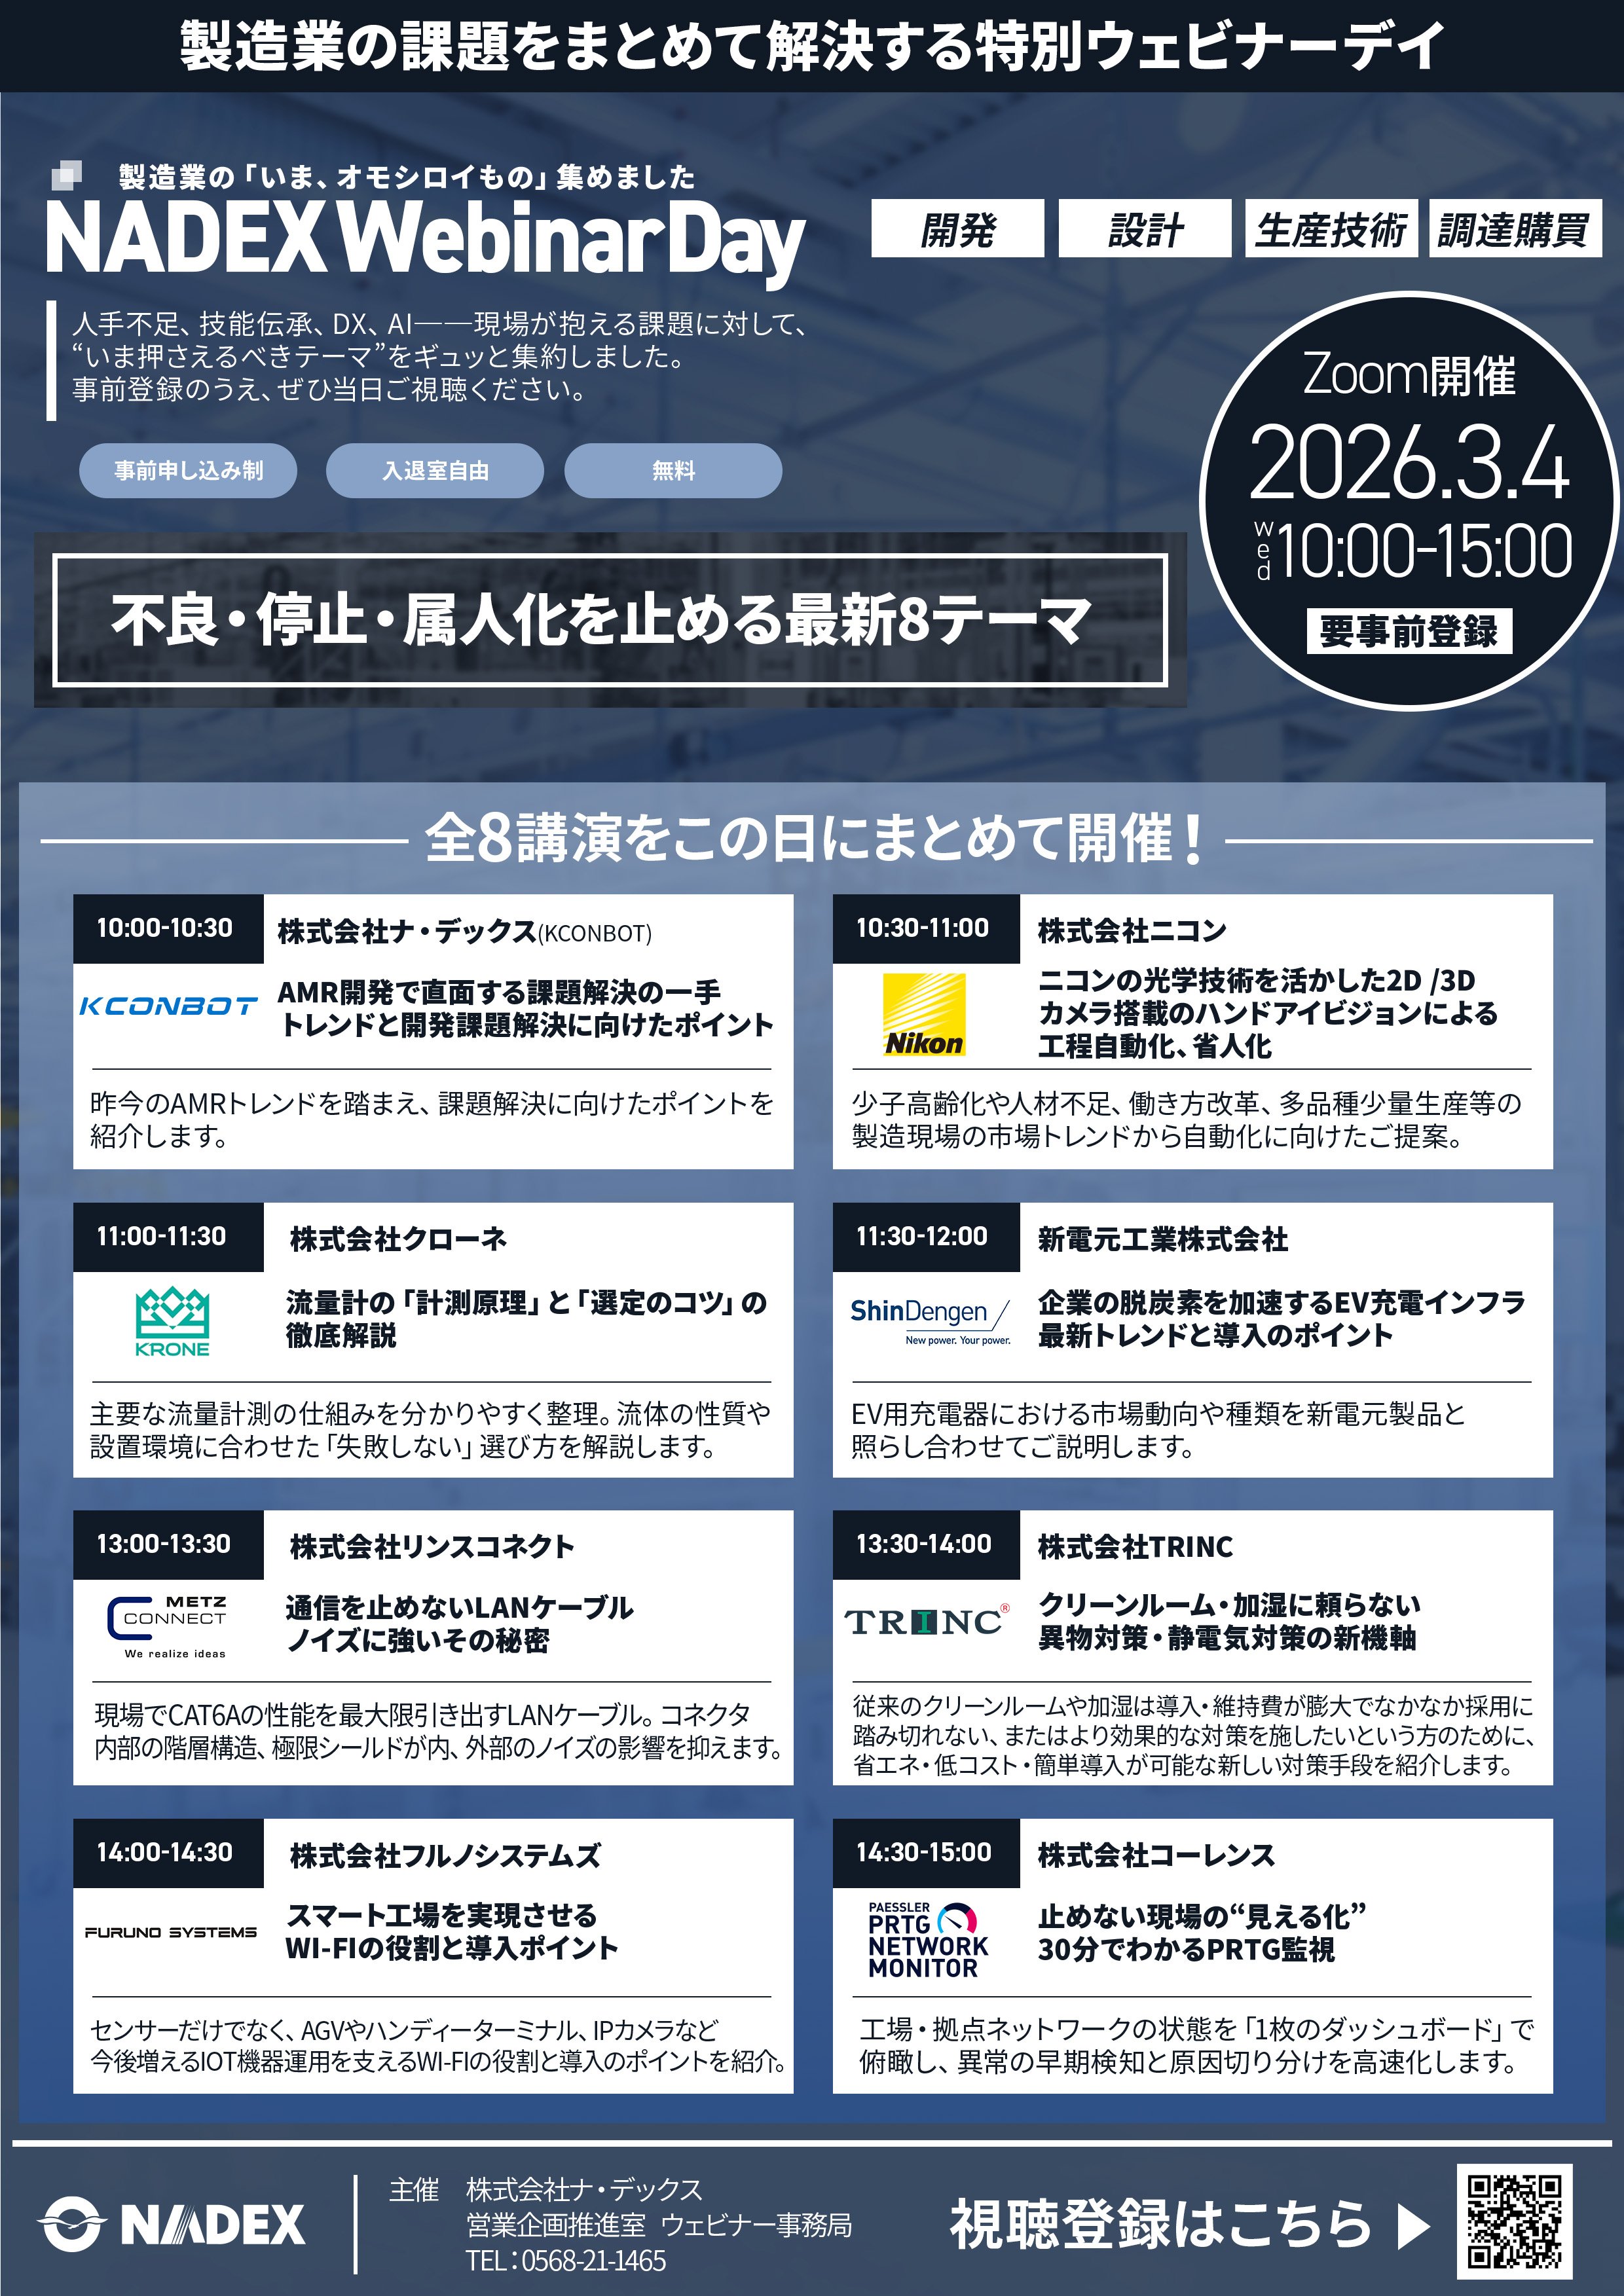
What's New / Event Seminar Information
Bull 0
Bear 0
Routine

This website is automatically translated from Japanese.
In case of any discrepancy, the Japanese version shall prevail.
本网站由日语自动翻译而成。如有任何不一致之处,以日语版本为准。
This website is automatically translated from Japanese.
In case of any discrepancy, the Japanese version shall prevail.
本网站由日语自动翻译而成。如有任何不一致之处,以日语版本为准。
-
News & Topics
NEWS News & Topics
Notices Search by category All categories Notices News Release Business News
2026/10/19 Notices
Social Contribution Activities - I participated in a career talk for junior high school students.
2026/07/22 Notices
Summer vacation notice
2026/05/28 Notices
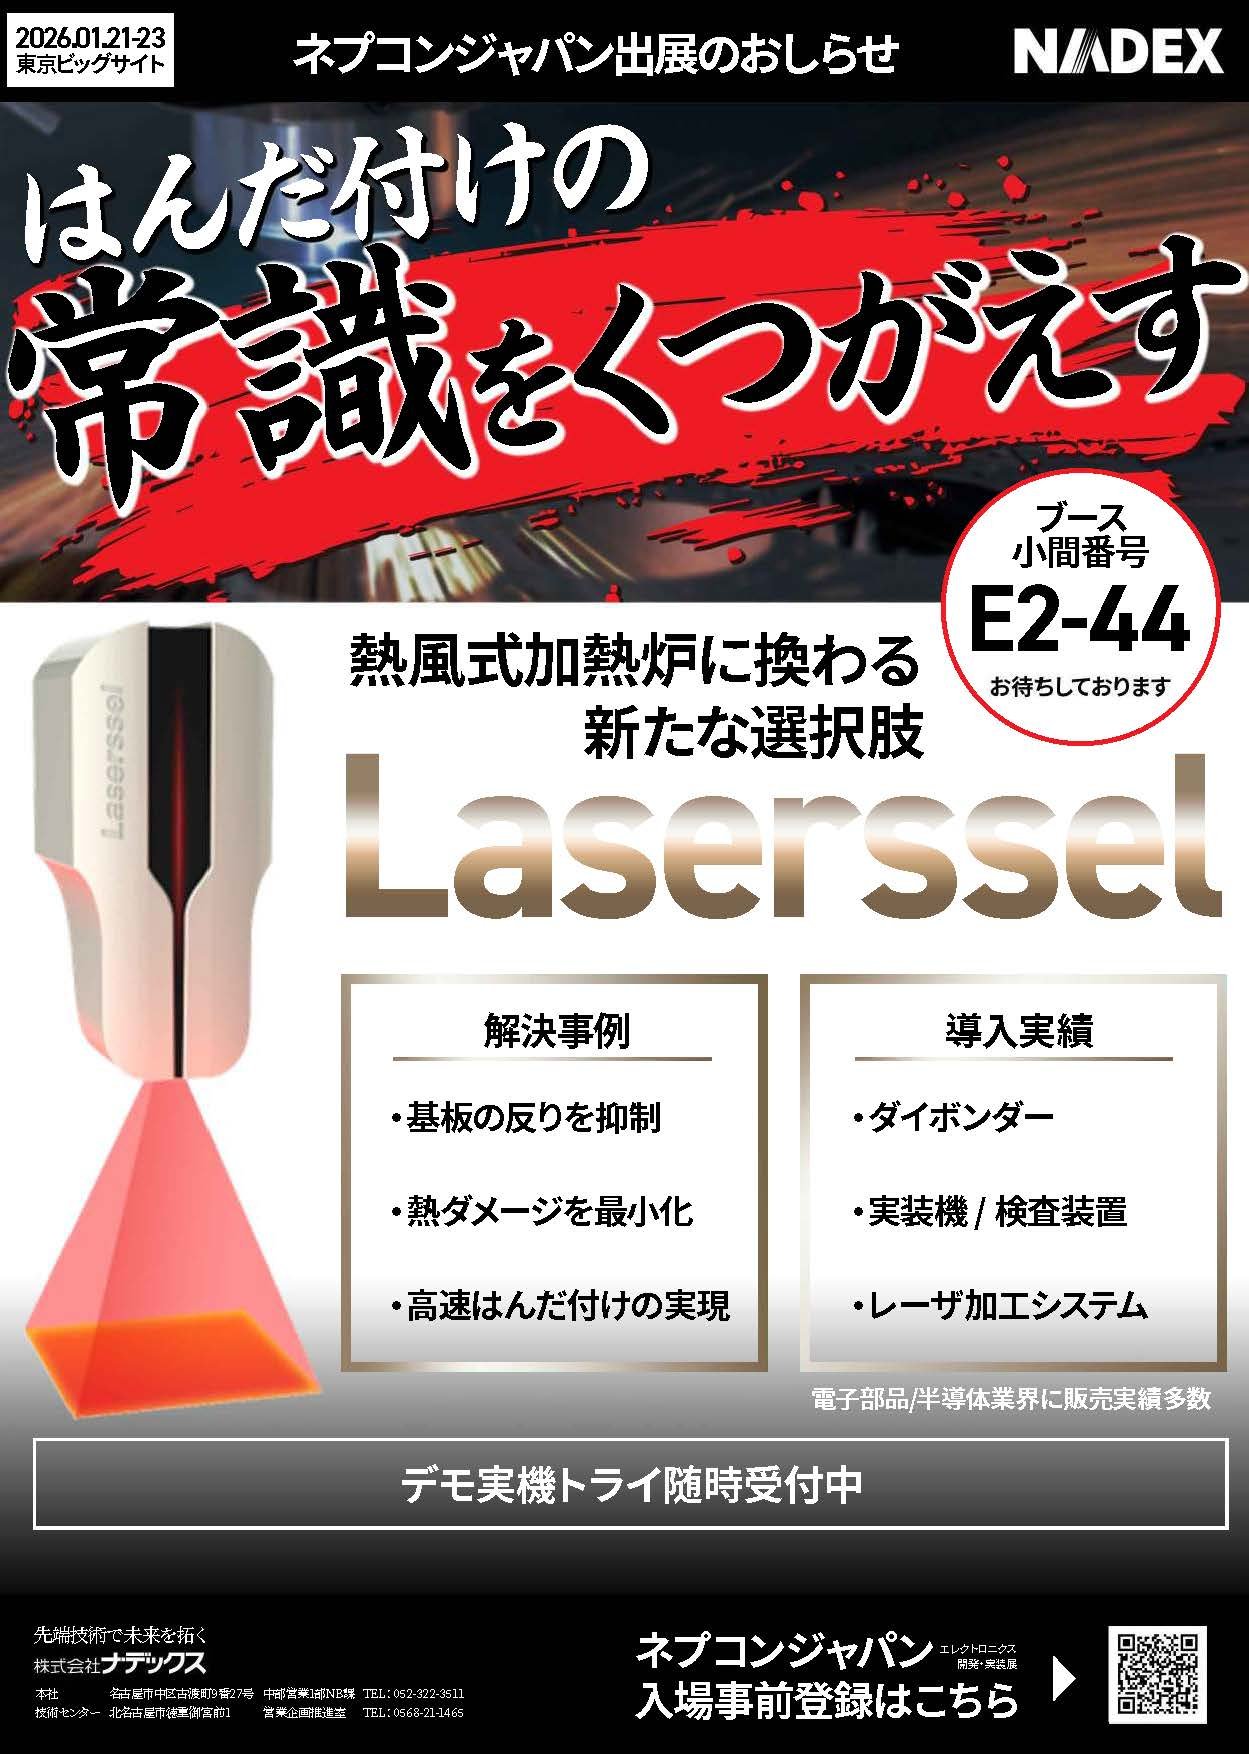
Announcement of Project Launch in Semiconductor and Generative AI Manufacturing Process Area
2026/04/09 Notices
Golden Week Holiday Notice
2026/04/01 Notices
Featured in "robot digest".
2026/01/09 Notices
Featured in "LAWYERS GUIDE 2026"
2026/01/09 Notices
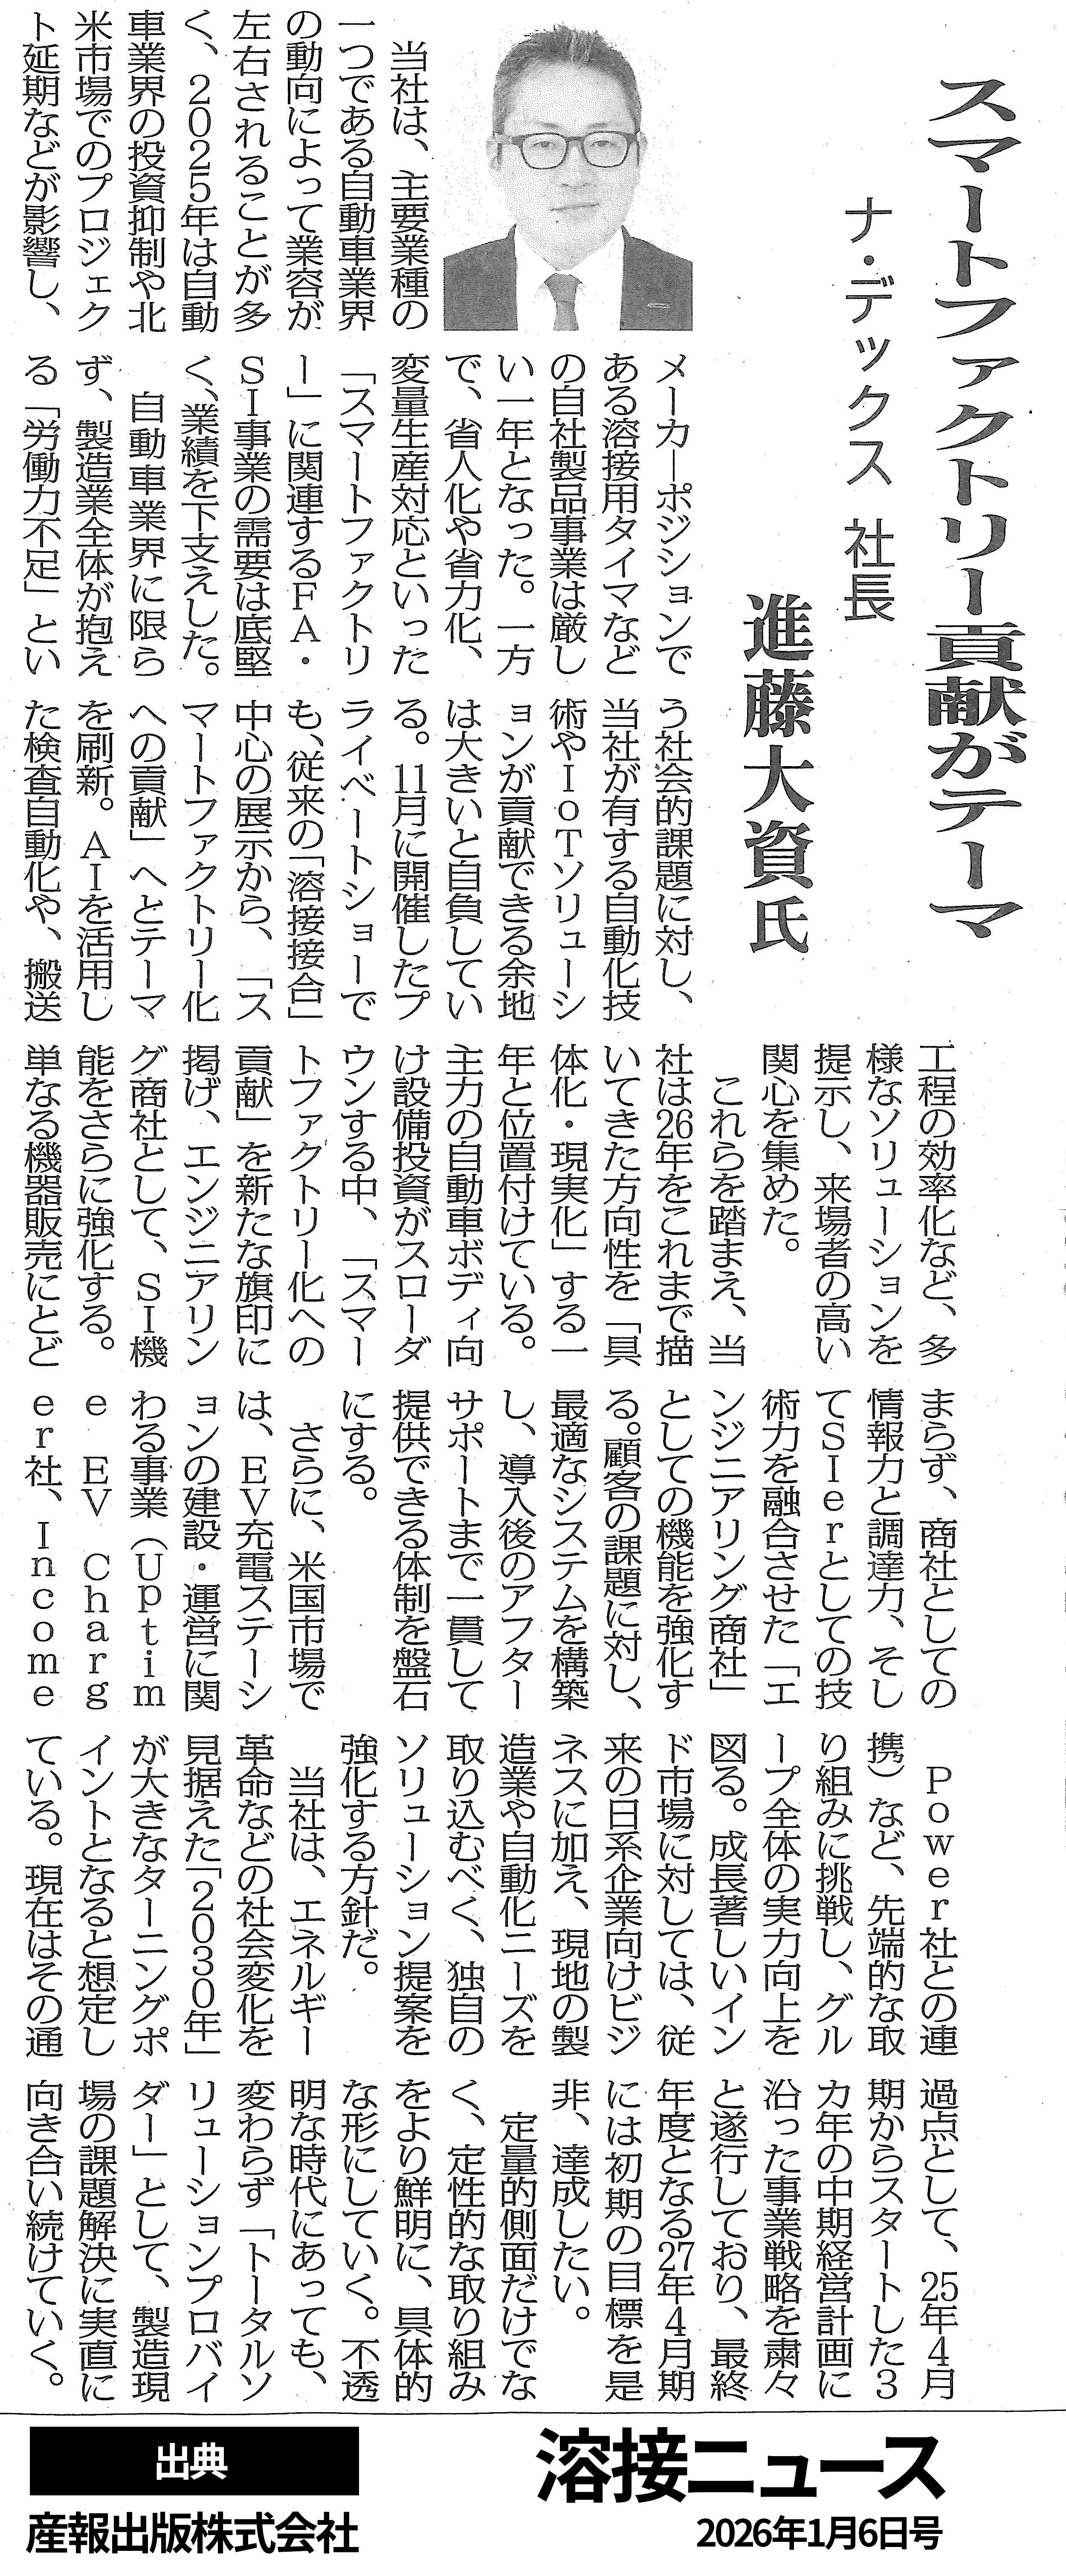
Featured in Welding News | January 6, 2026
2025/12/12 Notices
Featured in the Chubu Keizai Shimbun | 2025.12.11
2025/11/26 Notices
New Year's holiday notice
2025/11/05 Notices
[Media Coverage] Featured in FISCO

Copyright(c)NADEX CO., LTD. All Rights Reserved.
×
このウェブサイトは Cookie を使用しています
当社はコンテンツや広告をパーソナライズし、トラフィックを分析するために Cookie を使用します。また、当社は、お客様による当社サイトの使用に関する情報を広告および分析パートナーと共有します。これらの情報は、お客様が提供した他の情報、またはお客様によるサービスの使用から収集した他の情報と組み合わされる場合があります。 Privacy Policy
必ず必要
パフォーマンス
ターゲティング
機能性
OK
Prompts
Click prompts to add them under the company line, click again to take one out, then copy the result into your AI chat. Shared by Asian Century Stocks and Uncovered Thai Stocks. Thank you.
Nadex Co., Ltd. (ticker 7435), listed in Japan.
Copied