August 3,12026 FY2026 Q1 Earnings Presentation LITALICO Inc. [ TSE Code: 7366 ] © LITALICO Inc. DISCLAIMER 2 The information, future strategies, forecasts, management targets, and other forward-looking projections relating to LITALICO Inc. (“the…
August 3,12026
FY2026 Q1 Earnings Presentation
LITALICO Inc.
[ TSE Code: 7366 ]
© LITALICO Inc.
DISCLAIMER
2
The information, future strategies, forecasts, management targets, and other forward-looking projections relating to
LITALICO Inc. (“the Company”) is based on information available to the Company as of the date hereof, and is based on
reasonable assumptions that may include various risks and inaccuracies.
The Company makes no representations or warranties of any kind, expresses or implies, the completeness and accuracy
of such information, and actual results may vary significantly from such information provided. The Company is under no
obligation to update or amend such information accompanying any new information or developments thereof.
Furthermore, information and data other than those concerning the Company and its subsidiaries/affiliates are quoted
from public information, and the Company has not verified and will not warrant its accuracy or dependency.
© LITALICO Inc.
INDEX
3
Consolidated Financial Results ………………………………… 4
Midterm Strategy ………………………………………………… 7
Business Results …………………………………………………… 13
Financial Forecast ………………………………………………… 20
Reference Material ………………………………………………… 24
© LITALICO Inc.
4
Consolidated Financial Results
© LITALICO Inc.
RESULTS
•
•
Consolidated P&L
5
All core businesses performed smoothly, with particular strength in the vocational welfare business.
Net sales and operating profit both outperformed the expectations at the beginning of the period.
IFRS
(million yen)
Progress Rate
Against Financial
Forecast
FY2025 Q1
FY2026 Q1
% YoY
Financial
Forecast
Net Sales
9,017*
10,844
44,000
24.6%
Operating Profit
939*
1,434
5,500
26.1%
Profit Attributable
to Owners of Parent
564
892
3,300
27.0%
*Pursuant to item no. 5 of IFRS, these figures
do not include the non-continuous business.
© LITALICO Inc.
RESULTS
Vocational
Welfare
Child
Welfare
Platform
FY2026Q1 Results by Segment
Sales
6
Results
(million yen)
FY25Q1
FY26Q1
% YoY
Overview
3,324
4,105
+23.5%
• Sales and profit growth due to the improvement of existing facilities’ operation rate.
• 27 facilities are planned to be launched in FY2026 (including nine facilities in Q1), in addition to
• Since newly opened facilities are also performing well, 40 facilities are planned to be launched in
seven facilities to be launched in September due to M&A.
Profit
1,041
1,402
+34.6%
Sales
2,443*
2,998
+22.7%
Profit
-33*
291
+324 mln.
yen
Sales
1,405
1,745
+24.2%
Profit
585
639
+9.2%
Sales
870
991
+13.8%
Overseas
Profit
199
241
+21.1%
Sales
975*
1,006
+3.2%
FY2027.
• 21 facilities are planned to be launched in FY2026 (including one facility in Q1).
• Operation rate at the beginning of the period progressed smoothly, and profitability
improved through long-duration support and expansion of visitation services.
• In accordance with sales and profit growth, we will accelerate site launches in FY2027.
• There are a total of 36,529 contracted offices.
• 1,956 contracted offices were newly acquired (+24% YoY).
• Welfare recruitment business and media business grew rapidly, with a YoY increase of
40%.
• Existing business progressed steadily with an additional acquisition of seven bed
capacities.
• Completed the acquisition of license for a new medium-sized facility (30 beds). Operation
began in July, but this is not reflected in the current financial forecast.
• Sales for each business is proceeding firmly, and investment towards the new business
Others
Profit
61
-6
-67 mln.
yen
development will be continued actively.
*IFRS第5号に基づき非継続事業を除いた数値
© LITALICO Inc.
7
Midterm Strategy
© LITALICO Inc.
STRATEGY
LITALICO Philosophy and Vision
8
Creating an Obstacle-free Society
Obstacles are created by and within a society,
not by the unique capabilities of an individual.
Removal of societal obstacles leads to the creation of a civilization
that honors the felicity of all diverse life.
© LITALICO Inc.
REFERENCE
Trends in Disability Welfare Industry
9
• The employment of individuals with disabilities is increasing, with legally mandated employment rate of 2.7%.
Legally Mandated Employment Rate
Employment of Individuals with Disabilities
(thousand)
10x increase over past 13 yrs
in employment of individuals with
psychologically disabilities
800
700
(%)
2.9
2.7
600
2.5
500
Since implementation of the
system,
legally mandated
employment rate has
continued to rise
2.3
400
2.1
300
1.9
200
1.7
100
1.5
0
2011 2012 2013 2014 2015 2016 2017 2018 2019 2020 2021 2022 2023 2024
身体障害
知的障害
精神障害
1.3
Ref: MHLW
© LITALICO Inc.
REFERENCE
Trends in Disability Welfare Industry
10
Number of Welfare Service Users and Provider Facilities
(thousand)
(thousand)
Welfare service facilities (left)
200
1,600
Welfare service users
1,400
160
1,200
1,000
120
800
80
600
400
40
200
0
0
2012
Ref:
MHLW
2013
2014
2015
2016
2017
2018
2019
2020
2021
2022
2023
2024
Disability welfare service users and providers continue to increase, resulting in increasing
social needs. The government and municipalities’ welfare service-related budget reached 4
trillion yen, which continues to expand at 8% annually.
© LITALICO Inc.
LITALICO’S STRATEGY
Services Across All Life Stages of Persons with Disabilities
Education
LITALICO Junior
Vocation
11
Lifestyle
LITALICO Wonder
U.S.
LITALICO Works
•
Early detection
Diagnosis
Education and therapy
•
•
•
Social participation
•
•
•
Dwelling
Medical care
Asset custody
Direct Support Business
Lifetime support services for
persons with disabilities
Platform Business
LITALICO
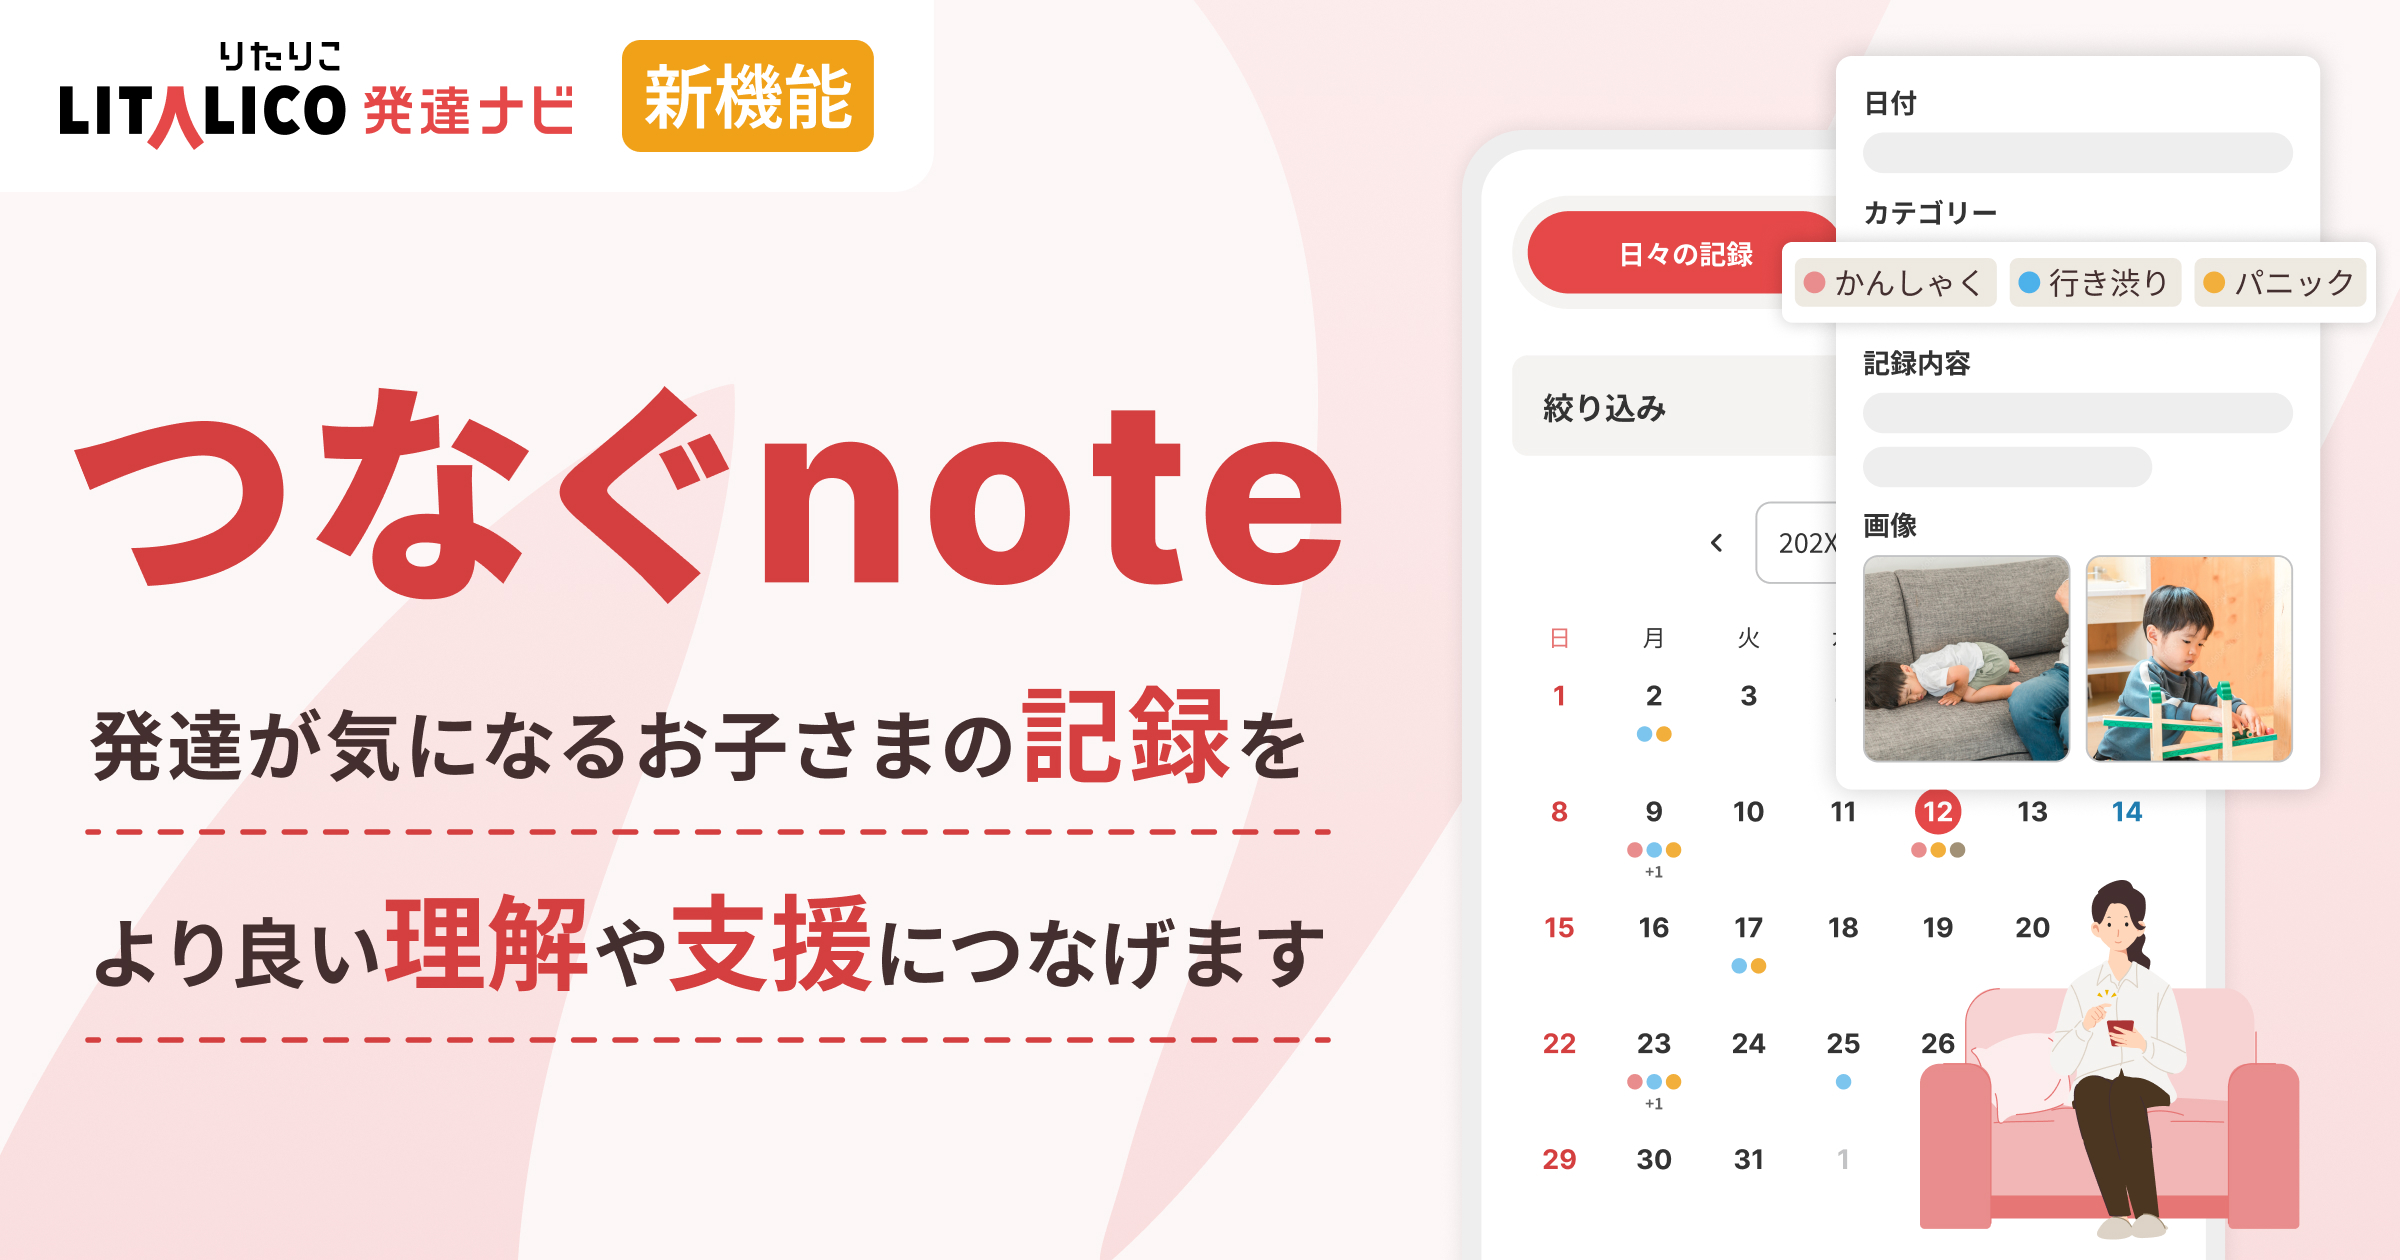
Development Navi
LITALICO Career
LITALICO Work Navi
(Billing Software)
(Nursing Care Software)
Platform services for social
workers, service providers,
and persons with disabilities
© LITALICO Inc.
BUSINESS POLICIES
Medium-Term Policies
12
To become the No. 1 company in the world
for supporting people with disabilities
Management Foundation
Strengthening Policy
Investment Policy
Regarding Business Growth
Financial and Capital
Allocation Policy
•
•
•
•
•
•
Continuous investment for strengthening the consistency of corporate
culture and development of human resources.
Business development focused on the LITALICO brand.
Growth investment will be continued towards the maximization of mid- to
long-term business values of existing core businesses.
While mainly developing the disability welfare sector, new businesses at
surrounding sectors will also be developed selectively.
While prioritizing the growth investment, the measures for shareholder return
will be strengthened in association with the stable profit growth.
Stable dividend increase and agile stock repurchase will be continued while
maintaining financial health.
© LITALICO Inc.
13
Business Results
© LITALICO Inc.
LITALICO Segments
Vocational
Welfare
Child
Welfare
Platform
14
Overseas
Others
LITALICO Development Navi
LITALICO Junior (Private)
LITALICO Work Navi
LITALICO Works
(Welfare)
LITALICO Junior
(Welfare)
LITALICO Wonder
LITALICO Career
(Billing Software)
(Nursing Care Software)
© LITALICO Inc.
RESULTS
Vocational Welfare
15
• Net sales were 4.1 billion yen (YoY increase of 23.5%), and operating profit were 1.4 billion yen (YoY
increase of 34.6%).
• Sales and profit growth due to the improvement of existing facilities’ operation rate.
• 27 facilities are planned to be launched in FY2026 (including nine facilities in Q1), in addition to seven
facilities to be launched in September due to M&A.
• Since newly opened facilities are also performing well, 40 facilities are planned to be launched in
FY2027.
Number of New Vocational Welfare Facilities
Openings
Vocational Welfare Service Sales
(million yen)
16,000
45
M&A
40
14,000
14162
12,000
40
35
12538
10,000
30
7
25
27
10585
9510
8,000
8556
20
7693
6,000
6686
5743
4,000
4957
4310
4105
14
10
5
2,000
20
5
15
6
7
8
8
18
19
14
16
10
1
2
0
0
FY16
FY16
17
18
19
20
21
*Renewed segment numbers applied from FY23
22
23
24
IFRS
IFRS
25
IFRS
26Q1
IFRS
17
20
21
22
23
24
25
26
27
Plan
© LITALICO Inc.
RESULTS
Child Welfare
16
• Net sales were 3 billion yen (YoY increase of 22.7%), and operating profit were 300 million yen (YoY
increase of 324 million yen).
• In addition to the smooth progression of the operation, profitability improved through long-duration
support and expansion of visitation services.
• 21 facilities are planned to be launched in FY2026 (including one facility in Q1).
• In accordance with sales and profit growth, we will accelerate site launches in FY2027.
Number of New Child Welfare Facilities
Openings
Child Welfare Service Sales
(million yen)
12,000
10951
10,000
9074
8,000
8812
7928
6730
6,000
5638
4954
4,000
4372
3783
2,000
2998
2817
0
FY16
17
18
19
20
21
22
23
24
IFRS
25
26Q1
IFRSIFRS
IFRS
*Renewed segment numbers applied from FY23
*The above figures represent current sales from continuing operations and differ
from figures disclosed in prior years.
Plan
© LITALICO Inc.
RESULTS
Platform Business
17
• Net sales were 1.7 billion yen (YoY increase of 24.2%), and operating profit were 640 million yen (YoY increase of
9.2%).
• It provides a matching media for users/workers, and SaaS services for facilities by utilizing the characteristics of
direct support business.
• The number of contracted offices as of the end of FY2026 Q1 was 36,529. The number of newly acquired
contracted offices were 1,956, which progressed steadily (+24% YoY).
• Welfare recruitment business and media business grew rapidly, with a YoY increase of 40%.
Number of Subscribed Contracted Offices for
Platform Business
Platform Business Sales
(百万円)
Net increase
for Q1 was
1,527
45,000
6,000
40,000
5476
5,000
35,000
35002
4530
4,000
36529
30,000
30150
3884
3,000
25,000
3197
26558
23290
20,000
20660
15,000
2,000
1745
1839
14469
10,000
1,000
1040
5,000
593
0
0
FY19
20
21
22
23
24
25
IFRS
26Q1
1983
3149
FY18
19
20
21
22
23
24
25
26
- Fukushi-soft inc. consolidated as of Jan 2021; Plus One Solutions consolidated as of Mar 2022.
- Facilities using other contract formats also exist.
© LITALICO Inc.
RESULTS
Overseas
•
•
•
•
18
Net sales were 1 billion yen (YoY increase of 13.8%), and operating profit were 240 million yen (YoY increase
of 21.1%).
DDCN, the leading provider of support services for individuals with severe disabilities in Nebraska, U.S., has
resumed to its growth trajectory.
A facility with seven bed capacities was acquired in the existing service (the facility is planned to operate from
September). The acquisition of a license required for a new medium-sized facility (30 beds) has been
completed, and its operation began from July, but this is not reflected in the current financial forecast.
We will proceed with the service expansion and strengthening service lineup for persons with severe
behavioral disorder.
Number of Users of Core Business’s
Residential Facilities
Overseas Business Sales
(million yen)
60
4,000
3654
3761
3655
Five new users in Q1.
Additionally, a facility with
seven beds and a new
facility with 30 beds are
planned to commence
operation in Q2 and onward.
50
3,000
40
2605
36
30
2,000
30
31
25
20
1,000
29
1205
18
991
797
10
11
0
0
FY20
21
22
23
※Figures before acquisition of DDCN in July 2024
are presented only for reference
24
25
26Q1
Became a subsidiary in July 2024
FY20
21
22
23
24
25
26
Became a subsidiary in July 2024
© LITALICO Inc.
RESULTS
•
Others
19
Net sales were 1 billion yen (YoY increase of 3.2%), and operating profit were negative 10 million yen
(YoY decrease of 67 million yen).
Others Sales
(million)
4,500
Development classes designed for
children under 18 with special needs,
open to all irrespective of disability
certification. Provides intensive sessions
with generous guidance. One facility is
planned to be opened in FY2026.
On-site and remote programming
classes for children, designed to
develop their creativity through
building games and robots.
4,000
4003
3764
3,500
3483
3,000
3026
2,500
New businesses
• LITALICO Residence
• LITALICO High School
Information provision and online
seminars and study groups to provide
life planning support customized to
individual interests and obstacles.
2611
2,000
1,500
1629
1376
1760
1475
1,000
1006
500
0
FY17
18
19
20
21
22
23
IFRS
24
25
IFRS IFRS
26Q1
IFRS
*Renewed segment numbers applied from FY23
*The above figures represent current sales from continuing operations and differ
from figures disclosed in prior years.
© LITALICO Inc.
20
Financial Forecast
© LITALICO Inc.
FORECAST
Full-Year Consolidation Forecast (IFRS)
21
• In vocational welfare, 27 facilities are planned to be launched. Personnel investment and investment for enhancement of service value will also be conducted towards
•
•
•
•
•
40 site launches in FY2027 and onward.
In child welfare, 21 facilities are planned to be launched. While focusing on short-duration services, profitability improvement is planned through long-duration support
and expansion of visitation services.
Platform business is doing well. We will continue to invest in strengthening the sales ability and product development.
The overseas business will proceed with the service expansion and strengthening service lineup in Nebraska for persons with severe behavioral disorder. Newly
opened facilities are not reflected in the forecast.
New business development is also planned to be actively implemented.
The term-end dividend is expected to be 15 yen. Stock repurchase of 1 billion yen has been conducted.
IFRS
(million yen)
FY2025
ACT
FY2026
FCT
% YoY
Net Sales
38,247*
44,000
Operating Profit
4,576*
5,500
Profit Attributable to
Owners of Parent
2,738
3,300
Year-end Dividend
11 yen
15 yen
*Figure excluding the non-continuous business based on item no. 5 of IFRS.
© LITALICO Inc.
FORECAST
Financial Summary
22
• Planning for sales and profit increase
Net Sales
Operating Profit
(million yen)
(million yen)
6,000
50,000
5,500
44,000
45,000
5,000
4,576
38,247
40,000
35,000
33,214
4,000
3,473
27,676
30,000
2,928
24,170
25,000
3,000
2,444
19,737
20,000
15,908
13,866
12,127
10,384
8,728
15,000
10,000
2,000
7,263
5,000
803
1,740
2,925
4,210
1,678
1,000
5,527
562
57
37
FY10 11
12
36
0
FY10 11
12
13
14
15
16
17
18
19
20
21
3,455
22
23
24
25
26
198
669 747
881
982
331
0
13
14
15
16
17
18
19
20
21
22
23
24
25
26
IFRS IFRS IFRS
FCT
IFRS IFRS IFRS
FCT
※IFRS from FY23 and onward
※IFRS from FY23 and onward
© LITALICO Inc.
FORECAST
Stock Repurchase
23
Stock repurchase was decided to be implemented for the enhancement of capital efficiency and to provide
returns to shareholders.
-
Type of shares to be repurchased: Common stocks of the Company
-
Total number of shares to be repurchased: 1,000,000 shares (maximum)
2.9% of the total number of the issued shares
-
Total repurchase price: 1,000 million yen (maximum)
-
Period of repurchase: From May 12, 2026 to September 30, 2026
-
Method of repurchase: Market purchase on the Tokyo Stock Exchange through an appointed
securities dealer with transaction discretion
644,700 shares (1,000 million yen) has been acquired as of June 4, 2026.
© LITALICO Inc.
24
Reference Materials
© LITALICO Inc.
REFERENCE
Number of LITALICO Service Provision Facilities
25
• Approximately 450 sites are expected to be in operation by the end of FY2026.
500
456
450
403
Vocational Welfare
381
400
340
350
303
300
262
231
250
210
200
173
140
150
116
100
50
54
39
4
34
57
73
5
15
13
22
37
38
92
23
21
84
20
186
•
•
53
51
167
Child Welfare
186
•
146
39
113
93
100
Others
197
43
44
53
59
66
74
14
15
16
17
18
LITALICO Junior (Welfare)
128
60
18
30
LITALICO Works
M&A
205
48
43
35
26
86
53
82
92
106
19
20
21
127
143
161
164
•
•
LITALICO Junior (Private)
LITALICO Wonder
LITALICO Homecare
0
11
12
13
- New segmentation as of FY23
22
23
24
25
26
FCT
© LITALICO Inc.
REFERENCE
LITALICO Business Environment (1)
26
• Number of individuals with disabilities continue to increase, with more children attending special needs classes in addition to
normal school
Number of All Individuals with Disabilities
Number of All Children With Developmental Disorders
Children with Developmental Disorders Receiving Special Needs*
Schooling
Number of children with
developmental disorders
(thousand)
350
Number of children
(thousand)
11.6 million
14,000
individuals with disabilities
10,500
12,000
300
10,000
10,000
250
6,148
8,000
4,193
9,500
200
3,924
6,000
3,233
1,082
4,000
3,327
547
150
9,000
1,094
741
100
8,500
2,000
329
3,663
3,937
4,360
50
4,360
2,239
8,000
0
2011 2012 2013 2014 2015 2016 2017 2018 2019 2020 2021
0
2001
2006
Physical
2011
2016
Intellectual
*Ref: White Paper; Cabinet Office, Government of Japan
2023
Children taking special needs classes
Mental
Children attending special needs school
Total number of children
*Special needs schooling: Students with disabilities receiving
instruction in separate rooms as needed while enrolled in
regular classes. 'Attention-deficit/hyperactivity disorder,
learning disabilities, autism, emotional disturbance, and
speech impairment,' were categorized as 'having educational
needs related to developmental disabilities.
© LITALICO Inc.
REFERENCE
LITALICO Business Environment (2)
27
• The market size of disability welfare service and adjacent industry (medical, nursing care, etc.) is increasing yearly.
Disability Welfare Service Budget
Government spending on disability welfare services,
excluded fees paid by municipalities and individuals
Disability Welfare Service Users and Facilities
Number of facilities
Number of Users
(thousand)
200,000
2,000
Welfare service budget
continues to rise
180,000
topping 2 trillion yen*
160,000
1,400
1,200
140,000
1,600
1,000
120,000
1,200
800
100,000
80,000
800
60,000
Welfare facilities also
increasing with
over 180,000 sites
600
400
40,000
400
200
20,000
0
2007 2008 2009 2010 2011 2012 2013 2014 2015 2016 2017 2018 2019 2020 2021 2022 2023
Children's disability benefits (mandatory expenses)
Independence support benefits (mandatory expenses)
0
0
2012 2013 2014 2015 2016 2017 2018 2019 2020 2021 2022
Welfare service facilities
Welfare service users
Regional assisted living support (mandatory expenses)
- Ref: Ministry of Health, Labour and Welfare
© LITALICO Inc.
REFERENCE
Publicly Funded Business Structure
Government
Reimbursement:
90%
National Health
Insurance
Federation
(Claimed by LITALICO on
behalf of service user)
LITALICO Works Pricing
Employment Transition Support
Up to 6 mths into employment
Per person; 20 person limit
1st Yr: ¥8,800 /session
2nd Yr: ¥8,800~10,000 /session
3rd Yr: ¥12,000 /session
- Pricing fluctuates each fiscal year,
depending on the job retention rate
28
LITALICO Junior Pricing
Development Support Up to Pre-school
Per person; 10 person limit
¥15,000 /session
Afterschool Daycare Service Grades 1 ~12
Per person; 10 person limit
Weekday: ¥9,800 /session
Weekend : ¥11,000 /session
Employment Retention Support
From 6 mths to 3 yrs into employment
Per person; unlimited
¥ 20,000~30,000 /month
Service User
Service User
Out of Pocket:
10%
Daycare Visitation Service
Per person; unlimited
¥20,000 /session
-
Pricing fluctuates on a monthly basis, depending on
the deployment of certified staffs.
-
Rates have been approximated; subject to change based on various factors such
as staffing, etc.
© LITALICO Inc.
REFERENCE
Reimbursement Calculation Method
Reimbursement Unit Price Evaluation Method
Results Based Reimbursement
Specific KPIs (such as the number of job placements) defined by the
administration are used to evaluate service quality and according
reimbursement amounts.
29
Vocational Training Business Example
Vocational Training Basic Reimbursement Scale
C. Job Retention Rate
D. Basic Reimbursement Units
50%+
1,210
40% ~ 49%
1,020
30% ~ 39%
879
…
…
*Reimbursement structure and KPIs vary across different services.
(1 unit = approx.10 jpy)
Results Evaluation Conducted per Facility
Calculation Method
Evaluation is conducted per site, and not at the corporate level
• Evaluation Period: Sum of past two years
• KPI: Number of job placements, 6 month job retention rate
• Equation: C. Job Retention Rate = B/A
Reimbursement Scale Revision Every Three Years
Reimbursement scale has been revised in April 2024
Almost all LITALICO Works facilities have gained
the highest reimbursement scale bracket, aside
from the newer sites.
Yr 3 onwards
A.
of users (2yr total):
40
B.
of users with 6month
retention:
28
C.
Job Retention Rate:
71%
D.
Basic Reimbursement Units:
1,210
Minimum of 2 years required for new sites to reach maximum
reimbursement bracket. Lower limit provision of 30~39% (879
units) bracket evaluation for sites under 2 years.
- Final service reimbursement units include additions to the above units, such as
regional provisions.
© LITALICO Inc.
REFERENCE
IDD Service Spending in the U.S.
Individuals with Disabilities in the U.S.
(百万人)
(million
people)
(%)
(million dollars)
Individuals with disabilities
45
13.5
% of U.S. population
80,000
13.0
60,000
40
Approx
. 4.6x
12.5
40,000
12.0
35
Ref:United States Census Bureau American Community Survey;
Total civilian noninstitutionalized
2021
2017
2007
0
1997
2022
2021
2020
2019
2018
2017
2016
2015
2014
2013
2012
0
1987
0
20,000
1977
11.5
2011
•
30
The 2022 U.S. census estimates more than 45 million individuals with physical, mental, or developmental disabilities, or with
independent living difficulties
Spending on services for Intellectual or Development Disabilities (IDD) alone has continued to increase, amounting to
approximately 80 billion dollars in 2021
2010
•
U.S Disability Welfare Industry
- Ref: University of Kansas, Includes Waiver, ICF/ID & related Medicaid, nonMedicaid spending
- IDD: Intellectual and Development Disabilities
© LITALICO Inc.
REFERENCE
DDCN Within the U.S. Disability Welfare Structure
Administration
Federal
Government
Audit
State
Government
Insurance
Medicaid
Medicare
Funding
(Public)
Authorization &
Audit
Application
& Reporting
31
Commercial
Private
(Mixed, Corporates)
(Out-ofpocket)
Reimbursement
Service Providers
Claims
Other
Providers
Service
Provision
Service Users
All disability services provided by DDCN are publicly funded
© LITALICO Inc.
REFERENCE
LITALICO Annual Fact Sheet
Child Welfare
Vocational Training
• Job Placements as of the
917
end of June 2026:
• Service Users as of the
4,883
end of June 2026:
NPS Scores*1
1,574
• Child Welfare Segment:
• Platform Segment:
• Overseas Segment:
• Others Segment:
2,034
521
267
874
Segment:
Female Employees
• LITALICO Works:
• LITALICO Junior:
13.0
33.5
*1 Evaluation towards LITALICO services overall;
average across all facilities
NPS: Net Promoter Score
Client loyalty index
[-100 to +100]higher the better
Employee Benefits
• Discontinuation of mandatory fixed age retirement system in order to support
sustainability of long term relationships with customers
32.2%
• Addition of shortened 32- and 35-hour work week system to the existing 40-hour
• Compensation vs. males: 56.2%
(exclude. upper management)
11,401
end of June 2026:
• Vocational Welfare
Management ratio:
LITALICO Wonder
• Service Users as of the
Number of Employee
• Middle and Upper
32
•
•
•
work week to accommodate diverse working styles (currently utilized by 145
employees)
Expansion of the Company’s secondary employment policy, including permitting
secondary employment while on childcare leave, to promote greater flexibility in
working styles (currently utilized by 555 employees)
Encouragement of male employees to take parental leave to support work styles
suited to different life stages (taken by 80% of eligible male employees)
Expansion of partnership definitions to include more diverse family structures
such as common-law and same sex marriages, allowing for more employees to
access family related benefits
As of 2025, LITALICO
Inc. received an MSCI
ESG Rating of AA
THE USE BY LITALICO Inc. OF ANY MSCI ESG
RESEARCH LLC OR ITS AFFILIATES (“MSCI”)
DATA, AND THE USE OF MSCI LOGOS,
TRADEMARKS, SERVICE MARKS OR INDEX
NAMES HEREIN, DO NOT CONSTITUTE A
SPONSORSHIP, ENDORSEMENT,
RECOMMENDATION, OR PROMOTION OF
LITALICO Inc. BY MSCI. MSCI SERVICES AND
DATA ARE THE PROPERTY OF MSCI OR ITS
INFORMATION PROVIDERS, AND ARE
PROVIDED ‘AS-IS’ AND WITHOUT WARRANTY.
MSCI NAMES AND LOGOS ARE TRADEMARKS
OR SERVICE MARKS OF MSCI.
© LITALICO Inc.