Note: This document has been translated from the Japanese original for reference purposes only. In the event of any discrepancy between this translated document and the Japanese original, the original shall prevail. October 28, 2026 Consolidated…
Note: This document has been translated from the Japanese original for reference purposes only. In the event of any discrepancy
between this translated document and the Japanese original, the original shall prevail.
October 28, 2026
Consolidated Financial Results
for the Six Months Ended September 30, 2026
(Under Japanese GAAP)
Company name: AISAN INDUSTRY CO., LTD.
Listing: Tokyo Stock Exchange, Nagoya Stock Exchange
Securities code: 7283
URL: https://www.aisan-ind.co.jp/
Representative: Takami Kato
President
Inquiries: Hideto Ikai
General Manager of Accounting & Finance Dept.
Telephone: +81-562-47-1131
Scheduled date to file semi-annual securities report: November 13, 2026
Scheduled date to commence dividend payments: November 26, 2026
Preparation of supplementary material on financial results: Yes
Holding of financial results briefing: Yes
(Yen amounts are rounded down to millions, unless otherwise noted.)
- Consolidated financial results for the six months ended September 30, 2026 (from April 1, 2026 to September 30, 2026)
(Percentages indicate year-on-year changes.)
(1) Consolidated operating results (cumulative)
Profit attributable to
Net sales
Operating profit
Ordinary profit
owners of parent
Millions of yen
% Millions of yen
% Millions of yen
% Millions of yen
%
Six months ended
September 30, 2026
171,354
5.1
11,123
18.4
11,595
18.0
7,884
4.0
September 30, 2025
163,096
(2.0)
9,397
(14.2)
9,825
(12.9)
7,582
(5.3)
Note: Comprehensive income
For the six months ended September 30, 2026:
¥
6,506 million [
(15.2) %]
For the six months ended September 30, 2025:
¥
7,673 million [
120.2%]
Basic earnings
per share
Six months ended
September 30, 2026
September 30, 2025
Diluted earnings per
share
Yen
Yen
137.82
131.17
(2) Consolidated financial position
Total assets
Millions of yen
As of
September 30, 2026
308,532
March 31, 2026
311,476
Reference: Equity
As of September 30, 2026:
As of March 31, 2026:
Net assets
¥
¥
Equity-to-asset ratio
Millions of yen
%
151,002
146,329
47.6
45.5
146,820 million
141,853 million
- Cash dividends
Annual dividends per share
First quarter-end
Fiscal year ended
March 31, 2026
Fiscal year ending
March 31, 2027
Fiscal year ending
March 31, 2027
(Forecast)
Second quarter-end Third quarter-end
Fiscal year-end
Total
Yen
Yen
Yen
Yen
Yen
37.00
43.00
80.00
42.00
42.00
84.00
Note: Revisions to the forecast of cash dividends most recently announced:
Yes
- Consolidated financial result forecasts for the fiscal year ending March 31, 2027 (from April 1, 2026 to March 31, 2027)
(Percentages indicate year-on-year changes.)
Profit attributable to Basic earnings
Net sales
Operating profit
Ordinary profit
owners of parent
per share
Millions of yen
% Millions of yen
% Millions of yen
Full year
340,000
2.8
20,500
12.1
Note: Revisions to the financial result forecast most recently announced:
21,000
Yes
% Millions of yen
9.2
13,800
%
5.5
- Notes
(1) Significant changes in the scope of consolidation during the period:
Yes
Newly included:
companies( TRIS Inc. and its seven subsidiaries
8
Excluded:
companies(
Yen
240.75
)
)
Note: For details, please refer to "(3) Notes to Semi-annual Consolidated Financial Statements (Business combination, etc.)" on page 11.
(2) Adoption of accounting treatment specific to the preparation of semi-annual consolidated financial statements: None
(3) Changes in accounting policies, changes in accounting estimates, and restatement
(i) Changes in accounting policies due to revisions to accounting standards and other regulations:
(ii) Changes in accounting policies due to other reasons: None
(iii) Changes in accounting estimates: None
(iv) Restatement: None
None
(4) Number of issued shares (common shares)
(i) Total number of issued shares at the end of the period (including treasury shares)
As of September 30, 2026
As of March 31, 2026
(ii)
63,406,879 shares
63,406,879 shares
Number of treasury shares at the end of the period
As of September 30, 2026
As of March 31, 2026
5,955,769 shares
6,379,180 shares
(iii) Average number of shares outstanding during the period (cumulative from the beginning of the fiscal year)
Six months ended September 30, 2026
Six months ended September 30, 2025
57,207,604 shares
57,803,279 shares
- Semi-annual financial results reports are exempt from review conducted by certified public accountants or an audit firm.
- Proper use of earnings forecasts, and other special matters
The above forward-looking statements are prepared based on judgment and assumption from information currently available to the
Company. They do not constitute a commitment by the Company to achieve such forecasts.
Actual business results may differ from the forecast due to various factors.
For consolidated financial results, please refer to attachment page 3 “Overview of Consolidated Financial Results Forecast and
Other Forward-looking Information”.
(How to obtain supplementary financial results material)
Supplementary financial material will be posted on the Company’s website on October 28, 2026(JST)
Table of Contents - Attachments
- Overview of Operating Results, etc. for the Period under Review ............................................................ 2
(1) Overview of Operating Results.............................................................................................................. 2
(2) Overview of Financial Position ............................................................................................................. 2
(3) Overview of Consolidated Financial Results Forecast and Other Forward-looking Information ..........3
- Semi-annual Consolidated Financial Statements and Primary Notes........................................................ 4
(1) Semi-annual Consolidated Balance Sheet ............................................................................................. 4
(2) Semi-annual Consolidated Statements of Income and Comprehensive Income ................................... 6
(3) Notes to Semi-annual Consolidated Financial Statements .................................................................... 8
(Notes on going concern assumption) ...............................................................................................8
(Notes in case of significant changes in shareholders’ equity) ...................................................... 8
(Changes in significant consolidated subsidiaries during the period) ..............................................8
(Segment information, etc.) ..............................................................................................................9
(Business combination, etc.)........................................................................................................... 11
1
- Overview of Operating Results, etc. for the Period under Review
(1) Overview of Operating Results
During the six months ended September 30, 2026 under review, the global economy has been recovering gradually,
but the outlook remains uncertain due to factors such as the negative impact of U.S. tariff policies on the global
economy, increasing geopolitical uncertainties, including the situation in the Middle East, and changes in the
financial environment.
In the automotive industry, demand in the North American market remained solid, particularly for hybrid vehicles,
supported by changes in U.S. EV policies and other factors. In the Chinese market, amid slowing growth in overall
vehicle sales, sales of Japanese automakers remained sluggish against the backdrop of intensifying competition
from Chinese automakers, and the business environment continues to be challenging.
Under these circumstances, the Company’s consolidated net sales for the six months ended September 30, 2026,
were ¥171,354 million, an increase of 5.1% year on year. As for profits, operating profit increased 18.4% year on
year to ¥11,123 million, ordinary profit increased 18.0% year on year to ¥11,595 million, and profit attributable
to owners of parent increased 4.0% year on year to ¥7,884 million.
Results by geographic segment are as follows. Net sales include inter-segment sales.
(Japan)
Net sales increased 14.4% year on year to ¥78,061 million due to an increase in sales volume and the acquisition
of subsidiaries, and operating profit decreased 40.2% year on year to ¥912 million mainly due to an increase in
various expenses.
(Asia)
Net sales decreased 1.7% year on year to ¥66,746 million due to a decrease in sales volume, and operating profit
decreased 13.1% year on year to ¥4,147 million.
(Americas)
Net sales increased 10.3% year on year to ¥42,081 million due to foreign exchange rate fluctuations, and
operating profit increased 2.4 times year on year to ¥5,785 million mainly due to foreign exchange rate
fluctuations and recovery of tariffs in the United States.
(Europe)
Net sales decreased 15.4% year on year to ¥6,781 million due to a decrease in sales volume and the sale of a
subsidiary in France, and operating profit decreased 85.7% year on year to ¥74 million.
(2) Overview of Financial Position
As of September 30, 2026, total assets amounted to ¥308,532 million, a decrease of ¥2,943 million from the end
of the previous fiscal year, mainly due to a decrease in cash and deposits. Liabilities decreased ¥7,616 million
from the end of the previous fiscal year to ¥157,530 million, mainly due to a decrease in long-term borrowings.
Net assets increased ¥4,672 million from the end of the previous fiscal year to ¥151,002 million, mainly due to an
increase in retained earnings.
2
(3) Overview of Consolidated Financial Results Forecast and Other Forward-looking Information
The full-year consolidated earnings forecast for the fiscal year ending March 2027 announced on July 30, 2026 has
been revised as follows.
Consolidated Financial Results Forecast for Fiscal Year Ending March 31, 2027 (April 1, 2026 to March 31, 2027)
Net sales
(Millions of yen)
Operating profit
(Millions of yen)
Ordinary profit
(Millions of yen)
Profit attributable
to owners of parent
(Millions of yen)
Previous Forecast (A)
335,000
19,500
20,500
13,500
235.55
Revised Forecast (B)
340,000
20,500
21,000
13,800
240.75
Change (B – A)
5,000
1,000
500
300
―
Change (%)
1.5%
5.1%
2.4%
2.2%
―
18,287
19,229
13,074
227.61
[Reference]
Previous Fiscal Year
330,834
Results
The assumed foreign exchange rate is ¥155 = US$1.
Basic earnings
per share
(Yen)
In addition, we have revised the dividend forecast for the fiscal year ending March 31, 2027 as follows:
Dividend per Share (Yen)
Record Date
Previous Forecast
2nd quarter-end
Year-end
Annual
41.00
42.00
83.00
Revised Forecast
―
42.00
84.00
Actual Results
42.00
―
―
[Reference]
Previous Fiscal Year Results
37.00
43.00
80.00
3
- Semi-annual Consolidated Financial Statements and Primary Notes
(1) Semi-annual Consolidated Balance Sheet
(Millions of yen)
As of March 31, 2026
As of September 30, 2026
Assets
Current assets
Cash and deposits
Notes and accounts receivable - trade
Electronically recorded monetary claims operating
Merchandise and finished goods
87,663
40,407
63,487
44,660
4,508
4,268
9,795
11,677
Work in process
Raw materials and supplies
9,243
23,483
11,039
26,084
Other
Allowance for doubtful accounts
11,181
(49)
12,142
(32)
Total current assets
186,234
173,327
Buildings and structures, net
Machinery, equipment and vehicles, net
33,021
33,876
34,341
34,746
Land
Construction in progress
8,794
8,815
10,610
13,153
Other, net
6,845
6,813
Total property, plant and equipment
91,353
99,666
2,726
3,591
Non-current assets
Property, plant and equipment
Intangible assets
Investments and other assets
Investment securities
2,729
3,877
Retirement benefit asset
Deferred tax assets
22,012
4,134
22,107
3,912
Other
Allowance for doubtful accounts
2,330
(45)
2,095
(45)
Total investments and other assets
31,161
31,947
125,242
135,205
311,476
308,532
Total non-current assets
Total assets
4
(Millions of yen)
As of March 31, 2026
As of September 30, 2026
Liabilities
Current liabilities
Notes and accounts payable - trade
Electronically recorded obligations - operating
33,156
4,742
34,596
3,961
Short-term borrowings
Current portion of long-term borrowings
2,764
20,500
2,765
16,500
Accrued expenses
Income taxes payable
12,457
1,104
12,454
1,356
Provision for product warranties
Provision for bonuses for directors (and other
officers)
Other
6,977
6,674
110
65
10,410
13,245
Total current liabilities
92,223
91,619
Long-term borrowings
Deferred tax liabilities
Provision for retirement benefits for directors (and
other officers)
Retirement benefit liability
52,109
4,120
45,367
3,975
53
65
13,608
14,441
Other
3,032
2,060
Non-current liabilities
Total non-current liabilities
72,922
65,911
165,146
157,530
Share capital
Capital surplus
10,870
12,704
10,870
12,733
Retained earnings
Treasury shares
100,922
(10,386)
106,776
(9,694)
Total shareholders' equity
114,110
120,685
1,331
1,345
18,399
8,011
17,298
7,490
27,742
26,135
4,476
4,182
146,329
151,002
311,476
308,532
Total liabilities
Net assets
Shareholders' equity
Accumulated other comprehensive income
Valuation difference on available-for-sale
securities
Foreign currency translation adjustment
Remeasurements of defined benefit plans
Total accumulated other comprehensive income
Non-controlling interests
Total net assets
Total liabilities and net assets
5
(2) Semi-annual Consolidated Statements of Income and Comprehensive Income
Semi-annual Consolidated Statement of Income
(Millions of yen)
For the six months
ended September 30, 2025
For the six months
ended September 30, 2026
Net sales
Cost of sales
163,096
142,368
171,354
146,794
Gross profit
20,727
24,560
Selling, general and administrative expenses
11,329
13,436
Operating profit
9,397
11,123
607
526
110
55
56
314
Non-operating income
Interest income
Dividend income
Foreign exchange gains
Other
283
272
1,058
1,169
Interest expenses
Loss on sale and retirement of non-current assets
330
104
446
136
Other
195
114
Total non-operating expenses
630
697
9,825
11,595
Total non-operating income
Non-operating expenses
Ordinary profit
Extraordinary income
Gain on sale of non-current assets
Subsidy income
Gain on sale of investment securities
Gain on reversal of share acquisition rights
Total extraordinary income
Extraordinary losses
Loss on tax purpose reduction entry of non-current
assets
Loss on sale of shares of subsidiaries and associates
Total extraordinary losses
602
1,332
1,933
6
3,875
1,653
897
2,551
Profit before income taxes
11,150
11,595
Income taxes - current
3,718
3,610
Income taxes - deferred
(529)
(269)
Total income taxes
3,188
3,341
Profit
7,961
8,254
Profit attributable to non-controlling interests
Profit attributable to owners of parent
6
379
370
7,582
7,884
Semi-annual Consolidated Statement of Comprehensive Income
(Millions of yen)
For the six months
ended September 30, 2025
Profit
Other comprehensive income
For the six months
ended September 30, 2026
7,961
8,254
Valuation difference on available-for-sale securities
Foreign currency translation adjustment
(893)
888
14
(1,250)
Remeasurements of defined benefit plans, net of tax
(282)
(512)
Total other comprehensive income
(288)
(1,748)
Comprehensive income
7,673
6,506
Comprehensive income attributable to
Comprehensive income attributable to owners of
parent
Comprehensive income attributable to non-controlling
interests
7,370
6,277
303
229
7
(3) Notes to Semi-annual Consolidated Financial Statements
(Notes on going concern assumption)
Not applicable.
(Notes in case of significant changes in shareholders’ equity)
Not applicable.
(Changes in significant consolidated subsidiaries during the period)
During the six months ended September 30, 2026, TRIS Inc. and its seven subsidiaries are included in the scope
of consolidation.
8
(Segment information, etc.)
[Segment information]
I
For the six months ended September 30, 2025 (from April 1, 2025 to September 30, 2025)
- Information on net sales and income (loss) by reportable segment
(Millions of yen)
Reportable segment
Japan
Net sales
(1) Net sales to
outside customers
(2) Inter-segment net
sales or transfers
Total
Segment income
Asia
Americas
Europe
Total
Amount
recorded in the
quarterly
Adjustment
consolidated
(Note 1)
statements of
income
(Note 2)
49,697
67,281
38,119
7,998
163,096
—
163,096
18,523
621
27
20
19,192
△19,192
–
68,220
1,526
67,903
4,773
38,146
2,386
8,018
521
182,289
9,208
△19,192
189
163,096
9,397
(Notes) 1. The ¥ 189 million adjustment to segment income is mainly an adjustment for unrealized inter- segment
profits.
2. Segment income is adjusted with operating profit in the quarterly consolidated statements of
income.
II For the three months ended September 30, 2026 (from April 1, 2026 to September 30, 2026)
- Information on net sales and income (loss) by reportable segment
(Millions of yen)
Reportable segment
Japan
Net sales
(1) Net sales to
outside customers
(2) Inter-segment net
sales or transfers
Total
Segment income
Asia
Americas
Europe
Total
Amount
recorded in the
quarterly
Adjustment
consolidated
(Note 1)
statements of
income
(Note 2)
56,410
66,143
42,035
6,764
171,354
–
171,354
21,651
603
45
16
22,317
△22,317
–
78,061
912
66,746
4,147
42,081
5,785
6,781
74
193,671
10,919
△22,317
203
171,354
11,123
(Notes) 1. The ¥ 203 million adjustment to segment income is mainly an adjustment for unrealized inter- segment
profits.
2. Segment income is adjusted with operating profit in the quarterly consolidated statements of
income.
9
- Information on assets by reportable segment
(Significant increase in assets due to acquisition of subsidiaries)
Segment assets in Japan increased by 20,878 million yen from the end of the previous fiscal year as a result of the
acquisition of all shares of TRIS Inc. and inclusion in the scope of consolidation during the six months ended
September 30, 2026.
- Information on impairment losses on fixed assets or goodwill, etc. by reportable segment
(Significant changes in the amount of goodwill)
During the six months ended September 30, 2026, goodwill in Japan increased by 917 million yen from the end of
the previous fiscal year as a result of the acquisition of all shares of TRIS Inc. and inclusion in the scope of
consolidation.
The amount of goodwill is a provisional calculation because the allocation of acquisition costs has not been
completed.
10
(Business combination, etc.)
(Acquisition of a company, etc. through share acquisition)
At the Board of Directors meeting held on October 30, 2025, the Company resolved to make TRIS Inc., (hereinafter “TRIS”;
together with its subsidiaries, the “TRIS Group”) a subsidiary, and completed the acquisition of all shares on April 1, 2026.
- Overview of business combination
(1) Name of the acquired company and description of its business
Name of the acquired company:TRIS Inc.
Business activities
Development and manufacture of carbon brushes, carbon commutators, electrical contacts, carbon bearings, carbon
structural parts, resistors, sintered bearings, sintered machine parts, and other automotive motor components
(2) Main reasons for the business combination
The TRIS Group is the world's No. 1 manufacturer of carbon parts, including brushes used in automotive motors, and its
products, based on the company's material development, production technology, and quality control, hold the world's top
market share. By deepening collaboration with the TRIS Group, we expect synergies such as further strengthening product
competitiveness and expanding market share in the powertrain business, promoting the development of world-leading
materials and applied technologies for future-oriented development, including electrification products, and improving
development speed and creating new innovations through shorter lead times and the promotion of innovation. In addition,
this transaction is an important step based on the medium-term management plan, and will contribute to strengthening
technological capabilities, enhancing product competitiveness, and creating new innovations, with the aim of achieving a
sustained increase in corporate value.
(3) Date of business combination:April 1, 2026
(4) Legal form of business combination:Share acquisition for cash consideration
(5) Name of the entity after the combination:TRIS Inc.
(6) Ratio of voting rights acquired:100%
(7) Main basis for determining the acquiring company:As the Company acquired the shares for cash consideration.
- Periods of the acquiree's performance included in the quarterly consolidated financial statements
From April 1, 2026 to September 30, 2026
- Acquisition cost of the acquired company and breakdown by type of consideration
Consideration for acquisition Cash 7,500 million yen
Acquisition cost 7,500 million yen
- Description and amount of major acquisition-related costs
Brokerage fees, etc. :507 million yen
- Amount of goodwill recognized, cause of recognition, amortization method, and amortization period
(1) Amount of goodwill incurred:917 million yen
The above amount is tentatively calculated.
(2) Cause of recognition:This is mainly the excess profitability expected from future business development.
(3) Amortization method, and amortization period:Straight-line depreciation over 10 years
- Amounts of assets to be received and liabilities to be assumed on the date of business combination, and their main components
Current assets
14,429 million yen
Non-current assets
7,950 million yen
Total assets
22,379 million yen
Current liabilities
14,370 million yen
Non-current liabilities
1,401 million yen
Total liabilities
15,771 million yen
11
Summary of Financial Results for 2Q of FY2026
2026-10-28
・Net sales increased YoY mainly due to the foreign exchange effects (yen depreciation).
Key Points
・Operating profit increased YoY due to factors such as the foreign exchange effects (yen depreciation), and earning profitability.
- Trends in Consolidated Financial Results
・The full year forecast has been revised upward, reflecting the progress achieved through 2Q and latest forecast for the second half.
Net sales
As a result, net sales, operating profit,ordinary profit, and profit are expected to reach record highs.
- Consolidated Financial Results
FY2025 (Apr. 2025–Sep. 2025)
FY2026 (Apr. 2026–Sep. 2026)
Sales ratio (%)
Sales ratio (%)
Amount
Amount
Record highs
%
(100.0)
163,096
(100.0) ★171,354
8,258
5.1%
FY2024
166,403
Operating profit
(5.8)
9,397
(6.5) ★11,123
1,725
18.4%
FY2024
10,957
Ordinary profit
(6.0)
9,825
(6.8) ★11,595
1,769
18.0%
FY2024
11,285
Profit
(4.6)
7,582
(4.6)
7,884
302
4.0%
FY2024
8,007
131.17
137.82
6.65
5.1%
146
159
Net sales
Basic earnings per share (yen)
Exchange rate (JPY/USD)
Capital adequacy ratio (%)
45.5% (Sep. 30, 2026)
(Mar. 31, 2026)
[Depreciated by 13 yen]
2.1%
―
Total assets
311,476
308,532
△2,943
△0.9%
Net assets
146,329
151,002
4,672
3.2%
25
33
8
―
Consolidated subsidiaries
1,062
22
23
117
93
86
+19
△1
30
22
111
Sales volume +3
(+17)
Net sales
FY2025
Selling price
Expenses, etc.
Labor costs
Profitability
FY2026
- Results by Geographical Segments (excluding consolidation adjustments)
750
Net Sales (2Q)
857
699
FY2025
Operating profit (2Q)
FY2026
694
47
424
384
81
Japan
(100 million yen)
Asia
Americas
15
68
Europe
FY2025
57
41
23
9
5
Japan
Asia
Americas
FY2026 (Apr. 2026–Mar. 2027)
Sales ratio (%)
Sales ratio (%)
Amount
Amount
0
Europe
- Consolidated Financial Results Forecast for FY2026
FY2025 (Apr. 2025–Mar. 2026)
FY2026
(Million yen)
YoY Changes
Amount
Latest Announced Figures
%
Sales ratio (%)
Amount
Compared to Latest Announced Figures
Amount
%
(100.0)
330,834
(100.0)★ 340,000
9,165
2.8%
(100.0)
335,000
5,000
1.5%
Operating profit
(5.5)
18,287
2,212
12.1%
(5.8)
19,500
1,000
5.1%
Ordinary profit
(5.8)
19,229
1,770
9.2%
(6.1)
20,500
500
2.4%
Profit
(4.0)
13,074
★ (6.0) ★ 20,500
★ (6.2) ★ 21,000
725
5.5%
(4.0)
13,500
300
2.2%
13.14
5.8%
5.20
2.2%
Net sales
Basic earnings per share (yen)
Exchange rate (JPY/USD)
(4.1) ★ 13,800
227.61
240.75
151
155
★ is record high
[Depreciated by 4 yen]
235.55
152
[Depreciated by 3 yen]
22
26
2Q
4.9%
154
85
Full Year
Operationg margin
5.4%
5.5%
183
182
109
23
111
93
24
6.0%
205
25
26
Dividend per share & payout ratio
Full Year
ROE
9.8%
9.4%
9.4%
132
130
138
(Yen)
29.3%
28
27
23
75
80
75
78
23
24
25
26
22
122
126
51
38
24
23
250
2Q
240
151
26
2Q
139
24
25
26
Depreciation
2Q
Full Year
137
135
150
26
ROIC, WACC
4.5%
22
23
24
25
26
22
Total
Hyundai
Honda
Yamaha Motor
Nissan
SUZUKI
Others
Total
42
25
74
Daihatsu Motor, etc.
37
24
67
Group
31
23
65
Customer name
Toyota Motor Toyota Motor
42
22
63
(2) By customer
43
37
73
52
Other automobile parts
Automobile parts total
Other than automobile parts
Total
34.9%
84
63
129
Valve train system products (engine valves)
35.1%
80
32.1%
68
68
111
Product name
Fuel pump modules
Throttle bodies
Canisters
EGR valves
Payout ratio
71
Full Year
150
Year-end dividend per share
51
134
- Breakdown of Net Sales
(1) By product
55
(100 million yen)
148
129
61
25
R&D expenditure
Full Year
Interim dividend per share
25.9%
35
20
15
(100 million yen)
Forex effect +18
25
(100 million yen) Capital investment
Operating Profit (2Q)
△9
24
Profit attributable to owners of parent & ROE
22
- Profit Drivers (year-on-year)
136
1,713
1,630
2Q
- Trends in Financial Indicators
37
(100 million yen)
△12
5.7%
3,400
3,308
54
85
Note: Profit represents “profit attributable to owners of parent.” ★ is record high
+21
1,664
1,477
(100 million yen)
9.7%
8.4%
47.6%
(100 million yen)
Operating profit
Full Year
2,408
YoY Changes
Amount
3,372
3,143
(Million yen)
2Q
6.9%
7.4%
8.1%
5.8%
23
ROIC
WACC
7.0%
7.5%
5.7%
5.0%
5.7%
24
25
26
(100 million yen)
FY2025(2Q)
Amount
%
855
52%
211
13%
198
12%
110
7%
52
3%
158
10%
1,584
97%
46
3%
1,630
100%
FY2026(2Q)
Amount
%
872
51%
202
12%
198
12%
113
7%
56
3%
227
13%
1,668
97%
44
3%
1,713
100%
YoY Changes
Amount
%
17
2%
△9
△4%
△0
△0%
3
3%
4
8%
69
44%
84
5%
△2
△4%
83
5%
FY2025(2Q)
Amount
%
799
49%
112
7%
911
56%
177
11%
97
6%
81
5%
71
4%
41
3%
252
15%
1,630
100%
FY2026(2Q)
Amount
%
834
49%
130
8%
965
56%
171
10%
97
6%
91
5%
62
4%
47
3%
280
16%
1,713
100%
YoY Changes
Amount
%
35
4%
18
16%
54
6%
△6
△3%
0
0%
10
12%
△9
△13%
6
15%
28
11%
83
5%












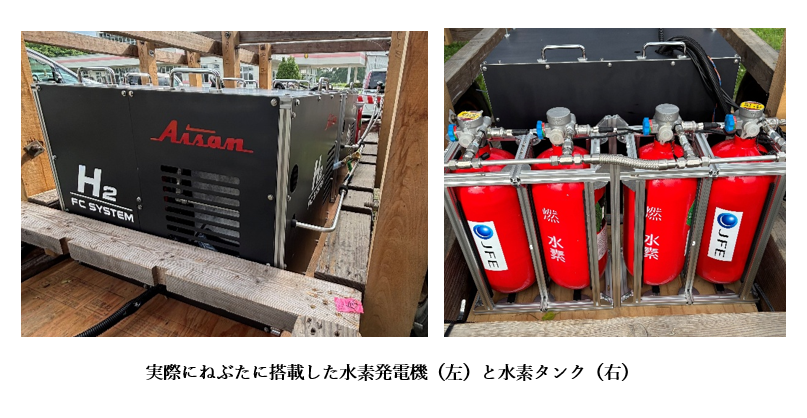



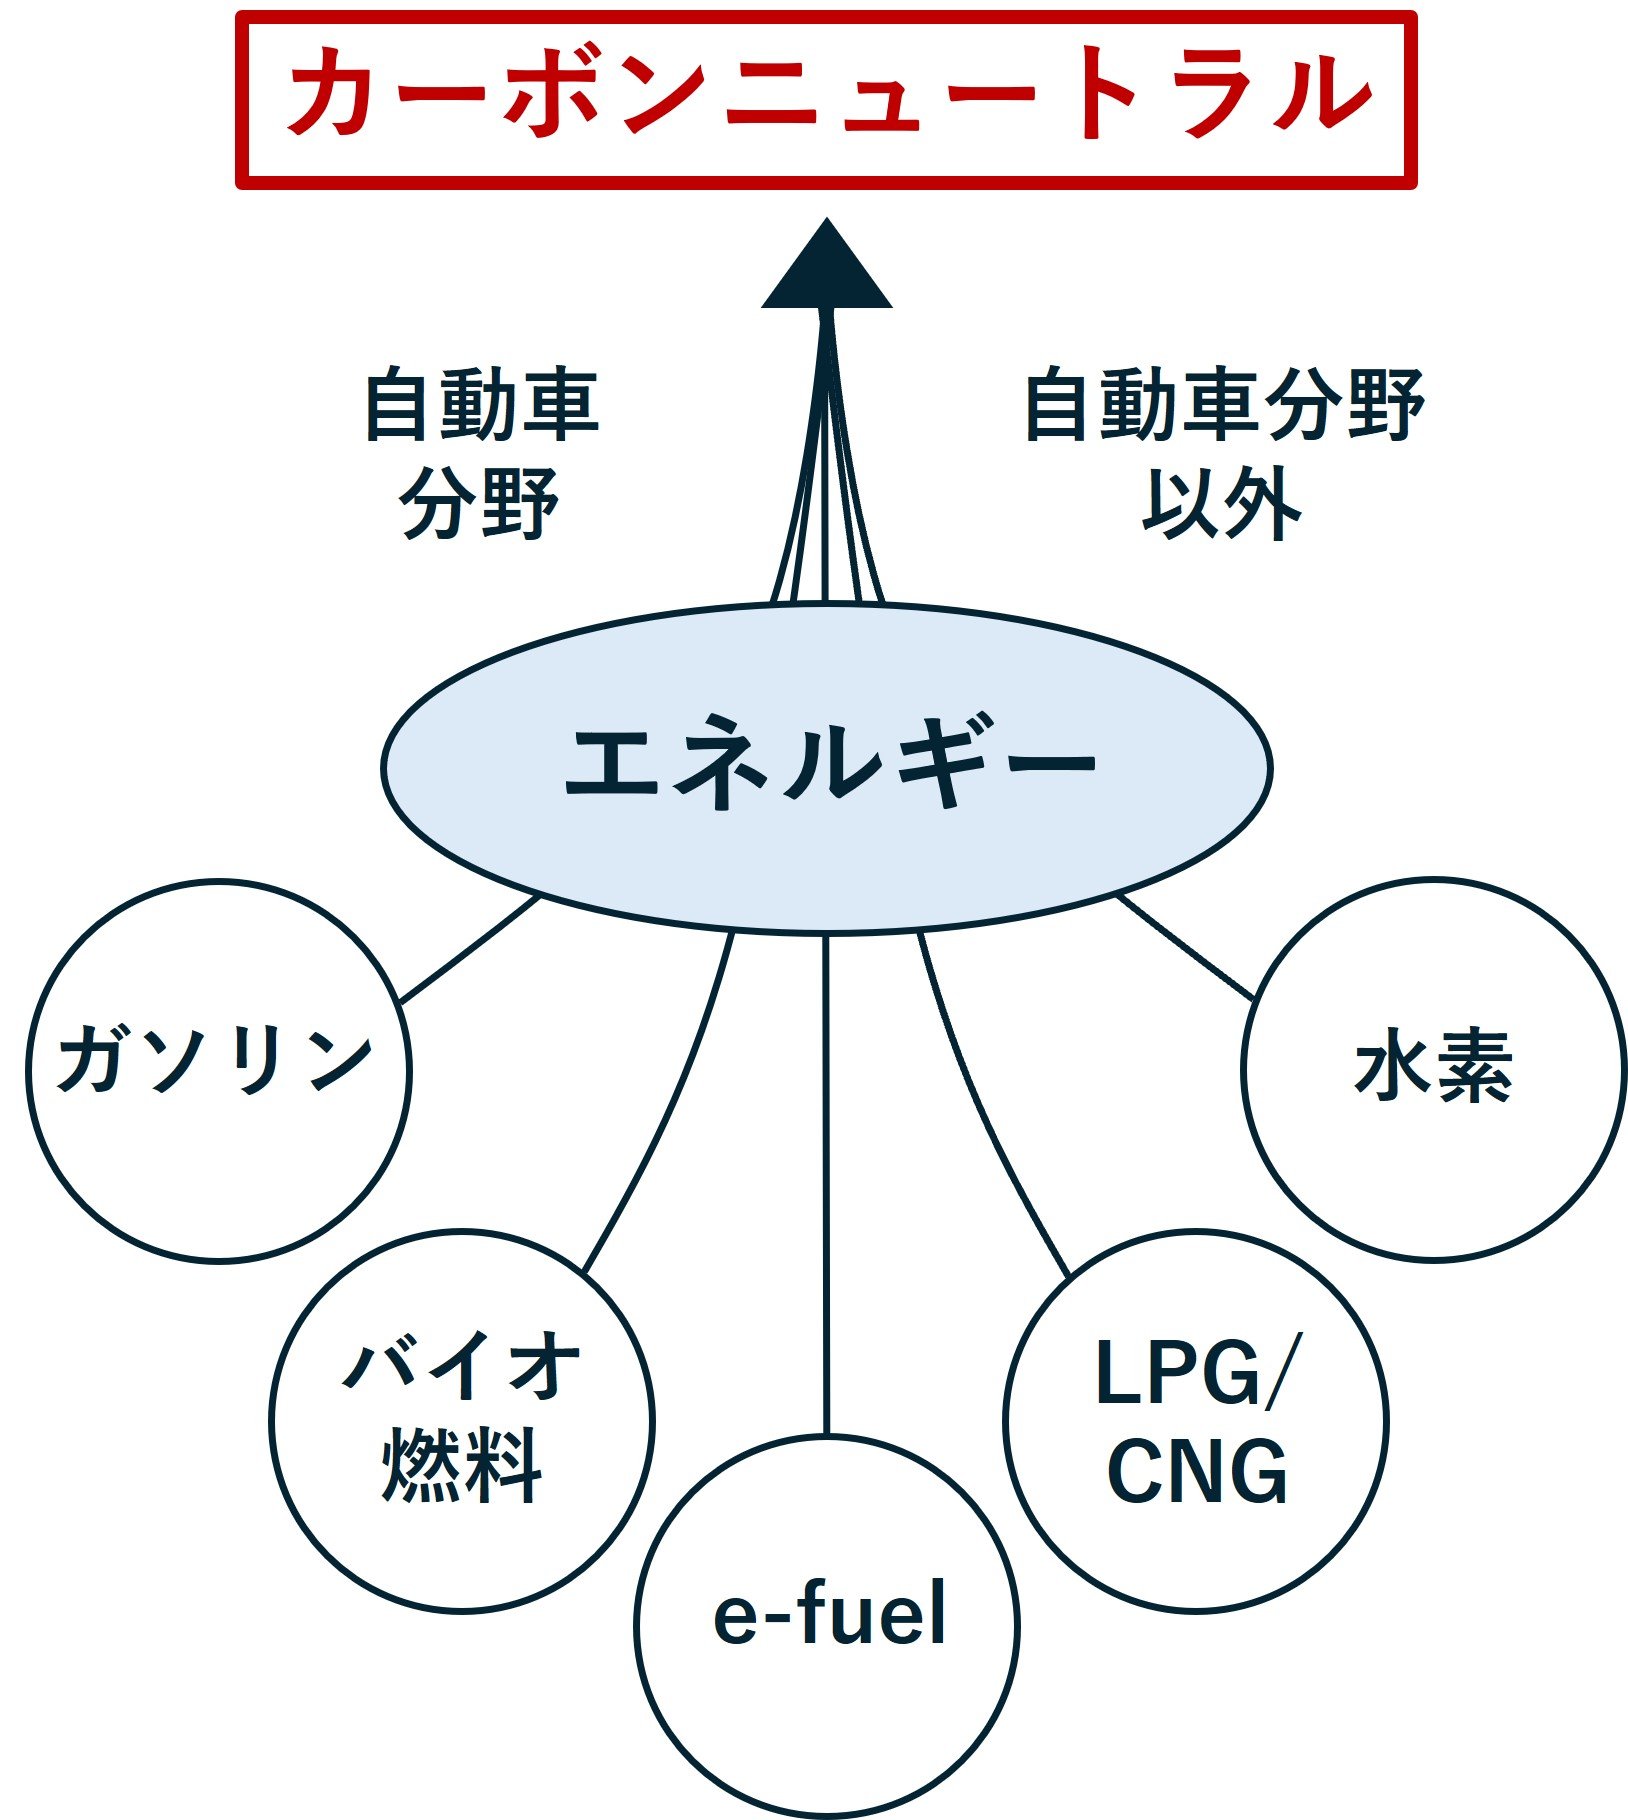 脱炭素社会の実現に向けて、自動車業界では電動化が急速に進んでいます。しかし当社は、世界中のすべてのモビリティが将来単一のエネルギーへ移行するとは考えておらず、それぞれの地域に応じた利用環境や用途、インフラ整備状況によって最適なエネルギーは異なり、ガソリン、バイオ燃料、e-fuel、LPG/CNG、そして水素など、ニーズに合わせた多様な選択肢が共存する未来を想定しています。
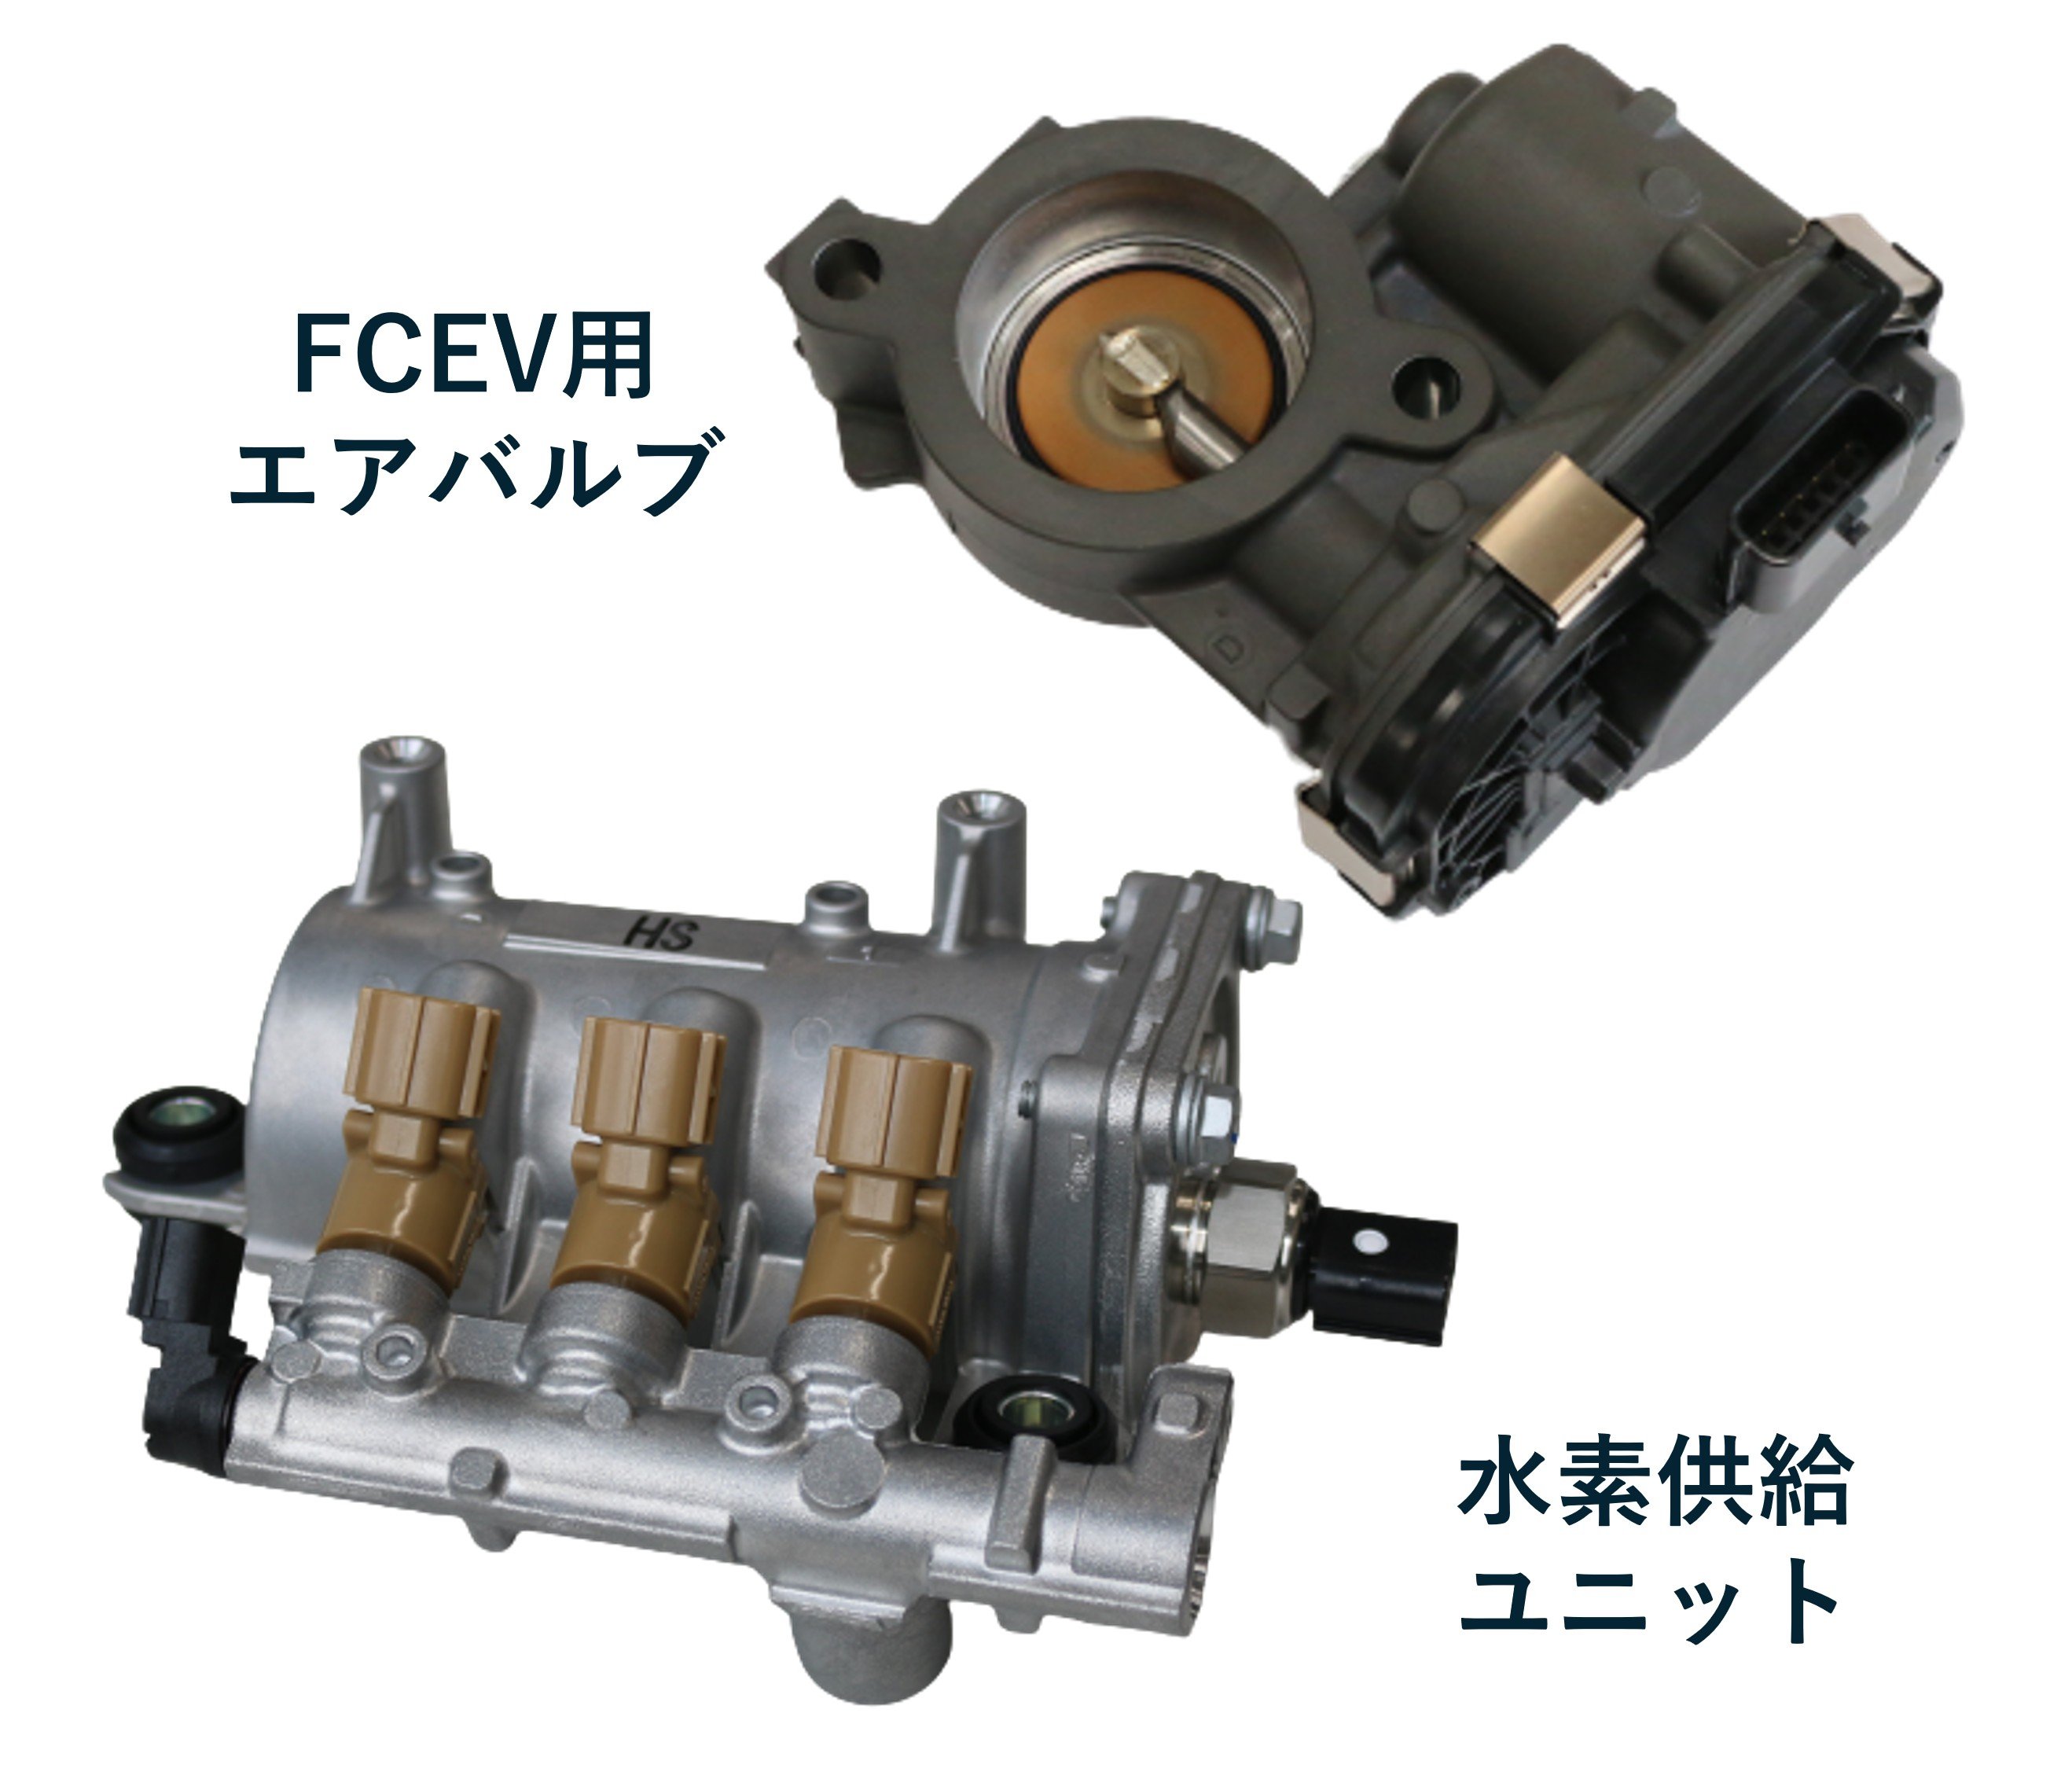 当社にとって、水素は決してゼロから挑む未知の領域ではありません。長年にわたるLPGやCNGなどのガス燃料を扱う製品の開発・製造を通じて、高度な燃料制御技術を培ってきました。これらの経験を通じて蓄積された技術は、水素という新たな燃料へ応用できる可能性を秘めています。