EDINET提出書類 株式会社TBK(E02201) 有価証券報告書 【表紙】 【提出書類】 有価証券報告書 【根拠条文】 金融商品取引法第24条第1項 【提出先】 関東財務局長 【提出日】 2026年6月25日 【事業年度】 第90期(自 【会社名】 株式会社TBK 【英訳名】 TBK…
EDINET提出書類
株式会社TBK(E02201)
有価証券報告書
【表紙】
【提出書類】
有価証券報告書
【根拠条文】
金融商品取引法第24条第1項
【提出先】
関東財務局長
【提出日】
2026年6月25日
【事業年度】
第90期(自
【会社名】
株式会社TBK
【英訳名】
TBK Co., Ltd.
【代表者の役職氏名】
代表取締役社長
【本店の所在の場所】
東京都町田市南成瀬四丁目21番地1
【電話番号】
042(739)1471
【事務連絡者氏名】
広報・IR部ディレクター
【最寄りの連絡場所】
東京都町田市南成瀬四丁目21番地1
【電話番号】
042(739)1471
【事務連絡者氏名】
広報・IR部ディレクター
【縦覧に供する場所】
株式会社東京証券取引所
2025年4月1日
尾方
至
2026年3月31日)
馨
信藤
信藤
康之
康之
(東京都中央区日本橋兜町2番1号)
1/122
EDINET提出書類
株式会社TBK(E02201)
有価証券報告書
第一部【企業情報】
第1【企業の概況】
1【主要な経営指標等の推移】
(1)連結経営指標等
回次
第86期
第87期
第88期
第89期
第90期
決算年月
2022年3月
2023年3月
2024年3月
2025年3月
2026年3月
売上高
(百万円)
51,194
53,522
56,659
54,415
54,756
経常利益又は経常損失(△)
(百万円)
1,232
△623
841
309
1,730
親会社株主に帰属する当期
純利益又は親会社株主に帰
属する当期純損失(△)
(百万円)
783
△2,065
332
△1,204
△131
包括利益
(百万円)
2,368
△756
1,947
15
2,395
純資産額
(百万円)
28,479
27,529
29,358
29,112
32,384
総資産額
(百万円)
50,476
52,179
56,536
53,125
56,511
1株当たり純資産額
(円)
986.50
947.66
1,004.92
991.52
987.18
1株当たり当期純利益又は1株
当たり当期純損失(△)
(円)
27.62
△72.76
11.68
△42.26
△4.44
潜在株式調整後1株当たり当期
純利益
(円)
−
−
−
−
−
自己資本比率
(%)
55.4
51.6
50.6
53.2
55.5
自己資本利益率
(%)
2.9
△7.5
1.2
△4.2
△0.4
株価収益率
(倍)
13.5
−
32.3
−
−
営業活動による
キャッシュ・フロー
(百万円)
4,292
2,539
3,163
3,894
4,001
投資活動による
キャッシュ・フロー
(百万円)
△2,343
△3,847
△2,521
△2,323
△1,647
財務活動による
キャッシュ・フロー
(百万円)
△1,843
958
△372
△1,885
492
現金及び現金同等物の期末残高
(百万円)
4,213
3,924
4,254
4,123
7,344
2,008
1,956
1,885
1,880
1,893
(769)
(862)
(1,061)
(884)
(851)
従業員数
(外、平均臨時雇用者数)
(名)
(注)1.潜在株式調整後1株当たり当期純利益については、潜在株式が存在しないため記載しておりません。なお、
第87期、第89期及び第90期の潜在株式調整後1株当たり当期純利益については、1株当たり当期純損失であ
り、また、潜在株式が存在しないため記載しておりません。
2.第87期、第89期及び第90期の株価収益率は、親会社株主に帰属する当期純損失であるため記載しておりませ
ん。
2/122
EDINET提出書類
株式会社TBK(E02201)
有価証券報告書
(2)提出会社の経営指標等
回次
第86期
第87期
第88期
第89期
第90期
決算年月
2022年3月
2023年3月
2024年3月
2025年3月
2026年3月
売上高
(百万円)
26,142
25,928
26,607
25,156
27,569
経常利益又は経常損失(△)
(百万円)
369
△134
79
199
675
当期純利益又は当期純損失(△) (百万円)
50
△1,607
1,557
△1,106
77
資本金
(百万円)
4,617
4,617
4,617
4,617
5,186
発行済株式総数
(株)
29,424,635
29,424,635
29,424,635
29,424,635
32,694,135
純資産額
(百万円)
16,709
15,044
16,943
15,549
16,763
総資産額
(百万円)
27,151
26,087
29,323
27,336
29,384
1株当たり純資産額
(円)
588.94
529.85
595.16
545.76
527.72
1株当たり配当額
(円)
12.00
0.00
10.00
8.00
8.00
(内、1株当たり中間配当額)
(円)
(5.00)
(0.00)
(5.00)
(4.00)
(4.00)
1株当たり当期純利益又は1株
当たり当期純損失(△)
(円)
1.78
△56.62
54.72
△38.84
2.63
潜在株式調整後1株当たり当期
純利益
(円)
−
−
−
−
−
自己資本比率
(%)
61.5
57.7
57.8
56.9
57.0
自己資本利益率
(%)
0.3
△10.1
9.7
△6.8
0.5
株価収益率
(倍)
209.0
−
6.9
−
135.0
配当性向
(%)
674.2
−
18.3
−
304.2
361
365
716
713
713
(109)
(107)
(312)
(285)
(289)
(%)
85.1
64.5
88.5
72.5
87.1
(比較指標:TOPIX 輸送用機器) (%)
(111.6)
(103.3)
(179.8)
(132.7)
(152.6)
従業員数
(外、平均臨時雇用者数)
株主総利回り
(名)
最高株価
(円)
458
377
478
380
424
最低株価
(円)
367
227
266
250
250
(注)1.潜在株式調整後1株当たり当期純利益については、潜在株式が存在しないため記載しておりません。なお、
第87期及び第89期の潜在株式調整後1株当たり当期純利益については、1株当たり当期純損失であり、ま
た、潜在株式が存在しないため記載しておりません。
2.第87期及び第89期の株価収益率及び配当性向は、当期純損失であるため記載しておりません。
3.最高株価及び最低株価は、2023年10月20日より東京証券取引所(スタンダード市場)におけるものであり
2022年4月4日より2023年10月19日は東京証券取引所(プライム市場)、それ以前は東京証券取引所(市場
第一部)におけるものであります。
3/122
EDINET提出書類
株式会社TBK(E02201)
有価証券報告書
2【沿革】
当社(旧東京部品工業株式会社、株式額面500円、実質上の存続会社)は、1965年5月1日を合併期日として株式額
面金額の変更のために、日本油圧機器工業株式会社(本店所在地:東京都大田区南六郷一丁目26番地、株式額面50円、
形式上の存続会社)に吸収合併されました。また、合併期日に合併新会社の商号を東京部品工業株式会社とし、本店所
在地を東京都大田区萩中三丁目30番17号に移転しております。
従いまして、会社の沿革につきましては、合併期日である1965年5月1日以前の状況については、特段のことわりが
ない限り、実質上の存続会社について記載しております。
1949年8月
1951年3月
1956年10月
1957年12月
1963年8月
1970年9月
1971年11月
1972年1月
1973年9月
1983年12月
1986年2月
1990年3月
1990年11月
1995年8月
1996年10月
1998年10月
1999年5月
1999年6月
2000年11月
2002年1月
2003年5月
2004年3月
2005年3月
2005年7月
2005年8月
2006年11月
2007年1月
2007年3月
2007年5月
2011年2月
2011年9月
2012年4月
2014年10月
2017年2月
2017年10月
2018年2月
2018年11月
2018年12月
2019年12月
2022年4月
2023年10月
2024年1月
2025年11月
いすゞ部品工業株式会社を設立
東京ブレーキ工業株式会社を設立
上記2社を合併して東京部品工業株式会社を設立
東京都大田区萩中三丁目30番17号に新工場を建設し、本社及び工場を移転
第一精機株式会社を吸収合併
子会社として福島県に東京精工株式会社を設立
東京証券取引所市場第二部に株式公開
本社及び工場を神奈川県大和市つきみ野一丁目6番地1に移転
子会社として山形県に鶴岡ブレーキ株式会社を設立
米国ロックウェル・インターナショナル社との合弁会社東京部品ロックウェル株式会社(ティー
ビーアール株式会社の前身)を設立
子会社としてティービーケイ販売株式会社(現 TBK販売株式会社、連結子会社)を設立
タイ国シー・エム・インダストリー社との合弁会社 TBK Krungthep Co., Ltd.を設立
ティービーアール株式会社が鶴岡ブレーキ株式会社を吸収合併(現鶴岡工場)
子会社として香港にFull Win Developments Ltd.(現連結子会社)を設立
タイ国シー・エム・インダストリー社との合弁会社 TBK Brake Co., Ltd.(現 TBKK(Thailand)
Co.,Ltd.、連結子会社)を設立
インドのリュブリケアー社との合弁会社 TBK India Private Ltd.を設立
工場を福島県石川郡玉川村大字川辺字宮ノ前304番地7に移転
本社を東京都町田市南成瀬四丁目21番地1に移転
旧本社工場跡地に東京部品工業ビル(ショッピングセンター「つきみ野サティ」(イオンつきみ野
店))を建設し、賃貸ビル事業を開始
子会社として米国にTBK America, Inc.を設立
子会社として中国にChang'an TBK Co., Ltd.(現 Dongguan TBK Co., Ltd.、連結子会社)を設立
TBK Krungthep Co., Ltd.の全営業権をTBK Brake Co., Ltd.へ譲渡
東京証券取引所市場第一部銘柄に指定
商号を株式会社TBK(TBK Co., Ltd.)に変更
中国の長春世立汽車制動零部件有限責任公司との合弁会社 Changchun TBK SHILI Auto Parts
Co., Ltd.(現連結子会社)を設立
TBK America, Inc.リッチモンド工場の操業開始
ISO/TS16949認証取得
ISO14001認証取得
子会社として中国にTBK China Co., Ltd.(現 Dongguan TBK Co., Ltd.、連結子会社)を設立
子会社として中国にQiaotou TBK Co., Ltd.(現 Dongguan TBK Co., Ltd.、連結子会社)を設立
TBK India Private Ltd.(現連結子会社)の子会社化
中国の長春一汽四環汽車制動器有限公司との合弁会社Changchun FAW Sihuan TBK Co., Ltd.(現
Changchun FAWSN TBK Co., Ltd.、持分法適用関連会社)を設立
子会社としてタイ国にTBK TECHNOLOGY (THAILAND) CO., LTD. (現連結子会社)を設立
旧本社工場跡地の東京部品工業ビル(イオンつきみ野店)を売却
IATF16949認証取得
木村可鍛株式会社(現連結子会社)の株式取得
株式会社サンテック(現連結子会社)の株式取得
子会社として中国にTongchuan TBK Auto Parts Co.,Ltd. (現連結子会社)を設立
Dongguan TBK Co., Ltd.がChang'an TBK Co., Ltd.及びTBK China Co., Ltd.を吸収合併
東京証券取引所の市場区分の見直しにより、東京証券取引所の市場第一部からプライム市場に移行
東京証券取引所スタンダード市場に移行
連結子会社である東京精工株式会社及びティービーアール株式会社を吸収合併
TBK America, Inc.を清算
4/122
EDINET提出書類
株式会社TBK(E02201)
有価証券報告書
3【事業の内容】
当社グループは、当社及び子会社11社及び関連会社2社で構成され、自動車部品等製造事業を営んでおります。
主要な地域として「日本」、「アジア」、「中国」において関係会社が存在し、セグメントを区分して各地域に適
した包括的な戦略を立案し、事業活動を展開しております。
自動車部品等製造事業は、以下の2区分において制動装置(ブレーキ)、エンジン用ウォーターポンプ、オイルポ
ンプ等の製造販売を行っております。
ブレーキ部門……小型車から大型トラック・バス用の重要保安部品であるブレーキについては、当社が製造販売し
ております。一部部品及び原材料については、「日本」の木村可鍛株式会社、「中国」の香港
Full Win Developments Ltd.から、当社が仕入れております。また、一部部品については、「ア
ジア」のタイ国TBKK(Thailand)Co.,Ltd.に納入しております。
エンジンコンポーネント他部門
………小型車から大型トラック・バス用のエンジン冷却用ウォーターポンプ・潤滑用オイルポンプにつ
いては、当社が製造販売しております。また、当社で仕入れた一部部品については、「アジア」
のタイ国TBKK(Thailand)Co.,Ltd.、インド国TBK India Private Ltd.に納入しております。
その他については、当社はリターダ等の製造販売を行っており、「日本」の株式会社サンテック
は工作機械の製造販売をしております。
なお、以上の2区分ともに、必要に応じて当社から「日本」のTBK販売株式会社に納入しており
ます。
TBK販売株式会社では、この他にブレーキ部門の一部製品を「中国」の中国Dongguan TBK Co.,
Ltd.から仕入れております。
事業の系統図は次のとおりであります。なお、これらは「第5 経理の状況
諸表注記事項」に掲げるセグメントと同一区分での記載を行っております。
1
連結財務諸表等
(1)連結財務
(注)1.Changchun FAWSN TBK Co., Ltd.は、ブレーキの製造販売を行っております。
2.連結子会社であったTBK America, Inc.は生産の最適化を目的として、2025年11月25日に清算を結了したこと
に伴い、連結子会社より除外いたしました。
5/122
EDINET提出書類
株式会社TBK(E02201)
有価証券報告書
4【関係会社の状況】
名称
住所
資本金又は
出資金
主要な事業の
内容(注)1
議決権
の所有
割合
関係内容
(%)
(連結子会社)
木村可鍛株式会社
福島県
白河市
95
百万円
ブレーキ
100.0
ブレーキ部品の仕入
資金の貸付
役員の兼任あり
株式会社サンテック
(注)3
静岡県
浜松市
50
百万円
エンジンコン
ポーネント他
100.0
役員の兼任あり
TBK販売株式会社
東京都
町田市
160
百万円
ブレーキ
エンジンコン
ポーネント他
100.0
ブレーキ製品・ウォーターポン
プ・オイルポンプ製品の販売
役員の兼任あり
タイ国
チョンブ
リ県
243
百万バーツ
ブレーキ
エンジンコン
ポーネント他
94.8
ブレーキ部品の販売
ウォーターポンプ・オイルポン
プ部品の販売
タイ国
チョンブ
リ県
232
百万バーツ
ブレーキ
100.0
(40.0)
−
インド国
マハラ
シュトラ
州
288
百万ルピー
エンジンコン
ポーネント他
80.0
(20.0)
ウォーターポンプ・オイルポン
プの製造販売、資金の貸付
債務の保証、社債の引受
Full Win Developments Ltd.
香港九龍
15
百万香港ドル
ブレーキ
100.0
ブレーキ部品の仕入
債務の保証
役員の兼任あり
Dongguan TBK Co., Ltd.
中国広東
33
省東莞市百万香港ドル
ブレーキ
100.0
(100.0)
債務の保証
役員の兼任あり
中国吉林
省長春市
78
百万人民元
ブレーキ
100.0
資金の貸付
役員の兼任あり
中国陝西
省銅川市
101
百万人民元
ブレーキ
100.0
(100.0)
−
TBKK(Thailand)Co., Ltd.
(注)3.6
TBK TECHNOLOGY (THAILAND)
CO., LTD.
(注)2.3
TBK India Private Ltd.
(注)2.3
(注)2
Changchun TBK SHILI Auto
Parts Co., Ltd.
(注)3
Tongchuan TBK Auto Parts
Co., Ltd.
(注)2.3
その他1社
6/122
EDINET提出書類
株式会社TBK(E02201)
有価証券報告書
名称
住所
資本金又は
出資金
主要な事業の
内容
議決権
の所有
割合
関係内容
(%)
(持分法適用関連会社)
Changchun FAWSN TBK
Co., Ltd.
中国吉林
省長春市
160
百万人民元
ブレーキ
20.0
ブレーキ部品の販売
役員の兼任あり
(注)1.上記子会社の主要な事業を表示しております。
2.議決権の所有割合の(内書)は間接所有割合であります。
3.特定子会社に該当しております。
4.有価証券届出書又は有価証券報告書を提出している会社はありません。
5.TBK America, Inc.は生産の最適化を目的として、2025年11月25日に清算いたしました。
6.TBKK(Thailand)Co., Ltd.については、売上高(連結会社相互間の内部売上高を除く。)の連結売上高に占
める割合が10%を超えております。
主要な損益情報等
(1)売上高
14,981百万円
(2)経常利益
762百万円
(3)当期純利益
622百万円
(4)純資産額
14,578百万円
(5)総資産額
18,690百万円
7/122
EDINET提出書類
株式会社TBK(E02201)
有価証券報告書
第2【事業の状況】
1【経営方針、経営環境及び対処すべき課題等】
当社グループの経営方針、経営環境及び対処すべき課題等は、以下のとおりであります。
なお、文中の将来に関する事項は、当連結会計年度末現在において当社グループが判断したものであります。
(1)経営方針
当社グループでは「お客様に喜んで頂く商品をつくり、社会に貢献する。」を経営理念に掲げております。技術革
新と環境対応の両面で大きな変革期にある自動車業界において、社会的課題の解決に寄与する製品開発を進め、安全
で高品質な製品を提供し続けることにより持続的な成長と価値創造を実現します。この実現のために様々な変革を実
行し、社会にとって必要な企業であり続けることが株主の皆様をはじめ、当社を取り巻くすべてのステークホルダー
にとって真の企業価値の向上をもたらすものと考えております。
(2)経営環境、経営戦略等
当社グループを取り巻く経営環境は、トラック市場の需要変動に加え、自動車産業における電動化の進展、地政学
リスクの高まり、原材料・エネルギー価格の高止まりなどにより、先行き不透明な状況が継続しております。
特に海外市場においては、タイを中心としたアセアン市場での需要回復の遅れ、中国市場では需要の回復に時間が
掛かっていることや、価格競争の激化など、地域ごとの市場構造変化への対応が重要な経営課題となっております。
こうした環境変化に的確に対応するため、2025年4月にスタートした第16次中期経営計画では、「コア技術・コア
製品の強化」「事業基盤の変革」「新領域への挑戦」この3つを基本方針に定め、諸施策に取り組んでおります。
①コア技術・コア製品の強化
当社グループが事業を展開する自動車関連業界においては、EV市場の成長に一部調整局面が見られるものの、環
境規制の強化やカーボンニュートラル実現に向けた動きは中長期的に継続するものと認識しております。一方で、
国・地域ごとに異なる政策動向や市場特性を背景に、内燃機関を含む多様なパワートレインが当面併存すると見込
まれております。
このような事業環境のもと、当社グループの主力製品であるドラムブレーキ、ポンプ類、エンジン部品について
は、商用車需要の回復を背景として堅調に推移しております。国内を中心とした販売数量の増加や新規受注の獲
得、原材料価格上昇に対する販売価格への一部転嫁、内製化や合理化による原価低減施策に取り組んでおります。
また、当社グループは鋳造技術を中核とした保有技術の高度化を進めております。アルミダイカスト(ADC)お
よびグラビティダイカスト(GDC)製品の拡充に加え、海外子会社における内製化・自動化の推進や大型アルミダ
イカスト設備の導入を進めることで、高付加価値製品への対応力およびコスト競争力の向上に取り組んでおりま
す。これらを「素形材事業」として位置付け、金型内製を含む一貫生産体制の高度化を通じ、収益基盤の安定化と
競争力の強化を図ってまいります。
②事業基盤の変革
鋳物事業を中心とした生産体制の最適化に取り組んでおります。市場環境や需要動向の変化に対応するため、国
内外拠点の役割分担や生産能力の見直しを行い、グローバルで効率的な生産体制の構築を進めております。
国内においては、鋳物事業における採算性や原価構造の可視化を進めるとともに、顧客との協働による物流改善
等を通じ、付加価値向上を図っております。海外では、アジア地域を中心に自動化設備の導入や生産性改善を進
め、品質の安定化およびコスト競争力の強化に取り組んでおります。中国事業については、需要停滞が続く状況を
踏まえ、生産体制および組織体制の再構築を進め、収益改善を図っております。
さらに、2025年4月より本部制度を導入し、責任と権限を明確化することで、迅速な意思決定と事業変革の推進
を可能とする体制を構築しました。加えて、DXの活用による生産実績管理やトレーサビリティの強化、外部専門家
を通じ、生産性向上と事業基盤の強化に取り組んでおります。
③新領域への挑戦
持続的な成長を実現するため、新規マーケット顧客の獲得、グローバルアライアンスの強化およびシステム領域
への展開を推進しております。
新規マーケット顧客の獲得については、既存事業領域に加え、新分野への展開を図っており、国内外における営
業活動および技術提案活動を継続しております。電動化・自動化および環境対応製品については、重点分野として
開発および拡販に取り組んでおります。
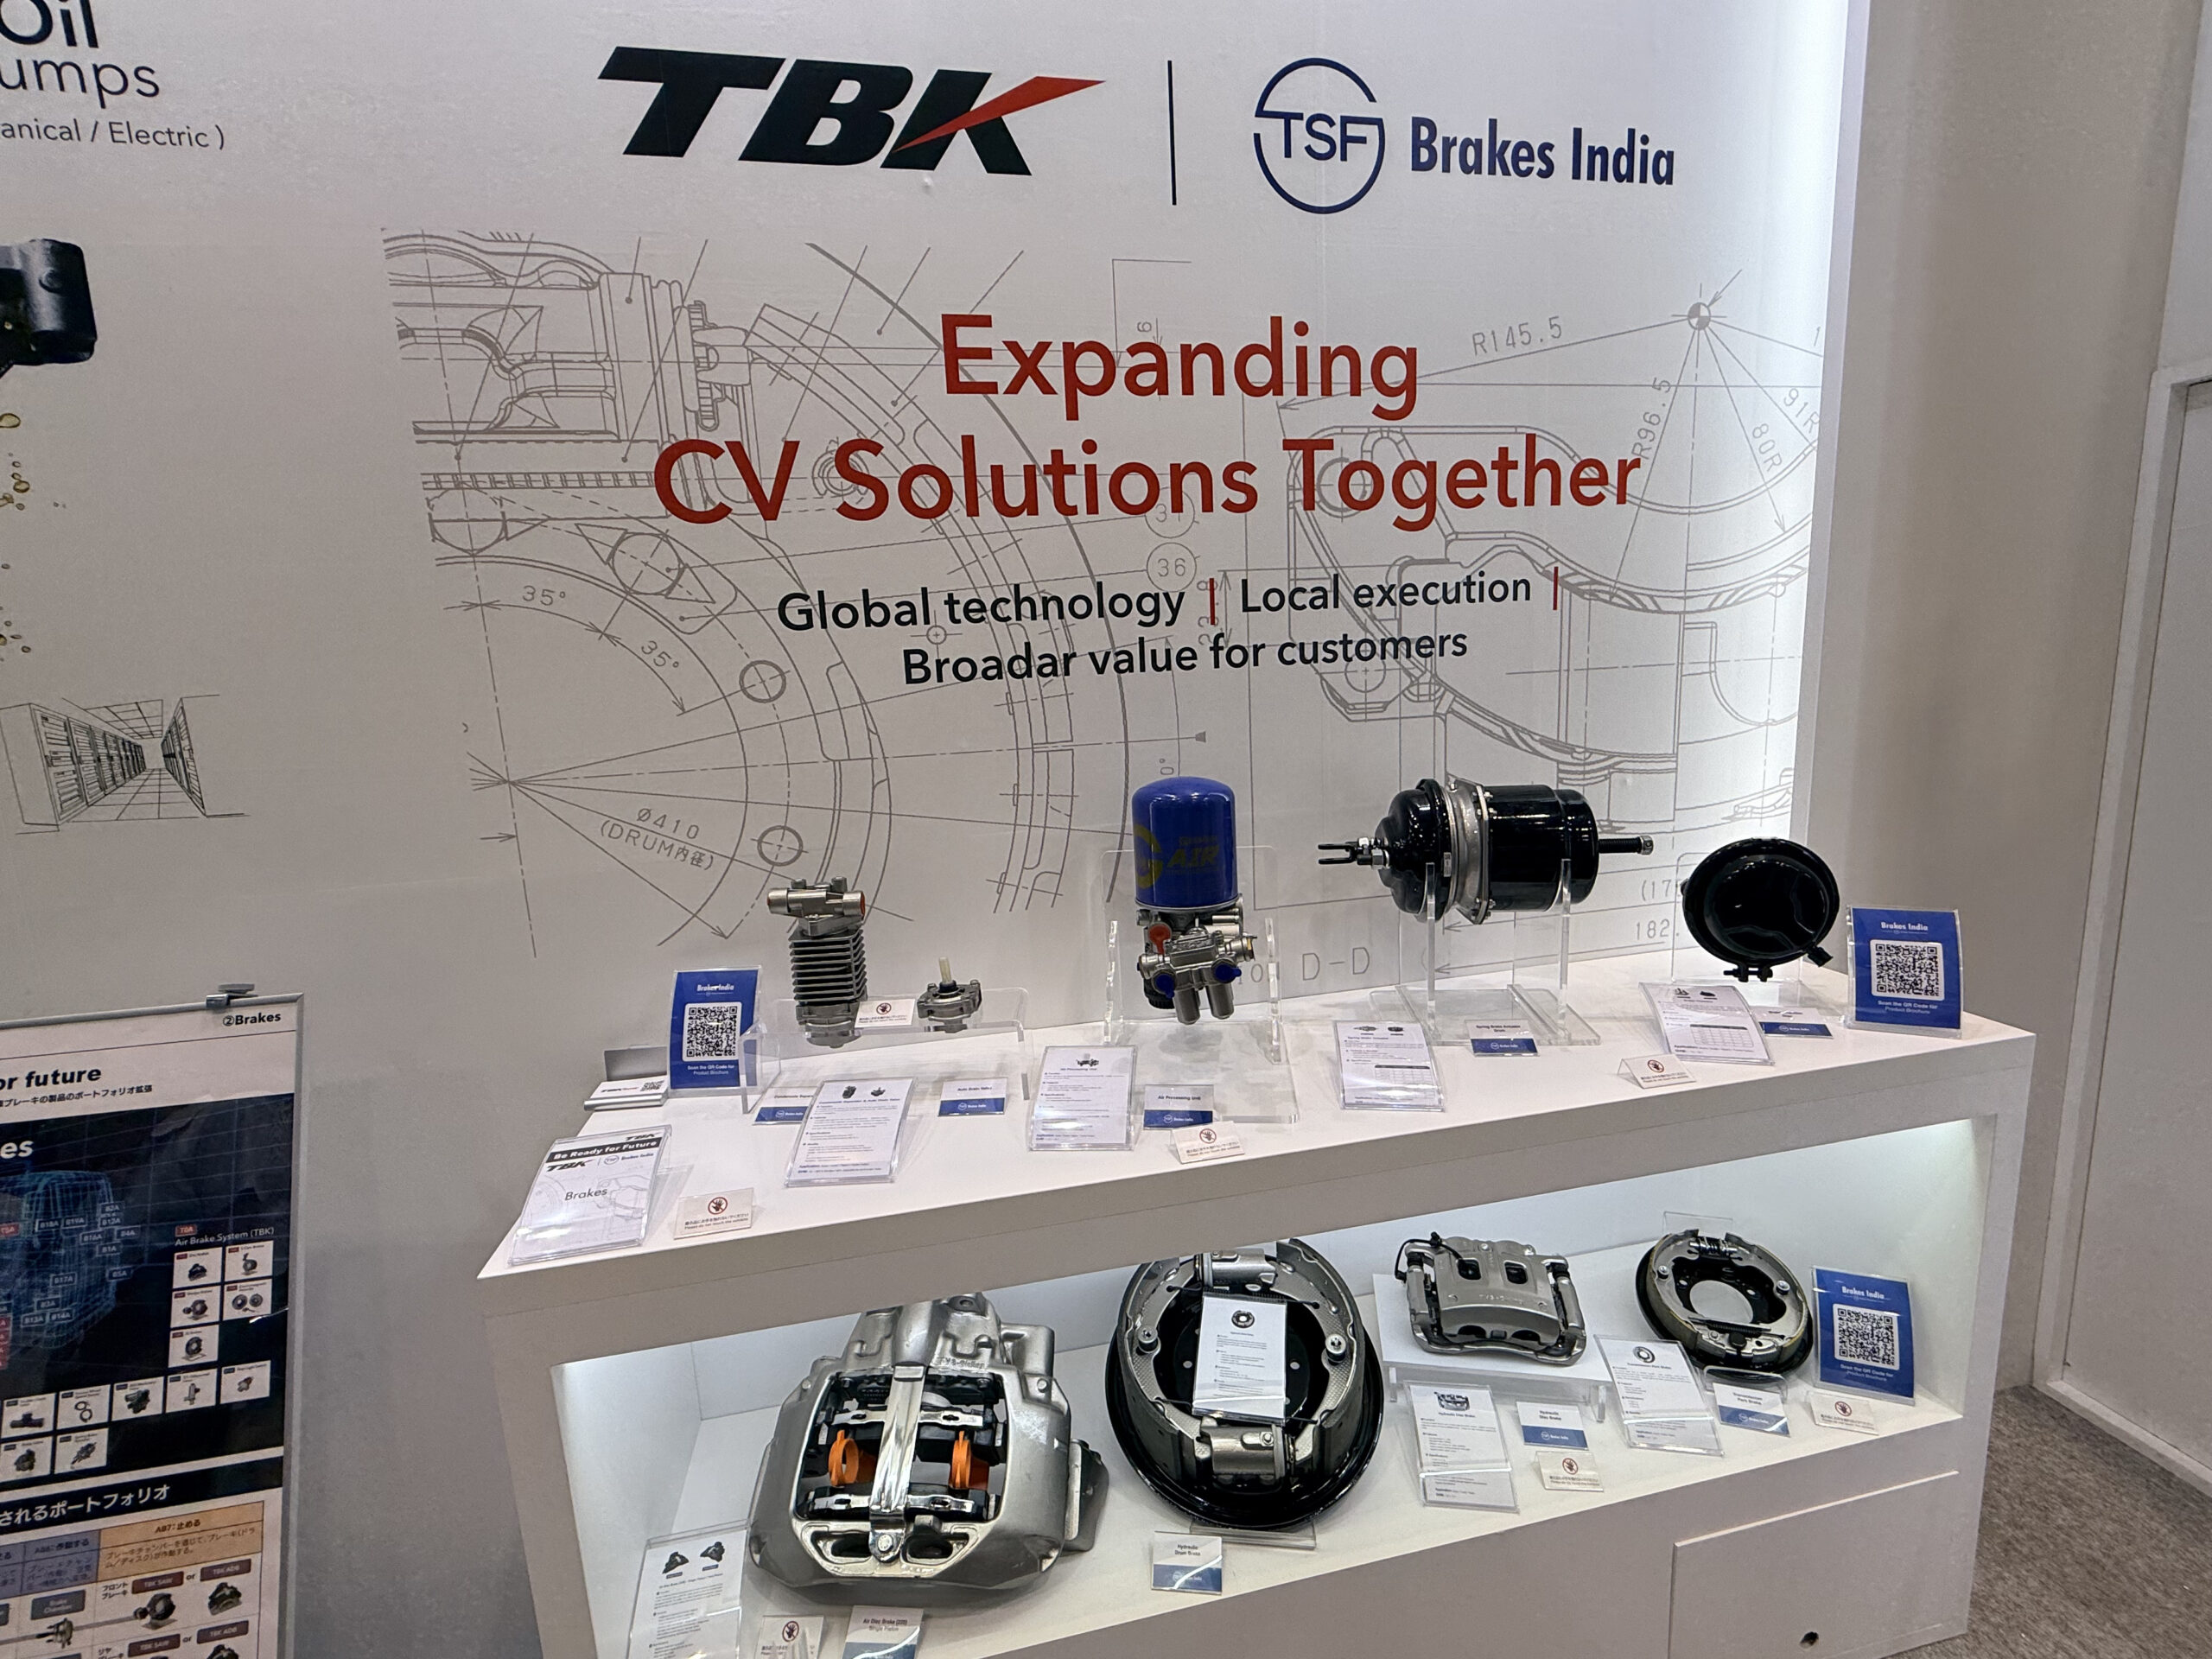
グローバルアライアンスの強化においては、2025年11月にBrakes India Private Limitedとの資本業務提携を実
施いたしました。本提携を通じて、ブレーキ製品のラインアップ拡充、電動化製品分野における協業およびアジア
市場での競争力強化を図っております。さらに、グローバルでのアライアンスを成功させるべく、今後も各地域に
おける取り組みを進めてまいります。
システム領域への展開においては、単体部品の供給にとどまらず、電動化・自動化製品を含むシステムとしての
提案力強化に取り組んでおり、将来的なシステムサプライヤーとしての事業展開を視野に入れた取り組みを継続し
ております。
8/122
EDINET提出書類
株式会社TBK(E02201)
有価証券報告書
④ESG経営の取り組み
持続可能な社会の実現に向け、ESG経営を一層強化いたします。環境面ではCO2排出削減や環境対応製品の開発を
推進し、社会面では品質・安全の確保と人的資本の強化、ガバナンス面ではコンプライアンスと経営監督機能の高
度化に取り組みます。
(3)優先的に対処すべき事業上及び財務上の課題
インド、タイを中心として成長を続けるアジア事業の収益強化により財務体質の健全化を推進します。
しかしながら、中国事業不振の長期化、2024年問題に起因する物流費の上昇、賃上げ実施による人件費の上昇等の
課題に対し、コスト削減やサプライチェーンの全体の中で解決してまいります。
(4)経営上の目標の達成状況を判断するための客観的な指標等
当社グループでは、第16次中期経営計画最終年度となる2028年3月期は、「連結営業利益率3〜5%」
「ROE5.0%」を財務指標としております。
また、今中期経営計画より非財務指標についても目標設定しております。ESG経営の取り組みの中で進捗管理をし
てまいります。
9/122
EDINET提出書類
株式会社TBK(E02201)
有価証券報告書
2【サステナビリティに関する考え方及び取組】
当社グループのサステナビリティに関する考え方及び取り組みは、次のとおりです。
当社グループは、サステナビリティを中長期的な企業価値向上の重要な要素と位置づけており、事業活動と一体
となった取り組みを進めています。また、将来的にはサステナビリティ基準委員会(SSBJ)が2025年3月に公表し
たサステナビリティ開示基準等にも留意しながら、開示内容のさらなる充実を図ってまいります。
なお、文中の将来に関する事項は、当連結会計年度末現在において当社グループが判断したものであります。
また、当社グループは、TCFD(気候変動関連財務情報開示タスクフォース<Task Force on Climate-related
Financial Disclosures>)提言で開示が推奨されている「ガバナンス」「戦略」「リスク管理」「指標及び目
標」の4つの区分に基づいて、以下の記載を行います。なお、未充足の部分については、今後継続的に拡充してま
いります。
(1)サステナビリティ
①ガバナンス
当社グループでは、取締役会の下で、戦略的かつ継続的に重要課題(マテリアリティ)への対応を進め、中長期
的な企業価値向上につなげるため、2022年7月1日付でサステナビリティ委員会を設置しています。同委員会は、
代表取締役社長を委員長とし、本部長、常勤監査役などで構成され、サステナビリティに関わる経営の基本方針、
目標および実行計画の企画・立案、進捗管理や評価を行い、定期的に取締役会へ報告しています。サステナビリ
ティに関連する重要なリスクなどについても、全社リスク管理のプロセスと同様に、適宜取締役会に付議・報告し
ています。
サステナビリティ推進体制図
10/122
EDINET提出書類
株式会社TBK(E02201)
有価証券報告書
サステナビリティリスク対応図
②リスク管理
当社グループでは、リスク管理・コンプライアンス規則に基づき、代表取締役社長を委員長とするリスク・コン
プライアンス委員会を設置しています。本委員会は、四半期ごとに各部門から提出されるリスク評価を基に、経営
への影響度合いや期間に応じて重要リスクを特定しています。また、当社ではリスクのみならず、サステナビリ
ティ関連の機会についても、事業環境分析を通じて識別・評価し、必要に応じて経営戦略に反映しています。さら
に、リスク・コンプライアンス関連の報告をグループ会社から受け、重要な案件については取締役会での審議と決
定を行います。
(2)気候変動に伴う対応
①ガバナンス
気候変動に関する具体的な分析や施策については、サステナビリティ委員会の監督の元に実施しています。ま
た、各拠点における環境委員会が当社グループ内の各社と連携し、気候変動関連課題への対応策の推進、目標管理
を行い、サステナビリティ委員会へ上申、報告を実施しています。
②戦略
当社グループは、気候変動が事業・業績に与える影響について、定性的なシナリオ分析を行いました。シナリオ
分析では様々な事態を想定し備えることが重要と考え、国連気候変動に関する政府間パネル
(IPCC:Intergovernmental Panel on Climate Change)及び国際エネルギー機関(IEA: International Energy
Agency)を参照し、「2℃未満」シナリオと「4℃」シナリオを用い分析を行いました。
2℃未満シナリオ
(低炭素経済へ移行するシナリ
オ)
政府目標が推進され、カーボンニュートラルな世界が実現されている社会と
なります。国際社会や日本政府により環境対応規制が強化され、新しい技術
革新が進むことで、社会や産業の構造が大きく変化していることが想定され
ます。
4℃シナリオ
(物理的気候変動リスクが高ま
るシナリオ)
低炭素/脱炭素化の取り組みによる効果は限定的に留まり、気候変動の深刻化
した物理的リスクが高い社会となります。自然災害が頻発することで、当社
グループのサプライチェーンや生産現場に対する望ましくない影響が想定さ
れます。
気候変動に関するリスクと機会は、政策や技術等による社会変化によって生じる「移行」側面と、自然災害や気
温上昇などによって生じる「物理」側面を考慮しております。なお、分析の時間軸は、基本的に移行リスクは2030
年、物理的リスクは2050年を基準としています。
特定した気候変動に関連するリスクと機会及び現在行っている対応策は、下表のとおりです。
11/122
EDINET提出書類
株式会社TBK(E02201)
有価証券報告書
特定した気候変動に関するリスクと機会
2℃未満シナリオ
世の中の変化
時間軸
短期:2026
中期:2030
長期:2050
政策・規制
炭素税・GHG排出中期
量規制の導入
技術開発
市場動向
内燃機関車の低
燃費要請
中期
商用車のEV化
中期
グリッドパリ
ティ未到達
中期
原材料価格の高
騰
中期
サプライチェー
ンにおけるCN*要
請
中期
4℃シナリオ
世の中の変化
物理的(慢
平均気温の上昇
性)
物理的(急
性)
異常気象の激甚
化
長期
短期
短期
リスク
・炭素税などGHG
排出量に比例
するコスト増
加
・競合企業の先
行した低燃費
配慮製品開発
による売上減
少リスク
・EV化の進展に
よる内燃機関
関連商材の需
要減少
(ウォーター/
オイルポンプ
など)
・再生可能エネ
ルギー電力の
導入(購入)
による電力コ
ストの増加
・金属、樹脂な
どの原材料単
価の値上がり
・省エネ、再エ
ネ設備に関す
る投資コスト
の増加
リスク
・工場内の高温
化に伴う労働
生産性の低下
(人件費の増
加)
・風水害の頻発
化による自社
拠点への被害
・サプライ
チェーン分断
に伴う工場の
操業停止
機会
対応策
・規制に先行し
た排出量削減
への取り組み
・顧客のニーズ
を充足した低
燃費配慮型製
品の売上拡大
・低燃費など、
顧客ニーズに
対応した製品
の開発
・EV対応型製品
のラインナッ
プ拡充による
売上拡大
・EV対応型製品
の開発加速
・工場への太陽
光発電システ
ムの導入
・省エネ設備導
入による電力
消費量削減
・原材料コスト
上昇分の販売
価格への転嫁
交渉
・顧客のScope3
におけるCN貢
----献による販売
機会の拡大
CN:カーボンニュートラル
機会
対応策
・工場における
労働環境の整
備(空調設
備、休憩時間
確保等)
・各拠点におけ
るBCPへの取り
組み
・被災に対応し
た損害保険へ
の加入
・BCPリスクを考
慮した複数購
買の実施
③リスク管理
気候変動に関連する重要なリスクについても、全社リスクマネジメント管理のプロセスと同様に、リスク・コン
プライアンス委員会がサステナビリティ委員会と連携し、その影響度や管理状況について適宜取締役会への報告を
行ってまいります。
12/122
EDINET提出書類
株式会社TBK(E02201)
有価証券報告書
④指標及び目標
当社国内グループにおける2025年度のGHG排出量(Scope1・2)は24,292トンで、これは国内におけるGHG排出量
2013年度比で▲27%削減を達成し、2027年度の目標である▲30%の削減に対して順調に推移しています。また、2030
年度までに▲46%削減を目指すとともに、2050年度のカーボンニュートラルを目標としています。これらの達成に
向け、生産工程での省エネ改善活動、再生可能エネルギーの導入、CO2フリー電力の購入及び新技術導入を進めて
います。海外グループ各社については、GHG排出量の把握を進め、各国目標に鑑みながら、グループ全体での
Scope1・2・3のGHG排出量削減目標の策定を進めています。
13/122
EDINET提出書類
株式会社TBK(E02201)
有価証券報告書
(3)人的資本
①戦略
外部環境の変化に対応しながら企業価値を高めていくには、多様な価値観を持った従業員が主体性や創造性を持
ち、経営Visionを実現させることが重要であると考え、それぞれのキャリア階層で求められるスキルを習得できる
教育体系を整備し、個々の能力を発揮できる体制を目指します。当社が目指す人材像を「主体性・創造性・責任
感・実行力を持った人材」と定め、これを実現するため、下記の3つ方針の下、人材戦略を進めていきます。
<キャリア形成に向けた計画的育成>
TBKが目指す人材像を体現するため、若年層から管理職までの各キャリア階層に求められるスキルを明確に
し、従業員がそのスキルを習得できるよう計画的・体系的な教育を実施します。さらに、次世代のリーダー教育と
して、従業員の総合力を強化するため、多様な価値観や経験を得られるよう、人事ローテーションや国内外グルー
プ会社への出向などを積極的に行います。
また、部門や拠点を越えた研修を通じてグループ内でのコミュニケーションを促進し、組織の活性化や新しいこ
とにチャレンジしていく企業風土の醸成を目指します。
<グローバル人材の育成>
日本国内のみならず、海外グループ会社も含めたグローバルでの人材育成、多様な人材の活用に取り組んでいき
ます。さらに、グループ内での人事ローテーションや研修による人材交流を行い、多様な価値観を持った社員が
個々の力を発揮し、イノベーションが生まれる環境を目指します。
<人材の多様性>
人材の多様性を尊重し、グループ全体でダイバーシティへの理解を深めるとともに、「女性の職業生活における
活躍の推進に関する法律」に基づき女性従業員を増やし、性別等に関わらず育児・介護等を含めた多様なライフス
タイルや価値観を尊重し、長く働き続けられる環境の整備に取り組みます。
これらを実現するため、当社は、働きがいのある職場づくりを目指し、従業員の健康及びワークライフバランス
の推進、従業員満足度の向上に取り組みます。また、この取り組みの一環として、当社は以下のとおり「健康経営
宣言」を行い、経済産業省と日本健康会議が主催する「健康経営優良法人2026(大規模法人部門)」に認定されま
した。
「健康経営宣言」
当社は、「持続可能な成長を通して社会に貢献する」を長期目標として掲げています。従業員の健康を促進し、
また、それぞれの力を最大限に発揮できる、健康で働きがいのある職場環境を実現することが、組織の活性化及び
持続的な成長につながると考えています。従業員の生活を豊かなものとするため、そして企業として成長し続ける
ために、従業員の健康推進を経営戦略上の重要課題と位置づけ、従業員の心と体の健康づくりを推進していきま
す。
14/122
EDINET提出書類
株式会社TBK(E02201)
有価証券報告書
②指標及び目標
方針
キャリア形成に
向けた計画的育成
グローバル人材
の育成
指標
2025年度
目標値
2025年度
実績値
2027年度
目標値
対象者となる若手社員
の受講率
100%
100%
100%
管理職の受講率
100%
100%
100%
戦略的取り組み
体系的な階層別
教育の実施
語学スキルの向
上
英語教育制度の導入
奨励金制度
導入
奨励金制度
導入
管理職の英語要
件達成率80%
人事交流の促進
海外トレーニー派遣
グローバル
ミーティング
の実施
3部門にて実
施
5名(連結)
(注)2
管理職候補者の育成
多様な人材の登女性管理職の
用1名
登用1名
女性活躍の推進
年次有給休暇取得率
人材の多様性
働きがいのある
職場づくり
(
)は平均取得日数
入社3年後の離職率
育成計画の実行
女性役員の登用
(連結)
80.0%以上
(14.0日)
71.2%
(13.7日)
80.0%以上
(14.0日)
12.0%以下
7.8%
12.0%以下
(注)1.上記の戦略に関する指標、目標及び実績については、提出会社を対象範囲としているため、特段の記
載がない限り連結子会社は含んでおりません。まずは提出会社において人的資本の戦略に関する取り
組みを実践し、実績を積み重ね、その後、連結子会社にも同様の取り組みを展開してまいります。
2.2025〜2027年度の延べ人数
これら、サステナビリティに関する事項の詳細につきましては、当社ウェブサイト(https://www.tbkjp.com/sustainability/)に記載しております。
なお、当該サイトは2026年7月に更新予定です。
15/122
EDINET提出書類
株式会社TBK(E02201)
有価証券報告書
3【事業等のリスク】
有価証券報告書に記載した事業の状況、経理の状況等に関する事項のうち、経営者が連結会社の財政状態、経営成
績及びキャッシュ・フローの状況に重要な影響を与える可能性があると認識している主要なリスクは、以下のとおり
であります。
なお、文中の将来に関する事項は、当連結会計年度末現在において当社グループが判断したものであります。
(1)国内外の経済状況に関わるリスク
当社グループの製品の需要は、自動車業界および建設産業機械、農業機械業界等の市場動向並びに各国または地
域の経済状況の影響を受ける可能性があります。
米国における通商政策および関税政策の変更により、北米向けに輸出される当社製品を搭載した自動車、建設産
業機械、農業機械等のコストが増加する可能性があります。これに伴い、顧客の生産計画や調達方針の見直し、価
格競争の激化等が生じた場合には、当社グループの販売数量および利益率に影響を及ぼす可能性があります。
また、日本、タイ、中国、インド及び米国等の主要市場において、景気後退、金融引締め、インフレ進行等によ
る需要減少が発生した場合には、当社グループの業績及び財政状態に影響を及ぼす可能性があります。
自動車業界においては、CASE対応や電動化投資の加速、グローバル競争の激化等を背景として、継続的なコスト低
減要請が強まっております。これにより、自動車部品のコモディティ化が進行し、さらなる価格競争の激化が生じ
た場合には、当社グループの収益性に影響を及ぼす可能性があります。
タイにおいては、金融機関による自動車ローン審査厳格化等の影響により、自動車販売市場の低迷が継続してお
り、販売台数の減少が当社グループの業績に影響を及ぼす可能性があります。
中国においては、不動産市場の低迷、消費マインドの低下等を背景として、中国国内需要が低迷した場合には、
当社グループの業績に影響を及ぼす可能性があります。
さらに、地政学的リスクの高まり、原材料価格・エネルギー価格・物流費の上昇、為替相場の急激な変動等によ
り、サプライチェーンや生産活動に支障が生じた場合には、当社グループの財政状態、経営成績及びキャッシュ・
フローに影響を及ぼす可能性があります。
(2)トラック及び建設・産業機械需要の動向に関わるリスク
当社グループの国内普通トラック(積載量4トン以上)関連事業への依存度は依然として高く、また、当社製品
のマーケットシェアも高いため、当社グループの業績及び財務状況は当該市場の動向に左右される可能性がありま
す。
さらに、建設・産業機械関連事業についても、当社グループの業績及び財務状況は、インフラ整備等の公共投
資、資源開発や不動産などの民間設備投資等の需要動向に大きく影響を受ける可能性があります。
(3)製品構成の変化に関わるリスク
当社グループの主要な販売先は、国内普通トラック(積載量4トン以上)メーカーの他、海外の顧客も増えてき
ております。これら各社の技術開発の動向や調達方針の変更、市場・業界環境の急変等が生じた場合、当社グルー
プの業績に影響を及ぼす可能性があります。
トラックに搭載されている当社主力製品のドラムブレーキは、日本において独自に進化したドラムブレーキの一
種であり、北米やアジアなどでは従来のドラムブレーキが主力となっております。昨今、中国では、ブレーキ規制
強化により、欧州で主力のディスクブレーキが一部車種に導入されつつあり、国内においても、性能面で同等の当
社主力のドラムブレーキがディスクブレーキと競合するリスクが存在します。今後、国内普通トラック市場におい
てディスクブレーキが普及すると、当社の業績に大きな影響を及ぼす可能性があります。また、商用車においても
バス・中小型車にEV化への動きが出てきており、当社のポンプ製品の需要が減少し、業績に影響を及ぼす可能性が
あります。
これらの変化に対応するため、当社グループではディスクブレーキ製品への対応強化を進めるとともに、商用車
向け電動ポンプ、サーマルマネジメント関連製品等の開発を推進しております。
(4)為替相場の変動に関するリスク
当社グループでは、タイ、中国、インドに生産拠点を有しておりますが、主に現地製造・現地販売を行っている
ため、輸出入に伴う為替リスクは軽微です。しかしながら、海外各国における現地通貨建ての財務諸表は連結財務
諸表作成時に円換算されるため、円換算後の価値が影響を受ける可能性があります。
16/122
EDINET提出書類
株式会社TBK(E02201)
有価証券報告書
(5)製品の品質・安全性に関わるリスク
当社グループの製品は開発から生産まできめ細かい管理体制を敷き、品質向上及び安全性の確保に努めておりま
すが、予期せぬ品質不良が発生する可能性があります。このような品質不良は、多額のコストや当社グループの評
価に重大な影響を与え、当社グループの業績と財務状況に影響を及ぼす可能性があります。特に、当社グループの
主力製品である商用車用ブレーキは、重要保安部品に該当し、品質不良が発生すると重大事故につながり、社会的
な信用を損なうリスクがあります。
これらを軽減するために、IATF16949(自動車産業の国際的な品質マネジメントシステム規格)に準拠した体
制・仕組みを構築しており、さらには、定期的に社内の品質マネジメントシステム内部監査を実施する監視体制を
確立しております。製品の出荷検査は社内認定検査員が行っており、また、重要保安部品を扱う工程は、社内認定
作業者が従事しております。
(6)原材料・部品等の調達に関わるリスク
当社グループの生産活動における資材、部品その他の調達品につきましては、現在その必要量が十分確保されて
おります。しかしながら、需要増加等の要因により、資材の調達遅延や、調達不足が生じた場合には、当社グルー
プの生産活動に影響を及ぼす可能性があります。また、市場の急激な変化に伴う、資材、部品その他の調達品の価
格上昇やサプライヤーの設備事故・自然災害等による操業停止あるいは倒産等により、諸資材等の調達に支障を来
たす場合には、当社グループの業績及び財務状況に影響を及ぼす可能性があります。
当社グループにおいては、二社発注など調達先の多様化の推進や、サプライチェーン情報の定期的な把握など、
リスクの低減に努めております。
(7)自然災害や事故等に関わるリスク
当社グループは、日本、タイ、中国及びインドに生産拠点を有しており、地震・台風などの大規模自然災害、感
染症によるパンデミック、火災その他の事故の影響により、工場の操業度が低下し、当社グループの業績に影響を
及ぼす可能性があります。
大規模災害の発生に備え、事業継続計画(BCP)を策定し、迅速かつ適切に情報を伝達する緊急体制を整備し、
定期的に危機対応訓練や避難訓練を行っております。また、消火設備を定期的に点検し、リスク軽減を図っており
ます。その他、大規模災害やパンデミック対策として、テレワークや時差出勤等を整備しております。
(8)海外拠点の動向に関わるリスク
当社グループの海外拠点であるタイ、中国及びインドにおいて、法律・規制・税制等の大幅な変更、労働争議、
電力等の社会インフラ面の障害、政治的不安定や戦争・テロ等による混乱、その他事故等の影響により、事業活動
を停止する可能性があります。
当社グループの事業へ影響が大きいと想定されるシナリオに基づき、事業継続計画(BCP)を策定し、重要事業
の継続と復旧にかかる体制整備の強化を図っております。
(9)コンプライアンス違反によるレピュテーションリスク
当社グループは、グローバルに事業活動を展開しており、各国で適用される関連法令の遵守に努めております。
また、コンプライアンス違反案件が発生した場合には、迅速に対処する体制を構築しております。しかしながら、
今後コンプライアンス違反が発生しない可能性は皆無とは言えず、違反内容の重大性が大きい場合や、事後の対処
方法・対処時期が的確性を欠く場合には、当社グループの社会的信用が著しく低下し、業績及び財務状況に影響を
及ぼす可能性があります。
当社グループは、ガバナンスに関わる不祥事や法令違反を未然に防ぐべく、グループ会社管理体制、リスク・コ
ンプライアンス体制及び内部通報体制を整備する等、リスクの軽減を図っております。
(10)人材の確保・育成に関わるリスク
当社グループは、企業の競争力の源泉は人材にあるとの認識のもと、グローバルにも活躍できる、より優秀な人
材を安定的に確保・育成できる基盤を構築することが重要であると認識しております。しかし、今後の人材獲得競
争の一層の激化や従業員の高齢化により、当社グループ内の人材確保・育成・技能伝承が遅れた場合には、将来的
な事業展開に影響を及ぼす可能性があります。
その対策として、働きがいのある職場づくりを目指し、従業員の健康及びワークライフバランスの推進、従業員
満足度の向上や報酬制度の整備に取り組んでおります。また、従業員のキャリア形成に向け、計画的な育成を進め
ています。
17/122
EDINET提出書類
株式会社TBK(E02201)
有価証券報告書
(11)気候変動によるリスク
当社グループは、経営理念に基づいた事業活動を通じてサステナビリティに関するマテリアリティ(重要課題)
に取り組むことで持続可能な社会の実現に寄与し、企業価値の向上を目指します。しかしながら、世界的な気候変
動による事業活動や地球環境の変化及び温室効果ガス排出削減のための法的な規制強化などにより、当社グループ
の業績と財務状況に影響を及ぼす可能性があります。また、気候変動から生じた重大災害によって、当社グループ
及びサプライチェーンの拠点・設備・システム等が被害を受けた場合、営業・生産活動に支障をきたし、当社グ
ループの業績と財務状況に影響を及ぼす可能性があります。
なお、事業を通じた環境保全活動の一環として、日本におけるCO2排出量を2030年までに2013年度比で46%削減
することを目標に定め、その削減に取り組んでおります。
18/122
EDINET提出書類
株式会社TBK(E02201)
有価証券報告書
4【経営者による財政状態、経営成績及びキャッシュ・フローの状況の分析】
(1)経営成績等の状況の概要
当連結会計年度における当社グループ(当社、連結子会社及び持分法適用会社)の財政状態、経営成績及び
キャッシュ・フロー(以下「経営成績等」という。)の状況の概要は次のとおりであります。
①財政状態及び経営成績の状況
(財政状態の状況)
総資産については、前年度末比6.4%増の56,511百万円(前連結会計年度末は53,125百万円)となり3,386百万円増
加いたしました。この主な要因は、前年度末に比べ、現金及び預金の増加3,220百万円、投資有価証券の増加361百万
円及び退職給付に係る資産の増加343百万円に、関係会社出資金の減少368百万円を加味したことによるものでありま
す。
負債については、前年度末比0.5%増の24,126百万円(前連結会計年度末は24,013百万円)となり113百万円増加い
たしました。この主な要因は、前年度末に比べ、未払金等の増加に伴うその他流動負債の増加735百万円及び繰延税
金負債の増加687百万円に、電子記録債務の減少863百万円及び長期借入金の減少467百万円を加味したことによるも
のであります。
純資産については、前年度末比11.2%増の32,384百万円(前連結会計年度末は29,112百万円)となり3,272百万円
増加いたしました。この主な要因は、為替換算調整勘定の増加1,643百万円、第三者割当増資による資本金の増加568
百万円、資本剰余金の増加568百万円及び退職給付に係る調整累計額の増加460百万円に、親会社株主に帰属する当期
純損失計上等に伴う利益剰余金の減少358百万円を加味したことによるものであります。
この結果、自己資本比率は前連結会計年度末53.2%から55.5%となりました。
(経営成績の状況)
当連結会計年度におけるわが国経済は、雇用・所得環境の改善を背景に緩やかな回復基調が見られたものの、円安
の長期化、人手不足の深刻化、エネルギー・原材料価格の高止まりにより、先行き不透明な状況で推移いたしまし
た。また、中東情勢等の地政学リスクの影響により、世界経済は不確実性の高い状況が継続しております。
当社グループの関連するトラック製造業界は、半導体供給の改善等に伴い生産台数が回復したことにより、普通ト
ラック(積載量4トン以上)の国内登録台数は、76,187台と前年度比2.2%の増加となりました。一方、海外におい
ては、アセアン地域、とりわけタイでは、家計債務の増加を背景とした金融機関の自動車ローン審査厳格化の影響に
より、主力であるピックアップトラックを中心に新車販売は低迷が継続しております。足元では一部回復の動きが見
られるものの、本格回復にはなお時間を要する状況にあります。また、中国においては、当社グループの主力製品が
使用される大型商用車分野では持ち直しの傾向がみられるものの、厳しい事業環境が続いており、需要の回復には時
間を要すると予測しております。
このような状況のもと、当社グループの当連結会計年度における売上高は54,756百万円(前年度比0.6%増)とな
りました。損益面におきましては、営業利益は1,496百万円(前年度比59.0%増)、経常利益は1,730百万円(前年度
比459.9%増)、当社において特別損失に固定資産の減損損失712百万円、海外連結子会社である TBK America, Inc.
を解散及び清算したことに伴う固定資産売却益236百万円及び事業再編損297百万円、持分法適用関連会社の株式一部
譲渡による関係会社出資金売却損19百万円を計上したことにより、親会社株主に帰属する当期純損失は131百万円
(前年度は親会社株主に帰属する当期純損失1,204百万円)となりました。
セグメントごとの経営成績は、次のとおりであります。
日本における売上高は32,501百万円(前年度比8.9%増)、セグメント利益は534百万円(前年度比245.2%増)と
なりました。収益体質改善のため、原材料・エネルギー価格高騰によるコスト上昇分の販売価格への転嫁に注力し事
業活動を進めた結果、増収増益となりました。
アジアにおける売上高は19,784百万円(前年度比6.0%増)、セグメント利益は1,232百万円(前年度比30.2%増)
となりました。エネルギー調達コスト改善や価格改定など収益性向上施策を進めてきた結果、増収増益となりまし
た。
中国における売上高は6,194百万円(前年度比21.2%増)、セグメント損失は107百万円(前年度はセグメント損失
107百万円)となりました。収益体質改善として自動化など原価改善を進めてきたことと、中国国内向けの大型ト
ラック需要が持ち直したことで増収となりましたが、原材料の高騰が長期化しており、回復にはまだ時間が掛かると
予測しております。
北米における売上高は9百万円(前年度比99.8%減)、セグメント利益は9百万円(前年度比39.4%減)となりまし
た。生産の最適化を目的として、2024年9月に北米での生産を終了し、主力製品の生産はインド子会社へ移管のう
え、TBK America, Inc.を解散し、2025年11月25日に清算いたしました。
19/122
EDINET提出書類
株式会社TBK(E02201)
有価証券報告書
②キャッシュ・フローの状況
当連結会計年度末における現金及び現金同等物(以下「資金」という。)は、7,344百万円となりました。なお、
当連結会計年度における連結キャッシュ・フローの状況は、以下のとおりであります。
(営業活動におけるキャッシュ・フロー)
営業活動の結果得られた資金は、4,001百万円(前年度は3,894百万円の収入)となりました。この主な要因は、税
金等調整前当期純利益925百万円に減価償却費2,921百万円、売上債権の減少751百万円及び仕入債務の減少1,218百万
円を加味したことによるものであります。
(投資活動におけるキャッシュ・フロー)
投資活動の結果使用した資金は、1,647百万円(前年度は2,323百万円の使用)となりました。この主な要因は、有
形固定資産の取得による支出2,650百万円及び有形固定資産の売却による収入827百万円によるものであります。
(財務活動におけるキャッシュ・フロー)
財務活動の結果得られた資金は、492百万円(前年度は1,885百万円の使用)となりました。この主な要因は、短期
借入金及び長期借入金の有利子負債が合計で364百万円減少したことと株式の発行による収入1,111百万円及び配当金
の支払額226百万円によるものであります。
(キャッシュ・フローの指標)
第86期
2022年3月
第87期
2023年3月
第88期
2024年3月
第89期
2025年3月
第90期
2026年3月
自己資本比率(%)
55.4
51.6
50.6
53.2
55.5
時価ベースの自己資本比率(%)
20.9
15.2
19.0
15.9
20.0
キャッシュ・フロー対有利子
負債比率(年)
1.7
3.5
2.9
2.0
1.9
インタレスト・カバレッジ・
レシオ(倍)
31.4
12.5
10.7
14.6
29.0
(注)上記各指標の算式は次のとおりであります。
自己資本比率:自己資本/総資産
時価ベースの自己資本比率:株式時価総額/総資産
キャッシュ・フロー対有利子負債比率:有利子負債/営業キャッシュ・フロー
インタレスト・カバレッジ・レシオ:営業キャッシュ・フロー / 利払い
20/122
EDINET提出書類
株式会社TBK(E02201)
有価証券報告書
③生産、受注及び販売の実績
イ 生産実績
当連結会計年度の生産実績をセグメントごとに示すと、次のとおりであります。
当連結会計年度
(自 2025年4月1日
至 2026年3月31日)
セグメントの名称
前年度比(%)
ブレーキ(百万円)
12,798
20.5
エンジンコンポーネント他(百万円)
13,868
2.1
ブレーキ(百万円)
1,419
△64.2
エンジンコンポーネント他(百万円)
16,905
△4.6
ブレーキ(百万円)
2,661
9.1
エンジンコンポーネント他(百万円)
101
1.6
ブレーキ(百万円)
−
−
エンジンコンポーネント他(百万円)
−
−
47,754
△9.4
日本
アジア
中国
北米
合計(百万円)
(注)1.金額は販売価格によっております。
2.自動車部品等製造事業はブレーキ、エンジンコンポーネント他で構成されており、これらの業務の意思決
定は地域別に一括して決定しております。
ロ
受注実績
当連結会計年度の受注実績をセグメントごとに示すと、次のとおりであります。
当連結会計年度
(自 2025年4月1日
至 2026年3月31日)
セグメントの名称
受注高
(百万円)
前年度比(%)
受注残高
(百万円)
前年度比(%)
ブレーキ
16,460
18.3
1,211
17.0
エンジンコンポーネント他
16,421
6.4
1,174
23.3
ブレーキ
2,228
△30.6
793
76.7
エンジンコンポーネント他
16,698
△2.4
2,738
138.8
ブレーキ
3,758
4.7
−
−
エンジンコンポーネント他
122
1.2
20
△0.6
ブレーキ
−
−
−
−
エンジンコンポーネント他
−
−
−
−
55,690
△3.5
5,939
64.7
日本
アジア
中国
北米
合計
(注)1.金額は販売価格によっております。
2.自動車部品等製造事業はブレーキ、エンジンコンポーネント他で構成されており、これらの業務の意思決
定は地域別に一括して決定しております。
21/122
EDINET提出書類
株式会社TBK(E02201)
有価証券報告書
ハ
販売実績
当連結会計年度の販売実績をセグメントごとに示すと、次のとおりであります。
当連結会計年度
(自 2025年4月1日
至 2026年3月31日)
セグメントの名称
前年度比(%)
ブレーキ(百万円)
15,086
10.9
エンジンコンポーネント他(百万円)
16,500
9.3
ブレーキ(百万円)
1,804
△11.6
エンジンコンポーネント他(百万円)
17,301
8.3
ブレーキ(百万円)
3,945
22.6
エンジンコンポーネント他(百万円)
108
△14.5
ブレーキ(百万円)
−
−
エンジンコンポーネント他(百万円)
9
△99.8
54,756
0.6
日本
アジア
中国
北米
合計(百万円)
(注)1.金額は販売価格によっております。
2.自動車部品等製造事業はブレーキ、エンジンコンポーネント他で構成されており、これらの業務の意思決
定は地域別に一括して決定しております。
3.セグメント間の取引については、相殺消去しております。
4.前連結会計年度及び当連結会計年度における主な相手先別の販売実績及び当該販売実績の総販売実績に対
する割合は、次のとおりであります。
相手先
前連結会計年度
2024年4月1日
2025年3月31日
当連結会計年度
2025年4月1日
2026年3月31日
自
至
金額(百万円)
自
至
割合(%)
金額(百万円)
割合(%)
いすゞ自動車株式会社
10,329
19.0
12,003
21.9
三菱ふそうトラック・バス
株式会社
3,584
6.6
4,197
7.7
日野自動車株式会社
2,006
3.7
2,243
4.1
株式会社小松製作所
1,848
3.4
1,677
3.1
22/122
EDINET提出書類
株式会社TBK(E02201)
有価証券報告書
(2)経営者の視点による経営成績等の状況に関する分析・検討内容
経営者の視点による当社グループの経営成績等の状況に関する認識及び分析・検討内容は次のとおりでありま
す。
なお、文中の将来に関する事項は、当連結会計年度末現在において判断したものであります。
①財政状態及び経営成績の状況に関する認識及び分析・検討内容
当社グループの当連結会計年度の経営成績等は、日本セグメントでは、収益体質の改善のため、原材料・エネル
ギー価格高騰によるコスト上昇分の販売価格への転嫁に注力した結果、増収増益となりました。アジアセグメントで
は、タイにおいては、金融機関のローン審査厳格化と経済の低迷が続いたことによる需要減少が続いているものの、
海外向売上が堅調に推移したことにより増収増益となりました。インドにおいては、堅調な経済成長に加え、当社の
北米子会社からの生産移管が順調に進み増収増益となりました。中国セグメントでは、中国国内向けの大型トラック
需要が持ち直しましたが、収益体質改善として自動化など原価改善を進めてきたものの原材料の高騰が長期化してお
り、増収減益となりました。北米セグメントでは、生産の最適化を目的として、2024年9月に北米での生産を終了
し、主力製品の生産はインド子会社へ移管のうえ、TBK America, Inc.を解散し、2025年11月25日に清算いたしまし
た。
ブレーキ部門の売上高は、前連結会計年度に比べて1,974百万円増(前年度比10.5%増)の20,837百万円となり、
エンジンコンポーネント他部門の売上高は、前連結会計年度に比べて1,633百万円減(前年度比4.6%減)の33,919百
万円となりました。
主な販売先別の状況につきましては、いすゞ自動車株式会社に対する売上が、前連結会計年度に比べて1,673百万
円増(前年度比16.2%増)の12,003百万円、三菱ふそうトラック・バス株式会社に対する売上が、前連結会計年度に
比べて612百万円増(前年度比17.1%増)の4,197百万円、日野自動車株式会社に対する売上が、前連結会計年度に比
べて236百万円増(前年度比11.8%増)の2,243百万円、株式会社小松製作所に対する売上が、前連結会計年度に比べ
て171百万円減(前年度比9.3%減)の1,677百万円となりました。
売上原価につきましては、前連結会計年度に比べて694百万円減(前年度比1.4%減)の47,931百万円となり、売上
高に占める売上原価の割合は、前連結会計年度に比べて1.4%減の87.5%となりました。その要因として、材料市況
高騰による材料費の増加及び原油価格高騰に起因するエネルギーコストの上昇による動力費の増加分を販売価格に転
嫁したことによるものであります。
販売費及び一般管理費につきましては、前連結会計年度に比べて479百万円増(前年度比9.9%増)の5,329百万円
となりました。増加の主な要因は、製品保証費の増加によるものです。
営業外損益につきましては、234百万円の利益(前年度は632百万円の損失)となりました。利益の主な要因は受取
配当金及び為替差益によるものであります。
特別損益につきましては、805百万円の損失(前年度は1,226百万円の損失)となりました。これは、固定資産の減
損損失が主な要因であります。
税金費用につきましては、前連結会計年度では182百万円となっておりましたが、当連結会計年度におきましては
924百万円となりました。これは、法人税、住民税及び事業税として422百万円を計上したことに加え、繰延税金負債
を主とした法人税等調整額502百万円を計上したことによるものであります。
②キャッシュ・フローの状況の分析・検討内容並びに資本の財源及び資金の流動性に係る情報
当社グループの当連結会計年度のキャッシュ・フローは、「4 経営者による財政状態、経営成績及びキャッ
シュ・フローの状況の分析 (1)経営成績等の状況の概要 ②キャッシュ・フローの状況」に記載のとおりです。
当社グループの運転資金需要のうち主なものは、材料の購入費用及び製造費用のほか、販売費及び一般管理費等の
営業費用であります。投資を目的とした資金需要は、設備投資によるものであります。
当社グループは、事業運営上必要な流動性と資金の源泉を安定的に確保することを基本方針としております。
短期運転資金は自己資金及び金融機関からの短期借入を基本としており、設備投資の調達につきましては、自己資
金及び金融機関からの長期借入を基本としております。
なお、当連結会計年度末における借入金及びリース債務を含む有利子負債の残高は7,652百万円となっておりま
す。また、当連結会計年度末における現金及び現金同等物の残高は7,344百万円となっております。
23/122
EDINET提出書類
株式会社TBK(E02201)
有価証券報告書
③重要な会計上の見積り及び当該見積りに用いた仮定
当社グループの連結財務諸表は、わが国において一般に公正妥当と認められる会計基準に基づき作成されておりま
す。その作成には、経営者による会計方針の選択・適用、資産・負債及び収益・費用の報告金額及び開示に影響を与
える見積りを必要とします。経営者は、これらの見積りについて過去の実績等を勘案し合理的に判断しております
が、実際の結果は見積り特有の不確実性があるため、これらの見積りと異なる場合があります。
当社グループの連結財務諸表で採用する重要な会計方針は、「第5 経理の状況 1 連結財務諸表等 (1)連
結財務諸表注記事項 (連結財務諸表作成のための基本となる重要な事項)」に記載しております。
(繰延税金資産)
繰延税金資産の認識に際して用いた会計上の見積り及び当該見積りに用いた仮定のうち、重要なものについて
は、「第5 経理の状況 1 連結財務諸表等 (1)連結財務諸表注記事項 (重要な会計上の見積り)」に
記載のとおりであります。
(固定資産の減損処理)
減損損失の認識に際して用いた会計上の見積り及び当該見積りに用いた仮定のうち、重要なものについては、
「第5 経理の状況 1 連結財務諸表等 (1)連結財務諸表注記事項 (重要な会計上の見積り)」に記載
のとおりであります。
④経営方針・経営戦略、経営上の目標の達成状況を判断するための客観的な指標等
第16次中期経営計画初年度にあたる2026年3月期の期初時点においては、「連結売上高520億円」、「連結営業利
益11億円」として掲げておりました。目標財務指標に対して、連結売上高の実績は547億円となり達成、グループ各
社をあげて売上拡大に注力したことに加え、総原価低減活動を進めた結果、連結営業利益の実績は1,496百万円、連
結営業利益率は2.7%となり達成、当社において特別損失に固定資産の減損損失、海外子会社であるTBK America,
Inc.の清算に伴う特別損失を計上したことによりROEは▲0.4%となりました。
1.中期経営計画の概要
当社グループは、2030年に目指す姿を「VISION 2030」として「時代の変化に合った価値をスピーディーに創造
する企業」としております。
当社グループは、「VISION 2030」の実現に向けて、2030年からのバックキャストに基づき、3年ごとの中期経
営計画を3つの段階で設定し、活動を推進しております。この度策定した「第16次中期経営計画(2025年〜2027
年)」は、「VISION 2030」に向けた第2次中期経営計画として、これまでの活動で得られた新たな技術や知見に
基づき、保有しているコア技術・コア製品に更に磨きを掛け、新領域への挑戦を推進することで「イノベーション
で未来を切り拓く」ことをテーマとして活動してまいります。
2.財務指標
評価指標
2027年度目標
営業利益率
3〜5%
ROE
5%
なお、第16次中期経営計画の2年目にあたる2027年3月期は、売上高530億円、営業利益11億円、経常利益12億
円、親会社株主に帰属する当期純利益6億円を目標としております。
24/122
EDINET提出書類
株式会社TBK(E02201)
有価証券報告書
5【重要な契約等】
(1)資本業務提携契約
当社は、2025年11月21日付の取締役会において、Brakes India Private Limitedとの間で資本業務提携契約を締結
しております。
契約に関する内容等は以下の通りです。
①契約の概要
契約締結日
相手方の名称
相手方の住所
2025年11月21日
Brakes India Private Limited
No. 21, Patullos Road, Chennai, Tamil Nadu, 600 002,
India
②当該契約の目的
当社は、2025年度より策定した第16次中期経営計画の達成に向け、当社単独で進めるのではなく、「グローバル
アライアンスの強化」により、技術力を相互に補完し、スピーディーな開発が可能となるパートナーとの協働が得
策と判断しております。Brakes India Private Limitedとの資本業務提携を通して、双方の技術力を活用すること
で、変化する時代のなかで、当社グループの企業価値をさらに高めていくことができると判断し、今回資本業務提
携することといたしました。
なお、本資本業務提携契約において、Brakes India Private Limitedは、本第三者割当増資の払込完了後2年
間、当社の事前の書面による承諾なく当社株式を追加取得しないこと、一定の場合を除き当社の事前の書面による
承諾なく当社株式の譲渡その他の処分を行わないことを合意しております。また、当社が第三者に対して株式等を
発行する場合には、Brakes India Private Limitedは持株比率維持のために必要な範囲で株式等の発行を請求する
ことができるほか、同社が保有する当社株式を第三者へ譲渡しようとする場合には、当社又は当社が指定する者に
優先的な買取機会を付与することとしております。
(2)技術提携契約
契約会
社名
相手方の名称
国名
契約品目
契約内容
契約期間
エアディスクブレーキの
2019年4月3日
共同開発に関する技術提
発効日より10年
携
(注)ロイヤリティの支払いについては、対象品目に応じて純売上高の一定率を支払う契約となっております。
当社
Sangsin Brake
Co., Ltd.(注)
韓国
エアディスクブ
レーキ
25/122
EDINET提出書類
株式会社TBK(E02201)
有価証券報告書
(3)技術援助等を与えている契約
契約会
社名
相手方の名称
国名
契約品目
契約内容
契約期間
工業所有権の実施権
の設定
技術情報の提供
製造権及び販売権の
許諾
2015年6月23日
発効日より10年
以後1年ずつ自動更新
当社
TBKK(Thailand)
Co., Ltd. (注)1
タイ
自動車用ブレー
キ、カムシャフ
ト、オイルポン
プ、ウォーターポ
ンプ、その他エン
ジン部品
当社
Sangsin Brake
Co., Ltd. (注)2
韓国
大型車両用ブレー
キ
−同上−
1994年1月14日
量産時より10年
以後1年ずつ自動更新
中国
ブレーキライニン
グ
−同上−
2002年8月1日
発効日より10年
以後1年ずつ自動更新
中国
商用車用ブレーキ
摩擦材
−同上−
2016年7月25日
発効日より10年
以後1年ずつ自動更新
当社
当社
Full Win
Developments Ltd.
(注)2
Changchun TBK
SHILI Auto Parts
Co., Ltd. (注)1
1
2
3
当社
Sangsin Brake
Co., Ltd. (注)2
韓国
電磁式リターダ
−同上−
2010年9月30日
販売開始日より10年
以後1年ずつ自動更新
当社
TBK India
Private Ltd.(注)1
インド
自動車用ウォー
ターポンプ、オイ
ルポンプ
−同上−
2011年6月28日
新製品量産時より10年
以後1年ずつ自動更新
当社
Changchun FAWSN
TBK Co., Ltd.
(注)2
中国
商用車用ブレーキ
−同上−
2012年7月5日
量産時より10年
以後1年ずつ自動更新
当社
Sangsin Brake
Co., Ltd. (注)2
韓国
自己発電型リター
ダ
−同上−
2014年4月30日
発効日より10年
以後1年ずつ自動更新
Hindustan
2017年8月31日
商用車用ブレーキ
Composites Limited
インド
−同上−
発効日より7年
摩擦材
以後2年ずつ自動更新
(注)2
(注)1.ロイヤリティの受取りについては、対象品目に応じて純売上高の一定率を受け取っております。
2.ロイヤリティの受取りについては、対象品目に応じて純売上高の一定率を受け取る契約となっております。
当社
26/122
EDINET提出書類
株式会社TBK(E02201)
有価証券報告書
6【研究開発活動】
当社グループの研究開発活動は環境と安全、省資源・省エネルギーを追求することを重点に自動車用・建設機械用
のブレーキとポンプの先端技術の開発と将来の柱となるべき商品の開発を、セグメント別では「日本」及び「アジ
ア」において行っております。
現在、研究開発は、当社の第一、第二、第三、第四開発部及び実験部により推進されており、研究スタッフは90名
で、グループ総従業員の約4.8%が従事しております。当連結会計年度の研究開発費総額は1,325百万円でありまし
た。このうち、新商品の開発に係る金額は130百万円であります。
①ブレーキ部門
国内商用車メーカー全社に採用されました当社ドラムブレーキは大幅に軽量・低コスト化し、次世代モデルとし
て展開拡大を図っております。また、ディスクブレーキは次期ブレーキの1つとして開発を進めており、当社独自
開発のパッド、ロータを含めて信頼性の高い商品をご提供できる様に開発を進めております。新興国向けのドラム
ブレーキも構造合理化を行い、幅広いニーズに対応できる様、開発を進めております。
さらに、安全性向上、環境対応、省エネルギー対応を主眼とした研究・開発に注力し、将来への継承技術を蓄え
ております。ブレーキ部門における当連結会計年度の研究開発費総額は544百万円であります。
②エンジンコンポーネント他部門
小型、中型、大型トラック・バス用エンジンのウォーターポンプとオイルポンプは、多くの国内外の得意先の性
能向上、信頼性向上及び原価低減の要求に対応し、商品の改良・開発を推進し実績をあげております。
また、建機・産機向けOEMエンジンにおいても、欧州排ガス規制Stage 5への対応を完了し、アジア圏の排ガ
ス規制中国4次(GB4)、インド5次(BS5)に向けた製品の開発を進めております。
さらに、海外メーカー向けに新規にウォーターポンプとオイルポンプの受注を獲得し、開発を進めております。
また、電動ポンプについても量産化しており、カーボンニュートラルへの取り組みとして新しい用途の要求に対
し研究開発を推進しております。
また、これら技術を中心とした商用車向けサーマルマネジメントシステムの開発も進めております。
その他については、リターダは、サスティナブルの観点からのブレーキ摩耗紛抑制対応と、安全性の観点からの
補助ブレーキとして中型・大型トラック用に採用いただいております。
さらに、FC商用車に適した補助ブレーキとして小型トラック用に採用をいただいており、さらに拡販を進めてま
いります。
リターダ技術を進化させ、回生技術を取り込んだ自己発電型リターダ、その技術にインバータと燃費およびバッ
テリー制御を取り込み駆動力のアシストを付加した“エンジンアシストシステム(マイルドハイブリッドシステ
ム)”の開発を進め、商用車・建産機のエンジンの燃費向上や出力向上に貢献する商品として、拡販を進めてまい
ります。
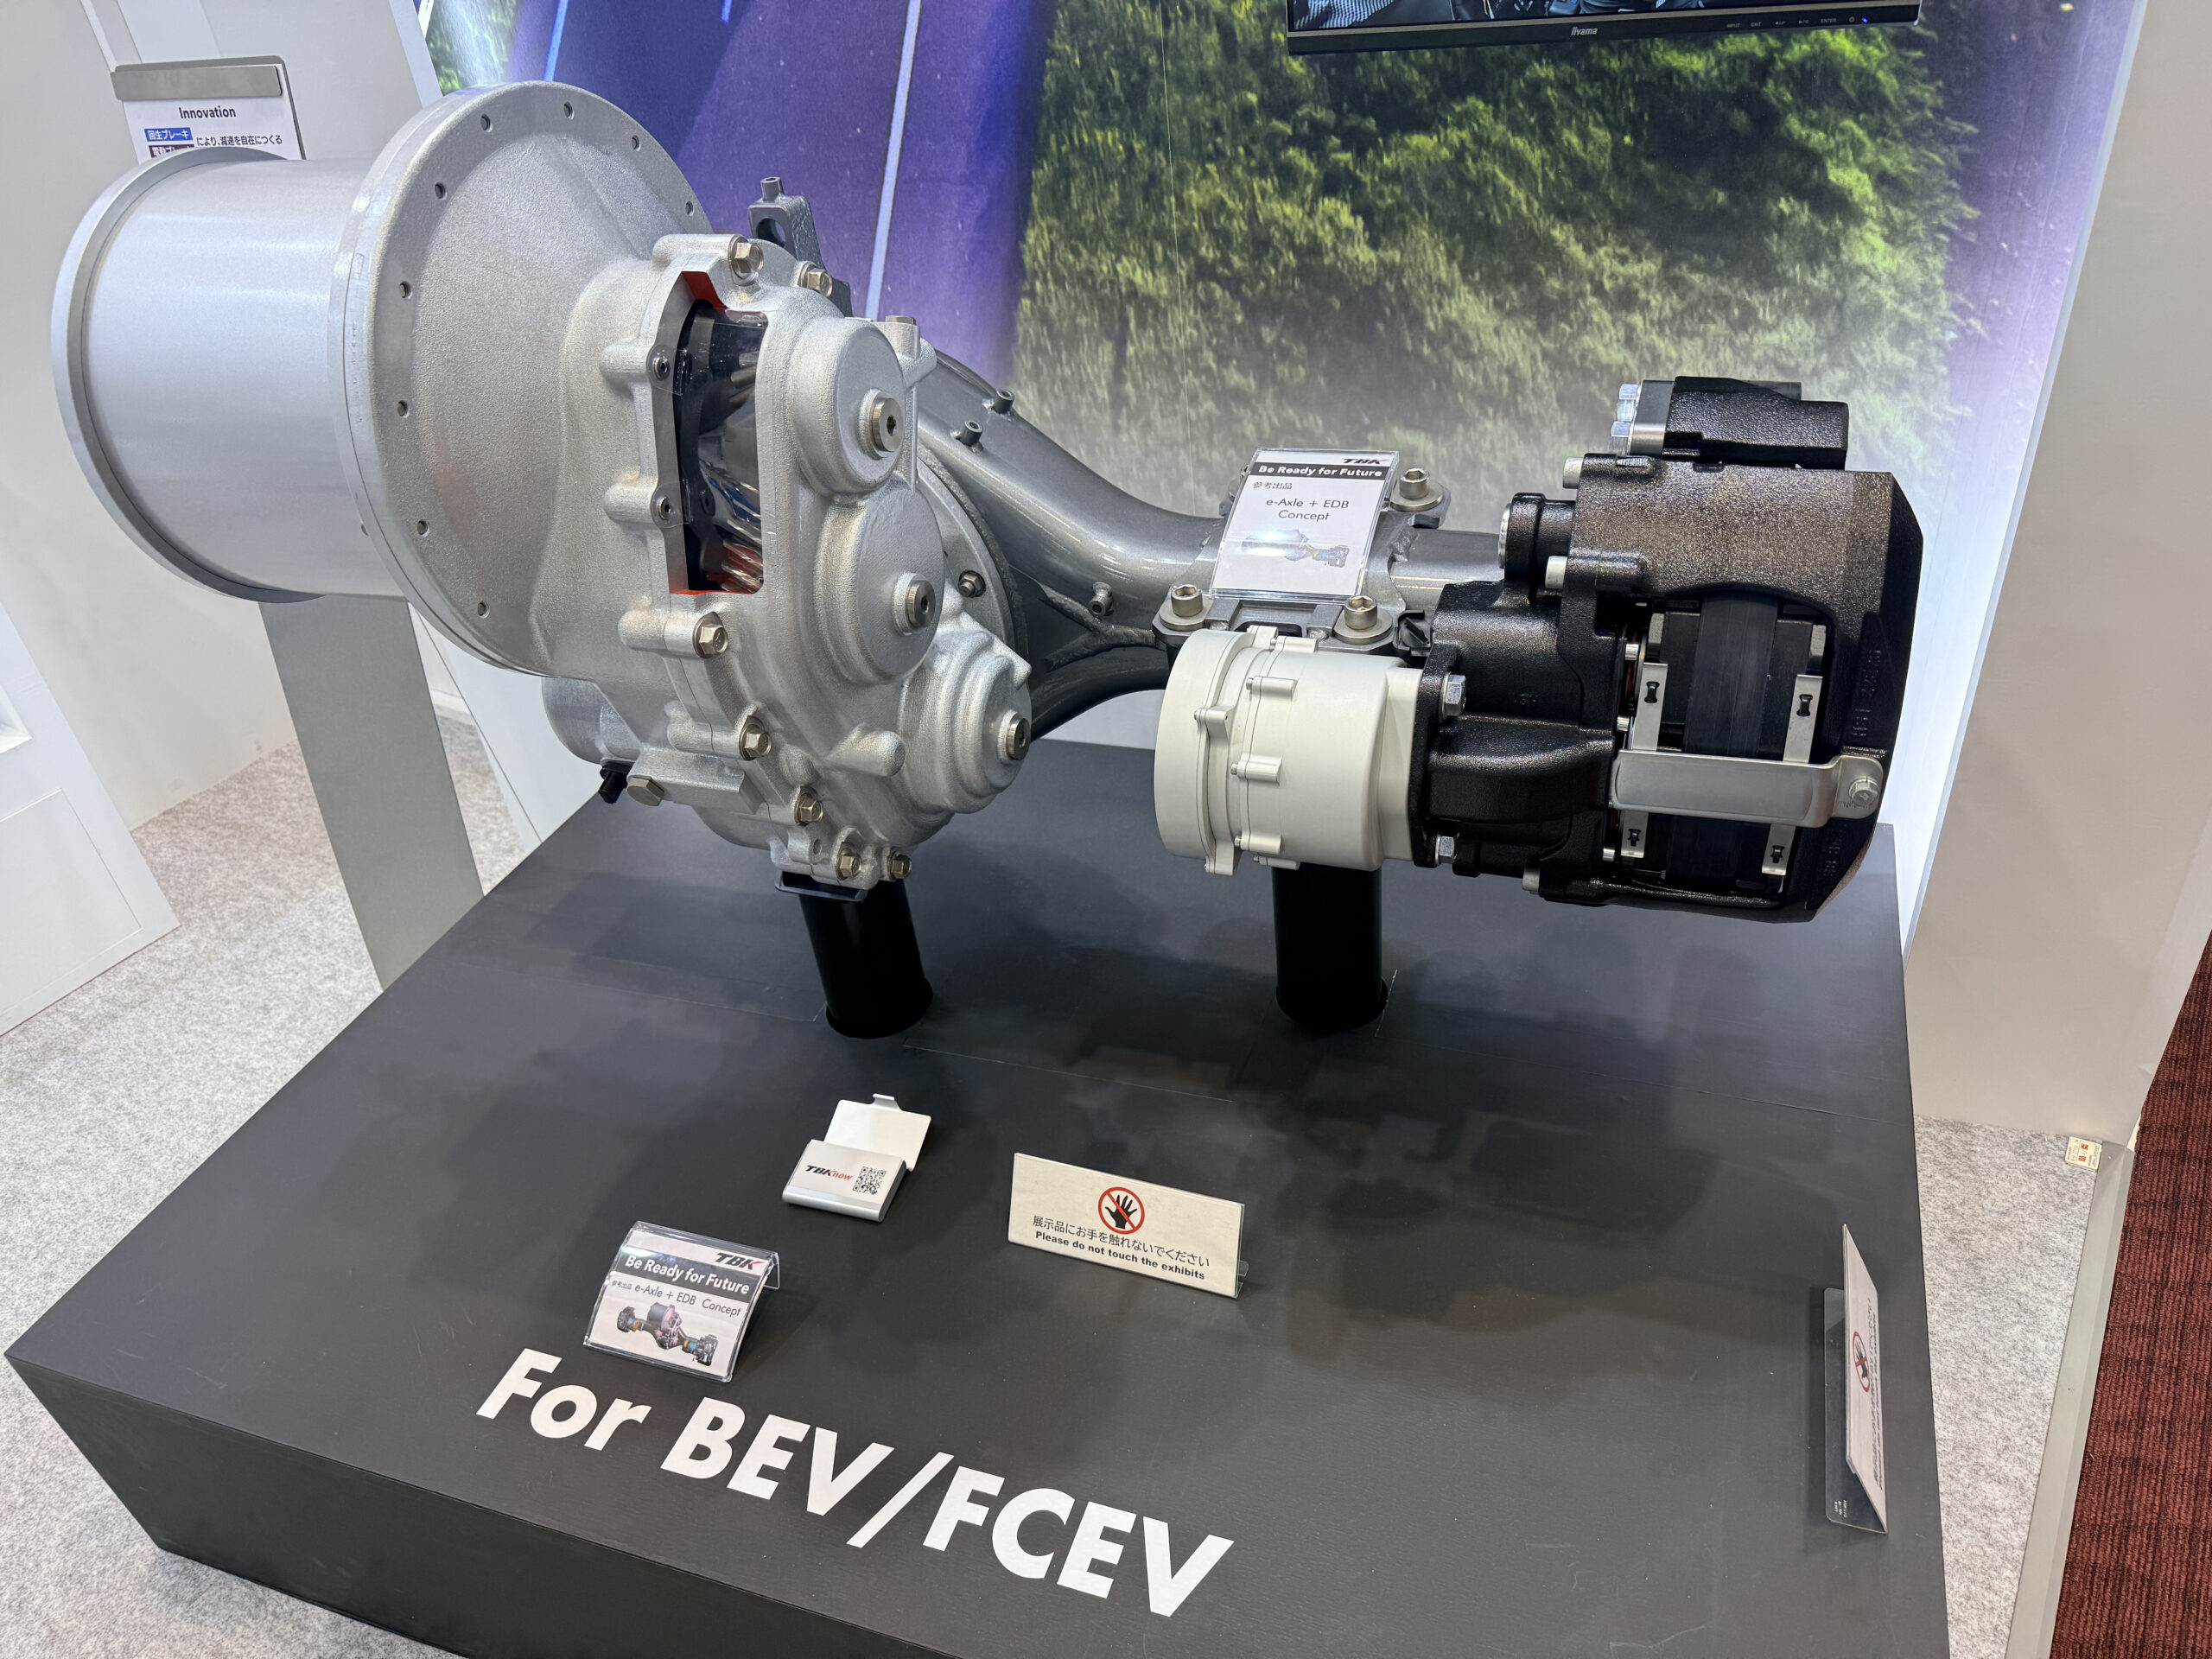
その設計・評価技術ノウハウを活用してe-Axleの開発にも取り組んでいます。
さらに、大型商用車のエアブレーキを扱っているがゆえにわかるエアマネージメントノウハウを活用した電動エ
アコンプレッサーの開発にも取り組んでいます。エンジンコンポーネント他部門における当連結会計年度の研究開
発費総額は780百万円であります。このうち、新商品の開発に係る金額は130百万円であります。
27/122
EDINET提出書類
株式会社TBK(E02201)
有価証券報告書
第3【設備の状況】
1【設備投資等の概要】
当社グループでは、当連結会計年度において3,260百万円の投資をいたしました。セグメント別では、「日本」では
1,717百万円、「アジア」では1,412百万円、「中国」では130百万円の投資をいたしました。
主要な設備投資は、「日本」ではブレーキ及びエンジンコンポーネント他生産設備、「アジア」ではエンジンコンポー
ネント他生産設備であります。
なお、「北米」は連結子会社であったTBK America, Inc.を除外したことに伴い、記載しておりません。
2【主要な設備の状況】
(1)提出会社
帳簿価額(百万円)
事業所名
(所在地)
セグメントの
名称
福島工場
(福島県石川郡玉川村)
鶴岡工場
(山形県鶴岡市)
テストコース
(北海道帯広市)
設備の内容
建物及び構
築物
機械装置及
び運搬具
日本
ブレーキ・
ウォーターポン
プオイルポンプ
生産設備
608
994
日本
ブレーキ部品・
ウォーターポン
プオイルポンプ
生産設備
343
670
日本
製品の試験設備
48
19
土地
(面積千㎡)
その他
392
(163)
従業員数
(名)
合計
262
2,258
64
1,737
1
96
659
(66)
26
(374)
375
(170)
202
(94)
4
(1)
(注)1.帳簿価額のうち「その他」は、「工具、器具及び備品」の合計であります。
2.上記の他、連結会社以外からの主要な賃借設備の内容は、次のとおりであります。
事業所名
(所在地)
本社
(東京都町田市)
セグメントの
名称
日本・全社
(共通)
面積
(㎡)
設備の内容
建物
年間賃借料
(百万円)
2,704
72
(注)本社建物は賃貸借契約に基づくものであります。
3.従業員数の(外書)は臨時従業員の雇用人員であります。
(2)国内子会社
帳簿価額(百万円)
事業所名
(所在地)
セグメント
の名称
木村可鍛株式
会社
福島県
白河市
日本
ダクタイル鋳鉄
品生産設備
59
141
株式会社サン
テック
静岡県
浜松市
日本
各種専用工作機
械生産設備
118
77
会社名
設備の内容
建物及び構
築物
土地
機械装置及
び運搬具
(面積千㎡)
71
(56)
288
(12)
(注)1.帳簿価額のうち「その他」は、「工具、器具及び備品」の合計であります。
2.従業員数の(外書)は臨時従業員の雇用人員であります。
28/122
その他
合計
19
291
1
486
従業員数
(名)
34
(33)
42
(10)
EDINET提出書類
株式会社TBK(E02201)
有価証券報告書
(3)在外子会社
帳簿価額(百万円)
会社名
TBKK
(Thailand)
Co., Ltd.
TBK India
Private
Ltd.
Dongguan
TBK Co.,
Ltd.
事業所名
(所在地)
タイ国チョ
ンブリ県
インド国マ
ハラシュト
ラ州
中国広東省
東莞市
セグメント
の名称
アジア
アジア
中国
設備の内容
ブレーキ・
ウォーターポン
プオイルポンプ
生産設備
ウォーターポン
プオイルポンプ
生産設備
ライニング・
ウォーターポン
建物及び構
築物
土地
機械装置及
び運搬具
(面積千㎡)
2,789
4,568
379
416
126
350
プ生産設備
1,979
(130)
431
(394)
−
(−)
その他
合計
304
9,641
177
1,404
38
515
88
645
173
1,893
従業員数
(名)
612
(262)
154
(233)
86
(2)
Changchun
TBK SHILI
Auto Parts
中国吉林省
長春市
中国
ライニング生産
設備
163
393
中国
ライニング生産
設備
−
1,719
−
(−)
123
(9)
Co., Ltd.
Tongchuan
TBK Auto
中国陝西省
Parts Co.,
銅川市
−
(−)
75
(7)
Ltd.
(注)1.帳簿価額のうち「その他」は、「工具、器具及び備品」の合計であります。
2.従業員数の(外書)は臨時従業員の雇用人員であります。
3.TBK America, Inc.は生産の最適化を目的として、2025年11月25日に清算いたしました。
3【設備の新設、除却等の計画】
(1)重要な設備の新設等
当社グループの設備投資については、生産能力の拡大・合理化及び品質向上等を総合的に勘案し、提出会社を中
心に総括的に策定しております。
なお、当連結会計年度末現在における重要な設備の新設等は計画しておりません。
(2)重要な設備の除却等
該当事項はありません。
29/122
EDINET提出書類
株式会社TBK(E02201)
有価証券報告書
第4【提出会社の状況】
1【株式等の状況】
(1)【株式の総数等】
①【株式の総数】
種類
発行可能株式総数(株)
普通株式
76,000,000
計
76,000,000
②【発行済株式】
種類
事業年度末現在発行数
(株)
(2026年3月31日)
提出日現在発行数(株)
(2026年6月25日)
普通株式
32,694,135
32,694,135
計
32,694,135
32,694,135
上場金融商品取引所名
又は登録認可金融商品
取引業協会名
東京証券取引所
スタンダード市場
内容
権利内容に何ら限
定のない当社にお
ける標準となる株
式であり、単元株
式数は100株であ
ります。
−
−
(2)【新株予約権等の状況】
①【ストックオプション制度の内容】
該当事項はありません。
②【ライツプランの内容】
該当事項はありません。
③【その他の新株予約権等の状況】
該当事項はありません。
(3)【行使価額修正条項付新株予約権付社債券等の行使状況等】
該当事項はありません。
(4)【発行済株式総数、資本金等の推移】
年月日
発行済株式総
数増減数
(株)
発行済株式総
数残高(株)
資本金増減額
(百万円)
資本金残高
(百万円)
資本準備金増減
額(百万円)
資本準備金残
高(百万円)
2025年12月9日(注)
3,269,500
32,694,135
568
5,186
568
818
(注)有償第三者割当
発行価格
資本組入額
割当先
348円
174円
Brakes India Private Limited
30/122
EDINET提出書類
株式会社TBK(E02201)
有価証券報告書
(5)【所有者別状況】
2026年3月31日現在
株式の状況(1単元の株式数100株)
区分
株主数(人)
所有株式数
(単元)
所有株式数の
割合(%)
政府及び地
方公共団体
金融機関
金融商品取
引業者
その他の法
人
外国法人等
個人その他
個人以外
計
単元未満株
式の状況
(株)
個人
1
8
16
194
40
61
31,033
31,353
−
21
57,847
2,514
65,053
59,545
156
141,126
326,262
67,935
0.01
17.72
0.77
19.94
18.25
0.05
43.26
100.00
−
(注)自己株式104,147株は「個人その他」に1,041単元及び「単元未満株式の状況」に47株を含めて記載しておりま
す。
31/122
EDINET提出書類
株式会社TBK(E02201)
有価証券報告書
(6)【大株主の状況】
氏名又は名称
所有株式数
(千株)
住所
BRAKES INDIA PRIVATE LIMITED
21, PATULLOS ROAD CHENNAI
(常任代理人
社)
TAMIL NADU 600 002 INDIA
みずほ証券株式会
2026年3月31日現在
発行済株式(自己
株式を除く。)の
総数に対する所有
株式数の割合
(%)
3,269
10.03
2,798
8.59
2,101
6.45
(東京都千代田区大手町1-5-1)
神奈川県横浜市西区高島1-2-5
いすゞ自動車株式会社
SKANDINAVISKA ENSKILDA BANKEN
AB FBO ATHANASE INDUSTR.
PARTNERS FUND Ⅱ
(常任代理人
J銀行)
株式会社三菱UF
BIRGER JARLSGATAN 6 SWEDEN
(東京都千代田区丸の内1-4-5)
朝日生命保険相互会社
(常任代理人株式会社日本カス
トディ銀行)
東京都新宿四谷1-6-1
(東京都中央区晴海1-8-12)
1,610
4.94
株式会社三井住友銀行
東京都千代田区丸の内1-1-2
1,423
4.37
株式会社横浜銀行
(常任代理人株式会社日本カス
トディ銀行)
神奈川県横浜市西区みなとみらい3-1-1
(東京都中央区晴海1-8-12)
1,423
4.37
神奈川県相模原市中央区田名3000
1,341
4.11
三菱重工エンジン&ターボチャー
ジャ株式会社
株式会社日本カストディ銀行(信
託E口)
東京都中央区晴海1-8-12
823
2.53
学校法人帝京大学
東京都板橋区加賀2-11-1
561
1.72
TBK自社株投資会
東京都町田市南成瀬4-21-1
403
1.24
15,755
48.34
計
−
(注)1.所有株式数の割合は自己株式(104,147株)を控除して計算しております。
2.自己株式には、株式会社日本カストディ銀行(信託E口)が保有する、取締役及び執行役員向けの株式給付
信託(BBT)823,546株は含まれておりません。
3.前事業年度末において主要株主でなかったBRAKES INDIA PRIVATE LIMITED は、当事業年度末現在では主要
株主となっております。
4.上記のBRAKES INDIA PRIVATE LIMITED の所有株式数は、2025年12月11日付で提出された大量保有報告書、
および当社が2025年12月9日に実施した新株式発行の結果に基づき記載しております。
5.2025年7月7日付で公衆の縦覧に供されている大量保有報告書において、アタナセ・インダストリアル・
パートナー・エービー及びその共同保有者であるアタナセ・インダストリアル・パートナーが2025年7月2
日現在で以下の株式を所有している旨が記載されているものの、当社として2026年3月31日時点における実
質所有株式数の確認ができませんので、上記大株主の状況には含めておりません。
なお、大量保有報告書の内容は以下のとおりです。
氏名または名称
アタナセ・インダストリア
ル・パートナー・エービー
(Athanase Industrial
Partner AB)
アタナセ・インダストリア
ル・パートナー(Athanase
Industrial Partner)
計
保有株券等の数
(千株)
株券等保有割合
(%)
0
0
ケイマン諸島KY1-9006グランド・ケ
イマン、ウエスト・ベイ・ロード、
ランドマーク・スクエア私書箱775
1,555
5.29
−
1,555
5.29
住所
スウェーデン、ストックホルム114
34、ビルガー・ヤールスガータン
6、4階
6.2025年9月5日付で公衆の縦覧に供されている大量保有報告書において、アタナセ・インダストリアル・
パートナーが2025年8月29日現在で以下の株式を所有している旨が記載されているものの、当社として2026
32/122
EDINET提出書類
株式会社TBK(E02201)
有価証券報告書
年3月31日時点における実質所有株式数の確認ができませんので、上記大株主の状況には含めておりませ
ん。
なお、大量保有報告書の内容は以下のとおりです。
氏名または名称
住所
アタナセ・インダストリア
ル・パートナー(Athanase
ケイマン諸島KY1-9006グランド・ケ
イマン、ウエスト・ベイ・ロード、
ランドマーク・スクエア私書箱775
Industrial Partner)
33/122
保有株券等の数
(千株)
株券等保有割合
(%)
1,850
6.29
EDINET提出書類
株式会社TBK(E02201)
有価証券報告書
(7)【議決権の状況】
①【発行済株式】
2026年3月31日現在
区分
株式数(株)
議決権の数(個)
内容
無議決権株式
−
−
−
議決権制限株式(自己株式等)
−
−
−
議決権制限株式(その他)
−
−
−
−
−
325,221
−
完全議決権株式(自己株式等)
(自己保有株式)
104,100
普通株式
完全議決権株式(その他)
普通株式
32,522,100
単元未満株式
普通株式
67,935
−
−
発行済株式総数
32,694,135
−
−
総株主の議決権
−
325,221
−
(注)「完全議決権株式(その他)」欄の普通株式には、株式給付信託(BBT)が保有する当社株式823,546株(議決権
の数8,235)が含まれております。なお、当該議決権の数8,235個は、議決権不行使となっております。
②【自己株式等】
2026年3月31日現在
発行済株式総数に
対する所有株式数
の割合(%)
所有者の氏名又は
名称
所有者の住所
自己名義所有株
式数(株)
他人名義所有株
式数(株)
所有株式数の合
計(株)
(自己保有株式)
株式会社TBK
東京都町田市南成
瀬4-21-1
104,100
−
104,100
0.32
計
−
104,100
−
104,100
0.32
(注)株式給付信託(BBT)が保有する当社株式 823,546株は上記自己保有株式に含まれておりません。
34/122
EDINET提出書類
株式会社TBK(E02201)
有価証券報告書
(8)【役員・従業員株式所有制度の内容】
当社は、2019年6月20日開催の第83回定時株主総会決議及び2021年6月29日開催の第85回定時株主総会決議に基づ
き、取締役(社外取締役を含みます。以下、断りがない限り、同じとします。)及び執行役員(以下、取締役とあわせ
て「取締役等」といいます。)の報酬と当社の株式価値との連動性をより明確にし、取締役等が株価上昇によるメリッ
トのみならず、株価下落リスクまでも株主の皆様と共有することで、取締役(社外取締役を除きます。)及び執行役員
に関しては、中長期的な業績の向上と企業価値の増大に貢献する意識を高めることを目的とし、また、社外取締役に関
しては、当社の経営の健全性と社会的信頼の確保を通じた当社に対する社会的評価の向上を動機付けることを目的に、
業績連動型株式報酬制度として「株式給付信託(BBT(=Board Benefit Trust))」(以下「本制度」といいます。)
を導入しています。
①本制度の概要
本制度は、当社が拠出する金銭を原資として当社株式が信託(以下、本制度に基づき設定される信託を「本信託」
といいます。)を通じて取得され、取締役等に対して、当社が定める役員株式給付規則に従って、当社株式が本信託
を通じて給付される株式報酬制度です。なお、取締役等が当社株式の給付を受ける時期は、原則として取締役等の退
任時となります。
<本制度の仕組み>
ⅰ.当社は、株主総会において、本制度について役員報酬の決議を得て、株主総会で承認を受けた枠組みの範囲内にお
いて、「役員株式給付規則」を制定します。
ⅱ.当社は、ⅰの株主総会決議で承認を受けた範囲内で金銭を信託します。
ⅲ.本信託は、ⅱで信託された金銭を原資として当社株式を、取引所市場を通じて又は当社の自己株式処分を引き受け
る方法により取得します。
ⅳ.当社は、「役員株式給付規則」に基づき、取締役等にポイントを付与します。
ⅴ.本信託は、当社から独立した信託管理人の指図に従い、本信託勘定内の当社株式に係る議決権を行使しないことと
します。
ⅵ.本信託は、取締役等を退任した者のうち「役員株式給付規則」に定める受益者要件を満たした者(以下「受益者」
といいます。)に対して、当該受益者に付与されたポイント数に応じた当社株式を給付します。
②取締役等に取得させる予定の株式の総数又は総額
823,546株
③本制度による受益権その他の権利を受けることが出来る者の範囲
取締役等を退任した者のうち役員株式給付規則に定める受益者要件を満たす者
35/122
EDINET提出書類
株式会社TBK(E02201)
有価証券報告書
2【自己株式の取得等の状況】
【株式の種類等】
会社法第155条第7号に該当する普通株式の取得
(1)【株主総会決議による取得の状況】
該当事項はありません。
(2)【取締役会決議による取得の状況】
該当事項はありません。
(3)【株主総会決議又は取締役会決議に基づかないものの内容】
区分
株式数(株)
価額の総額(円)
当事業年度における取得自己株式
911
307,945
当期間における取得自己株式
70
25,900
(注)当期間における取得自己株式には、2026年6月1日からこの有価証券報告書提出日までの単元未満株式の買取り
による株式数は含まれておりません。
(4)【取得自己株式の処理状況及び保有状況】
当事業年度
区分
当期間
株式数(株)
処分価額の総額
(円)
株式数(株)
処分価額の総額
(円)
引き受ける者の募集を行った取得自己株式
−
−
−
−
消却の処分を行った取得自己株式
−
−
−
−
合併、株式交換、株式交付、会社分割に係る
移転を行った取得自己株式
−
−
−
−
その他
−
−
−
−
104,147
−
104,147
−
保有自己株式数
(注)当期間における取得自己株式の処理状況及び保有状況には、2026年6月1日からこの有価証券報告書提出日まで
の単元未満株式の買取り及び買増しによる株式数は含まれておりません。
36/122
EDINET提出書類
株式会社TBK(E02201)
有価証券報告書
3【配当政策】
利益配分につきましては、株主の皆様に対する利益還元を経営の最重要課題のひとつと位置づけたうえで、収益力
及び財務体質の一層の強化を図りながら、安定した剰余金の配当を継続することを基本方針としております。その実
施につきましては連結決算の状況及び事業を取り巻く経済環境を勘案し、総合的に決定しております。
当社は、中間配当と期末配当の年2回の剰余金の配当を行うことを基本方針としており、これらの剰余金の配当の
決定機関は、取締役会であります。第16次中期経営計画期間内においては、安定配当を基本方針として、配当性向
40%以上を継続的に実施してまいります。
当期の配当につきましては、上記の方針及び当社を取り巻く経営環境等を総合的に勘案した結果、中間配当金を4
円、期末配当金を4円とし、年間配当金を1株あたり8円といたしました。
なお、内部留保につきましては、今後予想される経営環境の変化への対応や将来の事業展開に備えつつ、更なる成
長に向けた投資資金として活用していきたいと考えております。
当社は、「会社法第459条第1項の規定に基づき、取締役会の決議をもって剰余金の配当等を行うことができ
る。」旨定款に定めております。
以上の方針に基づき、当事業年度の剰余金の配当は以下のとおりであります。
決議年月日
2025年11月13日
取締役会決議
2026年5月14日
取締役会決議
配当金の総額
(百万円)
1株当たり配当額
(円)
117
4
130
4
37/122
EDINET提出書類
株式会社TBK(E02201)
有価証券報告書
4【コーポレート・ガバナンスの状況等】
(1)【コーポレート・ガバナンスの概要】
①コーポレート・ガバナンスに関する基本的な考え方
当社は、コーポレート・ガバナンスに関する基本的な考え方として、経営判断の迅速化を図り、業務施策の円
滑な執行を行うと同時に、判断及び執行の過程での透明性を確保し、相互牽制により違法性を排除することが重
要であると考えております。
②企業統治の体制の概要及び当該体制を採用する理由
当社の企業統治に関連した体制は以下のとおりであります。
コーポレート・ガバナンスの詳細については、当社ウェブサイトに記載していますのでご参照ください。
(https://tbk-jp.com/sustainability/governance/)
なお、当該サイトは2026年7月に更新予定です。
<取締役会>
当社の取締役会は5名の取締役で構成され、月1回の定例会の他、必要に応じて臨時会を開催し、重要な業務
執行の審議・決定、代表取締役・業務執行取締役による職務の執行状況の報告を通じて、取締役の職務執行の監
督を行っております。また、当社は、独立した立場から取締役等の職務の執行を監督し、取締役会の機能強化を
図るため、社外取締役2名を選任しております。社外取締役からは、当社の経営判断・意思決定の過程で、独立
した立場から企業経営等の豊富な経験や実績、幅広い知識と見識に基づいた的確な提言・助言が得られておりま
す。
<指名・報酬委員会>
取締役の指名・報酬等に係る取締役会の機能公正性・透明性・客観性と説明責任を強化することを目的とし、
任意の指名・報酬委員会を設置し、適宜開催しております。委員長及び委員の半数以上を独立社外取締役とし、
取締役4名(うち社外取締役2名)で構成されております。
<監査役会>
当社は、監査役会制度を採用しており、監査役3名全員が東京証券取引所の定める独立役員の要件を満たす社
外監査役としております。また、監査役には、財務及び会計に関する専門的な知見を有している者を1名以上選
任しております。監査役及び監査役会は、その役割・責務を果たすにあたり、株主に対する受託者責任を踏ま
え、社外監査役の有する高い専門性に加え、常勤監査役1名を選定し、その有する情報を併せることで、適法性
監査にとどまらず、独立した客観的な立場で能動的・積極的に権限を行使し、適切に判断して行動することがで
きる体制を確保しております。監査役は、毎月監査役会を開催するとともに取締役会に出席し、適宜必要な意見
を述べております。
なお、当社が監査役会制度を採用している理由は、株主・投資家等からの信頼を確保するため、自動車部品等
製造業界と当社の経営課題を熟知した取締役会による迅速かつ戦略的な意思決定と監督に加え、社外取締役及び
社外監査役による監督・監査の両輪の体制が、有効かつ効率的と判断しているからであります。
<執行役員会>
執行役員会は8名の執行役員(取締役を兼務する執行役員を含む)で構成され、原則として月1回開催し、業
務執行に関する個別経営課題の審議・決定を行います。
38/122
EDINET提出書類
株式会社TBK(E02201)
有価証券報告書
<経営会議>
取締役(社外取締役を除く。)及び各子会社社長で構成された経営会議を適宜開催し、内外子会社の業務計画
や業務執行状況について報告を受け、トップマネジメントが業務執行状況をフォローしております。
その他、各部門におけるコンプライアンス、リスク管理の状況について確認し、内外子会社の経営状況・経営
課題を把握し、企業集団の内部統制に努めております。また、上記とは別に中期経営計画会議(構成メンバーは
執行役員会と同じ)を必要に応じて開催しております。
このような体制のもと、コーポレート・ガバナンス強化を進めてまいります。
当社は、2026年6月26日開催予定の定時株主総会の議案(決議事項)として、「取締役5名選任の件」を上程
しており、当該議案が承認可決されますと、当社の機関ごとの構成員は、以下の通りとなる予定です。
(◎は議長、委員長を表す。)
役職名
氏名
取締役会
監査役会
指名・報
酬委員会
執行役員会
経営会議
代表取締役社長
尾方
馨
◎
○
◎
◎
取締役常務執行役員
小林
正登
○
○
○
○
取締役常務執行役員
久保
隆
○
○
○
社外取締役
千代田
社外取締役
村田
常勤監査役
(注)
(注)
○
○
○
◎
恵一
○
○
竹添
英雄
(注)
◎
社外監査役
大塚
啓一
(注)
○
社外監査役
稲垣
尚
(注)
○
執行役員
丁
執行役員
菊地
正信
○
執行役員
傍士
武
○
執行役員
工藤
琢也
○
執行役員
浮田
真理子
○
子会社社長
有子
旭威
他5名
○
(注)構成員ではありませんが、各会議体に出席しております。
③企業統治に関するその他の事項
当社は、コンプライアンスの推進及びリスクマネジメント等を基礎として、内部統制システムを構築してお
ります。
・コンプライアンス体制の整備の状況
当社は、コンプライアンスの実効性を高めるため、役員及び全従業員が、法令・定款及び経営理念を遵守し
た行動をとるようコンプライアンス推進体制を構築しております。具体的には、リスク・コンプライアンス統
括責任者を任命し、各部長・室長をリスク・コンプライアンス責任者、各課長をリスク・コンプライアンス推
進者とし、部門が所管する業務に係る法令の調査・分析を行い、社内規則等を制定しております。役員及び従
業員の法令・定款等の違反行為に対する勧告と教育の実施について、責任及び推進を担っております。
また、リスク・コンプライアンス委員会、同部会を四半期に1回定期的に開催し、コンプライアンス全般や
内部通報等について審議し、その内容を定期的に取締役会に報告しております。
・リスク管理体制の整備の状況
当社は、リスク管理体制の整備のために、リスク管理・コンプライアンス規則を制定し、リスク・コンプラ
イアンス委員会、同部会を四半期に1回定期的に開催し、子会社から報告のあったリスク全般も含めて審議
し、その内容を定期的に取締役会に報告することで、リスクへの対応とチェックを行っております。
39/122
EDINET提出書類
株式会社TBK(E02201)
有価証券報告書
・子会社の業務の適正を確保するための体制整備の状況
イ.子会社の取締役等の職務の執行に係る事項の当社への報告に関する体制
当社は、グループ会社管理規則を定め、子会社の自主性を尊重しつつ子会社の当社に対する報告体制を明
確にするとともに、決裁規則に基づき、当社における事前承認事項及び報告事項を明確にし、その執行状況
をモニタリングします。
子会社は、経営目標や経営課題の達成状況を経営会議において当社に対し報告し、子会社の経営状況、重
要課題の遂行状況が適宜把握できる体制とします。
ロ.子会社の損失の危険の管理に関する規程その他の体制
当社グループの業務執行に関わるリスクの把握と管理を目的としてリスク管理・コンプライアンス規則を
定め、グループ内で発生することが想定されるリスクを把握し管理する体制を整備します。
子会社は、リスク管理に関わる事項をリスク・コンプライアンス委員会へ報告し、重要な事項については
当社の取締役会において報告、審議する体制とします。
ハ.子会社の取締役等の職務の執行が効率的に行われることを確保するための体制
当社は、必要に応じて当社取締役及び従業員を子会社に派遣し、子会社の取締役の効率的な業務執行を監
督します。
子会社の意思決定について、グループ会社管理規則及び決裁規則に明文化し、それぞれ重要性に応じた意
思決定を行います。
ニ.子会社の取締役等及び従業員の職務の執行が法令及び定款に適合することを確保するための体制
当社グループのコンプライアンスに係る基本方針であるコンプライアンス基本理念及びそれを具体化した
コンプライアンス行動指針を定め、子会社の取締役等及び従業員に、法令、社会規範、企業倫理の尊重、遵
守を周知徹底します。
子会社はコンプライアンスに関わる事項をリスク・コンプライアンス委員会へ報告し、重要な事項につい
ては、当社の取締役会において、報告、審議する体制とします。
④責任限定契約の内容の概要
当社と社外取締役及び監査役は、会社法第427条第1項の規定に基づき、同法第423条第1項の損害賠償責任
を限定する契約を締結しております。
当該契約に基づく損害賠償責任の限度額は、100万円と法令が規定する額のいずれか高い額としておりま
す。
また、当社と会計監査人有限責任 あずさ監査法人は、会社法第427条第1項の規定に基づき、同法第423条
第1項の損害賠償責任を限定する契約を締結しております。
当該契約に基づく損害賠償責任の限度額は法令が定める額としております。
⑤役員等賠償責任保険契約の内容の概要
当社は、会社法第430条の3第1項に規定する役員等賠償責任保険契約を保険会社との間で締結しており、
当該保険契約により、被保険者が業務に起因して損害賠償責任を負った場合における損害(ただし、保険契約
上で定められた免責事由に該当するものを除きます。)等を補填することとしております。当該保険契約の被
保険者の範囲は、当社及び子会社におけるすべての取締役、監査役並びに当社の執行役員であり、被保険者は
保険料を負担しておりません。
⑥取締役の定数
当社の取締役は8名以内とする旨定款に定めております。
⑦取締役会にて決議できる株主総会決議事項
当社は、剰余金の配当等会社法第459条第1項各号に定める事項について、法令に別段の定めがある場合を
除き、株主総会の決議によらず、取締役会の決議により定める旨定款に定めております。これは、剰余金の配
当等を取締役会の権限とすることにより、株主への機動的な利益還元を行うことを目的とするものでありま
す。
⑧取締役の選任の決議要件
当社は、取締役の選任決議について、議決権を行使することができる株主の議決権の3分の1以上を有する
株主が出席し、その議決権の過半数をもって行う旨及び累積投票によらない旨を定款に定めております。
⑨株主総会の特別決議要件
当社は、会社法第309条第2項に定める株主総会の特別決議要件について、議決権を行使することができる
株主の議決権の3分の1以上を有する株主が出席し、その議決権の3分の2以上をもって行う旨定款に定めて
おります。これは、株主総会における特別決議の定足数を緩和することにより、株主総会の円滑な運営を行う
ことを目的とするものであります。
40/122
EDINET提出書類
株式会社TBK(E02201)
有価証券報告書
⑩取締役会の活動状況
当事業年度において、取締役会を原則月1回開催するほか、必要に応じて随時開催しており、個々の取締役の
出席状況は次のとおりであります。
役職名
氏名
開催回数
出席回数
代表取締役社長
尾方
馨
19回
19回
取締役常務執行役員
小林
正登
19回
19回
取締役常務執行役員
久保
隆
16回
16回
取締役常務執行役員
丁
旭威
3回
3回
社外取締役
千代田
有子
19回
18回
社外取締役
村田
恵一
19回
19回
(注)開催回数が異なるのは、就任時期及び退任時期の違いによるものです。
・取締役会における具体的な検討内容
当事業年度は、当社グループ経営執行の監視を行うとともに、取締役及び監査役候補者の決定、執行役員
に関する人事、人材戦略方針の決定、重要財産の売却、海外子会社に関する決定、決算及び予算等の重要事
項の承認を行い、各セグメントにおける事業、当社の事業に係る重要な業務提携について議論しました。
⑪指名・報酬委員会の活動状況
当事業年度において、指名・報酬委員会を適宜開催しており、個々の指名・報酬委員の出席状況は次のとおり
であります。
役職名
氏名
開催回数
出席回数
委員長
千代田
有子
3回
3回
委員
村田
恵一
3回
3回
委員
尾方
馨
3回
3回
委員
小林
正登
3回
3回
・指名・報酬委員会における具体的な検討内容
当事業年度は、取締役会の在り方やその構成等、取締役の報酬額やその妥当性について議論し、取締役会
へ答申しました。また、サクセッションプラン(取締役及び執行役員の後継者育成計画)について検討いた
しました。
41/122
EDINET提出書類
株式会社TBK(E02201)
有価証券報告書
(2)【役員の状況】
①役員一覧
2026年6月25日(有価証券報告書提出日)現在の当社の役員の状況は、以下の通りです。
男性7名女性1名 (役員のうち女性の比率12.5%)
役職名
氏名
生年月日
略歴
任期
所有株式数
(百株)
(注)3
302
(注)3
101
(注)3
(注)3
19
(注)3
13
(注)4
6
1986年4月当社入社
2011年10月 TBK America, Inc.代表取締役社長
2017年10月 TBKK (Thailand) Co., Ltd.
代表取締役
社長
尾方
馨
1962年12月20日生
代表取締役社長
2018年4月当社執行役員
2019年4月当社常務執行役員
2021年6月当社取締役常務執行役員
2022年4月当社代表取締役社長(現任)
2014年5月当社入社
2014年8月新製品開発部長
取締役
小林
正登
2017年4月当社執行役員
開発部門担当
2018年10月当社執行役員
海外営業担当
2020年4月当社常務執行役員
開発部門担当
2024年4月当社常務執行役員
サステナビリティ
推進室、開発部門、購買部門担当
1959年10月20日生
2024年6月当社取締役常務執行役員
2025年4月当社取締役常務執行役員
開発本部
長、購買本部長、第三開発部・第四開
発部担当
2026年4月当社取締役常務執行役員
開発本部長、生産本部担当(現任)
2020年1月 ピーピージー・ジャパン株式会社
代表取締役社長
2024年7月当社入社
2024年8月社長室長
2025年4月当社常務執行役員
取締役
久保
隆
営業本部長、経営
戦略部・財務部・人事戦略部担当
1967年2月5日生
2025年6月当社取締役常務執行役員
営業本部長
2026年4月当社取締役常務執行役員
営業本部長、経営戦略本部長、
コーポレート管理本部担当(現任)
1992年4月司法研修所入所
1994年4月弁護士登録
2002年1月千代田法律事務所代表(現任)
取締役
千代田
有子
1961年1月14日生 2016年6月 クリナップ株式会社社外取締役
(現任)
2018年6月株式会社廣済堂社外取締役
2020年6月当社取締役(現任)
1977年4月日産自動車株式会社入社
2004年4月同社執行役員R&D部門製品開発本部・
車両実験部門担当
取締役
村田
恵一
1955年1月18日生
2008年4月株式会社日産テクノ代表取締役社長
2016年6月 カルソニックカンセイ株式会社
社外取締役
2017年10月 デジタルプロセス株式会社技術顧問
2022年6月当社取締役(現任)
1984年4月朝日生命保険相互会社入社
2006年4月同社事務設計ユニット
ゼネラルマネージャー
2008年4月同社企画調査ユニット
ゼネラルマネージャー
常勤監査役
竹添
英雄
1961年11月25日生 2011年4月同社情報システム企画ユニット
ゼネラルマネージャー
2016年4月同社お客様サービス部長
2021年4月同社内部監査局長
2024年4月同社人事部顧問
2024年6月当社常勤監査役(現任)
42/122
EDINET提出書類
株式会社TBK(E02201)
有価証券報告書
役職名
氏名
生年月日
略歴
任期
所有株式数
(百株)
(注)4
(注)4
229
1978年11月 プライスウォーターハウス会計事務所
入所
1982年8月公認会計士登録
1998年7月青山監査法人代表社員就任
監査役
大塚
啓一
1955年10月8日生
2006年9月 あらた監査法人代表社員就任
(現PwC Japan有限責任監査法人)
2016年6月当社監査役(現任)
2016年7月大塚公認会計士事務所代表(現任)
2021年6月 ソフトバンクグループ株式会社
社外監査役
1984年4月株式会社太陽神戸銀行入行
(現株式会社三井住友銀行)
2012年4月株式会社三井住友銀行執行役員
2017年6月 SMBC債権回収株式会社代表取締役社長
監査役
稲垣
尚
1959年4月24日生 2020年6月株式会社陽栄代表取締役社長
2021年6月株式会社陽栄ホールディング
代表取締役社長
2021年6月岩崎電気株式会社社外監査役
2023年6月当社監査役(現任)
計
670
(注)1.取締役千代田有子、村田恵一の2名は、社外取締役です。
2.監査役竹添英雄、大塚啓一、稲垣尚の3名は、社外監査役です。
3.2025年6月25日開催の定時株主総会終結の時から1年間です。
4.2024年6月27日開催の定時株主総会終結の時から4年間です。
5.当社では経営機能と業務執行機能を分離し、経営のスピード化とコーポレート・ガバナンスの強化を図るた
め、執行役員制度を導入しております。
執行役員は8名で、社長尾方馨、常務執行役員小林正登、同久保隆、執行役員
信、同傍士武、同工藤琢也、同浮田真理子で構成されております。
6.取締役千代田有子の戸籍上の氏名は、中嶌有子です。
43/122
丁旭威、同
菊地正
EDINET提出書類
株式会社TBK(E02201)
有価証券報告書
②社外役員の状況
当社の社外取締役は2名、社外監査役は3名であります。
社外取締役の千代田有子は、長年弁護士として実務に携わっており、国内のみならずアメリカでの企業法務に
おける豊富な経験や実績、幅広い知識と見識をもとに、独立した立場から取締役の職務の執行を監督することに
より、取締役会の機能強化及びコーポレート・ガバナンスに資するところは大きいと判断し、社外取締役として
選任しております。また、指名・報酬委員会委員長として当社の役員候補者の選定や役員報酬等の決定に対し、
客観的・中立的立場で関与いたします。
社外取締役の村田恵一は、事業会社において、企業経営等の豊富な経験や実績、開発分野における幅広い知識
と見識を有していることから、取締役会の機能強化及びコーポレート・ガバナンスに資するところは大きいと判
断し、社外取締役として選任しております。また、指名・報酬委員会委員として当社の役員候補者の選定や役員
報酬等の決定に対し、客観的・中立的立場で関与いたします。
なお、当社と社外取締役の間には人的関係、資本的関係又は取引関係その他の利害関係はありません。
社外監査役の竹添英雄は、生命保険会社における法務・コンプライアンス、内部監査等ガバナンス関連の豊富
な経験や人事労務における知見を有し、客観的かつ公正な立場で取締役の職務の執行を監督できると判断し、社
外監査役として選任しております。
社外監査役の大塚啓一は、公認会計士として、財務・会計に関する専門的かつ高い知見、会計監査業務を通じ
た幅広い経験を有していることから、客観的かつ公正な立場で取締役の職務の執行を監査できると判断し、社外
監査役として選任しております。
社外監査役の稲垣尚は、銀行及び事業会社において企業経営等の豊富な経験や実績、幅広い知識と見識を有し
ており、それらを当社の監査に反映していただくことを期待し、社外監査役として選任しております。
なお、当社と社外監査役の間には人的関係、資本的関係又は取引関係その他の利害関係はありません。
当社は、社外取締役又は社外監査役を選任するための独立性に関する基準又は方針として明確に定めたものは
ありませんが、選任にあたっては証券取引所の規則等に定める独立性に関する諸規定を参考にし、当社経営陣か
ら独立した立場で、経営の監視機能を遂行するための客観的・専門的視点を持つ者から識見と人格に留意して選
任しており、その選任状況は適切であると判断しております。
なお、社外取締役の当社株式の保有状況につきましては、「①役員一覧」において記載のとおりであります。
③社外取締役又は社外監査役による監督又は監査と内部監査、監査役監査及び会計監査との相互連携並びに内部統
制部門との関係
当社は、取締役会に先立って、社外取締役又は社外監査役に必要な資料、情報を提供しており、また、社外取
締役及び社外監査役による社外役員連絡会を適宜開催し、相互の情報共有に努めるとともに、社外取締役又は社
外監査役と業務監査室及び会計監査人との連携の強化に資するよう努めております。
44/122
EDINET提出書類
株式会社TBK(E02201)
有価証券報告書
(3)【監査の状況】
①監査役監査の状況
監査役会は常勤監査役1名、非常勤監査役2名で構成されており、3名とも社外監査役であります。監査役大
塚啓一は、1982年8月に公認会計士の登録を行い、長年、監査法人で監査実務に携わるとともに代表社員を務
め、財務及び会計に関する専門的な知見を有しております。また、監査役稲垣尚は、金融機関出身者であり、企
業経営等の経験があるとともに、幅広い知識と見識を有しております。
当事業年度において、監査役会を原則月1回開催しており、個々の監査役の出席状況については次のとおりで
あります。
区
分
氏
名
開催回数
出席回数
常勤監査役(社外)
竹添
英雄
15回
15回
監
査
役(社外)
大塚
啓一
15回
14回
監
査
役(社外)
稲垣
尚
15回
15回
・監査役会における具体的な検討内容
・内部通報への対応内容
・内部監査結果に対する改善提言
・収益見込みの精度向上提言
・監査法人の監査報酬の妥当性について
・中期経営計画の社内への周知・新党状況
常勤監査役の活動として、取締役会・執行役員会等の重要な会議へ出席し、適宜必要な意見を述べるほか、取
締役等から業務の執行状況の聴取、重要書類の閲覧等、当社及び主要な子会社における業務及び財務状況の調査
などを通して監査を行っております。
非常勤監査役は監査役会への出席等を通じて常勤監査役との情報共有に努め、それぞれの専門的知見に基づ
き、取締役会等重要な会議に出席して独立役員の立場から意見を述べることにより経営監視機能の充実を担って
います。
また、社外取締役と監査役の情報共有や意見交換の場として「社外役員連絡会」を設け、原則として隔月開催
しており、内部監査部門からの報告・説明の聴取を実施しております。さらに、例年4月、5月は監査役会が当
社グループ及び監査法人から決算等に係る資料の提出を受け、報告・説明を聴取しており、これらの内容も情報
共有しております。
上記により、社外取締役と監査役・監査役会との連携強化を図るとともに、監査法人や内部監査部門との連携
も図っております。
②内部監査の状況
当社の内部監査は業務監査室(7名)が中心となって、各部及び内外子会社の業務の適法性、有効性及び効率
について、品質・環境対策も含めて監査しております。適法性の点については、上場企業として企業の社会的責
任を果たすべく、取適法、独占禁止法などについても配慮しております。
また、業務監査室、監査役・監査役会及び会計監査人は、相互に緊密な連携を保っております。業務監査室長
が常時、監査役会・社外役員連絡会に出席し、監査の状況等を報告し、監査役・社外取締役との情報共有に努め
ております。さらに、常勤監査役と毎月定期的に情報交換を行っております。
なお、内部監査については、業務監査室が年間スケジュールを策定のうえ実施しており、その結果について
は、取締役会及び監査役会に報告しております。
45/122
EDINET提出書類
株式会社TBK(E02201)
有価証券報告書
③会計監査の状況
・監査法人の名称
有限責任 あずさ監査法人
・継続監査期間
1988年以降
・業務を執行した公認会計士
指定有限責任社員業務執行社員:永井勝、宇田川顕悟
・会計監査業務に係る補助者
公認会計士4名、その他30名
・監査役会による監査法人の評価及び選定方針と理由
監査役会は、日本監査役協会による、「会計監査人の評価及び選定基準策定に関する監査役等の実務指
針」(2023年12月21日改正)に基づき、会計監査人の評価基準及び選定基準を定め、毎年評価を行っており
ます。また、監査役会が有限責任 あずさ監査法人を会計監査人として選定した理由は、監査品質、独立
性、総合的能力、監査実査の有効性及び効率性等の要素を総合的に勘案した結果、有限責任 あずさ監査法
人の監査に期待できると判断したため、当社の監査法人に選定いたしました。
・会計監査人の解任又は不再任の決定の方針
監査役会は、会計監査人の職務の執行に支障がある場合等、その必要があると判断した場合は、株主総会
に提出する会計監査人の解任又は不再任に関する議案の内容を決定いたします。
また、会計監査人が会社法第340条第1項各号に定める項目に該当すると認められる場合は、監査役全員
の同意に基づき、会計監査人を解任いたします。この場合、監査役会が選定した監査役は、解任後最初に招
集される株主総会において、会計監査人を解任した旨及びその理由を報告いたします。
④監査報酬の内容等
a.監査公認会計士等に対する報酬の内容
前連結会計年度
区分
当連結会計年度
監査証明業務に基づく
報酬(百万円)
非監査業務に基づく報
酬(百万円)
監査証明業務に基づく
報酬(百万円)
非監査業務に基づく報
酬(百万円)
提出会社
82
−
77
−
連結子会社
−
−
−
−
82
−
77
−
計
b.監査公認会計士等と同一のネットワーク(KPMG)に対する報酬(a.を除く)
前連結会計年度
区分
当連結会計年度
監査証明業務に基づく
報酬(百万円)
非監査業務に基づく報
酬(百万円)
監査証明業務に基づく
報酬(百万円)
非監査業務に基づく報
酬(百万円)
提出会社
−
−
−
−
連結子会社
32
17
24
2
32
17
24
2
計
c.その他の重要な監査証明業務に基づく報酬の内容
(前連結会計年度)
該当事項はありません。
(当連結会計年度)
該当事項はありません。
46/122
EDINET提出書類
株式会社TBK(E02201)
有価証券報告書
d.監査公認会計士等の非監査業務の内容
(前連結会計年度)
連結子会社における非監査業務の内容は、税務申告に関するアドバイザリー業務等であり、当社の監査公
認会計士等と同一のネットワークに属している会計事務所に対して支払っております。
(当連結会計年度)
連結子会社における非監査業務の内容は、税務申告に関するアドバイザリー業務等であり、当社の監査公
認会計士等と同一のネットワークに属している会計事務所に対して支払っております。
e.監査報酬の決定方針
当社の監査報酬の決定方針といたしましては、当社の事業規模の観点から合理的監査日数を勘案し、監査公
認会計士等(金融商品取引法監査人)に対する監査報酬額を社内稟議を経て決定しております。
f.監査役会が会計監査人の報酬等に同意した理由
監査役会は、公益社団法人日本監査役協会が公表している「会計監査人との連携に関する実務指針」(2021
年7月30日最終改正)等を参考に、取締役、社内関係部署及び会計監査人から必要な資料を入手しかつ報告を
受け、会計監査人の監査計画の内容や職務執行状況、報酬見積りの算出根拠等を検討した結果、会計監査人の
報酬等の額は相当であると判断いたしております。
47/122
EDINET提出書類
株式会社TBK(E02201)
有価証券報告書
(4)【役員の報酬等】
①役員の報酬等の額又はその算定方法の決定に関する方針に係る事項
当社は、2021年2月24日開催の取締役会において、取締役の個人別の報酬等の内容にかかる決定方針を決議し
ております。当該取締役会の決議に際しては、あらかじめ決議する内容について指名・報酬委員会(委員長及び
委員の半数以上を独立社外取締役で構成)へ諮問し、答申を受けております。
また、取締役会は、当事業年度に係る取締役の個人別の報酬等について、報酬等の内容の決定方法及び決定さ
れた報酬等の内容が取締役会で決議された決定方針と整合していることや、指名・報酬委員会からの答申が尊重
されていることを確認しており、当該決定方針に沿うものであると判断しております。
[取締役の個人別の報酬等の内容にかかる決定方針]
1.基本方針
当社の取締役の報酬は、企業価値の持続的な向上を図るインセンティブとして十分に機能するよう株主利益
と連動した報酬体系とし、個々の取締役の報酬の決定に際しては各職責を踏まえた適正な水準とすることを基
本方針とする。具体的には、業務執行取締役の報酬は、固定報酬としての「基本報酬」及び「株式報酬」、変
動報酬としての「業績連動賞与」及び「業績連動型株式報酬」により構成し、監督機能を担う社外取締役につ
いては、固定報酬としての「基本報酬」及び「株式報酬」を支払うこととする。
2.基本報酬(金銭報酬)の個人別の報酬等の額の決定に関する方針(報酬等を与える時期または条件の決定
に関する方針を含む。)
基本報酬は、月例の固定報酬とし、役位、職責、在任年数に応じて他社水準、当社の業績、従業員給与の水
準をも考慮しながら、総合的に勘案して決定するものとする。
3.業績連動報酬等並びに非金銭報酬等の内容及び額または数の算定方法の決定に関する方針(報酬等を与え
る時期または条件の決定に関する方針を含む。)
(1)業績連動報酬等は、業績連動賞与と業績連動型株式報酬により構成される。
a.業績連動賞与は、評価期間の業績及び役位、取締役(社外取締役を除く)の成果等を総合的に判断し、各
事業年度の連結営業利益の目標値に対する達成度合いに応じて算出された額を業績連動賞与として、一定
の時期に支給する。目標となる業績指標とその値は、中期経営計画と整合するよう計画策定時に設定し、
適宜、環境の変化に応じて指名・報酬委員会の答申を踏まえた見直しを行うものとする。
b.業績連動型株式報酬は後記(2)bの通りとする。
(2)非金銭報酬等は、株式報酬及び業績連動型株式報酬により構成し、職務執行の対価としてポイントを付与
する。当該ポイントは、退任時までの累積ポイントを1ポイント=1株に換算し退任時に給付する。
a.株式報酬は、取締役が株価上昇によるメリットのみならず、株価下落リスクまでも株主の皆様と共有する
ことで、中長期的な業績の向上と企業価値の増大に貢献する意識を高めることを目的とする。また、社外
取締役に関しては、当社の経営の健全性と社会的信頼の確保を通じた当社に対する社会的評価の向上を動
機付けることを目的とする。株式報酬の額の決定方法は、取締役会の決議により決定した役員株式給付規
則に基づき、事業年度ごとにポイントを付与する。
b.業績連動型株式報酬は、短計業績評価係数及び中計業績評価係数の2つの観点から評価を行う制度とし、
短計、中計それぞれの目標値に対する達成率に役位ごとに定めた短計ウエイト及び中計ウエイトを乗じて
算出し、事業年度ごとにポイントを付与する。なお、業績評価の指標は、連結営業利益率の目標値に対す
る達成率を採用する。短計ウエイト及び中計ウエイトや目標となる業績指標とその係数等は、役員株式給
付規則に定め、適宜、環境の変化に応じて指名・報酬委員会の答申を踏まえた見直しを行うものとする。
c.業績連動型株式報酬の算定方法の内容は以下の通りとする。
付与ポイント数 = 役位ポイント × 短計ウエイト × 短計業績評価係数
+ 役位ポイント × 中計ウエイト × 中計業績評価係数
4.金銭報酬の額、業績連動報酬等の額または非金銭報酬等の額の取締役の個人別の報酬等の額に対する割合
の決定に関する方針
業務執行取締役の種類別の報酬割合については、当社と同程度の事業規模や関連する業種・業態に属する企
業をベンチマークとする報酬水準を踏まえ、上位の役位ほど業績連動報酬のウエイトが高まる構成とし、取締
役会の任意の諮問機関である指名・報酬委員会において検討を行う。取締役会(5の委任を受けた代表取締役
社長)は指名・報酬委員会の答申内容を尊重し、当該答申で示された種類別の報酬割合の範囲内で取締役の個
人別の報酬等の内容を決定することとする。
48/122
EDINET提出書類
株式会社TBK(E02201)
有価証券報告書
なお、報酬等の種類ごとの比率の目安は、おおよそ次の通りとする。
基本報酬
株式報酬
業績連動賞与
業績連動型
株式報酬
代表取締役
5
1
2
2
取
役
6
1
2
1
社外取締役
9
1
−
−
役
位
締
(目標とする営業利益率を100%達成の場合)
5.取締役の個人別の報酬等の内容についての決定に関する事項
個人別の報酬額については、指名・報酬委員会にて審議したうえで、取締役会決議に基づき代表取締役社長
がその具体的内容について委任を受けるものとし、その権限の内容は、各取締役の基本報酬の額及び各取締役
の担当事業の業績を踏まえた業績連動賞与の評価配分とする。取締役会は、当該権限が代表取締役社長によっ
て適切に行使されるよう、指名・報酬委員会に原案を諮問し答申を得るものとし、上記の委任を受けた代表取
締役社長は、当該答申に基づき指名・報酬委員会の意見を尊重して決定しなければならないこととする。
業績連動賞与にかかる業績指標は、各事業年度の連結営業利益の目標値に対する達成度合いであり、その目標
値は1,300百万円で、その実績は1,496百万円であります。業績連動型株式報酬にかかる業績指標は、連結営業利
益率の目標値に対する達成率であり、その目標値は短計では2.5%、当初の中計では3〜5%であり、その実績
は2.7%であります。当該指標を選択した理由は、連結営業利益は主たる業務から算出される指標であり、その
目標値に対してどの程度達成できたか、明確に計ることができると判断したためであります。
取締役の金銭報酬限度額は、2013年6月20日開催の第77回定時株主総会において、年額350百万円以内と決議
いただいております。当該株主総会終結時点の取締役の員数は、6名であります。
上記とは別枠で、2021年6月29日開催の第85回定時株主総会において、取締役(社外取締役を含みます。)及
び執行役員の株式報酬及び業績連動型株式報酬の額を対象期間ごとに、720百万円(うち取締役分として420百万
円(うち社外取締役分10百万円))以内、また、給付される当社株式数の上限として1事業年度あたり339,100
ポイント(うち取締役分として197,800ポイント(うち社外取締役分4,700ポイント))と決議いただいておりま
す。当該株主総会終結時点の取締役の員数は、6名(うち社外取締役は2名)であります。
取締役会は、代表取締役社長尾方馨に対し、各取締役の基本報酬の額及び社外取締役を除く各取締役の担当
部門の業績等を踏まえた業績連動賞与の評価配分の決定を委任しております。委任した理由は、当社グループを
取り巻く環境や経営状況等を当社グループにおいて最も熟知し、総合的に各取締役の報酬額を決定できると判断
したためであります。なお、委任された内容の決定に当たっては、事前に独立社外取締役を主要な構成員とす
る、指名・報酬委員会がその妥当性等について確認しております。
指名・報酬委員会は、当社が提示した取締役の個人別の支給額案に対し、個人別に機能発揮状況を勘案した上
で報酬額の算定方法や妥当性を審議し、取締役会へ答申しております。2023年6月に2023年度の取締役の基本報
酬について審議し、2024年5月に2023年度の取締役の基本報酬、業績連動賞与及び業績連動型株式報酬の妥当性
を検証して同日開催された取締役会に報告しました。
監査役の報酬等は、株主総会で決議された報酬総額の範囲内において、常勤及び非常勤の業務分担を考慮し
て、監査役会の協議により決定しております。監査役の金銭報酬限度額は、2006年6月23日開催の第70回定時株
主総会において、年額40百万円以内と決議いただいております。当該株主総会終結時点の監査役の員数は、3名
(うち、社外監査役は2名)であります。
②役員区分ごとの報酬等の総額、報酬等の種類別の総額及び対象となる役員の員数
報酬等の種類別の総額(百万円)
対象となる
役員の員数
業績連動型株 (人)
業績連動賞与
式報酬
報酬等の総額
(百万円)
役員区分
基本報酬
株式報酬
取締役
(社外取締役を除
く。)
103
96
8
4
社外役員
35
34
0
5
(注)「報酬等の種類別の総額」項目内の、株式報酬及び業績連動型株式報酬は、非金銭報酬であります。そ
の詳細につきましては、「第4 提出会社の状況 1 株式等の状況 (8)役員・従業員株式所有制度
の内容
①本制度の概要」に記載しております。
49/122
EDINET提出書類
株式会社TBK(E02201)
有価証券報告書
(5)【株式の保有状況】
①投資株式の区分の基準及び考え方
当社は、投資株式について、株式の価値の変動又は株式に係る配当によって利益を受けることを目的として保有
する株式を純投資目的である投資株式、それ以外の株式を純投資目的以外の目的である投資株式(政策保有株式)
に区分しております。
②保有目的が純投資目的以外の目的である投資株式
a.保有方針及び保有の合理性を検証する方法並びに個別銘柄の保有の適否に関する取締役会等における検証の
内容
当社は、企業価値を向上させるための中長期的な視点に立ち、取引等の維持及び強化、自動車関連事業にお
ける事実上の関係強化等を目的として、政策的に必要な株式を保有します。
個別の政策保有株式については、取締役会において毎年定期的に保有目的、保有を継続した場合の便益、保
有しない場合の取引の安定性等に係るリスク等を検証し、保有の合理性が認められない場合には、縮減等の見
直しを行っております。
b.銘柄数及び貸借対照表計上額
銘柄数
(銘柄)
貸借対照表計上額の
合計額(百万円)
非上場株式
1
0
非上場株式以外の株式
5
3,720
(当事業年度において株式数が増加した銘柄)
銘柄数
(銘柄)
株式数の増加に係る取得
価額の合計額(百万円)
非上場株式
−
−
非上場株式以外の株式
1
10
(当事業年度において株式数が減少した銘柄)
銘柄数
(銘柄)
株式数の減少に係る売却
価額の合計額(百万円)
非上場株式
−
−
非上場株式以外の株式
−
−
50/122
株式数の増加の理由
−
取引先持株会を通じた株式の取得
EDINET提出書類
株式会社TBK(E02201)
有価証券報告書
c.特定投資株式及びみなし保有株式の銘柄ごとの株式数、貸借対照表計上額等に関する情報
特定投資株式
銘柄
当事業年度
前事業年度
株式数(株)
株式数(株)
保有目的、業務提携等の概要、
定量的な保有効果
及び株式数が増加した理由
当社の株式の
保有の有無
(保有目的)当社グループ最大の販売
先であり、ブレーキ・ポンプ等の製品
供給を行っており、営業取引の円滑化
を図るために保有
(定量的な保有効果)(注)1
(株式数が増加した理由)取引先持株
会を通じた株式の取得
有
(保有目的)当社グループの主力製品
であるブレーキ・ポンプ製造に必要な
ギヤ部品の熱処理や表面処理を行って
おり、営業取引等の円滑化を図るため
に保有
(定量的な保有効果)(注)1
有
(保有目的)当社グループの主力製品
であるブレーキ製造に必要なプレス加
工部品を仕入れており、営業取引の円
滑化を図るために保有
(定量的な保有効果)(注)1
有
(保有目的)当社グループの主力製品
であるブレーキ・ポンプ製造に必要な
シールの仕入を行っており、営業取引
の円滑化を図るために保有
(定量的な保有効果)(注)1
有
(保有目的)当社グループの販売先で
あり、ブレーキ・ポンプ等の製品供給
を行っており、営業取引の円滑化を図
るために保有
(定量的な保有効果)(注)1
無
貸借対照表計上額貸借対照表計上額
(百万円)
(百万円)
1,458,217
1,453,496
いすゞ自動車株式会社
3,238
2,930
176,000
176,000
日本パーカライジング
株式会社
254
208
118,300
118,300
株式会社ヨロズ
107
119
38,500
38,500
NOK株式会社
三菱自動車工業株式会
社
107
84
40,000
40,000
12
16
(注)1.当社は、特定投資株式における定量的な保有効果の記載が困難であるため、保有の合理性を検証した方法に
ついて記載いたします。当社が保有する政策保有株式については取締役会にて政策保有の意義を検証してお
り、現状保有する政策保有株式はいずれも保有方針に沿った目的で保有していることを1年に1回確認して
おります。
③保有目的が純投資目的である投資株式
該当事項はありません。
④当事業年度に投資株式の保有目的を純投資目的から純投資目的以外の目的に変更したもの
該当事項はありません。
⑤当事業年度の前4事業年度及び当事業年度に投資株式の保有目的を純投資目的以外の目的から純投資目的に変更
したもの
該当事項はありません。
51/122
EDINET提出書類
株式会社TBK(E02201)
有価証券報告書
5【従業員の状況等】
(1)【人材戦略に関する基本方針等】
外部環境の変化に対応しながら企業価値を高めていくには、多様な価値観を持った従業員が主体性や創造性
を持ち、経営Visionを実現させることが重要であると考え、それぞれのキャリア階層で求められるスキルを習
得できる教育体系を整備し、個々の能力を発揮できる体制を目指します。当社が目指す人材像を「主体性・創
造性・責任感・実行力を持った人材」と定め、これを実現するため、人材戦略を進めていきます。
また、当社では全社員が共有する価値観として「TBK WAY」という行動指針を策定いたしました。この価値
観をもとに、変化に挑戦しつづける意思を体現していきます。
さらに、企業価値の向上と「TBK WAY」の定着を支えるため、人材戦略と連動した給与制度を構築していま
す。給与等の決定にあたっては、職務・役割、能力、成果および市場水準を総合的に勘案することを基本方針
とし、公平性および競争力の確保を図っています。この制度により、従業員の挑戦と成長を促進するととも
に、人材の確保・定着を推進します。
(2)【従業員の状況】
①連結会社の状況
2026年3月31日現在
セグメントの名称
従業員数(名)
ブレーキ
エンジンコンポーネント他
ブレーキ
エンジンコンポーネント他
ブレーキ
エンジンコンポーネント他
日本
アジア
中国
全社(共通)
合計
130
225
−
399
236
2
(84)
(171)
(1)
(386)
(17)
(−)
901
(192)
1,893
(851)
(注)1.従業員数は就業人員であり、臨時雇用者数は、年間の平均人員を( )外数で記載しております。
2.全社(共通)として記載されている従業員数は、管理部門に所属しているものであります。
3.連結子会社であったTBK America,Inc.を除外したことに伴い、北米を記載しておりません。
②提出会社の状況
2026年3月31日現在
従業員数(名)
平均年齢(歳)
713 (289)
42.3
平均勤続年数(年) 平均年間給与(円)
15.7
セグメントの名称
日本
平均年間給与の
対前事業年度増減率(%)
5,845,205
5.5
従業員数(名)
ブレーキ
エンジンコンポーネント他
96
183
(51)
(161)
全社(共通)
434
(77)
713
(289)
合計
(注)1.従業員数は就業人員であり、臨時雇用者数は、年間の平均人員を( )外数で記載しております。
2.平均年間給与は、賞与及び基準外賃金を含んでおります。
3.全社(共通)として記載されている従業員数は、管理部門に所属しているものであります。
③労働組合の状況
当社はTBK労働組合が組織されており、2026年3月31日現在における組合員数は、609名であります。TBK
労働組合は上部団体として全日本自動車産業労働組合総連合会の下部組織日本自動車部品産業労働組合連合会に加
盟しております。労使間は相互信頼を基調として、生産性の向上にも積極的な労働組合であります。
52/122
EDINET提出書類
株式会社TBK(E02201)
有価証券報告書
④管理的地位にある労働者に占める女性労働者の割合、男性労働者の育児休業取得率及び労働者の男女の賃金の額の
差異
(ア)提出会社
当事業年度
管理的地位にある労働者
男性労働者の育児休業取
に占める女性労働者の割
得率(%)
合(%)
(注)2.
(注)1.
6.3
労働者の男女の賃金の額の差異(%)
(注)1.
全労働者
77.8
正規雇用労働者
75.1
79.7
パート・有期労働者
83.6
(注)1.「女性の職業生活における活躍の推進に関する法律」(平成27年法律第64号)の規定に基づき算出したもの
であります。
2.「育児休業、介護休業等育児又は家族介護を行う労働者の福祉に関する法律」(平成3年法律第76号)の規
定に基づき、「育児休業、介護休業等育児又は家族介護を行う労働者の福祉に関する法律施行規則」(平成
3年労働省令第25号)第71条の6第1号における育児休業等の取得割合を算出したものであります。
3.男女の賃金の額の差異については、賃金制度・体系において性別による差異はなく、主に男女間の管理職比
率及び雇用形態によるものです。
(イ)連結子会社
連結子会社は、「女性の職業生活における活躍の推進に関する法律」(平成27年法律第64号)及び「育児休
業、介護休業等育児又は家族介護を行う労働者の福祉に関する法律」(平成3年法律第76号)の規定による公表
義務の対象ではないため、記載を省略しております。
53/122
EDINET提出書類
株式会社TBK(E02201)
有価証券報告書
第5【経理の状況】
1
連結財務諸表及び財務諸表の作成方法について
(1)当社の連結財務諸表は、「連結財務諸表の用語、様式及び作成方法に関する規則」(昭和51年大蔵省令第28号)
に基づいて作成しております。
(2)当社の財務諸表は、「財務諸表等の用語、様式及び作成方法に関する規則」(昭和38年大蔵省令第59号。以下
「財務諸表等規則」という。)に基づいて作成しております。
また、当社は、特例財務諸表提出会社に該当し、財務諸表等規則第127条の規定により財務諸表を作成しており
ます。
2
監査証明について
当社は、金融商品取引法第193条の2第1項の規定に基づき、連結会計年度(2025年4月1日から2026年3月31日
まで)の連結財務諸表及び事業年度(2025年4月1日から2026年3月31日まで)の財務諸表について、有限責任 あ
ずさ監査法人による監査を受けております。
3
連結財務諸表等の適正性を確保するための特段の取組について
当社は、連結財務諸表等の適正性を確保するための特段の取組を行っております。具体的には、会計基準等の内容
を適切に把握し、又は会計基準等の変更等について的確に対応することができる体制を整備するため、公益財団法人
財務会計基準機構へ加入し、セミナーへ参加しております。
54/122
EDINET提出書類
株式会社TBK(E02201)
有価証券報告書
1【連結財務諸表等】
(1)【連結財務諸表】
①【連結貸借対照表】
(単位:百万円)
前連結会計年度
(2025年3月31日)
資産の部
流動資産
現金及び預金
受取手形及び売掛金
電子記録債権
棚卸資産
未収還付法人税等
その他
貸倒引当金
流動資産合計
固定資産
有形固定資産
建物及び構築物(純額)
機械装置及び運搬具(純額)
土地
建設仮勘定
その他(純額)
有形固定資産合計
無形固定資産
ソフトウエア
その他
無形固定資産合計
投資その他の資産
投資有価証券
関係会社出資金
関係会社長期貸付金
繰延税金資産
退職給付に係る資産
その他
貸倒引当金
投資その他の資産合計
固定資産合計
繰延資産
株式交付費
繰延資産合計
資産合計
55/122
当連結会計年度
(2026年3月31日)
4,139
13,475
626
※7 7,514
23
623
△0
26,402
7,359
13,199
578
※7 7,335
32
770
△0
29,276
※3,※5 5,272
※3,※5 4,778
※3 9,778
※3 9,330
※3,※5,※6 3,538
※3,※5,※6 3,694
1,654
※3 1,270
※3 1,165
※2 21,515
※2 21,539
※3 186
※3 245
75
261
77
323
※4 3,364
※4 3,726
※4 799
※4 431
88
234
338
136
△15
4,946
26,723
85
315
682
120
△10
5,350
27,212
−
−
53,125
23
23
56,511
2,569
EDINET提出書類
株式会社TBK(E02201)
有価証券報告書
(単位:百万円)
前連結会計年度
(2025年3月31日)
負債の部
流動負債
支払手形及び買掛金
電子記録債務
短期借入金
リース債務
未払法人税等
賞与引当金
役員賞与引当金
製品保証引当金
関係会社出資金売却損失引当金
役員株式給付引当金
設備関係支払手形
その他
流動負債合計
固定負債
長期借入金
リース債務
繰延税金負債
退職給付に係る負債
その他
固定負債合計
負債合計
純資産の部
株主資本
資本金
資本剰余金
利益剰余金
自己株式
株主資本合計
その他の包括利益累計額
その他有価証券評価差額金
土地再評価差額金
為替換算調整勘定
退職給付に係る調整累計額
その他の包括利益累計額合計
非支配株主持分
純資産合計
負債純資産合計
56/122
当連結会計年度
(2026年3月31日)
6,308
2,213
6,535
36
144
711
−
30
36
68
156
1,533
17,774
6,159
1,349
6,711
31
282
828
7
43
−
99
194
2,269
17,978
1,336
46
1,630
2,909
316
6,238
24,013
868
41
2,317
2,814
106
6,148
24,126
4,617
264
17,266
△409
21,738
5,186
833
16,907
△407
22,519
1,460
20
4,543
487
6,510
862
29,112
53,125
1,684
20
6,187
947
8,839
1,025
32,384
56,511
EDINET提出書類
株式会社TBK(E02201)
有価証券報告書
②【連結損益計算書及び連結包括利益計算書】
【連結損益計算書】
(単位:百万円)
前連結会計年度
(自 2024年4月1日
至 2025年3月31日)
売上高
売上原価
売上総利益
販売費及び一般管理費
営業利益
営業外収益
受取利息
受取配当金
助成金収入
為替差益
持分法による投資利益
その他
営業外収益合計
営業外費用
支払利息
為替差損
持分法による投資損失
その他
営業外費用合計
経常利益
特別利益
固定資産売却益
特別利益合計
特別損失
固定資産売却損
固定資産廃棄損
減損損失
関係会社出資金売却損
関係会社出資金売却損失引当金繰入
事業再編損
特別損失合計
税金等調整前当期純利益又は
税金等調整前当期純損失(△)
法人税、住民税及び事業税
法人税等調整額
法人税等合計
当期純利益又は当期純損失(△)
非支配株主に帰属する当期純利益
親会社株主に帰属する当期純損失(△)
57/122
当連結会計年度
(自 2025年4月1日
至 2026年3月31日)
54,415
54,756
※1,※3 48,625
※1,※3 47,931
5,790
6,825
※2,※3 4,849
※2,※3 5,329
941
1,496
26
155
45
−
−
109
336
15
151
11
72
16
154
421
263
186
481
37
968
309
120
−
−
66
187
1,730
※4 57
※4 236
57
236
※5 0
※5 0
※6 11
※6 12
※7 459
※7 712
−
※9 36
※10 775
※8 19
※10 297
1,283
1,042
△917
925
317
△135
182
△1,099
104
△1,204
422
502
924
0
131
△131
−
EDINET提出書類
株式会社TBK(E02201)
有価証券報告書
【連結包括利益計算書】
(単位:百万円)
前連結会計年度
(自 2024年4月1日
至 2025年3月31日)
当期純利益又は当期純損失(△)
その他の包括利益
その他有価証券評価差額金
為替換算調整勘定
退職給付に係る調整額
持分法適用会社に対する持分相当額
その他の包括利益合計
包括利益
(内訳)
親会社株主に係る包括利益
非支配株主に係る包括利益
58/122
当連結会計年度
(自 2025年4月1日
至 2026年3月31日)
△1,099
0
△41
755
319
80
※ 1,115
224
1,684
472
14
※ 2,395
15
2,395
△112
128
2,197
198
EDINET提出書類
株式会社TBK(E02201)
有価証券報告書
③【連結株主資本等変動計算書】
前連結会計年度(自 2024年4月1日
至
2025年3月31日)
(単位:百万円)
株主資本
資本金
当期首残高
資本剰余金
4,617
利益剰余金
264
自己株式
18,726
株主資本合計
△419
23,188
当期変動額
剰余金の配当
親会社株主に帰属する当
期純損失
△256
△256
△1,204
△1,204
自己株式の取得
△0
△0
自己株式の処分
10
10
株主資本以外の項目の当
期変動額(純額)
当期変動額合計
当期末残高
−
−
△1,460
10
△1,450
4,617
264
17,266
△409
21,738
その他の包括利益累計額
そ の 他
有価証券
評価差額金
当期首残高
1,501
土地再評価
差額金
為替換算
調整勘定
20
3,728
退職給付に係る
調整累計額
その他の
包括利益
累計額合計
非支配株主持分
純資産合計
169
5,419
749
29,358
当期変動額
剰余金の配当
△256
親会社株主に帰属する当
期純損失
△1,204
自己株式の取得
△0
自己株式の処分
10
株主資本以外の項目の当
期変動額(純額)
△41
−
814
317
1,091
113
1,204
当期変動額合計
△41
−
814
317
1,091
113
△245
当期末残高
1,460
20
4,543
487
6,510
862
29,112
59/122
EDINET提出書類
株式会社TBK(E02201)
有価証券報告書
当連結会計年度(自
2025年4月1日
至
2026年3月31日)
(単位:百万円)
株主資本
資本金
当期首残高
資本剰余金
利益剰余金
4,617
264
568
568
自己株式
17,266
株主資本合計
△409
21,738
当期変動額
新株の発行
1,137
剰余金の配当
△227
△227
親会社株主に帰属する当
期純損失
△131
△131
自己株式の取得
△0
△0
自己株式の処分
3
3
株主資本以外の項目の当
期変動額(純額)
当期変動額合計
当期末残高
568
568
△358
2
781
5,186
833
16,907
△407
22,519
その他の包括利益累計額
そ の 他
有価証券
評価差額金
当期首残高
1,460
土地再評価
差額金
為替換算
調整勘定
20
4,543
退職給付に係る
調整累計額
その他の
包括利益
累計額合計
非支配株主持分
純資産合計
487
6,510
862
29,112
当期変動額
新株の発行
1,137
剰余金の配当
△227
親会社株主に帰属する当
期純損失
△131
自己株式の取得
△0
自己株式の処分
3
株主資本以外の項目の当
期変動額(純額)
当期変動額合計
当期末残高
224
−
1,643
460
2,328
162
2,491
224
−
1,643
460
2,328
162
3,272
1,684
20
6,187
947
8,839
1,025
32,384
60/122
EDINET提出書類
株式会社TBK(E02201)
有価証券報告書
④【連結キャッシュ・フロー計算書】
(単位:百万円)
当連結会計年度
(自 2025年4月1日
至 2026年3月31日)
前連結会計年度
(自 2024年4月1日
至 2025年3月31日)
営業活動によるキャッシュ・フロー
税金等調整前当期純利益又は
税金等調整前当期純損失(△)
減価償却費
減損損失
事業再編損
賞与引当金の増減額(△は減少)
役員賞与引当金の増減額(△は減少)
製品保証引当金の増減額(△は減少)
関係会社出資金売却損失引当金の増減額
(△は減少)
役員株式給付引当金の増減額(△は減少)
退職給付に係る負債の増減額(△は減少)
退職給付に係る資産の増減額(△は増加)
受取利息及び受取配当金
支払利息
持分法による投資損益(△は益)
関係会社出資金売却損
固定資産売却損益(△は益)
固定資産廃棄損
助成金収入
売上債権の増減額(△は増加)
棚卸資産の増減額(△は増加)
仕入債務の増減額(△は減少)
未収消費税等の増減額(△は増加)
未払消費税等の増減額(△は減少)
未払金の増減額(△は減少)
その他
小計
利息及び配当金の受取額
利息の支払額
法人税等の支払額又は還付額(△は支払)
助成金の受取額
営業活動によるキャッシュ・フロー
投資活動によるキャッシュ・フロー
有形固定資産の取得による支出
有形固定資産の売却による収入
無形固定資産の取得による支出
投資有価証券の取得による支出
関係会社出資金の売却による収入
関係会社貸付金の回収による収入
その他
投資活動によるキャッシュ・フロー
財務活動によるキャッシュ・フロー
短期借入れによる収入
短期借入金の返済による支出
長期借入れによる収入
長期借入金の返済による支出
株式の発行による収入
自己株式の取得による支出
非支配株主への配当金の支払額
配当金の支払額
その他
財務活動によるキャッシュ・フロー
現金及び現金同等物に係る換算差額
現金及び現金同等物の増減額(△は減少)
現金及び現金同等物の期首残高
現金及び現金同等物の期末残高
61/122
△917
925
3,168
459
775
△6
−
△50
2,921
712
297
95
7
13
36
△36
16
283
△177
△181
263
481
−
△57
11
△45
1,153
846
△1,754
△0
10
△74
9
4,253
181
△269
△316
45
3,894
33
281
△343
△167
120
△16
19
△236
12
△11
751
344
△1,218
△14
55
151
△434
4,266
167
△137
△305
11
4,001
△2,409
195
△99
△10
−
−
△0
△2,323
△2,650
827
△180
△10
344
8
12
△1,647
2,063
△3,054
550
△1,127
−
△0
△13
△254
△48
△1,885
184
△130
4,254
※ 4,123
3,355
△3,082
100
△737
1,111
△0
△14
△226
△12
492
373
3,220
4,123
※ 7,344
EDINET提出書類
株式会社TBK(E02201)
有価証券報告書
【注記事項】
(連結財務諸表作成のための基本となる重要な事項)
1.連結の範囲に関する事項
(1)連結子会社の数 11社
主要な連結子会社の名称
TBKK(Thailand)Co., Ltd.
TBK India Private Ltd.
(2)主要な非連結子会社の名称等
主要な非連結子会社
主要な非連結子会社はありません。
2.持分法の適用に関する事項
(1)持分法適用の関連会社数
1社
主要な会社名
Changchun FAWSN TBK Co., Ltd.
(2)持分法を適用していない非連結子会社及び関連会社は、当期純損益(持分に見合う額)及び利益剰余金(持分
に見合う額)等に及ぼす影響が軽微であり、かつ、全体としても重要性がないため持分法の適用範囲から除外し
ております。
(3)持分法適用会社であるChangchun FAWSN TBK Co., Ltd.の決算日は、12月31日であります。連結財務諸表の作
成にあたっては、同決算日現在の財務諸表を使用しております。
なお、1月1日から連結決算日3月31日までの期間に発生した重要な取引については、連結上必要な調整を
行っております。
3.連結の範囲又は持分法の適用の範囲の変更に関する事項
連結の範囲の変更
当社の連結子会社であるTBK America, Inc.が清算結了したことから、連結の範囲から除外しております。
4.連結子会社の事業年度等に関する事項
連結子会社のうちFull Win Developments Ltd. 他3社の決算日は、12月31日であります。連結財務諸表の作
成に当たっては、同決算日現在の財務諸表を使用しております。
なお、各決算日から連結決算日3月31日までの期間に発生した重要な取引については、連結上必要な調整を
行っております。
62/122
EDINET提出書類
株式会社TBK(E02201)
有価証券報告書
5.会計方針に関する事項
(1)重要な資産の評価基準及び評価方法
イ 有価証券
その他有価証券
市場価格のない株式等以外のもの
時価法(評価差額は全部純資産直入法により処理し、売却原価は移動平均法により算定)
を採用しております。
市場価格のない株式等
移動平均法による原価法を採用しております。
ロ
棚卸資産
先入先出法による原価法(貸借対照表価額は収益性の低下に基づく簿価切下げの方法により算定)を採用
しております。
(2)重要な減価償却資産の減価償却の方法
イ 有形固定資産(リース資産を除く)
ロ
定額法を採用しております。
主な耐用年数は次のとおりであります。
建物及び構築物
3〜47年
機械装置及び運搬具
2〜9年
その他
2〜20年
なお、取得価額が10万円以上20万円未満の資産については3年間で均等償却する方法を採用しております。
無形固定資産(リース資産を除く)
ハ
定額法を採用しております。
なお、自社利用のソフトウエアについては、社内における利用可能期間(5年)に基づいております。
リース資産
リース期間を耐用年数とし、残存価額を零とする定額法を採用しております。
(3)繰延資産の処理方法
株式交付費
原則として支出時に全額費用処理しております。ただし、繰延資産に計上した場合には、定額法により償却
しております。
(4)重要な引当金の計上基準
イ 貸倒引当金
当社及び国内連結子会社は、売上債権、貸付金等の貸倒損失に備えるため、一般債権については貸倒実績率
により、貸倒懸念債権等特定の債権については、個別に債権の回収可能性を勘案し、回収不能見込額を計上し
ております。また、在外連結子会社につきましては、必要額を計上しております。
ロ 賞与引当金
当社及び国内連結子会社は、従業員に対して支給する賞与の支出に充てるため、支給見込額の当連結会計年
度負担額を計上しております。また、一部在外連結子会社においても、支給見込額を計上しております。
ハ 役員賞与引当金
ニ
役員に対して支給する賞与の支出に充てるため、支給見込額の当連結会計年度負担額を計上しております。
製品保証引当金
製品の品質保証による将来の支出に備えるため、過去の実績に基づいて算出した見積額及び個別の案件を勘
案して算出した発生見込額を計上しております。
ホ 関係会社出資金売却損失引当金
関係会社出資金の売却に備えるため、損失見込額を計上しております。なお、当連結会計年度末において関
係会社出資金売却損失引当金の残高はありません。
ヘ 役員株式給付引当金
役員株式給付規則に基づく役員への当社株式の給付に備えるため、当連結会計年度における株式給付債務の
支給見込額に基づき計上しております。
63/122
EDINET提出書類
株式会社TBK(E02201)
有価証券報告書
(5)退職給付に係る会計処理の方法
① 退職給付見込額の期間帰属方法
退職給付債務の算定にあたり、退職給付見込額を当連結会計年度末までの期間に帰属させる方法について
は、給付算定式基準によっております。また、国内連結子会社の一部は、確定拠出型の制度として中小企業退
職金共済制度に加入しております。
② 数理計算上の差異及び過去勤務費用の費用処理方法
数理計算上の差異については、各連結会計年度の発生時における従業員の平均残存勤務期間以内の一定の年
数(10年)による定額法により按分した額をそれぞれ発生の翌連結会計年度から費用処理しております。
過去勤務費用については、その発生時における従業員の平均残存勤務期間以内の一定の年数(10年)による
定額法により費用処理しております。
③ 小規模企業等における簡便法の採用
一部の連結子会社は、退職給付に係る負債及び退職給付費用の計算に、退職給付に係る期末自己都合要支給
額を退職給付債務とする方法を用いた簡便法を適用しております。
(6)重要な収益及び費用の計上基準
当社及び連結子会社では、主に完成した製品を顧客に供給することを履行義務として認識しております。
国内販売においては、原則として製品の納入時点において支配が顧客に移転して履行義務が充足されると判
断していることから、当時点において収益を認識しておりますが、出荷時から顧客による検収時までの期間が
通常の期間である場合には、出荷時に収益を認識しております。輸出販売においては、主にインコタームズ等
で定められた貿易条件に基づきリスク負担が顧客に移転した時に収益と認識することとしております。取引の
対価は、履行義務を充足してから主として1年以内に受領しており、重大な金融要素は含んでおりません。
(7)重要な外貨建の資産又は負債の本邦通貨への換算の基準
外貨建金銭債権債務は、連結決算日の直物為替相場により円貨に換算し、換算差額は損益として処理してお
ります。なお、在外子会社等の資産及び負債は、連結決算日の直物為替相場により円貨に換算し、収益及び費
用は期中平均相場により円貨に換算し、換算差額は純資産の部における為替換算調整勘定及び非支配株主持分
に含めて計上しております。
(8)連結キャッシュ・フロー計算書における資金の範囲
手許現金、随時引き出し可能な預金及び容易に換金可能であり、かつ、価値の変動について僅少なリスクし
か負わない取得日から3ヶ月以内に償還期限の到来する短期投資からなっております。
64/122
EDINET提出書類
株式会社TBK(E02201)
有価証券報告書
(重要な会計上の見積り)
会計上の見積りは、連結財務諸表作成時に入手可能な情報に基づいて合理的な金額を算出しております。当
連結会計年度の連結財務諸表に計上した金額が会計上の見積りによるもののうち、翌連結会計年度の連結財務
諸表に重要な影響を及ぼすリスクがある項目は以下の通りです。
1.繰延税金資産の回収可能性
(1) 当連結会計年度の連結財務諸表に計上した金額
(単位:百万円)
前連結会計年度
当連結会計年度
繰延税金資産(純額)
234
315
繰延税金負債と相殺前の金額
589
370
5,144
4,012
評価性引当額
(2) 会計上の見積りの内容について連結財務諸表利用者の理解に資するその他の情報
①
当連結会計年度の連結財務諸表に計上した金額の算出方法
当社グループでは、税務上の繰越欠損金や企業会計上の資産・負債と税務上の資産・負債との差額であ
る一時差異について税効果会計を適用し、繰延税金資産及び繰延税金負債を計上しております。繰延税金
資産の回収可能性については、将来の合理的な見積可能期間における課税所得の見積額を限度として、当
該期間における一時差異等のスケジューリングの結果に基づき判断しております。
当社及び国内連結子会社は、グループ通算制度を適用しており、繰延税金資産は主に当社及び国内連結
子会社4社(以下「通算子会社」)の金額から構成されます。通算グループ会社における繰延税金資産の
回収可能性の判断基準については、下表(a)のとおり当期において重要な税務上の欠損金が生じているこ
とから、企業会計基準適用指針第26号「繰延税金資産の回収可能性に関する適用指針」に則り、事業計画
により見積もられた翌期の課税所得の見込額に基づき、繰延税金資産を計上しております。
(a) 通算グループ会社の過去5年間の連結所得
(単位:百万円)
2022年3月 2023年3月 2024年3月 2025年3月 2026年3月
△73
△1,261
△353
△69
△2,727
決算年月
連結所得
②
当連結会計年度の連結財務諸表に計上した金額の算出に用いた主要な仮定
課税所得の見積額は事業計画の利益を基礎として算定しており、当該見積りにあたっては、日系主要顧
客からの受注情報等を基礎とした売上計画を主要な仮定として織り込んでおります。
③ 翌連結会計年度の連結財務諸表に与える影響
上記の主要な仮定である売上計画は、当社が製品を販売している国または地域の経済状況及び当該製品
の市場の動向により高い不確実性があるため、将来課税所得の見積りに重要な影響を及ぼす可能性があり
ます。
2.固定資産の減損
(1) 当連結会計年度の連結財務諸表に計上した金額
(単位:百万円)
前連結会計年度
当連結会計年度
459
(126)
712
(712)
有形固定資産
21,515
(4,850)
21,539
(4,851)
無形固定資産
261
(130)
323
(171)
減損損失
(注) (
) 内の金額は、提出会社の計上額です。
65/122
EDINET提出書類
株式会社TBK(E02201)
有価証券報告書
(2) 会計上の見積りの内容について連結財務諸表利用者の理解に資するその他の情報
①
当連結会計年度の連結財務諸表に計上した金額の算出方法
当社グループは、主に管理会計上の区分(会社別)を基準としてグルーピングを行っており、また、処
分予定資産、事業の再編成に係る資産、並びに遊休資産については個々にグルーピングを行っておりま
す。当社グループは、固定資産のうち減損の兆候がある資産又は資産グループについて、当該資産又は資
産グループから得られる割引前将来キャッシュ・フローの総額と帳簿価額を比較し、減損損失を認識する
べきであると判定された資産又は資産グループは、帳簿価額を回収可能価額(正味売却価額又は使用価値
のいずれか高い価額)まで減額し、当該減少額を減損損失として計上しております。
② 当連結会計年度の連結財務諸表に計上した金額の算出に用いた主要な仮定
当社は、継続して営業損失が計上されており、減損の兆候を認識していますが、割引前将来キャッ
シュ・フローが帳簿価額を下回っているため、帳簿価額を回収可能価額まで減額し、当該減少額を減損損
失として計上しております。回収可能価額には正味売却価額を使用しております。
土地等の不動産の正味売却価額については、主として不動産鑑定評価基準に基づいて算定した価額に
よっており、不動産鑑定評価の算定に用いる評価手法、前提条件や基礎データが重要な影響を及ぼしま
す。
③ 翌連結会計年度の連結財務諸表に与える影響
将来の不確実な経済条件の変動により正味売却価額に利用した不動産鑑定評価額等に下落が生じた場合
には、翌連結会計年度において固定資産の評価に重要な影響を及ぼす可能性があります。
66/122
EDINET提出書類
株式会社TBK(E02201)
有価証券報告書
(未適用の会計基準等)
・「リースに関する会計基準」(企業会計基準第34号 2024年9月13日企業会計基準委員会)
・「リースに関する会計基準の適用指針」(企業会計基準適用指針第33号 2024年9月13日企業会計基準
委員会) 等
(1)概要
企業会計基準委員会において、日本基準を国際的に整合性のあるものとする取組みの一環として、借手
の全てのリースについて資産及び負債を認識するリースに関する会計基準の開発に向けて、国際的な会計
基準を踏まえた検討が行われ、基本的な方針として、IFRS第16号の単一の会計処理モデルを基礎とするも
のの、IFRS第16号の全ての定めを採り入れるのではなく、主要な定めのみを採り入れることにより、簡素
で利便性が高く、かつ、IFRS第16号の定めを個別財務諸表に用いても、基本的に修正が不要となることを
目指したリース会計基準等が公表されました。
借手の会計処理として、借手のリースの費用配分の方法については、IFRS第16号と同様に、リースが
ファイナンス・リースであるかオペレーティング・リースであるかにかかわらず、全てのリースについて
使用権資産に係る減価償却費及びリース負債に係る利息相当額を計上する単一の会計処理モデルが適用さ
れます。
(2)適用予定日
2028年3月期の期首から適用します。
(3)当該会計基準等の適用による影響
「リースに関する会計基準」等の適用による連結財務諸表に与える影響額については、現時点で評価中
であります。
・「後発事象に関する会計基準」(企業会計基準第41号
2026年1月9日
企業会計基準委員会)
・「後発事象に関する会計基準の適用指針」(企業会計基準適用指針第35号
準委員会)
2026年1月9日
企業会計基
(1)概要
「後発事象に関する会計基準」等は、後発事象の定義、会計処理及び開示等を取り扱う包括的な会計基
準を設定することを優先的な課題とし、日本公認会計士協会監査・保証基準委員会監査基準報告書560
実務指針第1号「後発事象に関する監査上の取扱い」で示されている会計に関する内容を原則として踏襲
して企業会計基準委員会に移管することを基本的な方針として、表現の見直し及び後発事象の評価期間の
整理を行うとともに、財務諸表の公表の承認に関する注記を新たに求める等、後発事象に関する会計処理
及び開示について定めたものであります。
(2)適用予定日
2028年3月期の期首から適用します。
67/122
EDINET提出書類
株式会社TBK(E02201)
有価証券報告書
(追加情報)
(株式給付信託(BBT))
当社は、2019年6月20日開催の第83回定時株主総会決議及び2021年6月29日開催の第85回定時株主総会決議に基
づき、取締役(社外取締役を含みます。)及び執行役員(以下、取締役とあわせて「取締役等」といいます。)の
報酬と当社の株式価値との連動性をより明確にし、取締役等が株価上昇によるメリットのみならず、株価下落リス
クまでも株主の皆様と共有することで、取締役(社外取締役を除きます。)及び執行役員に関しては、中長期的な
業績の向上と企業価値の増大に貢献する意識を高めることを目的とし、また、社外取締役に関しては、当社の経営
の健全性と社会的信頼の確保を通じた当社に対する社会的評価の向上を動機付けることを目的とし、業績連動型株
式報酬制度として「株式給付信託(BBT(=Board Benefit Trust))」(以下「本制度」といいます。)を導入し
ております。
(1)取引の概要
本制度は、当社が拠出する金銭を原資として当社株式が信託を通じて取得され、取締役等に対して、当社が定め
る役員株式給付規則に従って、当社株式が信託を通じて給付される株式報酬制度です。なお、取締役等が当社株式
の給付を受ける時期は、原則として取締役等の退任時となります。
(2)信託が保有する自社の株式に関する事項
信託に残存する当社株式を、信託における帳簿価額(付随費用の金額を除く。)により、純資産の部に自己株式
として計上しております。当該自己株式の帳簿価額及び株式数は、前連結会計年度末370百万円、830千株、当連結
会計年度末367百万円、823千株であります。
(3)総額法の適用により計上された借入金の帳簿価額
該当事項はありません。
68/122
EDINET提出書類
株式会社TBK(E02201)
有価証券報告書
(連結貸借対照表関係)
受取手形割引高及び受取手形裏書譲渡高
1
前連結会計年度
(2025年3月31日)
受取手形裏書譲渡高
※2
当連結会計年度
(2026年3月31日)
1,025百万円
1,219百万円
有形固定資産の減価償却累計額及び減損損失累計額
前連結会計年度
(2025年3月31日)
有形固定資産の減価償却累計額
及び減損損失累計額
当連結会計年度
(2026年3月31日)
70,781百万円
72,189百万円
※3
固定資産の圧縮記帳
補助金収入の受入れに伴い、有形固定資産及び無形固定資産の取得価額から直接控除している圧縮記帳額の内訳は、
次のとおりであります。
前連結会計年度
(2025年3月31日)
建物及び構築物
機械装置及び運搬具
土地
有形固定資産その他
ソフトウエア
計
※4
当連結会計年度
(2026年3月31日)
180百万円
1,006
7
7
4
180百万円
1,006
7
7
4
1,206
1,206
非連結子会社及び関連会社に対するものは、次のとおりであります。
前連結会計年度
(2025年3月31日)
当連結会計年度
(2026年3月31日)
投資有価証券(株式)
5百万円
関係会社出資金
5百万円
799
431
※5
担保資産及び担保付債務
担保に供している資産は、次のとおりであります。
前連結会計年度
(2025年3月31日)
建物及び構築物
土地
計
当連結会計年度
(2026年3月31日)
94百万円
266
360
69/122
87百万円
266
354
EDINET提出書類
株式会社TBK(E02201)
有価証券報告書
※6
事業用土地の再評価
土地の再評価に関する法律(平成10年3月31日公布法律第34号)に基づき、事業用の土地の再評価を行い、評価差
額については、「土地再評価差額金」として純資産の部に計上しております。
・再評価の方法…土地の再評価に関する法律施行令(平成10年3月31日公布政令第119号)第2条第4号に定める
路線価及び同条第3号に定める固定資産税評価額に奥行価格補正及び時点修正等を行って算出し
たほか、同条第5号に定める不動産鑑定士による鑑定評価に時点修正を行って算出しておりま
す。
・再評価を行った年月日…2000年3月31日
前連結会計年度末及び当連結会計年度末において、再評価を行った土地の時価が再評価後の帳簿価額を上回っているた
め、差額を記載しておりません。
※7
棚卸資産の内訳は、次のとおりであります。
商品及び製品
仕掛品
原材料及び貯蔵品
前連結会計年度
(2025年3月31日)
2,749百万円
1,971
2,792
70/122
当連結会計年度
(2026年3月31日)
2,632百万円
1,970
2,732
EDINET提出書類
株式会社TBK(E02201)
有価証券報告書
※1
(連結損益計算書関係)
期末棚卸高は収益性の低下に伴う簿価切下後の金額であり、次の棚卸資産評価損が売上原価に含まれております。
前連結会計年度
2024年4月1日
2025年3月31日)
当連結会計年度
2025年4月1日
2026年3月31日)
(自
至
(自
至
150百万円
※2
169百万円
販売費及び一般管理費のうち主要な費目及び金額は次のとおりであります。
前連結会計年度
2024年4月1日
2025年3月31日)
当連結会計年度
2025年4月1日
2026年3月31日)
(自
至
運搬費
(自
至
914百万円
1,597
役員報酬・従業員給料・賞与
980百万円
1,630
賞与引当金繰入額
149
163
役員株式給付引当金繰入額
16
33
退職給付費用
79
75
福利厚生費
305
320
旅費交通費
168
162
支払手数料
550
649
製品保証引当金繰入額
(△は戻入額)
△2
27
減価償却費
131
133
賃借料
140
144
※3
一般管理費及び当期製造費用に含まれる研究開発費の総額
前連結会計年度
2024年4月1日
2025年3月31日)
当連結会計年度
2025年4月1日
2026年3月31日)
(自
至
(自
至
1,190百万円
※4
固定資産売却益の内容は次のとおりであります。
前連結会計年度
2024年4月1日
2025年3月31日)
当連結会計年度
2025年4月1日
2026年3月31日)
(自
至
土地
建物および構築物
機械装置及び運搬具
その他
計
※5
1,325百万円
(自
至
53百万円
−
2
1
5百万円
224
3
3
57
236
固定資産売却損の内容は次のとおりであります。
前連結会計年度
2024年4月1日
2025年3月31日)
当連結会計年度
2025年4月1日
2026年3月31日)
(自
至
機械装置及び運搬具
その他
計
71/122
(自
至
−百万円
0
0百万円
−
0
0
EDINET提出書類
株式会社TBK(E02201)
有価証券報告書
※6
固定資産廃棄損の内容は次のとおりであります。
前連結会計年度
2024年4月1日
2025年3月31日)
当連結会計年度
2025年4月1日
2026年3月31日)
(自
至
建物及び構築物
機械装置及び運搬具
その他
計
(自
至
6百万円
1
4
5百万円
6
0
11
12
※7
減損損失
前連結会計年度(自 2024年4月1日至 2025年3月31日)
(1) 減損損失を認識した主な資産グループの概要
用途
事業用資産
事業用資産
種類
機械装置及び運搬具
その他
機械装置及び運搬具
その他
場所
日本
米国
(2) 減損損失の認識に至った経緯
日本については、当連結会計年度において、事業用資産が将来に生み出すキャッシュ・フローの総額が帳簿価額を
下回ることから、帳簿価額を回収可能価額まで減額し、当該減少額を減損損失として特別損失に計上しました。米国
については、当社の連結子会社であるTBK America, Inc.において、同じく当社の連結子会社であるTBK India
Private Ltd.へ事業移管をしたことに伴い、生産拠点の閉鎖を決定したことによるものであります。
(3) 減損損失の金額及び主な固定資産の種類ごとの当該金額の内訳
(単位:百万円)
種類
機械装置及び運搬具
その他
機械装置及び運搬具
その他
計
(4) 資産のグルーピングの方法
金額
場所
107
19
328
5
459
日本
米国
当社グループは、主に管理会計上の区分(会社別)を基準としてグルーピングを行っております。
また、処分予定資産、事業の再編成に係る資産、並びに遊休資産については個々にグルーピングを行っておりま
す。
(5) 回収可能価額の算定方法
事業用資産の回収可能価額は、正味売却価額により測定しており、市場価値を勘案した合理的な見積りにより算定
しております。
当連結会計年度(自 2025年4月1日至 2026年3月31日)
(1) 減損損失を認識した主な資産グループの概要
用途
事業用資産
種類
機械装置及び運搬具
建設仮勘定
その他
ソフトウエア
場所
日本
(2) 減損損失の認識に至った経緯
日本については、当連結会計年度において、事業用資産が将来に生み出すキャッシュ・フローの総額が帳簿価額を
下回ることから、帳簿価額を回収可能価額まで減額し、当該減少額を減損損失として特別損失に計上しました。
(3) 減損損失の金額及び主な固定資産の種類ごとの当該金額の内訳
(単位:百万円)
種類
金額
場所
機械装置及び運搬具
428
建設仮勘定
154
日本
その他
90
ソフトウエア
40
計
712
(4) 資産のグルーピングの方法
当社グループは、主に管理会計上の区分(会社別)を基準としてグルーピングを行っております。
72/122
EDINET提出書類
株式会社TBK(E02201)
有価証券報告書
また、処分予定資産、事業の再編成に係る資産、並びに遊休資産については個々にグルーピングを行っておりま
す。
(5) 回収可能価額の算定方法
事業用資産の回収可能価額は、正味売却価額により測定しており、市場価値を勘案した合理的な見積りにより算定
しております。
※8
関係会社出資金売却損の主要な内訳
前連結会計年度(自 2024年4月1日
該当事項はありません。
至
2025年3月31日)
当連結会計年度(自 2025年4月1日至 2026年3月31日)
関係会社出資金売却損は、当社の持分法適用会社であるChangchun FAWSN TBK Co., Ltd.に対するものであります。
※9
関係会社出資金売却損失引当金繰入の主要な内訳
前連結会計年度(自 2024年4月1日至 2025年3月31日)
関係会社出資金売却損失引当金繰入は、当社の持分法適用会社であるChangchun FAWSN TBK Co., Ltd.に対するもの
であります。
当連結会計年度(自 2025年4月1日
該当事項はありません。
至
2026年3月31日)
※10
事業再編損の主要な内訳
前連結会計年度(自 2024年4月1日至 2025年3月31日)
当社の連結子会社であるTBK America, Inc.において、同じく当社の連結子会社であるTBK India Private Ltd.へ事
業移管をしたことによるものであります。
当連結会計年度(自 2025年4月1日至 2026年3月31日)
当社の連結子会社であるTBK America, Inc.が、2025年11月25日に清算結了したことによるものであります。
73/122
EDINET提出書類
株式会社TBK(E02201)
有価証券報告書
※
(連結包括利益計算書関係)
その他の包括利益に係る組替調整額並びに法人税等及び税効果額
前連結会計年度
2024年4月1日
2025年3月31日)
(自
至
当連結会計年度
2025年4月1日
2026年3月31日)
(自
至
その他有価証券評価差額金:
当期発生額
組替調整額
△58百万円
0
法人税等及び税効果調整前
351百万円
0
法人税等及び税効果額
△58
17
351
△126
その他有価証券評価差額金
△41
224
755
−
1,445
238
法人税等及び税効果額
755
−
1,684
−
為替換算調整勘定
755
1,684
290
30
487
△10
法人税等及び税効果額
321
△1
477
△5
退職給付に係る調整額
319
472
80
14
1,115
2,395
為替換算調整勘定:
当期発生額
組替調整額
法人税等及び税効果調整前
退職給付に係る調整額:
当期発生額
組替調整額
法人税等及び税効果調整前
持分法適用会社に対する持分相当額:
当期発生額
その他の包括利益合計
74/122
EDINET提出書類
株式会社TBK(E02201)
有価証券報告書
(連結株主資本等変動計算書関係)
前連結会計年度(自 2024年4月1日至 2025年3月31日)
1.発行済株式の種類及び総数並びに自己株式の種類及び株式数に関する事項
当連結会計年度期首
株式数
(千株)
当連結会計年度
増加株式数
(千株)
当連結会計年度
減少株式数
(千株)
当連結会計年度末
株式数
(千株)
普通株式
29,424
−
−
29,424
合計
29,424
−
−
29,424
普通株式
956
0
23
933
合計
956
0
23
933
発行済株式
自己株式
(注)
(注)1.当連結会計年度末の普通株式の自己株式数には、株式給付信託制度の信託財産として「役員株式給付信託
(BBT)」が保有する自社の株式(当連結会計年度期首853千株、当連結会計年度末830千株)が含まれており
ます。
2.普通株式の自己株式の株式数の増加0千株は、単元未満株式の買取りによる増加であります。
3.普通株式の自己株式の株式数の減少23千株は、役員株式給付信託(BBT)から役員へ当社株式を給付したこと
による減少であります。
2.配当に関する事項
(1)配当金支払額
株式の種類
配当金の総額
(百万円)
1株当たり
配当額
(円)
2024年5月14日
取締役会
普通株式
146
2024年11月7日
取締役会
普通株式
117
(決議)
基準日
効力発生日
5
2024年3月31日
2024年6月28日
4
2024年9月30日
2024年12月5日
(注)2024年5月14日取締役会の決議による配当金の総額には、株式給付信託制度の信託財産として「役員株式給付信
託(BBT)」が保有する自社の株式に対する配当金4百万円が含まれております。また、2024年11月7日取締役会
の決議による配当金の総額には、株式給付信託制度の信託財産として「役員株式給付信託(BBT)」が保有する自
社の株式に対する配当金3百万円が含まれております。
(2)基準日が当連結会計年度に属する配当のうち、配当の効力発生日が翌連結会計年度となるもの
(決議)
2025年5月14日
取締役会
株式の種類
普通株式
配当金の総額
(百万円)
配当の原資
1株当たり
配当額
(円)
117
利益剰余金
4
基準日
効力発生日
2025年3月31日
2025年6月26日
(注)2025年5月14日取締役会の決議による配当金の総額には、株式給付信託制度の信託財産として「役員株式給付信
託(BBT)」が保有する自社の株式に対する配当金3百万円が含まれております。
75/122
EDINET提出書類
株式会社TBK(E02201)
有価証券報告書
当連結会計年度(自 2025年4月1日
至
2026年3月31日)
1.発行済株式の種類及び総数並びに自己株式の種類及び株式数に関する事項
当連結会計年度期首
株式数
(千株)
当連結会計年度
増加株式数
(千株)
当連結会計年度
減少株式数
(千株)
当連結会計年度末
株式数
(千株)
普通株式
29,424
3,269
−
32,694
合計
29,424
3,269
−
32,694
普通株式
933
0
6
927
合計
933
0
6
927
発行済株式
自己株式
(注)
(注)1.発行済株式の総数の増加は、Brakes India Private Limitedに対する第三者割当増資に伴う新株発行による
ものであります。
2.当連結会計年度末の普通株式の自己株式数には、株式給付信託制度の信託財産として「役員株式給付信託
(BBT)」が保有する自社の株式(当連結会計年度期首830千株、当連結会計年度末823千株)が含まれており
ます。
3.普通株式の自己株式の株式数の増加0千株は、単元未満株式の買取りによる増加であります。
4.普通株式の自己株式の株式数の減少6千株は、役員株式給付信託(BBT)から役員へ当社株式を給付したことに
よる減少であります。
2.配当に関する事項
(1)配当金支払額
株式の種類
配当金の総額
(百万円)
1株当たり
配当額
(円)
2025年5月14日
取締役会
普通株式
117
2025年11月13日
取締役会
普通株式
117
(決議)
基準日
効力発生日
4
2025年3月31日
2025年6月26日
4
2025年9月30日
2025年12月5日
(注)2025年5月14日取締役会の決議による配当金の総額には、株式給付信託制度の信託財産として「役員株式給付信
託(BBT)」が保有する自社の株式に対する配当金3百万円が含まれております。また、2025年11月13日取締役会
の決議による配当金の総額には、株式給付信託制度の信託財産として「役員株式給付信託(BBT)」が保有する自
社の株式に対する配当金3百万円が含まれております。
(2)基準日が当連結会計年度に属する配当のうち、配当の効力発生日が翌連結会計年度となるもの
(決議)
2026年5月14日
取締役会
株式の種類
普通株式
配当金の総額
(百万円)
配当の原資
1株当たり
配当額
(円)
130
利益剰余金
4
基準日
効力発生日
2026年3月31日
2026年6月29日
(注)2026年5月14日取締役会の決議による配当金の総額には、株式給付信託制度の信託財産として「役員株式給付信
託(BBT)」が保有する自社の株式に対する配当金3百万円が含まれております。
76/122
EDINET提出書類
株式会社TBK(E02201)
有価証券報告書
※
(連結キャッシュ・フロー計算書関係)
現金及び現金同等物の期末残高と連結貸借対照表に掲記されている科目の金額との関係
前連結会計年度
2024年4月1日
2025年3月31日)
(自
至
当連結会計年度
2025年4月1日
2026年3月31日)
(自
至
現金及び預金勘定
預入期間が3か月を超える定期預金
4,139百万円
△15
7,359百万円
△15
現金及び現金同等物
4,123
7,344
(リース取引関係)
ファイナンス・リース取引
所有権移転外ファイナンス・リース取引
① リース資産の内容
(ア)有形固定資産
主として生産設備 (「機械装置及び運搬具」、「工具、器具及び備品」)であります。
(イ)無形固定資産
ソフトウエアであります。
② リース資産の減価償却の方法
連結財務諸表作成のための基本となる重要な事項「5.会計方針に関する事項
の減価償却の方法」に記載のとおりであります。
(2)重要な減価償却資産
(金融商品関係)
1.金融商品の状況に関する事項
(1) 金融商品に対する取組方針
当社グループは、資金運用については一時的な余資がある場合は、運用に伴うリスクを回避しつつ、資金効率
を総合的に考慮し運用しております。また、資金調達については銀行借入、社債発行、増資等により、調達する
時点で最適と考えられる調達をしております。
(2) 金融商品の内容及びそのリスク並びにリスク管理体制
営業債権である受取手形及び売掛金、電子記録債権が、回収できないリスクに対して、債権の発生から消滅に
至るまで、取引先別に期日管理及び残高管理をしており、契約書に定められた期間中に回収できなかった場合
は、適切な保全処置をとっております。
投資有価証券である株式は、市場価格の変動リスクに晒されておりますが、主に業務上の関係を有する企業の
株式であり、定期的に把握された時価が取締役会に報告されております。
営業債務である支払手形及び買掛金、電子記録債務は、1年以内の期日であります。
借入金のうち、短期借入金は主に営業取引に係る資金調達であり、長期借入金(原則として5年以内)は主に
設備投資に係る資金調達であります。
当社グループは、各部署からの報告に基づき担当部署が適時に資金計画を作成・更新するとともに、手許流動
性の維持などにより流動性リスクを管理しております。
(3) 金融商品の時価等に関する事項についての補足説明
金融商品の時価の算定においては変動要因を織り込んでいるため、異なる前提条件等を採用することにより、
当該価額が変動することもあります。
(4) 信用リスクの集中
当期の連結決算日現在における営業債権のうち24.7%が特定の大口顧客に対するものであります。
77/122
EDINET提出書類
株式会社TBK(E02201)
有価証券報告書
2.金融商品の時価等に関する事項
連結貸借対照表計上額、時価及びこれらの差額については、次のとおりであります。なお、市場価格のない株
式等は、「その他有価証券」には含めておりません((注2)を参照)。
前連結会計年度(2025年3月31日)
連結貸借対照表計上額
(百万円)
(1)投資有価証券
その他有価証券
資産計
(1)長期借入金
負債計
時価(百万円)
差額(百万円)
3,359
3,359
−
3,359
3,359
−
1,336
1,271
△64
1,336
1,271
△64
当連結会計年度(2026年3月31日)
連結貸借対照表計上額
(百万円)
(1)投資有価証券
その他有価証券
資産計
(1)長期借入金(1年内含む)
負債計
時価(百万円)
差額(百万円)
3,720
3,720
−
3,720
3,720
−
1,439
1,405
△27
1,439
1,405
△27
(注)1.「現金及び預金」、「受取手形及び売掛金」、「電子記録債権」、「支払手形及び買掛金」、「電子記録
債務」及び「短期借入金」については、現金であること、及び短期間で決済されるため時価が帳簿価額に
近似するものであることから、記載を省略しております。
(注)2.市場価格のない株式等は、「(1)投資有価証券」には含まれておりません。当該金融商品の連結貸借対
照表計上額は以下のとおりであります。
(単位:百万円)
前連結会計年度
当連結会計年度
区分
(2025年3月31日)
(2026年3月31日)
非上場株式
5
5
関係会社出資金
799
431
78/122
EDINET提出書類
株式会社TBK(E02201)
有価証券報告書
3.金銭債権及び満期のある有価証券の連結決算日後の償還予定額
前連結会計年度(2025年3月31日)
1年超
5年以内
(百万円)
1年以内
(百万円)
5年超
10年以内
(百万円)
10年超
(百万円)
現金及び預金
4,139
−
−
−
受取手形及び売掛金
13,475
−
−
−
電子記録債権
626
−
−
−
合計
18,241
−
−
−
当連結会計年度(2026年3月31日)
1年超
5年以内
(百万円)
1年以内
(百万円)
5年超
10年以内
(百万円)
10年超
(百万円)
現金及び預金
7,359
−
−
−
受取手形及び売掛金
13,199
−
−
−
電子記録債権
578
−
−
−
合計
21,137
−
−
−
4. 長期借入金及びその他の有利子負債の連結決算日後の返済予定額
前連結会計年度(2025年3月31日)
1年以内
(百万円)
1年超
2年以内
(百万円)
2年超
3年以内
(百万円)
3年超
4年以内
(百万円)
4年超
5年以内
(百万円)
5年超
(百万円)
短期借入金
5,820
−
−
−
−
−
長期借入金
714
571
471
215
79
−
6,535
571
471
215
79
−
1年以内
(百万円)
1年超
2年以内
(百万円)
2年超
3年以内
(百万円)
3年超
4年以内
(百万円)
4年超
5年以内
(百万円)
5年超
(百万円)
短期借入金
6,139
−
−
−
−
−
長期借入金
571
514
235
99
20
−
6,711
514
235
99
20
−
合計
当連結会計年度(2026年3月31日)
合計
79/122
EDINET提出書類
株式会社TBK(E02201)
有価証券報告書
5.金融商品の時価のレベルごとの内訳等に関する事項
金融商品の時価を、時価の算定に係るインプットの観察可能性及び重要性に応じて、以下の3つのレベルに
分類しております。
レベル1の時価:観察可能な時価の算定に係るインプットのうち、活発な市場において形成される当該時価
の算定の対象となる資産又は負債に関する相場価格により算定した時価
レベル2の時価:観察可能な時価の算定に係るインプットのうち、レベル1のインプット以外の時価の算定
に係るインプットを用いて算定した時価
レベル3の時価:観察できない時価の算定に係るインプットを使用して算定した時価
時価の算定に重要な影響を与えるインプットを複数使用している場合には、それらのインプットがそれぞれ
属するレベルのうち、時価の算定における優先順位が最も低いレベルに時価を分類しております。
(1)時価で連結貸借対照表に計上している金融商品
前連結会計年度(2025年3月31日)
時価(百万円)
区分
レベル1
レベル2
レベル3
合計
有価証券及び投資有価証券
その他有価証券
株式
資産計
3,359
−
−
3,359
3,359
−
−
3,359
当連結会計年度(2026年3月31日)
時価(百万円)
区分
レベル1
レベル2
レベル3
合計
有価証券及び投資有価証券
その他有価証券
株式
資産計
3,720
−
−
3,720
3,720
−
−
3,720
80/122
EDINET提出書類
株式会社TBK(E02201)
有価証券報告書
(2)時価で連結貸借対照表に計上している金融商品以外の金融商品
前連結会計年度(2025年3月31日)
時価(百万円)
区分
レベル1
長期借入金
負債計
レベル2
レベル3
合計
−
1,271
−
1,271
−
1,271
−
1,271
当連結会計年度(2026年3月31日)
時価(百万円)
区分
レベル1
長期借入金
負債計
(注)
レベル2
レベル3
合計
−
1,405
−
1,405
−
1,405
−
1,405
時価の算定に用いた評価技法及び時価の算定に係るインプットの説明
投資有価証券
上場株式は相場価格を用いて評価しております。上場株式は活発な市場で取引されているため、その時価を
レベル1の時価に分類しております。
長期借入金
長期借入金の時価については、元利金の合計額を新規に同様の借入を行った場合に想定される利率で割り引
いた現在価値により算定しており、レベル2の時価に分類しております。
81/122
EDINET提出書類
株式会社TBK(E02201)
有価証券報告書
(有価証券関係)
1.その他有価証券
前連結会計年度(2025年3月31日)
連結貸借対照表計上額
(百万円)
取得原価(百万円)
差額(百万円)
連結貸借対照表計上額が取得原価を
超えるもの
株式
3,343
1,261
2,081
3,343
1,261
2,081
16
18
△2
小計
16
18
△2
合計
3,359
1,280
2,079
小計
連結貸借対照表計上額が取得原価を
超えないもの
株式
当連結会計年度(2026年3月31日)
連結貸借対照表計上額
(百万円)
取得原価(百万円)
差額(百万円)
連結貸借対照表計上額が取得原価を
超えるもの
株式
3,708
1,271
2,436
3,708
1,271
2,436
12
18
△6
小計
12
18
△6
合計
3,720
1,290
2,430
小計
連結貸借対照表計上額が取得原価を
超えないもの
株式
(注)表中の「取得原価」は減損処理後の帳簿価額であります。
2.売却したその他有価証券
前連結会計年度(自 2024年4月1日
該当事項はありません。
当連結会計年度(自 2025年4月1日
該当事項はありません。
至
2025年3月31日)
至
2026年3月31日)
82/122
EDINET提出書類
株式会社TBK(E02201)
有価証券報告書
(退職給付関係)
1.採用している退職給付制度の概要
当社及び連結子会社は、従業員の退職給付に充てるため、積立型、非積立型の確定給付制度を採用しております。
確定給付企業年金制度(すべて積立型制度であります。)では、給与と勤務期間に基づいた一時金又は年金を支給
します。
退職一時金制度(非積立型制度)では、退職給付として、給与と勤務期間に基づいた一時金を支給します。
なお、一部の連結子会社は、退職給付に係る負債及び退職給付費用の計算に、退職給付に係る期末自己都合要支給
額を退職給付債務とする方法を用いた簡便法を適用しております。
2.確定給付制度
(1)退職給付債務の期首残高と期末残高の調整表
退職給付債務の期首残高
勤務費用
利息費用
数理計算上の差異の発生額
退職給付の支払額
過去勤務費用の発生額
為替換算差額
退職給付債務の期末残高
前連結会計年度
(自 2024年4月1日
至 2025年3月31日)
6,056百万円
351
62
△390
△337
35
5,777
当連結会計年度
2025年4月1日
2026年3月31日)
5,777百万円
339
92
△343
△424
△53
85
5,474
(自
至
(2)年金資産の期首残高と期末残高の調整表
年金資産の期首残高
期待運用収益
数理計算上の差異の発生額
事業主からの拠出額
退職給付の支払額
その他
年金資産の期末残高
前連結会計年度
(自 2024年4月1日
至 2025年3月31日)
3,425百万円
68
△100
165
△181
△38
3,338
(3)簡便法を適用した制度の、退職給付に係る負債の期首残高と期末残高の調整表
前連結会計年度
(自 2024年4月1日
至 2025年3月31日)
退職給付に係る負債の期首残高
119百万円
退職給付費用
12
退職給付の支払額
△1
退職給付に係る負債の期末残高
131
当連結会計年度
2025年4月1日
2026年3月31日)
3,338百万円
67
90
△240
158
38
3,453
(自
至
当連結会計年度
2025年4月1日
2026年3月31日)
131百万円
18
△36
112
(自
至
(4)退職給付債務及び年金資産の期末残高と連結貸借対照表に計上された退職給付に係る負債及び退職給付に係る資
産の調整表
前連結会計年度
当連結会計年度
(2025年3月31日)
(2026年3月31日)
積立型制度の退職給付債務
2,999百万円
2,771百万円
年金資産
△3,338
△3,453
△338
△682
非積立型制度の退職給付債務
2,909
2,814
連結貸借対照表に計上された負債と資産の純額
2,570
2,132
退職給付に係る負債
退職給付に係る資産
連結貸借対照表に計上された負債と資産の純額
2,909
△338
2,570
83/122
2,814
△682
2,132
EDINET提出書類
株式会社TBK(E02201)
有価証券報告書
(5)退職給付費用及びその内訳項目の金額
勤務費用
利息費用
期待運用収益
数理計算上の差異の費用処理額
過去勤務費用の費用処理額
簡便法で計算した退職給付費用
その他
確定給付制度に係る退職給付費用
前連結会計年度
(自 2024年4月1日
至 2025年3月31日)
351百万円
62
△68
29
1
12
38
428
当連結会計年度
2025年4月1日
2026年3月31日)
339百万円
92
△67
△12
1
18
△38
333
(自
至
(6)退職給付に係る調整額
退職給付に係る調整額に計上した項目(法人税等及び税効果控除前)の内訳は次のとおりであります。
前連結会計年度
当連結会計年度
(自 2024年4月1日
(自 2025年4月1日
至 2025年3月31日)
至 2026年3月31日)
数理計算上の差異の費用処理額
29百万円
△12百万円
過去勤務費用の費用処理額
1
1
退職給付債務の数理計算上の差異の発生額
390
343
年金資産の数理計算上の差異の発生額
△100
90
過去勤務費用の当期発生額
53
合計
321
477
(7)退職給付に係る調整累計額
退職給付に係る調整累計額に計上した項目(法人税等及び税効果控除前)の内訳は次のとおりであります。
前連結会計年度
当連結会計年度
(2025年3月31日)
(2026年3月31日)
未認識数理計算上の差異
△531百万円
△948百万円
未認識過去勤務費用
12
△41
合計
△519
△990
(8)年金資産に関する事項
① 年金資産の主な内訳
年金資産合計に対する主な分類ごとの比率は、次のとおりであります。
前連結会計年度
(2025年3月31日)
債券
44%
株式
16
保険資産(一般勘定)
36
現金及び預金
4
合計
100
当連結会計年度
(2026年3月31日)
47%
16
34
2
100
②
長期期待運用収益率の設定方法
年金資産の長期期待運用収益率を決定するため、現在及び予想される年金資産の配分と、年金資産を構成する
多様な資産からの現在及び将来期待される長期の収益率を考慮しております。
(9)数理計算上の計算基礎に関する事項
主要な数理計算上の計算基礎(加重平均で表わしております。)
前連結会計年度
当連結会計年度
(2025年3月31日)
(2026年3月31日)
割引率
1.5%
2.2%
長期期待運用収益率
2.0%
2.0%
(注)予定昇給率については、当社及び連結子会社の一部の退職給付制度はポイント制を採用しており、数理計
算上、退職給付債務との関連性が希薄であるため、注記を省略しております。
84/122
EDINET提出書類
株式会社TBK(E02201)
有価証券報告書
(税効果会計関係)
1.繰延税金資産及び繰延税金負債の発生の主な原因別の内訳
前連結会計年度
(2025年3月31日)
当連結会計年度
(2026年3月31日)
18百万円
156
43
824
867
245
3,195
57
326
5,733
△3,193
△1,951
△5,144
589
3百万円
171
43
861
866
31
2,021
60
325
4,382
△2,018
△1,994
△4,012
370
622
27
1,323
11
0
−
1,985
△1,396
748
21
1,595
11
−
△4
2,373
△2,002
繰延税金資産
未払事業税
賞与引当金損金不算入額
工場集約統合費用損金不算入額
減損損失
退職給付に係る負債
連結納税適用に伴う固定資産等時価評価益
連結子会社の繰越欠損金(注)2
減価償却超過額
その他
繰延税金資産小計
税務上の繰越欠損金に係る評価性引当額(注)2
将来減算一時差異等の合計に係る評価性引当額
評価性引当額小計(注)1
繰延税金資産合計
繰延税金負債
その他有価証券評価差額金
連結納税適用に伴う固定資産等時価評価損
海外関係会社の配当可能利益
固定資産圧縮積立金
特別償却準備金
その他
繰延税金負債合計
繰延税金資産(△は負債)の純額
(注)1.評価性引当額に重要な変動が生じた主な理由は、当期に当社の連結子会社であるTBK America, Inc.が清
算結了したことより、税務上の繰越欠損金に係る評価性引当額が減少したことによるものであります。
(注)2.税務上の繰越欠損金及びその繰延税金資産の繰越期限別の金額
前連結会計年度(2025年3月31日)
1年超
2年超
3年超
4年超
1年以内
5年超
2年以内
3年以内
4年以内
5年以内
(百万円)
(百万円)
(百万円) (百万円) (百万円) (百万円)
税務上の繰越欠
36
88
193
101
44
2,731
損金(※)
合計
(百万円)
3,195
評価性引当額
△36
△85
△193
△101
△44
△2,731
△3,193
繰延税金資産
−
2
−
−
−
△0
2
(※)
税務上の繰越欠損金は、法定実効税率を乗じた額であります。
当連結会計年度(2026年3月31日)
1年超
2年超
3年超
4年超
1年以内
5年超
2年以内
3年以内
4年以内
5年以内
(百万円)
(百万円)
(百万円) (百万円) (百万円) (百万円)
税務上の繰越欠
63
74
130
19
84
1,648
損金(※)
合計
(百万円)
2,021
評価性引当額
△61
△74
△130
△19
△84
△1,648
△2,018
繰延税金資産
2
−
−
−
−
0
2
(※)
税務上の繰越欠損金は、法定実効税率を乗じた額であります。
85/122
EDINET提出書類
株式会社TBK(E02201)
有価証券報告書
2.法定実効税率と税効果会計適用後の法人税等の負担率との間に重要な差異があるときの、当該差異の原因となった
主要な項目別の内訳
前連結会計年度
当連結会計年度
(2025年3月31日)
(2026年3月31日)
法定実効税率
−%
29.9%
(調整)
交際費等永久に損金に算入されない項目
−
2.1
評価性引当額の増減
−
78.5
住民税均等割
−
1.7
外国連結子会社の税率差異
−
△25.3
外国源泉税
−
3.5
外国連結子会社の留保利益
−
10.8
持分法による投資利益
−
△0.5
その他
−
△0.8
税効果会計適用後の法人税等の負担率
−
99.9
(注)前連結会計年度は、税金等調整前当期純損失を計上しているため記載を省略しております。
3.法人税及び地方法人税の会計処理又はこれらに関する税効果会計の会計処理
当社及び国内連結子会社は、グループ通算制度を適用しており、「グループ通算制度を適用する場合の会計処理及
び開示に関する取扱い」(実務対応報告第42号 2021年8月12日)に従って、法人税及び地方法人税の会計処理又は
これらに関する税効果会計の会計処理並びに開示を行っております。
86/122
EDINET提出書類
株式会社TBK(E02201)
有価証券報告書
(収益認識関係)
1.顧客との契約から生じる収益を分解した情報
当社グループの主たる地域別の収益の分解と主たる製品及びサービスとの関連は次のとおりであります。
前連結会計年度(自
2024年4月1日
至
2025年3月31日)
(単位:百万円)
報告セグメント
合計
日本
ブレーキ
ポンプ
エンジン部品
その他
アジア
中国
北米
顧客との契約から生じる収益
13,602
10,665
1,418
3,019
28,705
2,041
8,847
6,723
407
18,019
3,219
95
−
31
3,345
−
4,297
−
46
4,344
18,863
23,905
8,142
3,505
54,415
外部顧客への売上高
28,705
18,019
3,345
4,344
54,415
当連結会計年度(自
2025年4月1日
至
2026年3月31日)
(単位:百万円)
報告セグメント
合計
日本
ブレーキ
ポンプ
エンジン部品
その他
アジア
中国
北米
顧客との契約から生じる収益
15,086
12,152
1,329
3,017
31,586
1,804
9,282
7,763
254
19,106
3,945
108
−
−
4,054
−
−
−
9
9
20,837
21,543
9,093
3,282
54,756
外部顧客への売上高
31,586
19,106
4,054
9
54,756
2.顧客との契約から生じる収益を理解するための基礎となる情報
当社及び連結子会社は、商用車メーカー、建機・産機メーカー等を主な顧客としており、制動装置(ブレーキ)、
エンジン用ウォーターポンプ、オイルポンプ等の製造・販売を行っております。
当該履行義務にかかる収益を認識する時点は、注記事項5.会計方針に関する事項(6)重要な収益及び費用の計
上基準に記載のとおりであります。
3.顧客との契約に基づく履行義務の充足と当該契約から生じるキャッシュ・フローとの関係並びに当連結会計年度末
において存在する顧客との契約から翌連結会計年度以降に認識すると見込まれる収益の金額及び時期に関する情報
(1)契約負債の残高等
当社及び連結子会社の契約負債については、残高に重要性が乏しく、重大な変動も発生していないため、記載を
省略しております。また、過去の期間に充足(又は部分的に充足)した履行義務から、当連結会計年度に認識した
収益に重要性はありません。
(2)残存履行義務に配分した取引価格
当社及び連結子会社では、残存履行義務に配分した取引価格について実務上の便法を適用し、当初に予想される
契約期間が1年以内の契約については、注記の対象に含めておりません。また、顧客との契約から生じる対価の中
に、取引価格に含まれていない重要な金額はありません。
87/122
EDINET提出書類
株式会社TBK(E02201)
有価証券報告書
(セグメント情報等)
【セグメント情報】
1.報告セグメントの概要
当社の報告セグメントは、当社の構成単位のうち分離された財務情報が入手可能であり、取締役会及び経営会議
が、経営資源の配分の決定及び業績を評価するために、定期的に検討を行う対象となっているものであります。
当社は、国内外において主に自動車部品等を製造・販売しており、各現地法人はそれぞれ独立した経営単位であ
り、各地域に適した包括的な戦略を立案し、事業活動を展開しております。
したがって、当社は、製造・販売体制を基礎とした地域別のセグメントから構成されており、「日本」、「アジ
ア」、「中国」、「北米」の4つを報告セグメントとしております。各報告セグメントでは、主に自動車部品等を製
造・販売しております。
2.報告セグメントごとの売上高、利益又は損失、資産その他の項目の金額の算定方法
報告されている事業セグメントの会計処理の方法は、連結財務諸表作成において採用している会計方針と同一であ
ります。
報告セグメントの利益又は損失は、営業利益ベースの数値であります。
セグメント間の内部収益及び振替高は市場実勢価格に基づいております。
3.報告セグメントごとの売上高、利益又は損失、資産その他の項目の金額に関する情報
前連結会計年度(自 2024年4月1日
至
2025年3月31日)
(単位:百万円)
日本
アジア
中国
北米
調整額
(注1,3)
合計
連結財務
諸表計上額
(注2)
売上高
(1)外部顧客への売上高
28,705
18,019
3,345
4,344
54,415
−
54,415
(2)セグメント間の内
部売上高又は振替
高
1,142
646
1,763
27
3,579
△3,579
−
29,848
18,665
5,109
4,371
57,994
△3,579
54,415
154
946
△107
16
1,010
△68
941
23,690
20,362
11,651
1,250
56,954
△3,829
53,125
減価償却費
766
1,674
543
183
3,168
−
3,168
持分法適用会社への
投資額
−
−
799
−
799
−
799
減損損失
126
−
−
333
459
−
459
有形固定資産及び無
形固定資産の増加額
980
1,135
144
12
2,272
−
2,272
計
セグメント利益又は損
失(△)
セグメント資産
その他の項目
(注)1.セグメント利益又は損失(△)の調整額△68百万円には、セグメント間取引消去25百万円と、各セグメント
に配分していない全社費用△94百万円が含まれております。全社費用は、主に報告セグメントに帰属しない
役員報酬等であります。
2.セグメント利益又は損失(△)は、連結損益計算書の営業利益と調整を行っております。
3.セグメント資産の調整額△3,829百万円には、セグメント間消去額△8,399百万円と、各セグメントに配分し
ていない全社資産4,569百万円が含まれております。全社資産は、主に報告セグメントに帰属しない親会社
の現金及び預金、投資有価証券によるものであります。
4.減損損失は、建物及び構築物や機械装置及び運搬具などの有形固定資産によるものであります。
88/122
EDINET提出書類
株式会社TBK(E02201)
有価証券報告書
当連結会計年度(自 2025年4月1日
至
2026年3月31日)
(単位:百万円)
日本
アジア
中国
北米
調整額
(注1,3)
合計
連結財務
諸表計上額
(注2)
売上高
31,586
19,106
4,054
9
54,756
−
54,756
914
678
2,140
−
3,733
△3,733
−
32,501
19,784
6,194
9
58,490
△3,733
54,756
534
1,232
△107
9
1,669
△172
1,496
21,075
22,618
11,562
−
55,256
1,255
56,511
減価償却費
716
1,686
519
−
2,921
−
2,921
持分法適用会社への
投資額
−
−
431
−
431
−
431
減損損失
712
−
−
−
712
−
712
1,717
1,412
130
−
3,260
−
3,260
(1)外部顧客への売上高
(2)セグメント間の内
部売上高又は振替
高
計
セグメント利益又は損
失(△)
セグメント資産
その他の項目
有形固定資産及び無
形固定資産の増加額
(注)1.セグメント利益又は損失(△)の調整額△172百万円には、セグメント間取引消去△12百万円と、各セグメ
ントに配分していない全社費用△160百万円が含まれております。全社費用は、主に報告セグメントに帰属
しない役員報酬等であります。
2.セグメント利益又は損失(△)は、連結損益計算書の営業利益と調整を行っております。
3.セグメント資産の調整額1,255百万円には、セグメント間消去額△5,504百万円と、各セグメントに配分して
いない全社資産6,759百万円が含まれております。全社資産は、主に報告セグメントに帰属しない親会社の
現金及び預金、投資有価証券によるものであります。
4.減損損失は、機械装置及び運搬具、建設仮勘定やソフトウエアなどの有形固定資産及び無形固定資産に係る
ものであります。
89/122
EDINET提出書類
株式会社TBK(E02201)
有価証券報告書
【関連情報】
前連結会計年度(自 2024年4月1日
至
2025年3月31日)
1.製品及びサービスごとの情報
セグメント情報に同様の情報を開示しているため、記載を省略しております。
2.地域ごとの情報
(1)売上高
(単位:百万円)
日本
タイ
27,416
インド
13,370
中国
4,022
北米
2,982
ヨーロッパ
5,373
1,251
合計
54,415
(注)売上高は顧客の所在地を基礎とし、国又は地域に分類しております。
(2)有形固定資産
(単位:百万円)
日本
タイ
5,576
インド
10,422
中国
1,359
北米
3,526
合計
631
21,515
3.主要な顧客ごとの情報
(単位:百万円)
相手先
売上高
関連するセグメント名
いすゞ自動車株式会社
10,329
日本
三菱ふそうトラック・バス株式会社
3,584
日本
日野自動車株式会社
2,006
日本
当連結会計年度(自 2025年4月1日
至
2026年3月31日)
1.製品及びサービスごとの情報
セグメント情報に同様の情報を開示しているため、記載を省略しております。
2.地域ごとの情報
(1)売上高
(単位:百万円)
日本
タイ
29,928
インド
14,321
中国
3,630
北米
4,135
ヨーロッパ
1,283
1,457
合計
54,756
(注)売上高は顧客の所在地を基礎とし、国又は地域に分類しております。
(2)有形固定資産
(単位:百万円)
日本
タイ
5,797
インド
11,109
中国
1,422
北米
3,209
−
3.主要な顧客ごとの情報
(単位:百万円)
相手先
売上高
関連するセグメント名
いすゞ自動車株式会社
12,003
日本
三菱ふそうトラック・バス株式会社
4,197
日本
日野自動車株式会社
2,243
日本
90/122
合計
21,539
EDINET提出書類
株式会社TBK(E02201)
有価証券報告書
【報告セグメントごとの固定資産の減損損失に関する情報】
前連結会計年度(自 2024年4月1日至 2025年3月31日)
セグメント情報に同様の情報を開示しているため、記載を省略しております。
当連結会計年度(自 2025年4月1日
至
2026年3月31日)
セグメント情報に同様の情報を開示しているため、記載を省略しております。
【報告セグメントごとののれんの償却額及び未償却残高に関する情報】
該当事項はありません。
【報告セグメントごとの負ののれん発生益に関する情報】
該当事項はありません。
91/122
EDINET提出書類
株式会社TBK(E02201)
有価証券報告書
【関連当事者情報】
1.関連当事者との取引
連結財務諸表提出会社と関連当事者との取引
(ア)連結財務諸表提出会社の親会社及び主要株主(会社等の場合に限る。)等
前連結会計年度(自 2024年4月1日至 2025年3月31日)
該当事項はありません。
当連結会計年度(自
2025年4月1日
種類
会社等の名称
又は氏名
所在地
資本金又は
出資金
(百万INR)
主要株主
Brakes India
Private Limited
インド
174
至
2026年3月31日)
議決権等の所
事業の内容
有(被所有)
又は職業
割合(%)
自動車用ブ
レーキ及び
(被所有)
自動車用鋳
直接 10.1
造品の製造
及び販売
取引金額
期末残高
関連当事者
取引の内容
科目
との関係
(百万円)
(百万円)
資本業務
提携
第三者割当
増資(注)
1,137
−
−
(注)第三者割当による発行価額は、第三者割当に係る取締役会決議日の直前営業日(2025年11月20日)における東京
証券取引所スタンダード市場における当社普通株式の終値である348円及び取締役会決議日までの1ヶ月間(2025
年10月21日から2025年11月20日まで)の東京証券取引所スタンダード市場における当社普通株式の終値の平均値
である338円(小数点以下切り捨て)のうち、より高い金額である348円といたしました。
(イ)連結財務諸表提出会社の非連結子会社及び関連会社等
前連結会計年度(自 2024年4月1日至 2025年3月31日)
該当事項はありません。
当連結会計年度(自
2025年4月1日
至
2026年3月31日)
該当事項はありません。
2.親会社又は重要な関連会社に関する注記
重要な関連会社の要約財務情報
当連結会計年度において、重要な関連会社はChangchun FAWSN TBK Co., Ltd.であり、持分法による投資利益の
算定対象となった要約財務諸表は以下のとおりであります。
なお、以下の要約財務情報は前連結会計年度(自 2024年1月1日至 2024年12月31日)及び当連結会計年度
(自 2025年1月1日至 2025年12月31日)の財務諸表によっております。
(単位:百万円)
Changchun FAWSN TBK Co., Ltd.
前連結会計年度
当連結会計年度
流動資産合計
固定資産合計
7,258
5,119
11,998
4,853
流動負債合計
固定負債合計
9,932
445
14,291
405
純資産合計
1,999
2,155
売上高
税引前当期純利益又は
税引前当期純損失(△)
当期純利益又は
当期純損失(△)
16,676
21,621
△1,254
73
△1,226
85
92/122
EDINET提出書類
株式会社TBK(E02201)
有価証券報告書
(1株当たり情報)
前連結会計年度
2024年4月1日
2025年3月31日)
(自
至
当連結会計年度
2025年4月1日
2026年3月31日)
(自
至
1株当たり純資産額
991.52円
987.18円
1株当たり当期純損失
42.26円
4.44円
(注)1.潜在株式調整後1株当たり当期純利益については、1株当たり当期純損失であり、また、潜在株式が存在し
ないため記載しておりません。
2.1株当たり当期純損失の算定上の基礎は、以下のとおりであります。
前連結会計年度
2024年4月1日
2025年3月31日)
(自
至
親会社株主に帰属する当期純損失(百万円)
当連結会計年度
2025年4月1日
2026年3月31日)
(自
至
1,204
131
普通株主に帰属しない金額(百万円)
−
−
普通株式に係る親会社株主に帰属する
当期純損失(百万円)
1,204
131
期中平均株式数(千株)
28,489
29,508
3.「1株当たり純資産額」の算定上、株式給付信託(BBT)が保有する当社株式を期末発行済株式総数から控
除する自己株式に含めております(前連結会計年度末830千株、当連結会計年度末823千株)。また、株式給
付信託(BBT)が保有する当社株式を、「1株当たり当期純損失」の算定上、期中平均株式数の計算におい
て控除する自己株式に含めております(前連結会計年度831千株、当連結会計年度825千株)。
(重要な後発事象)
該当事項はありません。
⑤【連結附属明細表】
【社債明細表】
該当事項はありません。
93/122
EDINET提出書類
株式会社TBK(E02201)
有価証券報告書
【借入金等明細表】
当期首残高
(百万円)
当期末残高
(百万円)
平均利率
(%)
(注1)
5,820
6,139
2.09
−
1年以内に返済予定の長期借入金
714
571
2.11
−
1年以内に返済予定のリース債務
36
31
−
−
長期借入金(1年以内に返済予定のものを除く。)
1,336
868
1.82
2027年〜2030年
リース債務(1年以内に返済予定のものを除く。)
46
41
−
−
その他有利子負債
−
−
−
−
7,954
7,652
−
−
区分
短期借入金
合計
返済期限
(注)1.平均利率は、当連結会計年度末(2026年3月31日現在)の加重平均利率を記載しております。なお、長期借
入金は利子補給後(復興特区支援利子補給金)の利率を含めて記載しております。
2.リース債務の平均利率については、リース料総額に含まれる利息相当額を控除する前の金額でリース債務を
連結貸借対照表に計上しているため、記載しておりません。
3.長期借入金及びリース債務(1年以内に返済予定のものを除く。)の連結決算日後5年間の返済予定額は以
下のとおりであります。
1年超2年以内
(百万円)
2年超3年以内
(百万円)
3年超4年以内
(百万円)
4年超5年以内
(百万円)
長期借入金
514
235
99
20
リース債務
18
12
6
3
【資産除去債務明細表】
当連結会計年度期首及び当連結会計年度末における資産除去債務の金額が、当連結会計年度期首及び当連結会計年度
末における負債及び純資産の合計額の100分の1以下であるため、連結財務諸表規則第92条の2の規定により記載を省
略しております。
(2)【その他】
当連結会計年度における半期情報等
中間連結会計期間
売上高(百万円)
当連結会計年度
25,855
54,756
税金等調整前中間(当期)
純利益(百万円)
613
925
親会社株主に帰属する中間純利益又は
親会社株主に帰属する当期純損失(△)
(百万円)
272
△131
1株当たり中間純利益又は
1株当たり当期純損失(△)(円)
9.58
△4.44
94/122
EDINET提出書類
株式会社TBK(E02201)
有価証券報告書
2【財務諸表等】
(1)【財務諸表】
①【貸借対照表】
(単位:百万円)
前事業年度
(2025年3月31日)
資産の部
流動資産
現金及び預金
電子記録債権
売掛金
棚卸資産
前払費用
未収入金
未収還付法人税等
関係会社短期貸付金
その他
流動資産合計
固定資産
有形固定資産
建物
構築物
機械及び装置
車両運搬具
工具、器具及び備品
土地
建設仮勘定
有形固定資産合計
無形固定資産
ソフトウエア
その他
無形固定資産合計
投資その他の資産
投資有価証券
関係会社株式
関係会社社債
関係会社出資金
関係会社長期貸付金
前払年金費用
その他
貸倒引当金
投資その他の資産合計
固定資産合計
繰延資産
株式交付費
繰延資産合計
資産合計
95/122
当事業年度
(2026年3月31日)
1,234
326
※3 6,245
※4 2,597
64
※3 488
23
262
2
11,246
3,068
300
※3 5,852
※4 2,624
85
※3 215
23
221
9
12,399
※1 978
※1 897
※1 77
※1 106
※1 1,603
※1 1,687
55
41
※1 401
※1 355
※1 1,078
※1 1,078
656
4,850
684
4,851
※1 118
※1 160
11
130
11
171
3,359
3,933
683
2,097
3,957
−
100
△3,023
11,108
16,089
3,721
3,933
683
1,733
1,805
5
87
△31
11,939
16,962
−
−
27,336
23
23
29,384
EDINET提出書類
株式会社TBK(E02201)
有価証券報告書
(単位:百万円)
前事業年度
(2025年3月31日)
負債の部
流動負債
支払手形
電子記録債務
買掛金
短期借入金
1年内返済予定の長期借入金
リース債務
未払金
未払費用
未払法人税等
預り金
賞与引当金
役員賞与引当金
製品保証引当金
役員株式給付引当金
設備関係支払手形
その他
流動負債合計
固定負債
長期借入金
リース債務
繰延税金負債
退職給付引当金
資産除去債務
その他
固定負債合計
負債合計
純資産の部
株主資本
資本金
資本剰余金
資本準備金
その他資本剰余金
資本剰余金合計
利益剰余金
利益準備金
その他利益剰余金
固定資産圧縮積立金
特別償却準備金
別途積立金
繰越利益剰余金
利益剰余金合計
自己株式
株主資本合計
評価・換算差額等
その他有価証券評価差額金
土地再評価差額金
評価・換算差額等合計
純資産合計
負債純資産合計
96/122
当事業年度
(2026年3月31日)
11
2,213
※3 1,486
3,010
302
32
※3 384
254
49
38
456
−
12
68
130
30
8,483
4
1,288
※3 1,677
3,790
280
29
※3 954
353
21
28
472
7
13
99
135
31
9,186
809
41
257
2,181
13
1
3,303
11,786
629
37
642
2,109
13
1
3,434
12,621
4,617
5,186
250
0
250
818
0
819
650
674
6
0
2,000
6,956
9,614
△409
14,072
6
−
2,000
6,783
9,463
△407
15,062
1,457
20
1,477
15,549
27,336
1,681
20
1,701
16,763
29,384
EDINET提出書類
株式会社TBK(E02201)
有価証券報告書
②【損益計算書】
(単位:百万円)
(自
至
前事業年度
2024年4月1日
2025年3月31日)
(自
至
当事業年度
2025年4月1日
2026年3月31日)
売上高
※1 25,156
※1 27,569
売上原価
売上総利益
※1 23,856
※1 25,579
1,300
※1,※2 1,706
※1,※2 2,111
△405
△121
※1 105
※1 54
※1 811
※1 733
5
−
※1 23
0
49
※1 27
946
865
※1 51
※1 41
16
257
15
340
199
−
−
26
67
675
−
1
1
※3 357
販売費及び一般管理費
営業損失(△)
営業外収益
受取利息
受取配当金
助成金収入
為替差益
その他
営業外収益合計
営業外費用
支払利息
支払手数料
為替差損
その他
営業外費用合計
経常利益
特別利益
貸倒引当金戻入額
固定資産売却益
特別利益合計
特別損失
固定資産廃棄損
減損損失
関係会社出資金評価損
関係会社出資金売却損
10
11
※4 712
※5 86
−
※6 19
−
1,580
△1,380
△63
△210
△273
△1,106
97/122
0
357
※4 126
※7 1,358
貸倒引当金繰入額
特別損失合計
税引前当期純利益又は税引前当期純損失(△)
法人税、住民税及び事業税
法人税等調整額
法人税等合計
当期純利益又は当期純損失(△)
1,989
−
742
291
△44
258
213
77
EDINET提出書類
株式会社TBK(E02201)
有価証券報告書
③【株主資本等変動計算書】
前事業年度(自 2024年4月1日
至
2025年3月31日)
(単位:百万円)
株主資本
資本剰余金
資本金
その
資本準備金他
資
本剰余金
当期首残高
4,617
250
0
利益剰余金
資本剰余
金
利益準備金固定資産
合
計
圧縮積立
金
250
624
7
その他利益剰余金
特別償
繰越利
却
準別途積立金益
剰
備金
余金
1
2,000
利益剰余
金
合
計
8,343
10,977
△26
−
0
−
1
−
剰余金の配当
△256
△256
当期純損失
△1,106
△1,106
当期変動額
利益準備金の積立
26
圧縮積立金の取崩
△0
特別償却準備金の取崩
△1
自己株式の取得
自己株式の処分
株主資本以外の項目の
当期変動額(純額)
当期変動額合計
当期末残高
−
−
−
−
26
△0
△1
−
△1,386
△1,362
4,617
250
0
250
650
6
0
2,000
6,956
9,614
自己株式
株主資
本
合
計
そ の
他
有
価証
券
評
価差額金
△419
15,424
1,498
株主資本
当期首残高
評価・換算差額等
評価・換純資産合計
土地再評
算差額等
価差額金
合計
20
1,518
16,943
当期変動額
利益準備金の積立
−
−
圧縮積立金の取崩
−
−
特別償却準備金の取崩
−
−
剰余金の配当
△256
△256
当期純損失
△1,106
△1,106
自己株式の取得
△0
△0
△0
自己株式の処分
10
10
10
株主資本以外の項目の
当期変動額(純額)
当期変動額合計
当期末残高
△41
△41
△41
10
△1,352
△41
−
△41
△1,393
△409
14,072
1,457
20
1,477
15,549
98/122
EDINET提出書類
株式会社TBK(E02201)
有価証券報告書
当事業年度(自
2025年4月1日
至
2026年3月31日)
(単位:百万円)
株主資本
資本剰余金
資本金
当期首残高
その
資本準備金他
資
本剰余金
4,617
250
568
568
0
利益剰余金
資本剰余
金
利益準備金固定資産
合
計
圧縮積立
金
250
650
6
その他利益剰余金
特別償
繰越利
却
準別途積立金益
剰
備金
余金
0
2,000
6,956
利益剰余
金
合
計
9,614
当期変動額
新株の発行
568
利益準備金の積立
−
23
圧縮積立金の取崩
△0
特別償却準備金の取崩
△0
剰余金の配当
当期純利益
△23
−
0
−
0
−
△227
△227
77
77
自己株式の取得
自己株式の処分
株主資本以外の項目の
当期変動額(純額)
当期変動額合計
当期末残高
568
568
−
568
23
△0
△0
−
△173
△150
5,186
818
0
819
674
6
−
2,000
6,783
9,463
自己株式
株主資
本
合
計
そ の
他
有
価証
券
評
価差額金
△409
14,072
1,457
株主資本
当期首残高
評価・換算差額等
評価・換純資産合計
土地再評
算差額等
価差額金
合計
20
1,477
15,549
当期変動額
新株の発行
1,137
1,137
利益準備金の積立
−
−
圧縮積立金の取崩
−
−
特別償却準備金の取崩
−
−
△227
△227
77
77
剰余金の配当
当期純利益
自己株式の取得
△0
△0
△0
自己株式の処分
3
3
3
株主資本以外の項目の
当期変動額(純額)
当期変動額合計
当期末残高
224
224
224
2
990
224
−
224
1,214
△407
15,062
1,681
20
1,701
16,763
99/122
EDINET提出書類
株式会社TBK(E02201)
有価証券報告書
【注記事項】
(重要な会計方針)
1.資産の評価基準及び評価方法
(1)有価証券の評価基準及び評価方法
子会社株式及び関連会社株式……移動平均法による原価法
その他有価証券
市場価格のない株式等以外のもの
………………………時価法(評価差額は、全部純資産直入法により処理し、売却原価は、移動平均法により
算定)
市場価格のない株式等
………………………移動平均法による原価法
(2)棚卸資産の評価基準及び評価方法
棚卸資産………………先入先出法による原価法(貸借対照表価額は収益性の低下に基づく簿価切下げの方法によ
り算定)
2.固定資産の減価償却の方法
(1)有形固定資産
リース資産以外
定額法
主な耐用年数は以下のとおりであります。
建物
3〜38年
構築物
7〜45年
機械及び装置
2〜9年
車両運搬具
2〜6年
工具、器具及び備品
2〜20年
取得価額が10万円以上20万円未満の資産については3年間で均等償却する方法を採用
リース資産
(2)無形固定資産
リース資産以外
リース資産
3.繰延資産の処理方法
株式交付費
しております。
所有権移転外ファイナンス・リース取引に係るリース資産
リース期間を耐用年数とし、残存価額を零とする定額法を採用しております。
定額法
自社利用のソフトウエアについては、社内における利用可能期間(5年)に基づいてお
ります。
所有権移転外ファイナンス・リース取引に係るリース資産
リース期間を耐用年数とし、残存価額を零とする定額法を採用しております。
原則として支出時に全額費用処理しております。ただし、繰延資産に計上した場合に
は、定額法により償却しております。
100/122
EDINET提出書類
株式会社TBK(E02201)
有価証券報告書
4.引当金の計上基準
(1)貸倒引当金
売上債権、貸付金等の貸倒損失に備えるため、一般債権については貸倒実績率により、貸倒懸念債権等特定の債
権については個別に回収可能性を勘案し、回収不能見込額を計上しております。
(2)賞与引当金
従業員に対して支給する賞与の支出に充てるため、賞与支給見込額の当事業年度負担額を計上しております。
(3)役員賞与引当金
役員に対して支給する賞与の支出に充てるため、賞与支給見込額の当事業年度負担額を計上しております。
(4)製品保証引当金
製品の品質保証による将来の支出に備えるため、過去の実績に基づいて算出した見積額及び個別の案件を勘案し
て算出した発生見込額を計上しております。
(5)役員株式給付引当金
役員株式給付規則に基づく役員への当社株式の給付に備えるため、当事業年度における株式給付債務の支給見込
額に基づき計上しております。
(6)退職給付引当金
従業員の退職給付に備えるため、当事業年度末における退職給付債務及び年金資産の見込額に基づき計上してお
ります。
なお、退職給付見込額を当事業年度までの期間に帰属させる方法については、給付算定式基準によっておりま
す。
過去勤務費用は、その発生時の従業員の平均残存勤務期間以内の一定の年数(10年)による定額法により費用処
理しております。
数理計算上の差異は、各事業年度の発生時における従業員の平均残存勤務期間以内の一定の年数(10年)による
定額法により、それぞれ発生の翌事業年度から費用処理しております。
5.収益及び費用の計上基準
当社では、主に完成した製品を顧客に供給することを履行義務として認識しております。
国内販売においては、原則として製品の納入時点において支配が顧客に移転して履行義務が充足されると判断して
いることから、当時点において収益を認識しておりますが、出荷時から顧客による検収時までの期間が通常の期間で
ある場合には、出荷時に収益を認識しております。輸出販売においては、主にインコタームズ等で定められた貿易条
件に基づきリスク負担が顧客に移転した時に収益と認識することとしております。
関係会社から収受しているロイヤルティにつきましては、関係会社の売上高を計上する時に収益を認識しておりま
す。取引の対価は、履行義務を充足してから主として1年以内に受領しており、重大な金融要素は含んでおりませ
ん。
6.その他財務諸表作成のための基本となる重要な事項
退職給付に係る会計処理
退職給付に係る未認識数理計算上の差異及び未認識過去勤務費用の未処理額の会計処理の方法は、連結財務諸表に
おけるこれらの会計処理の方法と異なっております。
101/122
EDINET提出書類
株式会社TBK(E02201)
有価証券報告書
(重要な会計上の見積り)
会計上の見積りは、財務諸表作成時に入手可能な情報に基づいて合理的な金額を算出しております。当事業年
度の財務諸表に計上した金額が会計上の見積りによるもののうち、翌事業年度の財務諸表に重要な影響を及ぼす
リスクがある項目は以下の通りです。
1.繰延税金資産の回収可能性
(1) 当事業年度の財務諸表に計上した金額
(単位:百万円)
前事業年度
当事業年度
繰延税金負債(純額)
257
642
繰延税金負債(資産)と相殺前の金額
396
131
4,526
3,740
評価性引当額
(2) 会計上の見積りの内容について財務諸表利用者の理解に資するその他の情報
連結財務諸表の「注記事項(重要な会計上の見積り)1.繰延税金資産の回収可能性」に同一の内容を記
載しているため、注記を省略しております。
2.固定資産の減損
(1) 当事業年度の財務諸表に計上した金額
(単位:百万円)
前事業年度
減損損失
当事業年度
126
712
有形固定資産
4,850
4,851
無形固定資産
130
171
(2) 会計上の見積りの内容について財務諸表利用者の理解に資するその他の情報
① 当事業年度の財務諸表に計上した金額の算出方法
当社は、主に管理会計上の区分(会社別)を基準としてグルーピングを行っており、また、処分予定資
産、事業の再編成に係る資産、並びに遊休資産については個々にグルーピングを行っております。当社
は、固定資産のうち減損の兆候がある資産又は資産グループについて、当該資産又は資産グループから得
られる割引前将来キャッシュ・フローの総額と帳簿価額を比較し、減損損失を認識するべきであると判定
された資産又は資産グループは、帳簿価額を回収可能価額(正味売却価額又は使用価値のいずれか高い価
額)まで減額し、当該減少額を減損損失として計上しております。
② 当事業年度の財務諸表に計上した金額の算出に用いた主要な仮定
当社は、継続して営業損失が計上されており、減損の兆候を認識していますが、割引前将来キャッ
シュ・フローが帳簿価額を下回っているため、帳簿価額を回収可能価額まで減額し、当該減少額を減損損
失として計上しております。回収可能価額には正味売却価額を使用しております。
土地等の不動産の正味売却価額については、主として不動産鑑定評価基準に基づいて算定した価額に
よっており、不動産鑑定評価の算定に用いる評価手法、前提条件や基礎データが重要な影響を及ぼしま
す。
③ 翌事業年度の財務諸表に与える影響
将来の不確実な経済条件の変動により正味売却価額に利用した不動産鑑定評価額等に下落が生じた場合
には、翌事業年度において固定資産の評価に重要な影響を及ぼす可能性があります。
(追加情報)
(株式給付信託(BBT))
連結財務諸表の「注記事項(追加情報)」に同一の内容を記載しているため、注記を省略しております。
102/122
EDINET提出書類
株式会社TBK(E02201)
有価証券報告書
(貸借対照表関係)
固定資産の圧縮記帳
補助金収入の受入れに伴い、有形固定資産及び無形固定資産の取得価額から直接控除している圧縮記帳額の内訳は、
次のとおりであります。
※1
前事業年度
(2025年3月31日)
建物
構築物
機械及び装置
工具、器具及び備品
土地
ソフトウエア
計
当事業年度
(2026年3月31日)
173百万円
7
1,006
7
7
4
173百万円
7
1,006
7
7
4
1,206
1,206
2
保証債務
次の関係会社等について、金融機関からの借入に対し債務保証を行っております。
前事業年度
(2025年3月31日)
当事業年度
(2026年3月31日)
TBK India Private Ltd.
74百万円
−百万円
Full Win Developments Ltd.
210
210
計
284
210
※3
関係会社に対する金銭債権及び金銭債務(区分表示したものを除く)
前事業年度
(2025年3月31日)
短期金銭債権
短期金銭債務
※4
1,566百万円
233
当事業年度
(2026年3月31日)
1,227百万円
568
棚卸資産の内訳は、次のとおりであります。
前事業年度
(2025年3月31日)
商品及び製品
402百万円
640
仕掛品
原材料及び貯蔵品
1,554
103/122
当事業年度
(2026年3月31日)
437百万円
598
1,588
EDINET提出書類
株式会社TBK(E02201)
有価証券報告書
(損益計算書関係)
関係会社との取引高
※1
(自
至
前事業年度
2024年4月1日
2025年3月31日)
(自
至
当事業年度
2025年4月1日
2026年3月31日)
営業取引による取引高
売上高
仕入高
3,497百万円
2,622
営業取引以外の取引による取引高
3,546百万円
3,060
763
642
※2
販売費に属する費用のおおよその割合は前事業年度15%、当事業年度15%、一般管理費に属する費用のおおよその
割合は前事業年度85%、当事業年度85%であります。
販売費及び一般管理費のうち主要な費目及び金額は次のとおりであります。
(自
至
前事業年度
2024年4月1日
2025年3月31日)
運搬費
(自
至
当事業年度
2025年4月1日
2026年3月31日)
役員報酬・従業員給料・賞与
247百万円
666
249百万円
676
賞与引当金繰入額
59
54
役員賞与引当金繰入額
−
7
役員株式給付引当金繰入額
16
33
退職給付費用
45
31
福利厚生費
106
103
支払手数料
217
415
製品保証引当金繰入額
15
17
減価償却費
21
35
賃借料
37
39
※3
貸倒引当金戻入額
前事業年度(自 2024年4月1日
該当事項はありません。
至
2025年3月31日)
当事業年度(自 2025年4月1日至 2026年3月31日)
貸倒引当金戻入額は、TBK America, Inc.の清算結了に伴う戻入益295百万円及び、木村可鍛の収益が回復したことに
よる取崩62百万円によるものであります。
104/122
EDINET提出書類
株式会社TBK(E02201)
有価証券報告書
※4
減損損失
前事業年度(自 2024年4月1日至 2025年3月31日)
(1) 減損損失を認識した主な資産グループの概要
用途
種類
機械及び装置
その他
事業用資産
場所
福島県石川郡玉川村
(2) 減損損失の認識に至った経緯
当事業年度において、事業用資産が将来に生み出すキャッシュ・フローの総額が帳簿価額を下回ることから、帳簿
価額を回収可能価額まで減額し、当該減少額を減損損失として特別損失に計上しました。
(3) 減損損失の金額及び主な固定資産の種類ごとの当該金額の内訳
(単位:百万円)
種類
金額
場所
機械及び装置
107
福島県石川郡玉川村
その他
19
計
126
(4) 資産のグルーピングの方法
当社グループは、主に管理会計上の区分(会社別)を基準としてグルーピングを行っております。
また、処分予定資産、事業の再編成に係る資産、並びに遊休資産については個々にグルーピングを行っておりま
す。
(5) 回収可能価額の算定方法
事業用資産の回収可能価額は、正味売却価額により測定しており、市場価値を勘案した合理的な見積りにより算定
しております。
当事業年度(自 2025年4月1日至 2026年3月31日)
(1) 減損損失を認識した主な資産グループの概要
用途
事業用資産
種類
機械及び装置
建設仮勘定
工具、器具及び備品
ソフトウエア
場所
福島県石川郡玉川村
山形県鶴岡市
東京都町田市
(2) 減損損失の認識に至った経緯
当事業年度において、事業用資産が将来に生み出すキャッシュ・フローの総額が帳簿価額を下回ることから、帳簿
価額を回収可能価額まで減額し、当該減少額を減損損失として特別損失に計上しました。
(3) 減損損失の金額及び主な固定資産の種類ごとの当該金額の内訳
(単位:百万円)
種類
金額
場所
機械及び装置
428
福島県石川郡玉川村
建設仮勘定
154
山形県鶴岡市
工具、器具及び備品
90
ソフトウエア
40 東京都町田市
計
712
(4) 資産のグルーピングの方法
当社グループは、主に管理会計上の区分(会社別)を基準としてグルーピングを行っております。
また、処分予定資産、事業の再編成に係る資産、並びに遊休資産については個々にグルーピングを行っておりま
す。
(5) 回収可能価額の算定方法
事業用資産の回収可能価額は、正味売却価額により測定しており、市場価値を勘案した合理的な見積りにより算定
しております。
105/122
EDINET提出書類
株式会社TBK(E02201)
有価証券報告書
※5
関係会社出資金評価損
前事業年度(自 2024年4月1日至 2025年3月31日)
関係会社出資金評価損は、当社の持分法適用関連会社であるChangchun FAWSN TBK Co., Ltd.の出資金を減損処理し
たことによるものであります。
当事業年度(自 2025年4月1日
該当事項はありません。
関係会社出資金売却損
前事業年度(自 2024年4月1日
該当事項はありません。
至
2026年3月31日)
至
2025年3月31日)
※6
当事業年度(自 2025年4月1日至 2026年3月31日)
関係会社出資金売却損は、当社の持分法適用関連会社であるChangchun FAWSN TBK Co., Ltd.の出資金を一部売却し
たことによるものであります。
※7
貸倒引当金繰入額
前事業年度(自 2024年4月1日至 2025年3月31日)
貸倒引当金繰入額は、TBK America, Inc.等への貸付金に対するものであります。
当事業年度(自 2025年4月1日
該当事項はありません。
至
2026年3月31日)
(有価証券関係)
子会社株式及び関連会社株式
前事業年度(2025年3月31日)
市場価格のない株式等の貸借対照表計上額
区分
前事業年度
(百万円)
子会社株式
3,932
関連会社株式
1
当事業年度(2026年3月31日)
市場価格のない株式等の貸借対照表計上額
区分
当事業年度
(百万円)
子会社株式
3,932
関連会社株式
1
106/122
EDINET提出書類
株式会社TBK(E02201)
有価証券報告書
(税効果会計関係)
1.繰延税金資産及び繰延税金負債の発生の主な原因別の内訳
前事業年度
(2025年3月31日)
当事業年度
(2026年3月31日)
繰延税金資産
未払事業税
12百万円
貸倒引当金損金不算入額
931
9
賞与引当金損金不算入額
136
145
工場集約統合費用損金不算入額
370
370
退職給付引当金損金不算入額
667
648
製品保証引当金損金不算入額
減損損失否認
関係会社株式評価損否認
2百万円
3
4
456
490
1,323
585
655
1,458
税務上の繰越欠損金
572
156
繰延税金資産小計
その他
5,130
3,871
再評価に係る繰延税金負債との相殺額
△207
−
△655
△1,458
税務上の繰越欠損金に係る評価性引当額
△3,871
△2,282
評価性引当額小計
将来減算一時差異等の合計に係る評価性引当額
△4,526
△3,740
繰延税金資産合計
396
131
その他有価証券評価差額金
622
748
連結納税適用に伴う固定資産等時価評価損
28
22
圧縮記帳積立金
3
2
特別償却準備金
0
−
繰延税金負債
繰延税金負債合計
繰延税金資産(△は負債)の純額
654
773
△257
△642
2.法定実効税率と税効果会計適用後の法人税等の負担率との間に重要な差異があるときの、当該差異の原因となった
主要な項目別の内訳
前事業年度
当事業年度
(2025年3月31日)
(2026年3月31日)
法定実効税率
−%
29.9%
(調整)
受取配当金等永久に益金に算入されない項目
−
交際費等永久に損金に算入されない項目
−
6.1
評価性引当額の増減
−
49.5
住民税均等割
−
4.4
外国源泉税
−
19.5
法定実効税率の見直しによる影響
−
20.4
その他
−
4.8
△61.2
税効果会計適用後の法人税等の負担率
−
73.3
(注)前事業年度は、税引前当期純損失を計上しているため記載を省略しております。
3.法人税及び地方法人税の会計処理又はこれらに関する税効果会計の会計処理
当社は、グループ通算制度を適用しております。また、「グループ通算制度を適用する場合の会計処理及び開示に
関する取扱い」(実務対応報告第42号 2021年8月12日)に従って、法人税及び地方法人税の会計処理又はこれらに
関する税効果会計の会計処理並びに開示を行っております。
107/122
EDINET提出書類
株式会社TBK(E02201)
有価証券報告書
(収益認識関係)
顧客との契約から生じる収益を理解するための基礎となる情報
当社は、商用車メーカー、建機・産機メーカー等を主な顧客としており、制動装置(ブレーキ)、エンジン用
ウォーターポンプ、オイルポンプ等の製造・販売を行っております。また、当社の知的財産に関するライセンスを
含む製品を販売することにより生じるロイヤルティ収入が生じております。
当該履行義務にかかる収益を認識する時点は、注記事項5.収益及び費用の計上基準に記載のとおりでありま
す。
(重要な後発事象)
該当事項はありません。
108/122
EDINET提出書類
株式会社TBK(E02201)
有価証券報告書
④【附属明細表】
【有形固定資産等明細表】
(単位:百万円)
区
当期首
残高
当期
増加額
当期
減少額
当期末
残高
減価償却
累計額
当期
償却額
差引期末
帳簿価額
建物
8,835
50
19
8,866
7,968
126
897
構築物
1,339
30
3
1,366
1,259
1
106
168
[428]
1,687
分
資産の種類
有形
固定資産
機械及び装置
車両運搬具
無形
固定資産
繰延資産
24,176
686
601
24,261
22,573
186
4
17
173
132
18
41
355
工具、器具及び備品
7,277
308
121
7,464
7,109
264
[90]
土地
1,078
−
−
1,078
−
−
1,078
建設仮勘定
656
1,382
684
−
−
684
計
43,549
2,462
43,894
39,043
ソフトウエア
931
131
1
1,061
901
その他
11
10
10
11
−
−
11
計
942
141
12
1,072
901
50
[40]
171
株式交付費
−
23
−
23
−
−
23
1,354
[154]
2,117
[154]
578
[518]
50
[40]
4,851
160
(注)1.「機械及び装置」の「当期増加額」の主なものは、ブレーキ用製造設備の取得によるものであります。
2.「工具、器具及び備品」の「当期増加額」の主なものは、ブレーキ用金型の取得によるものであります。
3.「建設仮勘定」の「当期増加額」の主なものは、ブレーキ用製造設備の取得によるものであります。
4.「機械及び装置」の「当期減少額」の主なものは、ブレーキ用製造設備の処分によるものであります。
5.「建設仮勘定」の「当期減少額」の主なものは、固定資産本勘定への振替によるものであります。
6.「当期首残高」及び「当期末残高」については、取得価額により記載しております。
7.「当期償却額」及び「当期減少額」の[ ]内は、減損損失の計上額であります。
8.「減価償却累計額」には、減損損失累計額が含まれております。
【引当金明細表】
(単位:百万円)
科
目
当期首残高
当期減少額
当期増加額
当期末残高
貸倒引当金
3,023
−
2,992
31
賞与引当金
456
472
456
472
役員賞与引当金
−
7
−
7
製品保証引当金
12
34
33
13
役員株式給付引当金
68
33
3
99
2,181
192
263
2,109
退職給付引当金
(2)【主な資産及び負債の内容】
連結財務諸表を作成しているため、記載を省略しております。
(3)【その他】
該当事項はありません。
109/122
EDINET提出書類
株式会社TBK(E02201)
有価証券報告書
第6【提出会社の株式事務の概要】
事業年度
4月1日から3月31日まで
定時株主総会
6月中
基準日
3月31日
剰余金の配当の基準日
1単元の株式数
9月30日
3月31日
100株
単元未満株式の買取り・売渡し
取扱場所
(特別口座)
東京都千代田区丸の内一丁目4番5号
三菱UFJ信託銀行株式会社証券代行部
株主名簿管理人
(特別口座)
東京都千代田区丸の内一丁目4番5号
三菱UFJ信託銀行株式会社
取次所
―
買取・売渡手数料
株式の売買の委託に係る手数料相当額として別途定める金額
公告掲載方法
当社の公告方法は、電子公告とする。ただし、事故その他やむを得ない事
由によって電子公告による公告をすることができない場合は、日本経済新
聞に掲載して行う。
なお、電子公告は当社のホームページに掲載しており、そのアドレスは次
のとおりであります。
https://www.tbk-jp.com/
毎年3月31日を基準日とし、1単元(100株)以上の当社株式を1年以上
継続保有している株主様に対し、下表のとおり、所有株式数に応じて贈呈
させていただきます。
所有株式数
株主に対する特典
優待内容
100株以上
500株未満
クオカード(500円相当)
500株以上
1,000株未満
山形県産お米「つや姫」
2.0kg
山形県産お米「つや姫」
5.0kg
1,000株以上
(注)当社定款の定めにより、単元未満株主は、会社法第189条第2項各号に掲げる権利、会社法第166条第1項の規定に
よる請求をする権利、株主の有する株式数に応じて募集株式の割当て及び募集新株予約権の割当てを受ける権利
並びに単元未満株式の売渡請求をする権利以外の権利を有しておりません。
110/122
EDINET提出書類
株式会社TBK(E02201)
有価証券報告書
第7【提出会社の参考情報】
1【提出会社の親会社等の情報】
当社は、金融商品取引法第24条の7第1項に規定する親会社等はありません。
2【その他の参考情報】
当事業年度の開始日から有価証券報告書提出日までの間に、次の書類を提出しております。
(1)有価証券報告書及びその添付書類並びに確認書
事業年度(第89期)(自 2024年4月1日至 2025年3月31日)2025年6月24日関東財務局長に提出
(2)有価証券報告書の訂正報告書及びその添付書類並びに確認書
2025年7月2日関東財務局長に提出
事業年度(第89期)(自 2024年4月1日至 2025年3月31日)の有価証券報告書に係る訂正報告書及びその添
付書類並びに確認書であります。
(3)内部統制報告書及びその添付書類
2025年6月24日関東財務局長に提出
(4)半期報告書及び確認書
(第90期)(自 2025年4月1日至 2025年9月30日)2025年11月14日関東財務局長に提出
(5)臨時報告書
2025年7月1日関東財務局長に提出
企業内容等の開示に関する内閣府令第19条第2項第9号の2(株主総会における議決権行使の結果)に基づく臨時
報告書であります。
2025年11月21日関東財務局長に提出
金融商品取引法第24条の5第4項及び企業内容等の開示に関する内閣府令第19条第2項第12号の3の規定に基づく
臨時報告書であります。
2025年12月9日関東財務局長に提出
金融商品取引法第24条の5第4項及び企業内容等の開示に関する内閣府令第19条第2項第4号の規定に基づく臨時
報告書であります。
(6)有価証券届出書(第三者割当増資)及びその添付書類
2025年11月21日関東財務局長に提出
111/122
EDINET提出書類
株式会社TBK(E02201)
有価証券報告書
第二部【提出会社の保証会社等の情報】
該当事項はありません。
112/122
EDINET提出書類
株式会社TBK(E02201)
有価証券報告書
独立監査人の監査報告書及び内部統制監査報告書
2026年6月25日
株式会社TBK
取締役会御中
有限責任 あずさ監査法人
東京事務所
指定有限責任社員
公認会計士
業務執行社員
永
指定有限責任社員
公認会計士
業務執行社員
宇田川
井
勝
顕
悟
<連結財務諸表監査>
監査意見
当監査法人は、金融商品取引法第193条の2第1項の規定に基づく監査証明を行うため、「経理の状
況」に掲げられている株式会社TBKの2025年4月1日から2026年3月31日までの連結会計年度の連結
財務諸表、すなわち、連結貸借対照表、連結損益計算書、連結包括利益計算書、連結株主資本等変動計
算書、連結キャッシュ・フロー計算書、連結財務諸表作成のための基本となる重要な事項、その他の注
記及び連結附属明細表について監査を行った。
当監査法人は、上記の連結財務諸表が、我が国において一般に公正妥当と認められる企業会計の基準
に準拠して、株式会社TBK及び連結子会社の2026年3月31日現在の財政状態並びに同日をもって終了
する連結会計年度の経営成績及びキャッシュ・フローの状況を、全ての重要な点において適正に表示し
ているものと認める。
監査意見の根拠
当監査法人は、我が国において一般に公正妥当と認められる監査の基準に準拠して監査を行った。監
査の基準における当監査法人の責任は、「連結財務諸表監査における監査人の責任」に記載されてい
る。当監査法人は、我が国における職業倫理に関する規定(社会的影響度の高い事業体の財務諸表監査
に適用される規定を含む。)に従って、会社及び連結子会社から独立しており、また、監査人としての
その他の倫理上の責任を果たしている。当監査法人は、意見表明の基礎となる十分かつ適切な監査証拠
を入手したと判断している。
113/122
EDINET提出書類
株式会社TBK(E02201)
有価証券報告書
監査上の主要な検討事項
監査上の主要な検討事項とは、当連結会計年度の連結財務諸表の監査において、監査人が職業的専門
家として特に重要であると判断した事項である。監査上の主要な検討事項は、連結財務諸表全体に対す
る監査の実施過程及び監査意見の形成において対応した事項であり、当監査法人は、当該事項に対して
個別に意見を表明するものではない。
株式会社TBKの固定資産の減損損失の測定に用いられた正味売却価額の見積りの合理性
監査上の主要な検討事項の内容及び決定理由
監査上の対応
株式会社TBKの当連結会計年度の連結損益計算当監査法人は、株式会社TBKの固定資産の減損
書において、減損損失712百万円が計上されてい
損失の測定に用いられた正味売却価額の見積りの合
る。これは、株式会社TBKの固定資産について認理性を評価するため、主に以下の手続を実施した。
識された減損損失である。なお、注記事項「(重要
な会計上の見積り)2.固定資産の減損」に記載さ
(1) 内部統制の評価
れているとおり、当連結会計年度末時点で上記の減
固定資産の減損に関連する内部統制の整備状況及
損損失計上後の有形固定資産4,851百万円及び無形
び運用状況の有効性を評価した。
固定資産171百万円が株式会社TBKの固定資産と
して計上されており、それらの合計金額は連結総資 (2) 正味売却価額の見積りの合理性の評価
不動産の正味売却価額の基礎となる不動産鑑定評
産の8%を占めている。
価額について、当監査法人内の専門家を利用して、
株式会社TBKは主に管理会計上の区分(会社主に以下について検討した。
別)を基準として資産のグルーピングを行ってい
る。減損の兆候があると認められる場合には、資産・経営者が利用した不動産鑑定士の適性、能力及
び客観性を評価した。
グループから得られる割引前将来キャッシュ・フ
ローの総額と帳簿価額を比較することによって、減・不動産鑑定評価額の検討において、不動産鑑定
損損失の認識の要否を判定する。判定の結果、減損
評価書の閲覧及び経営者が利用した不動産鑑定
損失の認識が必要と判定された場合、帳簿価額を回
士への質問を行い、鑑定評価額の算定に用いた
収可能価額まで減額し、帳簿価額の減少額は減損損
前提条件や採用した評価手法及びそれに基づく
失として認識される。
算定結果について検討した。
株式会社TBKでは、継続的に営業損益がマイナ
スとなっており、固定資産に減損の兆候があると認
められることから、当連結会計年度において減損損
失の認識の要否の判定が行われている。判定の結
果、見積もられた割引前将来キャッシュ・フローの
総額が資産の帳簿価額を下回ったことから、資産の
帳簿価額が回収可能価額まで減額され、当該減少額
712百万円が減損損失として計上されている。回収
可能価額には正味売却価額が用いられており、主要
な不動産に関しては不動産鑑定士が算定した不動産
鑑定評価額を基に算定した金額を正味売却価額とし
て使用しているが、不動産鑑定評価額の算定に用い
た前提条件や採用した評価手法が正味売却価額の算
定に重要な影響を及ぼす。
以上から、当監査法人は、株式会社TBKの固定
資産の減損損失の測定に用いられた正味売却価額の
見積りの合理性が、当連結会計年度の連結財務諸表
監査において特に重要であり、監査上の主要な検討
事項に該当すると判断した。
114/122
EDINET提出書類
株式会社TBK(E02201)
有価証券報告書
その他の記載内容
その他の記載内容は、有価証券報告書に含まれる情報のうち、連結財務諸表及び財務諸表並びにこれ
らの監査報告書以外の情報である。経営者の責任は、その他の記載内容を作成し開示することにある。
また、監査役及び監査役会の責任は、その他の記載内容の報告プロセスの整備及び運用における取締役
の職務の執行を監視することにある。
当監査法人の連結財務諸表に対する監査意見の対象にはその他の記載内容は含まれておらず、当監査
法人はその他の記載内容に対して意見を表明するものではない。
連結財務諸表監査における当監査法人の責任は、その他の記載内容を通読し、通読の過程において、
その他の記載内容と連結財務諸表又は当監査法人が監査の過程で得た知識との間に重要な相違があるか
どうか検討すること、また、そのような重要な相違以外にその他の記載内容に重要な誤りの兆候がある
かどうか注意を払うことにある。
当監査法人は、実施した作業に基づき、その他の記載内容に重要な誤りがあると判断した場合には、
その事実を報告することが求められている。
その他の記載内容に関して、当監査法人が報告すべき事項はない。
連結財務諸表に対する経営者並びに監査役及び監査役会の責任
経営者の責任は、我が国において一般に公正妥当と認められる企業会計の基準に準拠して連結財務諸
表を作成し適正に表示することにある。これには、不正又は誤謬による重要な虚偽表示のない連結財務
諸表を作成し適正に表示するために経営者が必要と判断した内部統制を整備及び運用することが含まれ
る。
連結財務諸表を作成するに当たり、経営者は、継続企業の前提に基づき連結財務諸表を作成すること
が適切であるかどうかを評価し、我が国において一般に公正妥当と認められる企業会計の基準に基づい
て継続企業に関する事項を開示する必要がある場合には当該事項を開示する責任がある。
監査役及び監査役会の責任は、財務報告プロセスの整備及び運用における取締役の職務の執行を監視
することにある。
連結財務諸表監査における監査人の責任
監査人の責任は、監査人が実施した監査に基づいて、全体としての連結財務諸表に不正又は誤謬によ
る重要な虚偽表示がないかどうかについて合理的な保証を得て、監査報告書において独立の立場から連
結財務諸表に対する意見を表明することにある。虚偽表示は、不正又は誤謬により発生する可能性があ
り、個別に又は集計すると、連結財務諸表の利用者の意思決定に影響を与えると合理的に見込まれる場
合に、重要性があると判断される。
115/122
EDINET提出書類
株式会社TBK(E02201)
有価証券報告書
監査人は、我が国において一般に公正妥当と認められる監査の基準に従って、監査の過程を通じて、
職業的専門家としての判断を行い、職業的懐疑心を保持して以下を実施する。
・不正又は誤謬による重要な虚偽表示リスクを識別し、評価する。また、重要な虚偽表示リスクに対応
した監査手続を立案し、実施する。監査手続の選択及び適用は監査人の判断による。さらに、意見表
明の基礎となる十分かつ適切な監査証拠を入手する。
・連結財務諸表監査の目的は、内部統制の有効性について意見表明するためのものではないが、監査人
は、リスク評価の実施に際して、状況に応じた適切な監査手続を立案するために、監査に関連する内
部統制を検討する。
・経営者が採用した会計方針及びその適用方法の適切性、並びに経営者によって行われた会計上の見積
りの合理性及び関連する注記事項の妥当性を評価する。
・経営者が継続企業を前提として連結財務諸表を作成することが適切であるかどうか、また、入手した
監査証拠に基づき、継続企業の前提に重要な疑義を生じさせるような事象又は状況に関して重要な不
確実性が認められるかどうか結論付ける。継続企業の前提に関する重要な不確実性が認められる場合
は、監査報告書において連結財務諸表の注記事項に注意を喚起すること、又は重要な不確実性に関す
る連結財務諸表の注記事項が適切でない場合は、連結財務諸表に対して除外事項付意見を表明するこ
とが求められている。監査人の結論は、監査報告書日までに入手した監査証拠に基づいているが、将
来の事象や状況により、企業は継続企業として存続できなくなる可能性がある。
・連結財務諸表の表示及び注記事項が、我が国において一般に公正妥当と認められる企業会計の基準に
準拠しているかどうかとともに、関連する注記事項を含めた連結財務諸表の表示、構成及び内容、並
びに連結財務諸表が基礎となる取引や会計事象を適正に表示しているかどうかを評価する。
・連結財務諸表に対する意見表明の基礎となる、会社及び連結子会社の財務情報に関する十分かつ適切
な監査証拠を入手するために、連結財務諸表の監査を計画し実施する。監査人は、連結財務諸表の監
査に関する指揮、監督及び査閲に関して責任がある。監査人は、単独で監査意見に対して責任を負
う。
監査人は、監査役及び監査役会に対して、計画した監査の範囲とその実施時期、監査の実施過程で識
別した内部統制の重要な不備を含む監査上の重要な発見事項、及び監査の基準で求められているその他
の事項について報告を行う。
監査人は、監査役及び監査役会に対して、独立性についての我が国における職業倫理に関する規定を
遵守したこと、並びに監査人の独立性に影響を与えると合理的に考えられる事項、及び阻害要因を除去
するための対応策を講じている場合又は阻害要因を許容可能な水準にまで軽減するためのセーフガード
を適用している場合はその内容について報告を行う。
監査人は、監査役及び監査役会と協議した事項のうち、当連結会計年度の連結財務諸表の監査で特に
重要であると判断した事項を監査上の主要な検討事項と決定し、監査報告書において記載する。ただ
し、法令等により当該事項の公表が禁止されている場合や、極めて限定的ではあるが、監査報告書にお
いて報告することにより生じる不利益が公共の利益を上回ると合理的に見込まれるため、監査人が報告
すべきでないと判断した場合は、当該事項を記載しない。
116/122
EDINET提出書類
株式会社TBK(E02201)
有価証券報告書
<内部統制監査>
監査意見
当監査法人は、金融商品取引法第193条の2第2項の規定に基づく監査証明を行うため、株式会社TB
Kの2026年3月31日現在の内部統制報告書について監査を行った。
当監査法人は、株式会社TBKが2026年3月31日現在の財務報告に係る内部統制は有効であると表示
した上記の内部統制報告書が、我が国において一般に公正妥当と認められる財務報告に係る内部統制の
評価の基準に準拠して、財務報告に係る内部統制の評価結果について、全ての重要な点において適正に
表示しているものと認める。
監査意見の根拠
当監査法人は、我が国において一般に公正妥当と認められる財務報告に係る内部統制の監査の基準に
準拠して内部統制監査を行った。財務報告に係る内部統制の監査の基準における当監査法人の責任は、
「内部統制監査における監査人の責任」に記載されている。当監査法人は、我が国における職業倫理に
関する規定(社会的影響度の高い事業体の財務諸表監査に適用される規定を含む。)に従って、会社及
び連結子会社から独立しており、また、監査人としてのその他の倫理上の責任を果たしている。当監査
法人は、意見表明の基礎となる十分かつ適切な監査証拠を入手したと判断している。
内部統制報告書に対する経営者並びに監査役及び監査役会の責任
経営者の責任は、財務報告に係る内部統制を整備及び運用し、我が国において一般に公正妥当と認め
られる財務報告に係る内部統制の評価の基準に準拠して内部統制報告書を作成し適正に表示することに
ある。
監査役及び監査役会の責任は、財務報告に係る内部統制の整備及び運用状況を監視、検証することに
ある。
なお、財務報告に係る内部統制により財務報告の虚偽の記載を完全には防止又は発見することができ
ない可能性がある。
内部統制監査における監査人の責任
監査人の責任は、監査人が実施した内部統制監査に基づいて、内部統制報告書に重要な虚偽表示がな
いかどうかについて合理的な保証を得て、内部統制監査報告書において独立の立場から内部統制報告書
に対する意見を表明することにある。
監査人は、我が国において一般に公正妥当と認められる財務報告に係る内部統制の監査の基準に従っ
て、監査の過程を通じて、職業的専門家としての判断を行い、職業的懐疑心を保持して以下を実施す
る。
・内部統制報告書における財務報告に係る内部統制の評価結果について監査証拠を入手するための監査
手続を実施する。内部統制監査の監査手続は、監査人の判断により、財務報告の信頼性に及ぼす影響
の重要性に基づいて選択及び適用される。
・財務報告に係る内部統制の評価範囲、評価手続及び評価結果について経営者が行った記載を含め、全
体としての内部統制報告書の表示を検討する。
・内部統制報告書における財務報告に係る内部統制の評価結果に関する十分かつ適切な監査証拠を入手
するために、内部統制の監査を計画し実施する。監査人は、内部統制報告書の監査に関する指揮、監
督及び査閲に関して責任がある。監査人は、単独で監査意見に対して責任を負う。
監査人は、監査役及び監査役会に対して、計画した内部統制監査の範囲とその実施時期、内部統制監
査の実施結果、識別した内部統制の開示すべき重要な不備、その是正結果、及び内部統制の監査の基準
で求められているその他の事項について報告を行う。
監査人は、監査役及び監査役会に対して、独立性についての我が国における職業倫理に関する規定を
遵守したこと、並びに監査人の独立性に影響を与えると合理的に考えられる事項、及び阻害要因を除去
するための対応策を講じている場合又は阻害要因を許容可能な水準にまで軽減するためのセーフガード
を適用している場合はその内容について報告を行う。
117/122
EDINET提出書類
株式会社TBK(E02201)
有価証券報告書
<報酬関連情報>
当監査法人及び当監査法人と同一のネットワークに属する者に対する、会社及び子会社の監査証明業
務に基づく報酬及び非監査業務に基づく報酬の額は、「提出会社の状況」に含まれるコーポレート・ガ
バナンスの状況等 (3)【監査の状況】に記載されている。
利害関係
会社及び連結子会社と当監査法人又は業務執行社員との間には、公認会計士法の規定により記載すべ
き利害関係はない。
以
上
(注)1.上記の監査報告書の原本は当社(有価証券報告書提出会社)が別途保管しております。
2.XBRLデータは監査の対象には含まれていません。
118/122
EDINET提出書類
株式会社TBK(E02201)
有価証券報告書
独立監査人の監査報告書
2026年6月25日
株式会社TBK
取締役会
御中
有限責任 あずさ監査法人
東京事務所
指定有限責任社員
公認会計士
業務執行社員
永
指定有限責任社員
公認会計士
業務執行社員
宇田川
井
勝
顕
悟
<財務諸表監査>
監査意見
当監査法人は、金融商品取引法第193条の2第1項の規定に基づく監査証明を行うため、「経理の状
況」に掲げられている株式会社TBKの2025年4月1日から2026年3月31日までの第90期事業年度の財
務諸表、すなわち、貸借対照表、損益計算書、株主資本等変動計算書、重要な会計方針、その他の注記
及び附属明細表について監査を行った。
当監査法人は、上記の財務諸表が、我が国において一般に公正妥当と認められる企業会計の基準に準
拠して、株式会社TBKの2026年3月31日現在の財政状態及び同日をもって終了する事業年度の経営成
績を、全ての重要な点において適正に表示しているものと認める。
監査意見の根拠
当監査法人は、我が国において一般に公正妥当と認められる監査の基準に準拠して監査を行った。監
査の基準における当監査法人の責任は、「財務諸表監査における監査人の責任」に記載されている。当
監査法人は、我が国における職業倫理に関する規定(社会的影響度の高い事業体の財務諸表監査に適用
される規定を含む。)に従って、会社から独立しており、また、監査人としてのその他の倫理上の責任
を果たしている。当監査法人は、意見表明の基礎となる十分かつ適切な監査証拠を入手したと判断して
いる。
監査上の主要な検討事項
監査上の主要な検討事項とは、当事業年度の財務諸表の監査において、監査人が職業的専門家として
特に重要であると判断した事項である。監査上の主要な検討事項は、財務諸表全体に対する監査の実施
過程及び監査意見の形成において対応した事項であり、当監査法人は、当該事項に対して個別に意見を
表明するものではない。
(固定資産の減損損失の測定に用いられた正味売却価額の見積りの合理性)
財務諸表の監査報告書で記載すべき監査上の主要な検討事項「固定資産の減損損失の測定に用いられ
た正味売却価額の見積りの合理性」は、連結財務諸表の監査報告書に記載されている監査上の主要な検
討事項「株式会社TBKの固定資産の減損損失の測定に用いられた正味売却価額の見積りの合理性」と
実質的に同一の内容である。このため、財務諸表の監査報告書では、これに関する記載を省略してい
る。
119/122
EDINET提出書類
株式会社TBK(E02201)
有価証券報告書
その他の記載内容
その他の記載内容は、有価証券報告書に含まれる情報のうち、連結財務諸表及び財務諸表並びにこれ
らの監査報告書以外の情報である。経営者の責任は、その他の記載内容を作成し開示することにある。
また、監査役及び監査役会の責任は、その他の記載内容の報告プロセスの整備及び運用における取締役
の職務の執行を監視することにある。
当監査法人の財務諸表に対する監査意見の対象にはその他の記載内容は含まれておらず、当監査法人
はその他の記載内容に対して意見を表明するものではない。
財務諸表監査における当監査法人の責任は、その他の記載内容を通読し、通読の過程において、その
他の記載内容と財務諸表又は当監査法人が監査の過程で得た知識との間に重要な相違があるかどうか検
討すること、また、そのような重要な相違以外にその他の記載内容に重要な誤りの兆候があるかどうか
注意を払うことにある。
当監査法人は、実施した作業に基づき、その他の記載内容に重要な誤りがあると判断した場合には、
その事実を報告することが求められている。
その他の記載内容に関して、当監査法人が報告すべき事項はない。
財務諸表に対する経営者並びに監査役及び監査役会の責任
経営者の責任は、我が国において一般に公正妥当と認められる企業会計の基準に準拠して財務諸表を
作成し適正に表示することにある。これには、不正又は誤謬による重要な虚偽表示のない財務諸表を作
成し適正に表示するために経営者が必要と判断した内部統制を整備及び運用することが含まれる。
財務諸表を作成するに当たり、経営者は、継続企業の前提に基づき財務諸表を作成することが適切で
あるかどうかを評価し、我が国において一般に公正妥当と認められる企業会計の基準に基づいて継続企
業に関する事項を開示する必要がある場合には当該事項を開示する責任がある。
監査役及び監査役会の責任は、財務報告プロセスの整備及び運用における取締役の職務の執行を監視
することにある。
120/122
EDINET提出書類
株式会社TBK(E02201)
有価証券報告書
財務諸表監査における監査人の責任
監査人の責任は、監査人が実施した監査に基づいて、全体としての財務諸表に不正又は誤謬による重
要な虚偽表示がないかどうかについて合理的な保証を得て、監査報告書において独立の立場から財務諸
表に対する意見を表明することにある。虚偽表示は、不正又は誤謬により発生する可能性があり、個別
に又は集計すると、財務諸表の利用者の意思決定に影響を与えると合理的に見込まれる場合に、重要性
があると判断される。
監査人は、我が国において一般に公正妥当と認められる監査の基準に従って、監査の過程を通じて、
職業的専門家としての判断を行い、職業的懐疑心を保持して以下を実施する。
・不正又は誤謬による重要な虚偽表示リスクを識別し、評価する。また、重要な虚偽表示リスクに対応
した監査手続を立案し、実施する。監査手続の選択及び適用は監査人の判断による。さらに、意見表
明の基礎となる十分かつ適切な監査証拠を入手する。
・財務諸表監査の目的は、内部統制の有効性について意見表明するためのものではないが、監査人は、
リスク評価の実施に際して、状況に応じた適切な監査手続を立案するために、監査に関連する内部統
制を検討する。
・経営者が採用した会計方針及びその適用方法の適切性、並びに経営者によって行われた会計上の見積
りの合理性及び関連する注記事項の妥当性を評価する。
・経営者が継続企業を前提として財務諸表を作成することが適切であるかどうか、また、入手した監査
証拠に基づき、継続企業の前提に重要な疑義を生じさせるような事象又は状況に関して重要な不確実
性が認められるかどうか結論付ける。継続企業の前提に関する重要な不確実性が認められる場合は、
監査報告書において財務諸表の注記事項に注意を喚起すること、又は重要な不確実性に関する財務諸
表の注記事項が適切でない場合は、財務諸表に対して除外事項付意見を表明することが求められてい
る。監査人の結論は、監査報告書日までに入手した監査証拠に基づいているが、将来の事象や状況に
より、企業は継続企業として存続できなくなる可能性がある。
・財務諸表の表示及び注記事項が、我が国において一般に公正妥当と認められる企業会計の基準に準拠
しているかどうかとともに、関連する注記事項を含めた財務諸表の表示、構成及び内容、並びに財務
諸表が基礎となる取引や会計事象を適正に表示しているかどうかを評価する。
監査人は、監査役及び監査役会に対して、計画した監査の範囲とその実施時期、監査の実施過程で識
別した内部統制の重要な不備を含む監査上の重要な発見事項、及び監査の基準で求められているその他
の事項について報告を行う。
監査人は、監査役及び監査役会に対して、独立性についての我が国における職業倫理に関する規定を
遵守したこと、並びに監査人の独立性に影響を与えると合理的に考えられる事項、及び阻害要因を除去
するための対応策を講じている場合又は阻害要因を許容可能な水準にまで軽減するためのセーフガード
を適用している場合はその内容について報告を行う。
監査人は、監査役及び監査役会と協議した事項のうち、当事業年度の財務諸表の監査で特に重要であ
ると判断した事項を監査上の主要な検討事項と決定し、監査報告書において記載する。ただし、法令等
により当該事項の公表が禁止されている場合や、極めて限定的ではあるが、監査報告書において報告す
ることにより生じる不利益が公共の利益を上回ると合理的に見込まれるため、監査人が報告すべきでな
いと判断した場合は、当該事項を記載しない。
121/122
EDINET提出書類
株式会社TBK(E02201)
有価証券報告書
<報酬関連情報>
報酬関連情報は、連結財務諸表の監査報告書に記載されている。
利害関係
会社と当監査法人又は業務執行社員との間には、公認会計士法の規定により記載すべき利害関係はな
い。
以
(注)1.上記の監査報告書の原本は当社(有価証券報告書提出会社)が別途保管しております。
2.XBRLデータは監査の対象には含まれていません。
122/122
上