|
Aisin Corporation is a global supplier of automotive components. The company manufactures powertrain systems, including automatic, manual, and continuously variable transmissions, hybrid transmissions, and electric axles. It also produces driving safety components such as brake boosters, electronic stability control systems, and active rear steering, alongside body parts like power sliding doors, sunroofs, and pneumatic seats. The group offers energy solutions, including gas heat pump air conditioners and cogeneration systems, and provides location-based services such as car navigation and rideshare services. Aisin operates in Japan, North America, Europe, China, and the ASEAN-India region. Key subsidiaries and joint ventures include Aisin AW Co., Ltd., Aisin AI Co., Ltd., ADVICS Co., Ltd., and BluE Nexus Corporation. The company was formerly known as Aisin Seiki Co., Ltd. and traces its origins to the establishment of Aisin Seiki in 1965. Summarised from the annual report, fiscal year ended Mar 2026 |
Industry Auto Parts | Homepage aisin.com |
| Sector Consumer Cyclical | IR page aisin.com/en/investors | |
|
Tags
automatic transmissions, hybrid transmissions, brake systems, steering columns, power sliding doors, heat pump air conditioners, cogeneration systems, car navigation systems, electric axles, pneumatic seats, Aisin AW Co. Ltd., Aisin AI Co. Ltd., ADVICS Co. Ltd., BluE Nexus Corporation, Choisoko
|
Press page aisin.com/en/news |
Metrics
| Valuation | |
|---|---|
| Market cap | ¥ 1.574T |
| Market cap (USD) | $ 9.835B |
| P/E | 10.34 |
| PEG | 0.16 |
| P/BV | 0.65 |
| P/S | 0.30 |
| P/OCF | 4.55 |
| P/FCF | 12.38 |
| Dividend yield | 3.2% |
| Turnover / mcap | — |
| Returns | |
|---|---|
| ROE | 7.3% |
| ROI | 5.5% |
| ROIC | 6.0% |
| Profit margin | 3.4% |
| Growth | |
|---|---|
| Revenue growing | Yes |
| Profits growing | Yes |
| Revenue up 3y | No |
| Revenue up 5y | No |
| Earnings growth 3y (net profit CAGR) | 65.8% |
| Quality | |
|---|---|
| Profitable | Yes |
| Margin expanding | Yes |
| Buying back stock | Yes |
| Diluting (TTM) | No |
| Debt/Equity | — |
| Podcast bulls (TTM) | Sign up |
| Podcast bears (TTM) | Sign up |
| Podcast sentiment (TTM) | Sign up |
| Podcast sentiment % (TTM) | Sign up |
| News sentiment (TTM) | 33 |
| Quality score | 33.3% |
| Insiders | |
|---|---|
| Buys, 1w | Sign up |
| Buys, 1m | Sign up |
| Buys, 1y | Sign up |
| Sells, 1w | Sign up |
| Sells, 1m | Sign up |
| Sells, 1y | Sign up |
Sign up to see this company's insider trades
| Figure | FY 2026 | FY 2025 | FY 2024 | FY 2023 | FY 2022 | FY 2021 | FY 2020 | FY 2019 | FY 2018 | FY 2017 | FY 2016 | FY 2015 | FY 2014 | FY 2013 |
|---|---|---|---|---|---|---|---|---|---|---|---|---|---|---|
| Revenue | 5.118T | 4.896T | 4.91T | 4.403T | 3.917T | 3.526T | 3.785T | 4.043T | 3.909T | 3.564T | 3.243T | 2.965T | 2.822T | 2.53T |
| Net profit | 171.697B | 107.586B | 90.813B | 37.67B | 141.941B | 105.638B | 24.061B | 110.123B | 134.551B | 123.474B | 96.974B | 77.55B | 90.089B | 77.518B |
| Free cash flow | 115.935B | 103.448B | 255.276B | -900M | -40.692B | 127.991B | 1.939B | -35.661B | — | — | — | — | — | — |
| Figure | FY 2026 | FY 2025 | FY 2024 | FY 2023 | FY 2022 | FY 2021 | FY 2020 | FY 2019 | FY 2018 | FY 2017 | FY 2016 | FY 2015 | FY 2014 | FY 2013 |
|---|---|---|---|---|---|---|---|---|---|---|---|---|---|---|
| Share price | 2.173K | 1.627K | 6.218K | 3.646K | 4.223K | 4.195K | 2.661K | 3.96K | 5.802K | 5.466K | 4.247K | 4.376K | 3.734K | 3.444K |
| Price performance 12m | 0.34 | -0.74 | 0.71 | -0.14 | 0.01 | 0.58 | -0.33 | -0.32 | 0.06 | 0.29 | -0.03 | 0.17 | 0.08 | — |
Filed figures
Lines the statements and their notes report beside the headline figures, read from the filings' XBRL as filed (no restatement applied), with figures computed from one filing's own lines. Cash-flow lines carry their cash direction: an outflow is negative. Each period links to its filing; a figure's period, report date and tag are in its tooltip.
| Figure | Mar 2017 | Mar 2018 | Mar 2019 | Mar 2020 | Mar 2021 | Mar 2022 | Mar 2023 | Mar 2024 | Mar 2025 | Mar 2026 |
|---|---|---|---|---|---|---|---|---|---|---|
| Balance sheet detail | ||||||||||
| Trade receivables (JPY) | — | 622B | 621B | 534B | 616B | 636B | 740B | 704B | 737B | 774B |
| ↳ YoY growth | -0.2% | -14.0% | +15.5% | +3.2% | +16.5% | -5.0% | +4.8% | +5.0% | ||
| ↳ 5y CAGR | +3.6% | +2.5% | +6.7% | +4.7% | ||||||
| Borrowings, current (JPY) | — | 86.9B | 86.1B | 103B | 104B | 112B | 160B | 100B | 90.7B | 97.8B |
| Borrowings, non-current (JPY) | — | 431B | 524B | 849B | 821B | 771B | 689B | 626B | 539B | 524B |
| Lease liabilities (JPY) | — | — | 12.2B | 53.5B | 50.9B | 61.6B | 61.8B | 68.4B | 67.4B | 64.7B |
| Cash and deposits (JPY) | 395B | 407B | 357B | 675B | 520B | 387B | 318B | 527B | 452B | 592B |
| Intangible assets (JPY) | — | 40B | 40.7B | 36.7B | 40.8B | 45.7B | 56.1B | 55.9B | 56.6B | 53.4B |
| Right-of-use assets (JPY) | — | — | — | 57.8B | 54.5B | 59.8B | 65.5B | 67.2B | 72.4B | 75.6B |
| Net debt (borrowings + leases - cash) (JPY) | — | 111B | 253B | 330B | 456B | 557B | 593B | 267B | 246B | 93.6B |
| Cash flow detail | ||||||||||
| Operating cash flow (JPY) | 397B | 312B | 355B | 328B | 343B | 193B | 238B | 500B | 340B | 376B |
| Purchases of property, plant and equipment (JPY) | — | -255B | -377B | -313B | -200B | -218B | -212B | -228B | -219B | -242B |
| Purchases of intangible assets (JPY) | — | -10B | -13.5B | -12.8B | -15B | -16.3B | -26.6B | -16.3B | -17.6B | -18.4B |
| Change in receivables (cash effect) (JPY) | — | -47.2B | 4.76B | 72.1B | -62.6B | 22.7B | -80.5B | 89.6B | -38.6B | 15.6B |
| Change in inventories (cash effect) (JPY) | — | -15.9B | -42.5B | -37.9B | 2.92B | -160B | 56.9B | 30.1B | 1.36B | -19.4B |
| Change in payables (cash effect) (JPY) | — | -26B | 40.9B | -30.2B | 9.29B | -36.2B | -35.2B | -4.75B | 14.4B | -98.1B |
| Dividends paid (cash effect) (JPY) | — | -37.4B | -40.5B | -40.4B | -21.6B | -45.8B | -45.8B | -48.5B | -47.7B | -44.9B |
| Share buybacks (cash effect) (JPY) | — | -59.5B | -10M | — | — | — | — | -6M | -83.9B | -78.4B |
| Interest paid (cash effect) (JPY) | — | -7.03B | -7.51B | -8.2B | -11.3B | -9.39B | -11.9B | -8.52B | -4.62B | -7.54B |
| Income taxes paid (cash effect) (JPY) | — | — | — | -50.6B | -41.7B | -78.7B | -69.7B | -32.9B | -97.2B | -53.2B |
| Operating cash flow before change in receivables (JPY) | — | 359B | 350B | 255B | 406B | 171B | 318B | 410B | 378B | 361B |
| Free cash flow (OCF - PPE - intangibles) (JPY) | — | 46.3B | -35.7B | 1.94B | 128B | -40.7B | -900M | 255B | 103B | 116B |
| Income detail | ||||||||||
| Research and development expense (JPY) | — | — | 202B | 206B | 190B | 194B | 219B | 226B | 237B | 265B |
| ↳ 5y CAGR | +2.2% | +2.8% | +6.9% | |||||||
| Total comprehensive income (JPY) | 192B | 233B | 126B | -33B | 284B | 296B | 56.4B | 463B | -17.9B | 396B |
| Comprehensive income to owners (JPY) | 125B | 170B | 78.9B | -24.5B | 268B | 267B | 39.4B | 427B | -37.8B | 344B |
| Segments | ||||||||||
| ADVICS Group · Segment revenue (JPY) | — | 587B | 600B | 583B | 545B | — | — | — | — | — |
| ↳ YoY growth | +2.4% | -3.0% | -6.4% | |||||||
| ADVICS Group · Segment operating income (JPY) | — | 10.1B | 11.9B | -3.53B | 2.02B | — | — | — | — | — |
| ASEAN India · Segment revenue (JPY) | — | — | — | — | — | — | 493B | 500B | 530B | 613B |
| ↳ YoY growth | +1.5% | +6.0% | +15.7% | |||||||
| ASEAN India · Segment operating income (JPY) | — | — | — | — | — | — | 58.6B | 56.2B | 59.4B | 69.6B |
| Aisin AW Group · Segment revenue (JPY) | — | 1.62T | 1.68T | 1.62T | 1.55T | — | — | — | — | — |
| ↳ YoY growth | +3.4% | -3.2% | -4.7% | |||||||
| Aisin AW Group · Segment operating income (JPY) | — | 142B | 104B | 19.9B | 79.4B | — | — | — | — | — |
| Aisin Seiki Group · Segment revenue (JPY) | — | 1.78T | 1.78T | 1.69T | 1.53T | — | — | — | — | — |
| ↳ YoY growth | +0.4% | -5.4% | -9.2% | |||||||
| Aisin Seiki Group · Segment operating income (JPY) | — | 78B | 67B | 30.3B | 51B | — | — | — | — | — |
| Aisin Takaoka Group · Segment revenue (JPY) | — | 296B | 321B | 310B | 277B | — | — | — | — | — |
| ↳ YoY growth | +8.5% | -3.3% | -10.8% | |||||||
| Aisin Takaoka Group · Segment operating income (JPY) | — | 12B | 13.5B | 6.72B | 9.38B | — | — | — | — | — |
| China · Segment revenue (JPY) | — | — | — | — | 390B | 470B | 549B | 635B | 619B | 599B |
| ↳ YoY growth | +20.5% | +16.8% | +15.8% | -2.6% | -3.2% | |||||
| China · Segment operating income (JPY) | — | — | — | — | 27.7B | 35B | 16B | 36.5B | 32.4B | 30.7B |
| Europe · Segment revenue (JPY) | — | — | — | — | 352B | 342B | 354B | 376B | 296B | 284B |
| ↳ YoY growth | -2.8% | +3.4% | +6.3% | -21.3% | -3.9% | |||||
| Europe · Segment operating income (JPY) | — | — | — | — | 5.13B | 5.11B | 8.37B | 7.75B | 4.39B | 4.12B |
| Japan · Segment revenue (JPY) | — | — | — | — | 2.57T | 2.85T | 2.85T | 3.2T | 3.14T | 3.21T |
| ↳ YoY growth | +11.1% | +0.0% | +12.0% | -1.8% | +2.4% | |||||
| Japan · Segment operating income (JPY) | — | — | — | — | 105B | 117B | -4.59B | 62.6B | 73.7B | 80.3B |
| North America · Segment revenue (JPY) | — | — | — | — | 520B | 598B | 829B | 1T | 1.09T | 1.2T |
| ↳ YoY growth | +15.1% | +38.6% | +20.7% | +8.6% | +10.0% | |||||
| North America · Segment operating income (JPY) | — | — | — | — | -4.22B | -16.6B | -32.5B | -25.2B | 29.3B | 39.1B |
| Reported | Jun 19, 2017 | Jun 19, 2019 | Jun 17, 2020 | Jun 21, 2021 | Jun 20, 2022 | Jun 20, 2022 | Jun 20, 2024 | Jun 16, 2025 | Jun 16, 2025 | Jun 12, 2026 |
Sign up to see institutional holdings
Sign UpPodcast Mentions
Sign up to see podcast mentions and sentiment
Sign UpTimely disclosures published on TDnet, newest first, titles as filed in Japanese. The link opens the disclosure on TDnet. Filings with EDINET (periodic reports, extraordinary reports, offerings, holding and buy-back reports), newest first, titles as filed in Japanese. The link opens the filing on EDINET. Press releases from the company's own website, newest first.





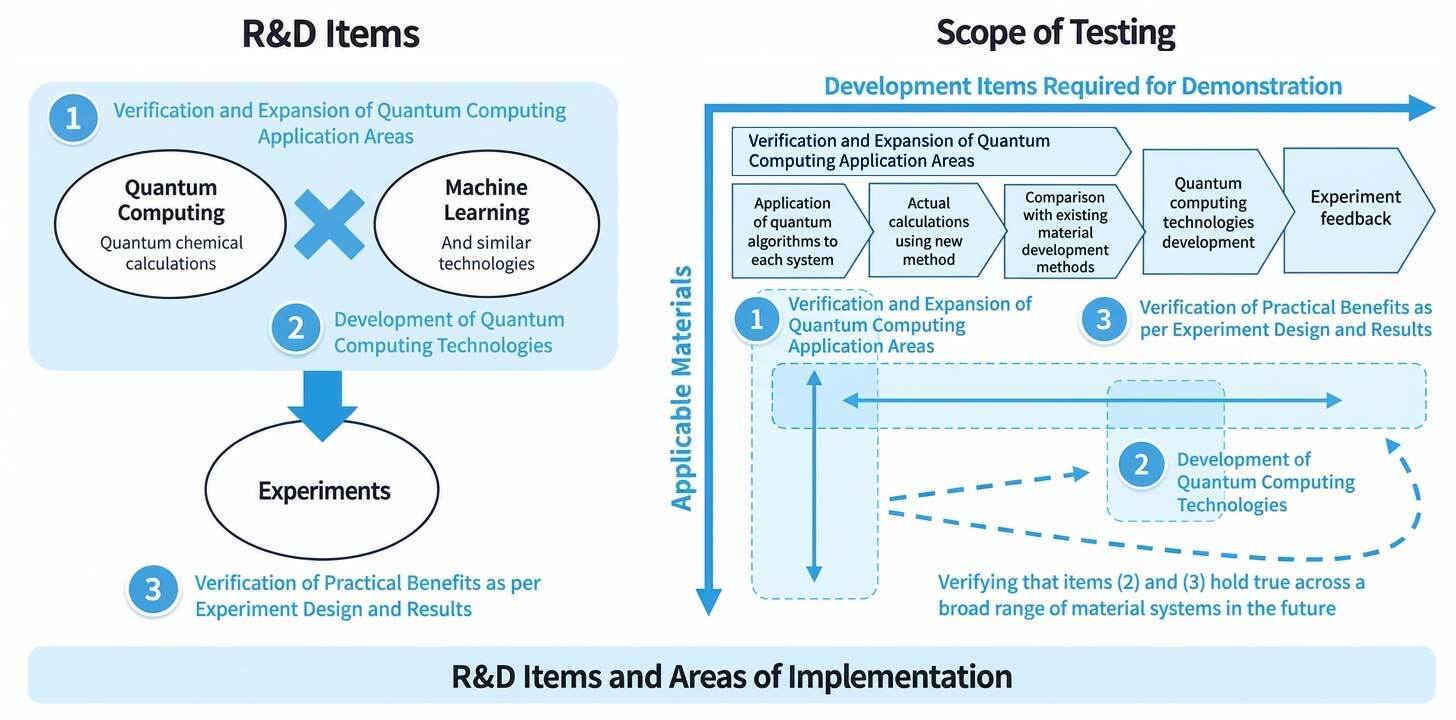 Tokyo – October 28, 2026 –TOPPAN Holdings Inc. (TOPPAN Holdings; TYO: 7911), AISIN Corporation (AISIN; TYO: 7259), Asahi Kasei Corporation (Asahi Kasei; TYO: 3407), SoftBank Corp. (SoftBank; TYO: 9434), AGC Inc. (AGC; TYO: 5201), and DIC Corporation (DIC; TYO: 4631) jointly announced today that their joint proposal, “Research and Development of Innovative Materials Development Platforms Using Quantum Technology” (hereinafter the “Project”), has been selected by the New Energy and Industrial Technology Development Organization (NEDO).1 The Project was chosen under NEDO’s solicitation for the “Research and Development Project of the Enhanced Infrastructures for Post-5G Information and Communication Systems ”.





 the exhibit features “9 Challenge Stories”


 a dynamic display using 3D hologram
 Front spats are installed on the lower section of the front bumper, ahead of the tires, where they optimize airflow around the tires during driving. By reducing aerodynamic drag, they contribute to improved fuel efficiency.
 Airflow when retracted
 Airflow when deployed
 "Active Front Spats"


Prompts
Click prompts to add them under the company line, click again to take one out, then copy the result into your AI chat. Shared by Asian Century Stocks and Uncovered Thai Stocks. Thank you.
ETFs Holding Aisin Corporation
Exchange-traded funds whose newest published daily portfolio holds one of the company's listings, largest weight first.
| ETF | Weight in ETF | Shares | Market value | As of |
|---|---|---|---|---|
| FYLD | 0.97% | 492,721 | $ 6.886M | Jul 31, 2026 |
| TDI | 0.49% | 131,300 | $ 1.766M | Jun 30, 2026 |
| AIVI | 0.42% | 18,400 | $ 247.541K | Jun 30, 2026 |
| DFIV | 0.17% | 2,676,500 | $ 37.327M | Nov 12, 2026 |
| AVIV | 0.12% | 183,700 | $ 2.574M | Nov 16, 2026 |
| AVSD | 0.10% | 25,500 | $ 357.269K | Nov 16, 2026 |
| AVDE | 0.06% | 784,800 | $ 10.995M | Nov 16, 2026 |
| DFIC | 0.05% | 499,800 | $ 6.97M | Nov 12, 2026 |
| DXIV | 0.04% | 7,300 | $ 101.807K | Nov 12, 2026 |
| DFAI | 0.03% | 427,800 | $ 5.966M | Nov 12, 2026 |
| DFSI | 0.03% | 24,900 | $ 347.261K | Nov 12, 2026 |
| DFAX | 0.02% | 181,386 | $ 2.53M | Nov 12, 2026 |