|
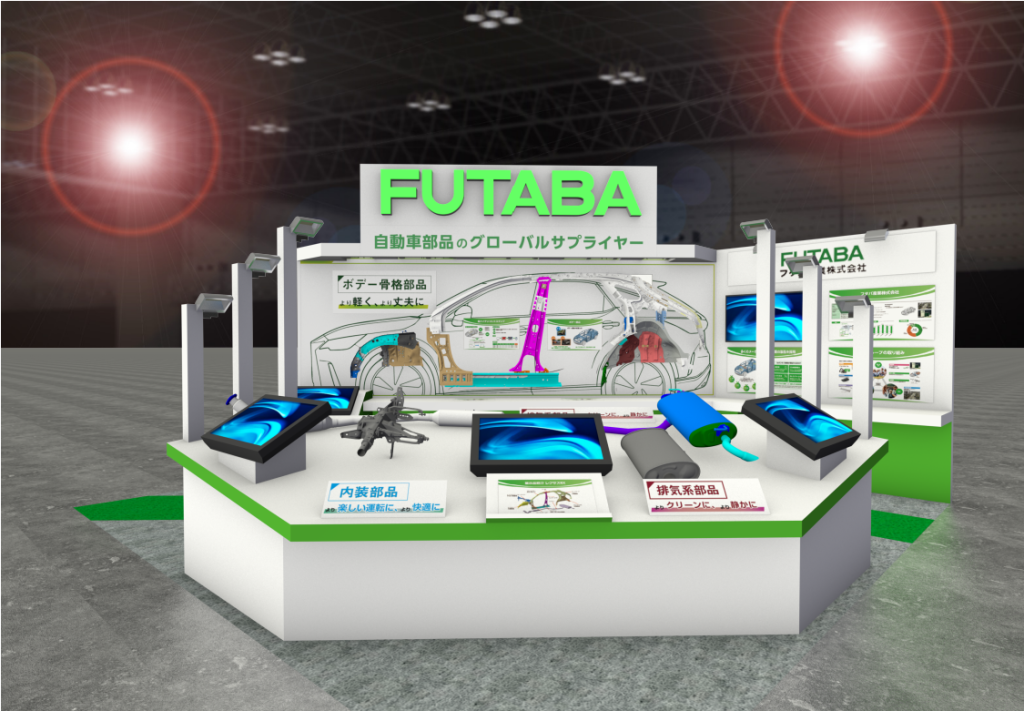
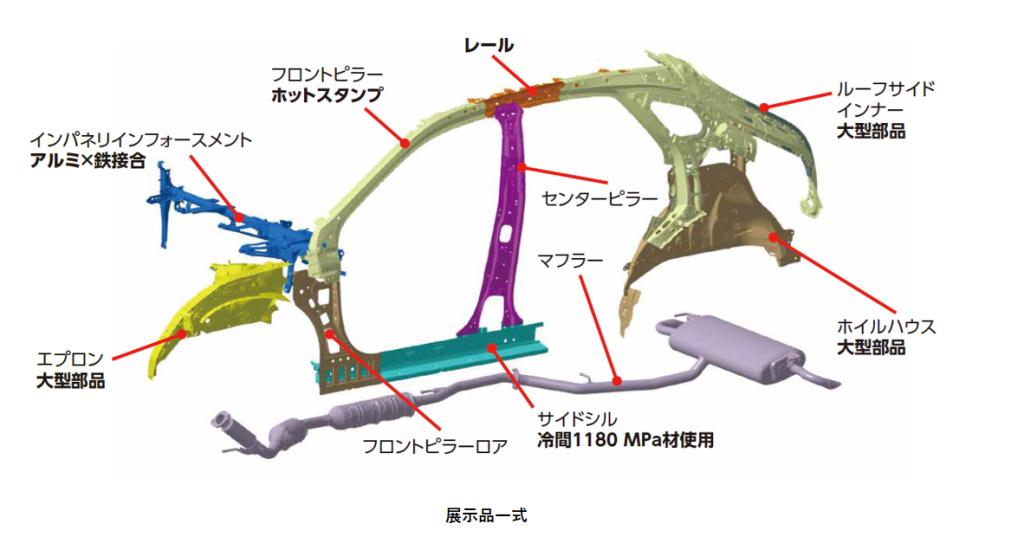
Futaba Industrial Co., Ltd. is a manufacturer and seller of automotive vehicle parts, environmental equipment components, and external sales equipment. The company operates through a corporate group comprising 17 consolidated subsidiaries and three equity-method affiliates. Its business is organized into regional segments for Japan, North America, Europe, China, and Asia, each supported by specific subsidiaries such as Futaba North America E&M, FIC America, FIO Automotive Canada, Futaba Manufacturing UK, Futaba Czech, Shuangye (Tianjin) Enterprise Management, Tianjin Shuangye Xiezheng Machinery, Guangzhou Shuangye Auto Parts, FMI Automotive Components, and Futaba Industrial Indonesia. The company manufactures and sells its products directly and also outsources a portion of production to its subsidiaries and affiliates, which also engage in direct sales to customers. A primary customer is Toyota Motor Corporation, which is classified as an affiliated company of Futaba Industrial. Summarised from the annual report, fiscal year ended Mar 2026 |
Industry Auto Parts | Homepage futabasangyo.com |
| Sector Consumer Cyclical | IR page futabasangyo.com | |
|
Tags
automotive components, environmental equipment parts, vehicle parts manufacturing, industrial equipment, outsourced production, Futaba North America E&M, FIC America, FIO Automotive Canada, Futaba Manufacturing UK, Futaba Czech, Shuangye (Tianjin) Enterprise Management, Tianjin Shuangye Xiezheng Machinery, Guangzhou Shuangye Auto Parts, FMI Automotive Components, Futaba Industrial Indonesia
|
Press page futabasangyo.com/news |
Metrics
| Valuation | |
|---|---|
| Market cap | ¥ 97.195B |
| Market cap (USD) | $ 607.477M |
| P/E | 6.83 |
| PEG | 0.46 |
| P/BV | 0.66 |
| P/S | 0.14 |
| P/OCF | 3.12 |
| P/FCF | 34.49 |
| Dividend yield | 4.0% |
| Turnover / mcap | — |
| Returns | |
|---|---|
| ROE | 11.9% |
| ROI | 8.8% |
| ROIC | 8.3% |
| Profit margin | 2.4% |
| Growth | |
|---|---|
| Revenue growing | No |
| Profits growing | Yes |
| Revenue up 3y | No |
| Revenue up 5y | No |
| Earnings growth 3y (net profit CAGR) | 14.9% |
| Quality | |
|---|---|
| Profitable | Yes |
| Margin expanding | Yes |
| Buying back stock | No |
| Diluting (TTM) | No |
| Debt/Equity | — |
| Podcast bulls (TTM) | Sign up |
| Podcast bears (TTM) | Sign up |
| Podcast sentiment (TTM) | Sign up |
| Podcast sentiment % (TTM) | Sign up |
| News sentiment (TTM) | 4 |
| Quality score | 27.8% |
| Insiders | |
|---|---|
| Buys, 1w | Sign up |
| Buys, 1m | Sign up |
| Buys, 1y | Sign up |
| Sells, 1w | Sign up |
| Sells, 1m | Sign up |
| Sells, 1y | Sign up |
Sign up to see this company's insider trades
| Figure | FY 2026 | FY 2025 | FY 2024 | FY 2023 | FY 2022 | FY 2021 | FY 2020 | FY 2019 | FY 2018 | FY 2017 | FY 2016 | FY 2015 | FY 2014 | FY 2013 |
|---|---|---|---|---|---|---|---|---|---|---|---|---|---|---|
| Revenue | 677.919B | 707.104B | 795.802B | 708.072B | 572.118B | 466.809B | 476.165B | 461.705B | 440.446B | 412.383B | 437.64B | 422.874B | 399.378B | 365.246B |
| Net profit | 16.026B | 6.208B | 12.831B | 10.576B | 3.307B | 4.095B | 6.357B | 3.509B | 10.721B | 4.806B | -1.195B | 1.039B | 2.954B | -5.067B |
| Free cash flow | 10.387B | -647M | 42.453B | 22.943B | 846M | -1.862B | 7.422B | -7.666B | -5.478B | 5.05B | 2.947B | — | — | — |
| Figure | FY 2026 | FY 2025 | FY 2024 | FY 2023 | FY 2022 | FY 2021 | FY 2020 | FY 2019 | FY 2018 | FY 2017 | FY 2016 | FY 2015 | FY 2014 | FY 2013 |
|---|---|---|---|---|---|---|---|---|---|---|---|---|---|---|
| Share price | 955.74 | 778.79 | 1.174K | 428.26 | 365.22 | 594.42 | 456.88 | 545.69 | 897.81 | 800.71 | 558.76 | 558.76 | 450.67 | — |
| Price performance 12m | 0.23 | -0.34 | 1.74 | 0.17 | -0.39 | 0.3 | -0.16 | -0.39 | 0.12 | 0.43 | 0 | 0.24 | — | — |
Filed figures
Lines the statements and their notes report beside the headline figures, read from the filings' XBRL as filed (no restatement applied), with figures computed from one filing's own lines. Cash-flow lines carry their cash direction: an outflow is negative. Each period links to its filing; a figure's period, report date and tag are in its tooltip.
| Figure | Mar 2017 | Mar 2018 | Mar 2019 | Mar 2020 | Mar 2021 | Mar 2022 | Mar 2023 | Mar 2024 | Mar 2025 | Mar 2026 |
|---|---|---|---|---|---|---|---|---|---|---|
| Balance sheet detail | ||||||||||
| Trade receivables (JPY) | 59.1B | 69.9B | 67.7B | 69.1B | 88.6B | 175B | 198B | 175B | 90.3B | 88.3B |
| ↳ YoY growth | +8.5% | +18.3% | -3.0% | +2.1% | +28.2% | +97.1% | +13.3% | -11.8% | -48.3% | -2.2% |
| ↳ 5y CAGR | +10.3% | +24.2% | +23.2% | +20.9% | +5.5% | -0.1% | ||||
| Borrowings, current (JPY) | 38.3B | 29.5B | 23.6B | 22.9B | 28B | 42.3B | 23B | 12.9B | 20.4B | 21.7B |
| Borrowings, non-current (JPY) | 44.7B | 51.7B | 61.3B | 57.5B | 58.1B | 55B | 57.8B | 47.1B | 33.5B | 32B |
| Bonds payable (JPY) | — | — | 12B | 12B | 12B | 12B | 12B | 6B | 6B | 6B |
| Lease liabilities (JPY) | 1.76B | — | — | — | — | — | — | — | — | — |
| Cash and deposits (JPY) | 24.8B | 13.9B | 8.06B | 9.38B | 9.53B | 6.73B | 10.3B | 25B | 13.7B | 21.4B |
| Intangible assets (JPY) | 707M | 663M | 946M | 948M | 882M | 1.59B | 1.66B | 1.9B | 1.93B | 1.95B |
| Net debt (borrowings + leases - cash) (JPY) | 59.9B | 67.3B | 76.8B | 71.1B | 76.6B | 90.5B | 70.5B | 35B | 40.2B | 32.3B |
| Cash flow detail | ||||||||||
| Operating cash flow (JPY) | 26.2B | 25B | 25.4B | 34B | 22.8B | 35.5B | 47.7B | 57.4B | 24.8B | 38.3B |
| Purchases of property, plant and equipment (JPY) | -21.1B | -30.4B | -33.1B | -26.6B | -24.7B | -34.6B | -24.2B | -14.9B | -24.7B | -27.2B |
| Purchases of intangible assets (JPY) | — | — | — | — | — | -1.1B | -621M | -805M | -699M | -717M |
| Change in receivables (cash effect) (JPY) | -6B | -10.8B | 1.62B | -2.7B | -17.7B | 3.58B | -8.66B | 18.6B | -1.94B | 5.35B |
| Change in inventories (cash effect) (JPY) | -1.17B | -2.02B | -1.29B | -2.74B | -4.89B | -319M | 772M | 2.85B | -1.49B | 2.37B |
| Change in payables (cash effect) (JPY) | 1.25B | 6.91B | -4.99B | 2.69B | 13.9B | 3.48B | 21.2B | -19.4B | -1.66B | -8.45B |
| Dividends paid (cash effect) (JPY) | -209M | -268M | -893M | -894M | -894M | -895M | -895M | -2.68B | -3.31B | -3.67B |
| Share buybacks (cash effect) (JPY) | 0.00 | — | — | — | — | — | — | — | -1M | -418M |
| Interest paid (cash effect) (JPY) | -1.23B | -1B | -862M | -908M | -818M | -820M | -1.34B | -1.01B | -809M | -945M |
| Income taxes paid (cash effect) (JPY) | -548M | -1.48B | -1.17B | -759M | -2.2B | -3.01B | -2.3B | -1.71B | -2.23B | -5.62B |
| Operating cash flow before change in receivables (JPY) | 32.2B | 35.8B | 23.8B | 36.7B | 40.5B | 31.9B | 56.4B | 38.8B | 26.7B | 32.9B |
| Free cash flow (OCF - PPE - intangibles) (JPY) | 5.05B | -5.48B | -7.67B | 7.42B | -1.86B | 846M | 22.9B | 41.6B | -647M | 10.4B |
| Income detail | ||||||||||
| Research and development expense (JPY) | 3.24B | 3.37B | 3.49B | 3.44B | 3.29B | 4.3B | 4.45B | 5.09B | 5.73B | 6.43B |
| ↳ 5y CAGR | +1.3% | +5.8% | +5.7% | +7.8% | +10.7% | +14.4% | ||||
| Total comprehensive income (JPY) | 2.31B | 11.4B | 1.5B | 2.92B | 12.1B | 13.4B | 11.4B | 33.5B | -4.09B | 26.3B |
| Comprehensive income to owners (JPY) | 3.11B | 11.6B | 1.43B | 2.6B | 11B | 11.6B | 10.8B | 32.4B | -3.47B | 25B |
| Segments | ||||||||||
| China · Segment revenue (JPY) | — | — | — | 68.2B | 81.7B | 101B | 102B | 83.3B | 70.5B | 62.6B |
| ↳ YoY growth | +19.8% | +23.8% | +1.1% | -18.6% | -15.3% | -11.2% | ||||
| China · Segment operating income (JPY) | — | — | — | 3.09B | 3.4B | 4.6B | 2.63B | 2.22B | 2.27B | 3.03B |
| Reported | Jun 19, 2017 | Jun 21, 2018 | Jun 19, 2019 | Jun 18, 2021 | Jun 18, 2021 | Jun 23, 2023 | Jun 23, 2023 | Jun 24, 2024 | Jun 17, 2026 | Jun 17, 2026 |
Sign up to see institutional holdings
Sign UpPodcast Mentions
Sign up to see podcast mentions and sentiment
Sign UpTimely disclosures published on TDnet, newest first, titles as filed in Japanese. The link opens the disclosure on TDnet. Filings with EDINET (periodic reports, extraordinary reports, offerings, holding and buy-back reports), newest first, titles as filed in Japanese. The link opens the filing on EDINET. Press releases from the company's own website, newest first.
当社は、2026年7月30日に公表いたしました連結業績予想を修正いたしましたので、下記のとおり お知らせいたします。
記 1.連結業績予想の修正 2027年3月期通期連結業績予想の修正(2026年4月1日~2027年3月31日) 売上高
営業利益
経常利益
親会社株主に帰属 する当期純利益
1株当たり 当期純利益
百万円
百万円
百万円
百万円
前回発表予想(A)
690,000
19,000
19,000
14,000
156円65銭
今回修正予想(B)
713,000
18,000
17,000
12,000
134円36銭
増
減
額(B-A)
23,000
△ 1,000
△ 2,000
△ 2,000
増
減
率(%)
3.3%
△5.3%
△10.5%
△14.3%
(ご参考)前期実績 (2026年3月期)
677,919
18,715
20,840
16,026
179円33銭
2.理由
売上高につきましては、材料建値や支給品価格の上昇等に伴い前回公表値から増額する一方、各段階 利益につきましては、中国セグメントにおける得意先の自動車生産台数の下振れや、英国の生産拠点縮 小に伴う影響等を踏まえ、前回公表値から下方修正いたします。
(注) 上記の予想は、現在入手可能な情報に基づき作成したものであり、実際の業績は今後さまざまな要因に より予想数値と異なる可能性があります。


Prompts
Click prompts to add them under the company line, click again to take one out, then copy the result into your AI chat. Shared by Asian Century Stocks and Uncovered Thai Stocks. Thank you.
ETFs Holding Futaba Industrial Co., Ltd.
Exchange-traded funds whose newest published daily portfolio holds one of the company's listings, largest weight first.
| ETF | Weight in ETF | Shares | Market value | As of |
|---|---|---|---|---|
| DISV | 0.05% | 451,900 | $ 2.722M | Nov 12, 2026 |
| AVDV | 0.04% | 1,241,500 | $ 7.466M | Nov 16, 2026 |
| DFIS | 0.01% | 143,700 | $ 865.435K | Nov 12, 2026 |
| DXIV | 0.01% | 4,400 | $ 26.499K | Nov 12, 2026 |
| AVSD | 0.01% | 5,900 | $ 35.48K | Nov 16, 2026 |
| AVDS | 0.01% | 7,500 | $ 45.102K | Nov 16, 2026 |
| DFIC | 0.00% | 123,400 | $ 743.178K | Nov 12, 2026 |
| DFAX | 0.00% | 55,400 | $ 333.647K | Nov 12, 2026 |
| DFSI | 0.00% | 5,000 | $ 30.113K | Nov 12, 2026 |
| DFAI | 0.00% | 76,200 | $ 458.916K | Nov 12, 2026 |
| AVDE | 0.00% | 70,400 | $ 423.357K | Nov 16, 2026 |