2026年5月15日 上 場 会 社名株式会社タチエス上場取引所東 コ ー ド 番号7239URLhttps://www.tachi-s.co.jp/ 代表者(役職名)代表取締役社長(氏名)山本雄一郎 問合せ先責任者(役職名)代表取締役執行役員(氏名)小松篤司(TEL)0428-33-1917…
2026年5月15日
上 場 会 社名株式会社タチエス上場取引所東
コ ー ド 番号7239URLhttps://www.tachi-s.co.jp/
代表者(役職名)代表取締役社長(氏名)山本雄一郎
問合せ先責任者(役職名)代表取締役執行役員(氏名)小松篤司(TEL)0428-33-1917
定時株主総会開催予定日2026年6月29日配当支払開始予定日2026年6月8日
有価証券報告書提出予定日2026年6月26日
決算補足説明資料作成の有無:有
決算説明会開催の有無:有(証券アナリスト・機関投資家向け)
(百万円未満切捨て)
1.2026年3月期の連結業績(2025年4月1日~2026年3月31日)
(1)連結経営成績
(%表示は対前期増減率)
売上高営業利益経常利益
親会社株主に帰属する
当期純利益
百万円%百万円%百万円%百万円%
2026年3月期269,009△5.711,60420.613,81028.29,297△17.8
2025年3月期285,394△2.69,62533.610,76823.011,310108.6
(注)包括利益2026年3月期12,572百万円(22.5%)2025年3月期10,263百万円(
△22.6
%)
1株当たり
当期純利益
潜在株式調整後
1株当たり
当期純利益
自己資本
当期純利益率
総資産
経常利益率
売上高
営業利益率
円 銭円 銭%%%
2026年3月期271.03233.499.28.14.3
2025年3月期329.93325.9012.26.13.4
(参考)持分法投資損益2026年3月期438百万円2025年3月期392百万円
(2)連結財政状態
総資産純資産自己資本比率1株当たり純資産
百万円百万円%円 銭
2026年3月期170,372105,90461.63,055.91
2025年3月期171,95798,18556.02,808.25
(参考)自己資本2026年3月期
104,880
百万円2025年3月期
96,273
百万円
(3)連結キャッシュ・フローの状況
営業活動による
キャッシュ・フロー
投資活動による
キャッシュ・フロー
財務活動による
キャッシュ・フロー
現金及び現金同等物
期末残高
百万円百万円百万円百万円
2026年3月期13,583△3,588△12,36944,577
2025年3月期9,7643,962△9,29443,593
2.配当の状況
年間配当金
配当金総額
(合計)
配当性向
(連結)
純資産
配当率
(連結)
第1四半期末第2四半期末第3四半期末
期末合計
円銭円銭円銭円銭円銭百万円%%
2025年3月期-51.90-51.90103.803,59231.53.8
2026年3月期-51.90-53.10105.003,63438.73.6
2027年3月期(予想)-57.50-57.50115.0045.9
3.2027年3月期の連結業績予想(2026年4月1日~2027年3月31日)
(%表示は、対前期増減率)
売上高営業利益経常利益
親会社株主に帰属
する当期純利益
1株当たり当期純
利益
百万円%百万円%百万円%百万円%円 銭
通期270,0000.412,0003.413,000△5.98,600△7.5250.58
※注記事項
(1)期中における連結範囲の重要な変更:有
除外2社(社名)広州泰李汽車座椅有限公司、襄陽東実李爾泰極愛思汽車座椅有限公司
(注)当連結会計年度において、出資持分の一部を譲渡したことにより、広州泰李汽車座椅有限公司及び襄陽東実
李爾泰極愛思汽車座椅有限公司を連結子会社から持分法適用会社に変更しております。
(2)会計方針の変更・会計上の見積りの変更・修正再表示
①会計基準等の改正に伴う会計方針の変更:無
②①以外の会計方針の変更:無
③会計上の見積りの変更:無
④修正再表示:無
(3)発行済株式数(普通株式)
①期末発行済株式数(自己株式を含む)
2026年3月期35,242,846株2025年3月期35,242,846株
②期末自己株式数
2026年3月期922,317株2025年3月期960,417株
③期中平均株式数
2026年3月期34,304,660株2025年3月期34,281,660株
(参考)個別業績の概要
1.2026年3月期の個別業績(2025年4月1日~2026年3月31日)
(1)個別経営成績
(%表示は対前期増減率)
売上高営業利益経常利益当期純利益
百万円%百万円%百万円%百万円%
2026年3月期99,809△7.05,20214.814,50751.313,31223.4
2025年3月期107,272△6.34,531196.19,58855.510,78782.8
1株当たり
当期純利益
潜在株式調整後
1株当たり当期純利益
円 銭円 銭
2026年3月期388.06334.31
2025年3月期314.67310.82
(2)個別財政状態
総資産純資産自己資本比率1株当たり純資産
百万円百万円%円 銭
2026年3月期101,33573,50672.52,141.58
2025年3月期96,90163,43265.51,850.11
(参考)自己資本2026年3月期73,500百万円2025年3月期63,426百万円
※決算短信は公認会計士又は監査法人の監査の対象外です
※業績予想の適切な利用に関する説明、その他特記事項
本資料に記載されている業績見通し等の将来に関する記述は、当社が現在入手している情報及び合理的であると
判断する一定の前提に基づいており、実際の業績等は様々な要因により大きく異なる可能性があります。
業績予想の前提となる条件及び業績予想のご利用にあたっての注意事項等については、添付資料P.4「1.経営
成績等の概況(4)今後の見通し」をご覧ください。
株式会社タチエス(7239)2026年3月期決算短信
-1-
○添付資料の目次
1.経営成績等の概況.........................................................................................................2
(1)当期の経営成績の概況.............................................................................................2
(2)当期の財政状態の概況.............................................................................................3
(3)当期のキャッシュ・フローの概況..............................................................................3
(4)今後の見通し.........................................................................................................4
(5)利益配分に関する基本方針及び当期・次期の配当.........................................................4
2.会計基準の選択に関する基本的な考え方...........................................................................4
3.連結財務諸表及び主な注記.............................................................................................5
(1)連結貸借対照表......................................................................................................5
(2)連結損益計算書及び連結包括利益計算書.....................................................................7
(3)連結株主資本等変動計算書.......................................................................................9
(4)連結キャッシュ・フロー計算書.................................................................................11
(5)連結財務諸表に関する注記事項.................................................................................12
(継続企業の前提に関する注記).................................................................................12
(会計方針の変更)...................................................................................................12
(セグメント情報等)................................................................................................12
(1株当たり情報)...................................................................................................14
(重要な後発事象)...................................................................................................15
4.個別財務諸表...............................................................................................................16
(1)貸借対照表............................................................................................................16
(2)損益計算書............................................................................................................18
(3)株主資本等変動計算書.............................................................................................19
株式会社タチエス(7239)2026年3月期決算短信
-2-
1.経営成績等の概況
(1)当期の経営成績の概況
当連結会計年度におけるわが国経済は、円安の進展、原材料価格やエネルギー価格の高騰他による物価上昇が継続す
るものの、賃上げや人手不足への対応を通じ所得・雇用環境は改善してきており、好調な企業収益も支えとなり、緩や
かな回復基調にあります。海外に目を向けますと、米国トランプ政権の流動的な経済・通商政策、中国経済の減速、ウ
クライナ他多地域に広がる紛争による国際情勢の緊迫化、足元ではイラン軍事衝突による原油価格の高騰や石油製品に
関連したサプライチェーンへの影響など、事業環境は先行きの不透明さを増しております。
当社グループが関連する自動車業界におきましては、電動化・知能化に向けた構造転換が中長期的な方向性として維
持される一方で、各国市場の需要動向や政策の変更により、新エネルギー車への移行ペースには地域差がみられます。
その結果、自動車メーカー各社は投資の選択と集中を進め、車種戦略・生産体制の見直しを行っております。また、中
国自動車メーカーがグローバルでプレゼンスを高める中、わが国の自動車メーカー・部品サプライヤーは、グローバル
での競争力の維持・向上のため、中国自動車メーカーに伍せるスピーディーな事業遂行力、高いコスト競争力が求めら
れております。
当連結会計年度は、中期経営計画「TransformativeValueEvolution(TVE)」の第2フェーズであるWave22027初
年度にあたり、第1フェーズTVEWave0/1で取り組んできた収益改善の維持・向上を図りつつ、2030年度売上高
4,000億円規模への引き上げに向け3つの「シンカ」において成長戦略を推進してまいりました。中核となる自動車シー
ト事業での深い「深化」では、事業領域の拡大を狙いとして2026年4月10日に株式会社TOYOH&Iとの間で同社が営む自
動車用シート及び内装事業に関連する株式を取得することに合意いたしました。また、新規ビジネスの獲得においては、
インドにおける新たな顧客の獲得など成果が挙がってきております。自動車シートで新たな価値提供を提案する進む
「進化」においては、プライベート空間と没入感による新たな体験価値を提供するコンセプトモデル「スマートシェ
ル」を2025年開催の人とくるまのテクノロジー展に出展し、大変好評をいただきました。自動車シート事業に次ぐ新し
い事業の創出に取り組む新しい「新化」では、候補事業領域を絞り、事業参入検討を進めております。その他の主な事
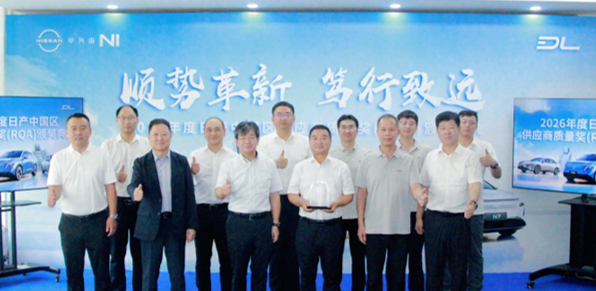
業活動成果としては、日本国内では本田技研工業株式会社向けN-ONEeのシート生産を立ち上げ、中国では上海汽車向け
の智己LS9のシート生産などを立ち上げました。また、シート表皮や骨格部品の各地域での生産も順調に立ち上がって
おります。
このような経営環境のもと、当連結会計年度における業績は、売上高は2,690億9百万円と前年同期比5.7%減となりま
したが、営業利益は116億4百万円(前年同期比20.6%増)、経常利益は138億1千万円(前年同期比28.2%増)、親会社株
主に帰属する当期純利益は92億9千7百万円(前年同期比17.8%減)となりました。
セグメントの業績は、次のとおりであります。
①日本
売上高は1,085億5千9百万円(前年同期比6.0%減)、営業利益は61億5千3百万円(前年同期比9.5%減)となりまし
た。
②北米
売上高は414億4千9百万円(前年同期比5.5%減)、営業利益は5億1千万円(前年同期は営業損失6千5百万円)と
なりました。
③中南米
売上高は1,037億4千4百万円(前年同期比0.0%増)、営業利益は23億4千2百万円(前年同期比22.4%減)となりま
した。
④中国
売上高は89億9千9百万円(前年同期比50.6%減)、営業利益は16億1千8百万円(前年同期は営業損失6億2百万円)
となりました。
⑤東南アジア
売上高は62億5千6百万円(前年同期比52.5%増)、営業利益は10億3千1百万円(前年同期比78.7%増)となりまし
た。
株式会社タチエス(7239)2026年3月期決算短信
-3-
(2)当期の財政状態の概況
当連結会計年度末の資産合計は、1,703億7千2百万円と前連結会計年度末に比べ15億8千4百万円減少しております。
これは主に、現金及び預金が20億4百万円、売掛金が31億3千2百万円それぞれ増加したものの、原材料及び貯蔵品が23
億5千5百万円、有形固定資産が25億5千4百万円、投資有価証券が25億1百万円、それぞれ減少したことによるものであ
ります。
負債合計は、644億6千8百万円と前連結会計年度末に比べ93億3百万円減少しております。これは主に、支払手形及
び買掛金が16億2千6百万円、短期借入金が70億5千6百万円それぞれ減少したことによるものであります。
純資産合計は、1,059億4百万円と前連結会計年度末に比べ77億1千8百万円増加しております。これは主に、利益剰
余金が57億4百万円、為替換算調整勘定が23億4百万円、それぞれ増加したことによるものであります。
(3)当期のキャッシュ・フローの概況
当連結会計年度末における現金及び現金同等物(以下、「資金」という。)は、445億7千7百万円と前連結会計年度末
に比べ9億8千4百万円(2.3%)増加しました。
(営業活動によるキャッシュ・フロー)
営業活動により得られた資金は、135億8千3百万円であり、前連結会計年度と比べ38億1千9百万円(39.1%)増
加しました。これは主に、売上債権の増減額が72億1千5百万円の減少であったものの、仕入債務の増減額が72億3
千3百万円、固定資産処分損益が32億1千9百万円、それぞれ増加したことによるものであります。
(投資活動によるキャッシュ・フロー)
投資活動により使用した資金は、35億8千8百万円であり、前連結会計年度と比べ75億5千万円(前連結会計年度は
39億6千2百万円の獲得)増加しました。これは主に、有形固定資産の売却による収入が40億1千2百万円減少したこ
とによるものであります。
(財務活動によるキャッシュ・フロー)
財務活動により使用した資金は、123億6千9百万円であり、前連結会計年度と比べ30億7千5百万円(33.1%)増加
しました。これは主に、短期借入金の返済が前連結会計年度と比べ増加したことから、短期借入金の純増減額が97
億9千3百万円の減少となったことによるものです。
(参考)キャッシュ・フロー関連指標の推移
2022年3月期2023年3月期2024年3月期2025年3月期2026年3月期
自己資本比率(%)45.847.349.756.061.6
時価ベースの
自己資本比率(%)
21.424.237.934.240.9
キャッシュ・フロー
対有利子負債比率(倍)
―5.30.61.10.5
インタレスト・
カバレッジ・レシオ(倍)
―7.418.023.1337.5
自己資本比率:自己資本/総資産
時価ベースの自己資本比率:株式時価総額/総資産
キャッシュ・フロー対有利子負債比率:有利子負債/キャッシュ・フロー
インタレスト・カバレッジ・レシオ:キャッシュ・フロー/利払い
(注1)いずれも連結ベースの財務数値により計算しています。
(注2)株式時価総額は、自己株式を除く発行済株式数をベースに計算しています。
(注3)キャッシュ・フローは、営業キャッシュ・フローを利用しています。
(注4)有利子負債は連結貸借対照表に計上されている負債のうち利子を支払っているすべての負債を対象としています。
株式会社タチエス(7239)2026年3月期決算短信
-4-
(4)今後の見通し
当社は、2025~2030年度中期経営計画「TransformativeValueEvolution(TVE)」のWave2では、成長の実現「飛
躍」と同時にさらなる収益改善に取り組んでまいります。このような状況のもと、当社グループの次期の連結業績予
想は次のとおりであります。
(単位:百万円)
次期の見通し
(2027年3月期)
当期の実績
(2026年3月期)
当期と次期の増減率
売上高270,000269,0090.4%
営業利益12,00011,6043.4%
経常利益13,00013,810-5.9%
親会社株主に帰属
する当期純利益
8,6009,297-7.5%
(注1)上記の業績予想の前提とした主要な為替レートは、1米ドル=152円、1メキシコペソ=8.2円、
1中国人民元=22円であります。
(注2)上記の業績予想は、当社が現時点において合理的と判断した一定の前提に基づき算出したものであり、実際
の業績等は様々な要因により予想と大きく異なる可能性があります。
(注3)2026年4月10日付で公表いたしました「子会社の異動を伴う株式の取得及び特定子会社の異動に関するお知
らせ」に記載の取引については、現在その影響額等を精査中であることから、本業績予想には織り込んでお
りません。今後、業績予想の修正等、開示すべき事項が生じた場合には、速やかに開示いたします。
(5)利益配分に関する基本方針及び当期・次期の配当
当社の利益配分に関する基本方針は、2025年度より始まる中期経営計画「TransformativeValueEvolution(TVE)
Wave22027」(2025年度から2027年度)の期間は、当社の持続的成長と株主の皆様への長期的な利益を一層重視するた
めに機動的な施策を可能とし、経済の状況に左右されることなく配当額の安定性を高めるため、1株当たりの配当下
限額を103.8円に設定させていただくとともに、総還元性向として目標値を50%以上とする方針としております。
なお、当社は、取締役会の決議をもって剰余金の配当を行うことができる旨を定款に定めており、中間、期末の年
2回、配当を行うことを基本としております。
2026年3月期の期末配当金は、本日開催の取締役会決議により、1株当たり普通配当53.1円とさせていただきまし
た。これにより、既に実施しております中間配当金1株当たり51.9円と合わせまして、当期の年間配当金は105.0円と
なります。
また、2027年3月期の1株当たり配当金につきましては、普通配当115円(中間57.5円、期末57.5円)を実施する予
定です。
2.会計基準の選択に関する基本的な考え方
当社グループは、連結財務諸表の期間比較可能性及び企業間の比較可能性を考慮し、当面は、日本基準で連結財務諸
表を作成する方針であります。
なお、IFRSの適用につきましては、国内外の情勢等を考慮の上、適切に対応していく方針であります。
株式会社タチエス(7239)2026年3月期決算短信
-5-
3.連結財務諸表及び主な注記
(1)連結貸借対照表
(単位:百万円)
前連結会計年度
(2025年3月31日)
当連結会計年度
(2026年3月31日)
資産の部
流動資産
現金及び預金43,68045,684
受取手形3,9692,801
売掛金40,39743,530
有価証券-8
商品及び製品1,9811,822
仕掛品1,5051,230
原材料及び貯蔵品15,39413,038
その他7,1497,340
貸倒引当金△1,291△1,220
流動資産合計112,786114,236
固定資産
有形固定資産
建物及び構築物(純額)9,7029,398
機械装置及び運搬具(純額)11,56011,316
土地6,6216,667
建設仮勘定2,6731,638
その他(純額)5,0234,005
有形固定資産合計35,58133,026
無形固定資産
その他1,3741,094
無形固定資産合計1,3741,094
投資その他の資産
投資有価証券6,4593,958
長期貸付金129
繰延税金資産5,4476,278
退職給付に係る資産1,8132,418
その他8,8989,630
貸倒引当金△417△280
投資その他の資産合計22,21522,015
固定資産合計59,17156,136
資産合計171,957170,372
株式会社タチエス(7239)2026年3月期決算短信
-6-
(単位:百万円)
前連結会計年度
(2025年3月31日)
当連結会計年度
(2026年3月31日)
負債の部
流動負債
支払手形及び買掛金34,78933,162
短期借入金7,10246
リース債務799809
未払法人税等1,5551,880
未払費用10,08910,694
役員賞与引当金6063
訴訟損失引当金381408
その他7,2745,698
流動負債合計62,05252,764
固定負債
社債4,0114,009
リース債務2,6041,561
繰延税金負債1,6712,086
株式給付引当金440412
退職給付に係る負債2,8873,542
その他10492
固定負債合計11,72011,704
負債合計73,77264,468
純資産の部
株主資本
資本金9,0409,040
資本剰余金7,9077,907
利益剰余金61,18566,890
自己株式△1,366△1,305
株主資本合計76,76782,533
その他の包括利益累計額
その他有価証券評価差額金592884
為替換算調整勘定18,76321,068
退職給付に係る調整累計額150394
その他の包括利益累計額合計19,50622,347
新株予約権66
非支配株主持分1,9051,017
純資産合計98,185105,904
負債純資産合計171,957170,372
株式会社タチエス(7239)2026年3月期決算短信
-7-
(2)連結損益計算書及び連結包括利益計算書
連結損益計算書
(単位:百万円)
前連結会計年度
(自2024年4月1日
至2025年3月31日)
当連結会計年度
(自2025年4月1日
至2026年3月31日)
売上高285,394269,009
売上原価255,630237,231
売上総利益29,76331,777
販売費及び一般管理費
従業員給料及び手当6,4656,142
役員賞与引当金繰入額6063
退職給付費用165261
発送運賃2,8752,737
減価償却費994714
貸倒引当金繰入額△61△128
その他9,64010,382
販売費及び一般管理費合計20,13820,172
営業利益9,62511,604
営業外収益
受取利息868640
受取配当金512232
持分法による投資利益392438
為替差益-706
雑収入373655
営業外収益合計2,1462,673
営業外費用
支払利息401382
為替差損508-
雑支出9284
営業外費用合計1,003467
経常利益10,76813,810
特別利益
固定資産売却益3,41649
投資有価証券売却益59507
関係会社出資金売却益-21
関係会社株式売却益2,010-
子会社清算益845-
特別利益合計6,333578
特別損失
固定資産処分損16747
減損損失383-
事業構造改善費用6741,061
関係会社出資金評価損356-
関係会社出資金売却損16-
特別損失合計1,5981,108
税金等調整前当期純利益15,50313,281
法人税、住民税及び事業税3,4494,191
法人税等調整額1,179△625
法人税等合計4,6283,566
当期純利益10,8749,714
非支配株主に帰属する当期純利益又は非支配株主に
帰属する当期純損失(△)
△435417
親会社株主に帰属する当期純利益11,3109,297
株式会社タチエス(7239)2026年3月期決算短信
-8-
連結包括利益計算書
(単位:百万円)
前連結会計年度
(自2024年4月1日
至2025年3月31日)
当連結会計年度
(自2025年4月1日
至2026年3月31日)
当期純利益10,8749,714
その他の包括利益
その他有価証券評価差額金△1,287292
為替換算調整勘定3852,091
退職給付に係る調整額△125243
持分法適用会社に対する持分相当額416230
その他の包括利益合計△6112,858
包括利益10,26312,572
(内訳)
親会社株主に係る包括利益10,70312,138
非支配株主に係る包括利益△439434
株式会社タチエス(7239)2026年3月期決算短信
-9-
(3)連結株主資本等変動計算書
前連結会計年度(自2024年4月1日至2025年3月31日)
(単位:百万円)
株主資本
資本金資本剰余金利益剰余金自己株式株主資本合計
当期首残高9,0408,71353,277△1,36869,662
当期変動額
剰余金の配当△3,402△3,402
親会社株主に帰属する
当期純利益
11,31011,310
自己株式の処分22
非支配株主との取引に
係る親会社の持分変動
△805△805
株主資本以外の項目の
当期変動額(純額)
当期変動額合計-△8057,90827,104
当期末残高9,0407,90761,185△1,36676,767
その他の包括利益累計額
新株予約権非支配株主持分純資産合計
その他有価証券
評価差額金
為替換算
調整勘定
退職給付に係る
調整累計額
その他の包括
利益累計額合計
当期首残高1,87917,95827520,113-6,52296,298
当期変動額
剰余金の配当△3,402
親会社株主に帰属する
当期純利益
11,310
自己株式の処分2
非支配株主との取引に
係る親会社の持分変動
△805
株主資本以外の項目の
当期変動額(純額)
△1,287805△125△6076△4,616△5,218
当期変動額合計△1,287805△125△6076△4,6161,886
当期末残高59218,76315019,50661,90598,185
株式会社タチエス(7239)2026年3月期決算短信
-10-
当連結会計年度(自2025年4月1日至2026年3月31日)
(単位:百万円)
株主資本
資本金資本剰余金利益剰余金自己株式株主資本合計
当期首残高9,0407,90761,185△1,36676,767
当期変動額
剰余金の配当△3,592△3,592
親会社株主に帰属する
当期純利益
9,2979,297
自己株式の処分6161
非支配株主との取引に
係る親会社の持分変動
-
株主資本以外の項目の
当期変動額(純額)
当期変動額合計--5,704615,766
当期末残高9,0407,90766,890△1,30582,533
その他の包括利益累計額
新株予約権非支配株主持分純資産合計
その他有価証券
評価差額金
為替換算
調整勘定
退職給付に係る
調整累計額
その他の包括
利益累計額合計
当期首残高59218,76315019,50661,90598,185
当期変動額
剰余金の配当△3,592
親会社株主に帰属する
当期純利益
9,297
自己株式の処分61
非支配株主との取引に
係る親会社の持分変動
-
株主資本以外の項目の
当期変動額(純額)
2922,3042432,840-△8871,952
当期変動額合計2922,3042432,840-△8877,718
当期末残高88421,06839422,34761,017105,904
株式会社タチエス(7239)2026年3月期決算短信
-11-
(4)連結キャッシュ・フロー計算書
(単位:百万円)
前連結会計年度
(自2024年4月1日
至2025年3月31日)
当連結会計年度
(自2025年4月1日
至2026年3月31日)
営業活動によるキャッシュ・フロー
税金等調整前当期純利益15,50313,281
減価償却費5,6855,122
減損損失383-
貸倒引当金の増減額(△は減少)△167△299
受取利息及び受取配当金△1,380△872
支払利息401382
持分法による投資損益(△は益)△392△438
固定資産処分損益(△は益)△3,221△2
投資有価証券売却損益(△は益)△59△507
売上債権の増減額(△は増加)4,329△2,886
棚卸資産の増減額(△は増加)1,4172,780
仕入債務の増減額(△は減少)△8,165△931
関係会社株式売却損益(△は益)△2,010-
その他△1,245△253
小計11,07515,373
利息及び配当金の受取額2,8282,215
利息の支払額△421△40
法人税等の支払額△3,718△3,965
営業活動によるキャッシュ・フロー9,76413,583
投資活動によるキャッシュ・フロー
定期預金の預入による支出△0△1,000
有形固定資産の取得による支出△4,460△4,775
有形固定資産の売却による収入4,09986
投資有価証券の取得による支出△25-
投資有価証券の売却による収入963,209
関係会社株式の売却による収入3,558-
関係会社出資金の売却による収入908-
連結の範囲の変更を伴う子会社出資金の売却に
よる支出
-△889
その他△215△218
投資活動によるキャッシュ・フロー3,962△3,588
財務活動によるキャッシュ・フロー
短期借入金の純増減額(△は減少)1,500△8,293
長期借入金の返済による支出△5,500-
社債の発行による収入4,012-
自己株式の増減額(△は増加)-61
非支配株主への配当金の支払額△1,131△274
配当金の支払額△3,416△3,592
連結の範囲の変更を伴わない子会社株式の取得
による支出
△3,850-
その他△906△271
財務活動によるキャッシュ・フロー△9,294△12,369
現金及び現金同等物に係る換算差額333,358
現金及び現金同等物の増減額(△は減少)4,465984
現金及び現金同等物の期首残高39,12743,593
現金及び現金同等物の期末残高43,59344,577
株式会社タチエス(7239)2026年3月期決算短信
-12-
(5)連結財務諸表に関する注記事項
(継続企業の前提に関する注記)
該当事項はありません。
(会計方針の変更)
該当事項はありません。
(セグメント情報等)
(セグメント情報)
1報告セグメントの概要
当社の報告セグメントは、当社の構成単位のうち分離された財務情報が入手可能であり、取締役会が経営資源の
配分の決定及び業績を評価するために、定期的に検討を行う対象となっているものであります。
当社グループは、主に自動車座席及び座席部品を製造・販売しており、各社ごとに事業戦略を立案し、事業活動
を展開しております。
したがって、当社グループは、各社別のセグメントから構成されております。なお、経済的特徴等が概ね類似し
ている事業セグメントを集約した結果、「日本」、「北米」、「中南米」、「中国」、「東南アジア」の5つを報
告セグメントとしております。また、前連結会計年度において、「欧州」に記載していたTachi-SEngineering
EuropeS.A.R.L.を清算し、連結の範囲から除外したことに伴い、当連結会計年度より、報告セグメントから「欧
州」を除外しております。
2報告セグメントごとの売上高、利益又は損失、資産、負債その他の項目の金額の算定方法
報告セグメントの会計処理の方法は、連結財務諸表作成のために採用している会計処理の方法と同一でありま
す。
また、報告セグメントの利益は営業利益ベースの数値であり、セグメント間の内部収益及び振替高は市場実勢価
格に基づいております。
3報告セグメントごとの売上高、利益又は損失、資産、その他の項目の金額に関する情報
前連結会計年度(自2024年4月1日 至2025年3月31日)
(単位:百万円)
報告セグメント
調整額
(注)1
連結
財務諸表
計上額
(注)2
日本北 米中 南 米欧 州中国
東南
アジア
計
売上高
顧客との契約か
ら生じる収益
115,50243,849103,7111418,2144,101285,394-285,394
外部顧客
への売上高
115,50243,849103,7111418,2144,101285,394-285,394
セグメント間
の内部売上高
又は振替高
6,7732511,587-11,2461,49821,357△21,357-
計122,27644,100105,2991429,4605,600306,752△21,357285,394
セグメント利益
又は損失(△)
6,797△653,018△61△6025779,663△389,625
セグメント資産123,51837,25851,658-22,2125,874240,522△68,564171,957
その他の項目
減価償却費2,0267131,66291,0941785,685-5,685
持分法適用会社
への投資額
4,799---2,269-7,069-7,069
有形固定資産
及び無形固定
資産の増加額
2,2407481,301-9641365,391△1205,270
(注)1調整額は、セグメント間取引消去によるものであります。
(1)セグメント利益又は損失(△)の調整額は、セグメント間取引消去等によるものであります。
(2)セグメント資産の調整額は、セグメント間債権の消去等によるものであります。
2セグメント利益又は損失(△)は、連結損益計算書の営業利益と調整を行っております。
株式会社タチエス(7239)2026年3月期決算短信
-13-
当連結会計年度(自2025年4月1日 至2026年3月31日)
(単位:百万円)
報告セグメント
調整額
(注)1
連結
財務諸表
計上額
(注)2
日本北 米中 南 米中国
東南
アジア
計
売上高
顧客との契約か
ら生じる収益
108,55941,449103,7448,9996,256269,009-269,009
外部顧客
への売上高
108,55941,449103,7448,9996,256269,009-269,009
セグメント間
の内部売上高
又は振替高
5,7481406088,8451,52416,866△16,866-
計114,30741,590104,35217,8457,780285,876△16,866269,009
セグメント利益6,1535102,3421,6181,03111,655△5011,604
セグメント資産123,48035,30750,70917,3876,071232,957△62,584170,372
その他の項目
減価償却費1,8943582,0175133395,122-5,122
持分法適用会社
への投資額
5,384--2,021-7,4051147,520
有形固定資産
及び無形固定
資産の増加額
2,5534279292494964,657-4,657
(注)1調整額は、セグメント間取引消去によるものであります。
(1)セグメント利益の調整額は、セグメント間取引消去等によるものであります。
(2)セグメント資産の調整額は、セグメント間債権の消去等によるものであります。
2セグメント利益は、連結損益計算書の営業利益と調整を行っております。
株式会社タチエス(7239)2026年3月期決算短信
-14-
(1株当たり情報)
前連結会計年度
(自2024年4月1日
至2025年3月31日)
当連結会計年度
(自2025年4月1日
至2026年3月31日)
1株当たり純資産額2,808.251株当たり純資産額3,055.91
1株当たり当期純利益329.931株当たり当期純利益271.03
潜在株式調整後1株当たり当期純利益325.90潜在株式調整後1株当たり当期純利益233.49
(注)1当社は「取締役向け株式交付信託」及び「従業員向け株式交付信託」を導入しております。株主資本にお
いて自己株式として計上されている信託に残存する当社株式は、1株当たり当期純利益の算定上、期中平
均株式数の計算において控除する自己株式に含めており、また、1株当たり純資産額の算定上、期末発行
済株式総数から控除する自己株式数に含めております。なお、信託にかかる期中平均株式数は次のとおり
であります。
・取締役向け株式交付信託
期中平均株式数:前連結会計年度61,400株、当連結会計年度58,569株
期末株式数:前連結会計年度61,400株、当連結会計年度56,800株
・従業員向け株式交付信託
期中平均株式数:前連結会計年度270,067株、当連結会計年度249,898株
期末株式数:前連結会計年度269,298株、当連結会計年度235,798株
21株当たり当期純利益及び潜在株式調整後1株当たり当期純利益の算定上の基礎は、以下のとおりでありま
す。
前連結会計年度
(自2024年4月1日
至2025年3月31日)
当連結会計年度
(自2025年4月1日
至2026年3月31日)
1株 当 た り 当 期 純 利益
親会社株主に帰属する当期純利益(百万円)11,3109,297
普通株主に帰属しない金額(百万円)--
普通株式に係る親会社株主に帰属する当期純利益(百万円)11,3109,297
普通株式の期中平均株式数(千株)34,28134,304
潜 在 株 式 調 整後1株 当 た り 当 期 純 利益
親会社株主に帰属する当期純利益調整額(百万円)--
普通株式増加数(千株)4245,515
(うち、新株予約権(千株))(254)(3,311)
(うち、転換社債型新株予約権付社債(千株))(169)(2,204)
希薄化効果を有しないため、潜在株式調整後1株当たり当期
運利益の算定に含めえなかった潜在株式の概要
--
株式会社タチエス(7239)2026年3月期決算短信
-15-
(重要な後発事象)
(子会社の異動を伴う株式の取得)
当社は、2026年4月10日開催の取締役会において、①株式会社TOYOH&I(以下「TOYOH&I」といいます。)が新
た に 設 立し、②TOYOH&Iが 保 有 す る 株 式 会社 東 洋 シ ート、ToyoSeatUSACorporation、TOYOSEATEurope
AutóalkatrészGyártóésKereskedelmiKorlátoltFelelősségűTársaság(英語名称:TOYOSEATEuropeKft.)、
ToyoSeatHongKongCompanyLimited、ToyoSeatPhilippinesCorporation及び南条装備工業株式会社(総称し
て、以下「TOYOH&Iグループ」といいます。)の株式または持分並びにTOYOH&Iグループが営む自動車用シート及
び内装事業に関連する資産等を、会社分割(吸収分割)の方法により承継させる株式会社タチエストーヨーグル
ープホールディングスの株式を取得し、子会社化すること(以下「本株式取得」といいます。)について決議いた
しました。
詳細につきましては、2026年4月10日公表の「子会社の異動を伴う株式の取得及び特定子会社の異動に関するお
知らせ」をご参照ください。
なお、本株式取得による当社の2026年3月期の業績への影響につきましては軽微であります。
株式会社タチエス(7239)2026年3月期決算短信
-16-
4.個別財務諸表
(1)貸借対照表
(単位:百万円)
前事業年度
(2025年3月31日)
当事業年度
(2026年3月31日)
資産の部
流動資産
現金及び預金15,81019,090
電子記録債権2,6132,343
売掛金20,04322,978
商品及び製品267273
仕掛品1,231440
原材料及び貯蔵品2,8832,248
前渡金-3
短期貸付金7,9635,813
その他2,1552,508
貸倒引当金△4,178△361
流動資産合計48,79155,337
固定資産
有形固定資産
建物(純額)3,2173,157
構築物(純額)9897
機械及び装置(純額)1,7301,658
車両運搬具(純額)00
工具、器具及び備品(純額)475328
土地3,3593,359
建設仮勘定1720
有形固定資産合計8,8988,621
無形固定資産
ソフトウエア395462
その他1616
無形固定資産合計411478
投資その他の資産
投資有価証券5,8273,567
関係会社株式24,81924,819
出資金00
関係会社出資金6,7906,772
従業員に対する長期貸付金106
長期前払費用54219
前払年金費用577708
繰延税金資産432550
その他291256
貸倒引当金△4△4
投資その他の資産合計38,80036,897
固定資産合計48,11045,997
資産合計96,901101,335
株式会社タチエス(7239)2026年3月期決算短信
-17-
(単位:百万円)
前事業年度
(2025年3月31日)
当事業年度
(2026年3月31日)
負債の部
流動負債
支払手形31-
電子記録債務1,7454,749
買掛金13,96513,049
短期借入金7,030-
関係会社短期借入金1,30846
未払金448300
未払費用2,8913,138
未払法人税等7031,168
預り金126234
設備関係支払手形84107
前受収益937
役員賞与引当金6063
その他570472
流動負債合計28,97623,367
固定負債
社債4,0114,009
株式給付引当金440412
その他4040
固定負債合計4,4924,462
負債合計33,46927,829
純資産の部
株主資本
資本金9,0409,040
資本剰余金
資本準備金8,5928,592
その他資本剰余金1212
資本剰余金合計8,6048,604
利益剰余金
利益準備金480480
その他利益剰余金
圧縮記帳積立金1918
別途積立金15,00015,000
繰越利益剰余金31,05540,775
利益剰余金合計46,55556,275
自己株式△1,366△1,305
株主資本合計62,83472,615
評価・換算差額等
その他有価証券評価差額金591884
評価・換算差額等合計591884
新株予約権66
純資産合計63,43273,506
負債純資産合計96,901101,335
株式会社タチエス(7239)2026年3月期決算短信
-18-
(2)損益計算書
(単位:百万円)
前事業年度
(自2024年4月1日
至2025年3月31日)
当事業年度
(自2025年4月1日
至2026年3月31日)
売上高107,27299,809
売上原価
製品期首棚卸高348294
当期製品製造原価94,74087,184
合計95,08887,479
製品期末棚卸高294296
製品売上原価94,79387,183
売上総利益12,47912,626
販売費及び一般管理費
従業員給料及び手当1,9321,926
役員報酬240219
賞与471584
役員賞与引当金繰入額6063
退職給付費用12387
発送運賃1,1321,030
試験研究費9771,323
貸倒引当金繰入額490△265
減価償却費335303
その他2,1832,150
販売費及び一般管理費合計7,9477,423
営業利益4,5315,202
営業外収益
受取利息5151,096
受取配当金4,8314,261
為替差益-525
貸倒引当金戻入額463,681
雑収入118152
営業外収益合計5,5119,717
営業外費用
支払利息316251
為替差損88-
雑支出50160
営業外費用合計454412
経常利益9,58814,507
特別利益
固定資産売却益6600
投資有価証券売却益59505
関係会社出資金売却益-28
子会社清算益1,792-
特別利益合計2,512533
特別損失
固定資産処分損13120
事業構造改善費用15318
関係会社出資金評価損333-
特別損失合計61739
税引前当期純利益11,48315,001
法人税、住民税及び事業税1,0661,951
法人税等調整額△370△261
法人税等合計6961,689
当期純利益10,78713,312
株式会社タチエス(7239)2026年3月期決算短信
-19-
(3)株主資本等変動計算書
前事業年度(自2024年4月1日至2025年3月31日)
(単位:百万円)
株主資本
資本金
資本剰余金利益剰余金
資本準備金
その他資本
剰余金
資本剰余金
合計
利益準備金
その他利益剰余金
利益剰余金
合計
圧縮記帳
積立金
別途積立金
繰越利益
剰余金
当期首残高9,0408,592128,6044801915,00023,67039,170
当期変動額
剰余金の配当△3,402△3,402
当期純利益10,78710,787
圧縮記帳積立金の取崩△00-
自己株式の処分
株主資本以外の項目の
当期変動額(純額)
当期変動額合計-----△0-7,3857,384
当期末残高9,0408,592128,6044801915,00031,05546,555
株主資本評価・換算差額等
新株予約権純資産合計
自己株式
株主資本
合計
その他
有価証券
評価差額金
評価・換算
差額等合計
当期首残高△1,36855,4471,8781,878-57,325
当期変動額
剰余金の配当△3,402△3,402
当期純利益10,78710,787
圧縮記帳積立金の取崩--
自己株式の処分222
株主資本以外の項目の
当期変動額(純額)
△1,286△1,2866△1,280
当期変動額合計27,387△1,286△1,28666,106
当期末残高△1,36662,834591591663,432
株式会社タチエス(7239)2026年3月期決算短信
-20-
当事業年度(自2025年4月1日至2026年3月31日)
(単位:百万円)
株主資本
資本金
資本剰余金利益剰余金
資本準備金
その他資本
剰余金
資本剰余金
合計
利益準備金
その他利益剰余金
利益剰余金
合計
圧縮記帳
積立金
別途積立金
繰越利益
剰余金
当期首残高9,0408,592128,6044801915,00031,05546,555
当期変動額
剰余金の配当△3,592△3,592
当期純利益13,31213,312
圧縮記帳積立金の取崩△00-
自己株式の処分
株主資本以外の項目の
当期変動額(純額)
当期変動額合計-----△0-9,7199,719
当期末残高9,0408,592128,6044801815,00040,77556,275
株主資本評価・換算差額等
新株予約権純資産合計
自己株式
株主資本
合計
その他
有価証券
評価差額金
評価・換算
差額等合計
当期首残高△1,36662,834591591663,432
当期変動額
剰余金の配当△3,592△3,592
当期純利益13,31213,312
圧縮記帳積立金の取崩--
自己株式の処分616161
株主資本以外の項目の
当期変動額(純額)
293293-293
当期変動額合計619,780293293-10,073
当期末残高△1,30572,615884884673,506
 **