(Note) This document has been translated from the Japanese original for reference purposes only. In the event of any discrepancy between this translated document and the Japanese original, the original shall prevail. The Company assumes no…
(Note) This document has been translated from the Japanese original for reference purposes only. In the event of any discrepancy
between this translated document and the Japanese original, the original shall prevail. The Company assumes no responsibility for
this translation or for direct, indirect or any other forms of damages arising from the translation.
Securities code: 7220
June 4, 2026
Dear shareholders:
Hiroshi Otsuka
Representative Director and President
Musashi Seimitsu Industry Co., Ltd.
39-5 Daizen, Ueta-cho, Toyohashi-shi, Aichi
Notice of Convocation of the 99th
Annual Meeting of Shareholders
You are cordially invited to attend the 99th Annual Meeting of Shareholders of Musashi Seimitsu Industry
Co., Ltd. (the “Company”). The Securities Report is scheduled to be released on June 22 (Mon.) prior to the
Meeting of Shareholders, so please refer to it as well.
In convening this Annual Meeting of Shareholders, for the information contained in the Reference
Documents for the Annual Meeting of Shareholders (items for which the measures for providing information
in electronic format are to be taken), we have taken measures for providing information in electronic format,
and the information is provided online on the following websites.
<Musashi Seimitsu Industry Co., Ltd. Website>
https://www.musashi.co.jp/ir/library/shareholder_materials/
<Tokyo Stock Exchange Website>
https://www2.jpx.co.jp/tseHpFront/JJK010010Action.do?Show=Show
(Access the Tokyo Stock Exchange Website, enter and search for the “issue name (company name)” “Musashi
Seimitsu Industry” or the Company’s security code “7220” in “Code,” and select “Basic information” and
then “Documents for public inspection/PR information” to view the information provided.)
If you are unable to attend the meeting, you can exercise your voting rights in writing or via the Internet, etc.
Please review the Reference Documents for the Annual Meeting of Shareholders and exercise your voting
rights by 5:00 p.m. on Thursday, June 25, 2026.
Meeting Details
- Date and Time:
- Venue:
Friday, June 26, 2026 at 10:00 a.m. (Reception will open at 9:00 a.m.; Japan Standard
Time)
Conference Room of the Company’s Head Office
39-5 Daizen, Ueta-cho, Toyohashi-shi, Aichi
- Purposes:
Items to be reported:
- Business Report and Consolidated Financial Statements, as well as the audit reports of the
Financial Auditor and the Audit and Supervisory Committee for Consolidated Financial Statements,
for the 99th fiscal term (from April 1, 2025 to March 31, 2026)
Non-consolidated Financial Statements for the 99th fiscal term (from April 1, 2025 to March 31,
2026)
Items to be resolved:
Proposal 1:
Appropriation of Surplus
Proposal 2:
Election of Eight (8) Directors (Excluding Directors Serving as Audit
and Supervisory Committee Members)
Proposal 3:
Election of One (1) Director Serving as Audit and Supervisory
Committee Members
Proposal 4:
Election of One (1) Substitute Director Serving as Audit and
Supervisory Committee Member
Proposal 5:
Determination of Remuneration for Granting Restricted Shares to
Directors Serving as Audit and Supervisory Committee Members
Information for Our Shareholders
◦Please use our shuttle bus service (departing at 9:15 a.m. and 9:30 a.m.) from the West Exit of the
Toyohashi Station served by JR Tokaido Shinkansen and JR Tokaido Main Line.
◦Souvenirs will be provided to shareholders who attend in person. (Each attending shareholder will receive
one souvenir, regardless of the number of voting rights held.)
◦We will be exhibiting our products at the venue of this Annual Meeting of Shareholders. This will be a rare
opportunity for you to see our latest product lineup.
◦ Please contact the inquiries by Friday, June 19, 2026, for preparation purposes, if you are shareholders
who require assistance with support, guidance, etc., at the venue.
<Inquiries>
Secretary of Annual Meeting of Shareholders, Musashi Seimitsu Industry Co., Ltd.
Tel: 0532-25-8111 (Main)
◦If any changes have been made to the items for which the measures for providing information in
electronic format are to be taken, such changes will be posted on the Company’s website and the TSE
website.
◦The Company will provide notification on its website if it makes substantial operational changes with
respect to the Annual Meeting of Shareholders due to developments going forward.
The Company’s website: (https://www.musashi.co.jp)
Instructions for Exercising Voting Rights, etc.
Voting right at the annual meeting of shareholders is an important right of shareholders.
Please exercise your voting rights.
There are three methods exercising your voting rights.
- Exercising Voting Rights in writing
Complete the enclosed Voting Rights Exercise Form by indicating your approval or disapproval of the proposals
and return it early.
Votes to be received by:
Thursday, June 25, 2026 at 5:00 p.m.
- Exercising Voting Rights via the Internet
Access the voting rights exercise website from a PC or a smartphone. If you are using a smartphone, you can
exercise your voting rights directly with the QR code. Please see the next page for details.
Votes to be given by:
Thursday, June 25, 2026 at 5:00 p.m.
- Attending the Annual Meeting of Shareholders
Present the Voting Rights Exercise Form to the receptionist at the meeting.
Date and Time:
Friday, June 26, 2026 at 10:00 a.m.
Venue:
Conference Room of the Company’s Head Office
39-5 Daizen, Ueta-cho, Toyohashi-shi, Aichi
Handling of Multiple Exercises of Voting Rights
- If you exercise your voting rights twice, in writing and via the Internet, we will treat those via the Internet as valid.
- If you exercise your voting rights more than once via the Internet, we will treat the last vote as valid.
- The costs incurred for accessing the site for exercising voting rights (such as Internet connection fees) will be borne by
the shareholders.
- Depending on the Internet use environment of the shareholders, it may not be available.
- QR code is a registered trademark of DENSO WAVE Inc.
Exercising Voting Rights via the Internet
Voting by a smartphone
1.
2.
By scanning the QR code located on the bottom right of the Voting Rights Exercise Form, you can
simply exercise your voting rights.
Please follow the directions that appear on the screen to input approval or disapproval to each
proposal.
Note: If you need to change your votes after excising your voting rights, please log in the Website for
Exercising Voting Rights for a PC by using your Login ID and Password provided on the Voting Rights
Exercise Form and exercise your voting rights again.
- Please note that it is not possible to complete this procedure via some mobile phones (feature
phones, etc.).
Voting by a PC
1.
2.
3.
Please access the Website, https://www.net-vote.com/ for Exercising Voting Rights.
You see the Top screen.
Then at the Login Screen, please enter the Login ID and Password provided on the Voting Rights
Exercise Form, and choose the “Login” button.
Information for electronic voting platform
Institutional investors who have already applied to use of the electronic voting platform operated by ICJ Inc.,
may also use this platform to exercise their voting rights, in addition to internet platforms listed above.
Inquiries for System, etc.
IR Japan Inc., Transfer Agency Services Department
Helpline: 0120-975-960
Reception: 9:00 a.m. - 5:00 p.m. (excluding Saturdays, Sundays and public holidays)
Reference Documents for the Annual Meeting of Shareholders
Proposal 1:
Appropriation of Surplus
Alongside the enhancement of corporate value through business growth, we recognize the return of profits to all
shareholders to be a key management issue. Our basic policy on returning profits to shareholders is to secure enough
capital for medium- and long-term business growth and make every effort to ensure a sound financial position while
continuing to pay stable dividends in line with earnings growth.
In light of this basic policy, for the appropriation of surplus for the 99th fiscal term, the Company proposes the
following.
Matters relating to year-end dividends
Type of dividend property
Cash
Dividend amount to be allocated
Per share of common stock:
Total dividends:
¥ 15
¥ 983,113,065
Effective date of dividends of surplus
June 29, 2026
Proposal 2:
Election of Eight (8) Directors (Excluding Directors Serving as Audit and Supervisory
Committee Members)
The terms of office of eight (8) Directors (excluding Directors serving as Audit and Supervisory Committee
Members; the same is applied throughout this proposal) shall expire upon the conclusion of this Annual
Meeting of Shareholders.
Therefore, the Company proposes the election eight (8) Directors.
As for this proposal, the Audit and Supervisory Committee has judged that all the candidates for Director are
qualified.
The candidates for Director are as follows:
No.
Name
(Date of birth)
Hiroshi Otsuka
(Jul. 6, 1965)
Career summary, positions and areas of responsibility in the Company,
and significant concurrent positions
Jul. 1993
Entered the Company
Apr.1997
President and Director of TAP Manufacturing Ltd.
(currently Musashi Auto Parts UK Ltd.)
Feb. 2000
President and Director of Musashi Hungary
Manufacturing, Ltd.
Jun. 2001
Director of the Company
May. 2002
Senior General Manager of Sales Division of the
Company
Jun. 2004
Managing Director of the Company
Jun. 2005
Senior General Manager of Sales and Management
Divisions of the Company
Jun. 2005
Senior Managing Director of the Company
May 2006
Representative Director and President of the Company
(present post)
Apr. 2015
President Executive Officer of the Company
Apr. 2019
Chief Executive Officer of the Company(present post)
Reappointment
1
Number of Board of
Directors’ meetings
attended during the
fiscal year under
review
9/9
Number of years since
appointment as a
director
25 years (at the
conclusion of this
meeting)
Reasons for nomination as a candidate for Director
Mr. Hiroshi Otsuka, who was appointed Representative Director and
President in May 2006, has supervised the entire group with a wealth of
experience and broad insight. Holding future vision for the group, he has
shown strong leadership through developing policy and long-term strategy
and furthermore implementing innovative strategies such as creation of a
new business utilizing AI technology. Given his long-term excellent
management performance, we determined him a right person to enhance
corporate value and nominated him as a candidate for Director.
Number of the
Company’s shares held
1,514,300
2
Dec. 1997
Entered Musashi Auto Parts Canada Inc.
Oct. 2013
Executive Officer (present post), Compliance Officer and
Senior Manager of Accounting, Purchasing, IT, HR,
Production Control of Musashi Auto Parts Canada Inc.
Nov. 2013
Director of Musashi Auto Parts Canada Inc. (present
post)
Tracey Sivill
(Dec. 2, 1963)
Apr. 2015
Executive Office of the Company
Apr. 2016
In charge of Global IT Strategy of the Company
Reappointment
Apr. 2017
Senior Executive Officer of the Company
Apr. 2017
Head of Finance and Accounting Division of the
Company
June. 2017
Director of the Company
Apr. 2018
Managing Executive Officer of the Company
Apr. 2018
CFO of Group of the Company(present post)
Apr. 2022
Senior Managing Executive Officer of the Company
Apr. 2022
Representative Director of the Company
Number of Board of
Directors’ meetings
attended during the
fiscal year under
review
9/9
CHO of Group of the Company(present post)
Number of years since Apr. 2024
appointment as a
Apr. 2025
Representative Director and Vice President of the
director
Company (present post)
9 years (at the
Reasons for nomination as a candidate for Director
conclusion of this
Ms. Tracey Sivill has extensive experience and insight in finance and
meeting)
accounting and IT divisions. She has been responsible for the finance and
accounting, and human resources divisions in the Group company, and has
a track record of promoting efficiency of the Group’s management and
operations. The Company has determined, in view of her superior
management ability cultivated through ample experience in overseas
subsidiary, that she is necessary to improve the future corporate value of
the Group, and nominated her once again as a candidate for its Director.
0
Kenji Morisaki
(Nov. 21, 1966)
Reappointment
3
Number of Board of
Directors’ meetings
attended during the
fiscal year under
review
9/9
Apr. 1985
Entered the Kyushu Musashi Seimitsu Co., Ltd.
Apr. 2001
Musashi Auto Parts Co.,Ltd.
Apr. 2009
Manager of Manufacturing Dept.Ⅱof Kyushu Musashi
Seimitsu Co., Ltd.
Apr. 2012
Vice President of Musashi Auto Parts India Pvt. Ltd.
Apr. 2016
Entered the Company Executive Officer and Head of
Production and Machinery & Tools
Apr. 2017
Risk Management Officer of the Company (present post)
Apr. 2018
Senior Executive Officer of the Company
Apr. 2018
CEO of Japan region of the Company
Jun. 2020
Managing Executive Officer of the Company
Apr. 2022
Senior Managing Executive Officer of the Company
Apr. 2022
CEO of Manufacturing of the Company
Jun. 2022
Director of the Company
Apr. 2024
Representative Director of the Company
Apr. 2024
COO of Group of the Company (present post)
Number of years
Representative Director and Vice President of the
since appointment as Apr. 2025
Company (present post)
a director
Dec. 2025
CEO of Japan region of the Company (present post)
4 years (at the
conclusion of this
Reasons for nomination as a candidate for Director
meeting)
Mr. Kenji Morisaki has extensive experience and insight particularly in the
Company’s manufacturing realm. He also has a track record of promoting
efficiency of the Group’s management and operations, in part by taking
responsibility for production divisions and the Japanese region. The
Company has determined, in view of his superior management ability
cultivated through his extensive experience in the realm of manufacturing,
that he is necessary to improve the future corporate value of the Group,
and nominated him once again as a candidate for its Director.
26,700
4
Apr. 1981
Entered Dai Nippon Printing Co., Ltd.
Dec. 1983
Entered Intel Japan K.K. (currently Intel K.K.)
Feb. 1999
Manager, Communication Product Business
Headquarters of Intel K.K.
Apr. 2001
Yoshie Munakata
(Jun. 20, 1958)
Executive secretary in charge of corporate
planning/government relation of Intel K.K.
Apr. 2002
Manager, Business Development Headquarters of Intel
K.K.
Reappointment
Apr. 2009
Director and executive deputy president of Intel K.K.
Apr. 2016
Advisor of Intel K.K.
Oct. 2016
Established B.Grove Inc., Representative Director of
B.Grove Inc., (present post)
Jun. 2017
Outside Director of SoftBank Technology Corp.(currently
SB Technology Corp.)
Jun. 2018
Outside Director of the Company (present post)
Nov. 2022
Chairman of the Board of Directors of the Company
(present post)
Number of Board of
Directors’ meetings
attended during the
fiscal year under
review
9/9
Number of years since
appointment as a
director
8 years (at the
conclusion of this
meeting)
(Significant concurrent positions)
Representative Director of B.Grove Inc.
Reasons for nomination as a candidate for Director
Mr. Yoshie Munakata has extensive experience cultivated in the
management at a global company in the data telecommunications
technology industry. Based on such experience and knowledge, he has led
the Board of Directors as the Chairperson of the Board of Directors of the
Company and has also provided appropriate advice on the Company’s
management as an Outside Director.
19,500
Goro Kamino
(Aug. 29, 1960)
Reappointment
5
Number of Board of
Directors’ meetings
attended during the
fiscal year under
review
9/9
Aug. 2000
Representative Director and President of Gastec Service,
Inc. (currently Sala Energy Co., Ltd.)
May.2002
Representative Director and President of Sala
Corporation
Mar. 2012
Representative Director and President of Chubu Gas Co.,
Ltd. (currently Sala Energy Co., Ltd.)
Jun. 2012
Outside Director of the Company (present post)
Feb. 2018
Chairman and Representative Director of Gastec Service,
Inc. (currently Sala Energy Co., Ltd.)
Feb. 2018
Chairman and Representative Director of Chubu Gas Co.,
Ltd. (currently Sala Energy Co., Ltd.) (present post)
Feb. 2020
Representative Director, President and Group CEO of
Sala Corporation (present post)
(Significant concurrent positions)
Representative Director and President of Sala Corporation
Number of years since Chairman and Representative Director of Sala Energy Co., Ltd.
appointment as a
Reasons for nomination as a candidate for Director
director
Mr. Goro Kamino has extensive experience and a high level of knowledge
14 years (at the
gained from leading business restructuring and governance reforms as a
conclusion of this
corporate manager of listed companies, as well as a deep understanding of
meeting)
local economies and communities. He has provided appropriate advice on
the Company’s management as its Outside Director based on our business
foundation. The Company believes that he will continue to supervise the
Company’s management based on his experience and knowledge, and
requests his election as Outside Director.
45,500
Hari N. Nair
(Jan. 1, 1960)
Aug. 1985
Entered General Motors Corporation
Mar. 1987
Entered Tenneco Automotive. (currently Tenneco Inc.)
Aug. 1997
Same as above Vice President and Managing Director,
Asia
Aug. 1999
Same as above Vice President, Managing Director, South
America and Asia
Apr. 2000
Same as above Senior Vice President, Managing Director,
International
May. 2001
Same as above
Executive Vice President, Managing
Director, Europe
Jun. 2005
Same as above
Executive Vice President, Managing
Director, Europe, South America and India
Apr. 2009
Same as above
Appointed to Board of Directors
May. 2010
Same as above
Chief Operating Officer
Jul. 2013
Outside Director of Owens-Illinois Inc. (currently O-I
GLASS Inc.) (present post)
Jun. 2017
Outside Director of the Company (present post)
Dec. 2017
Outside Director of Delphi Technologies PLC
Feb. 2018
Chairman of the Board of Sintercom India. (present post)
Jul. 2019
Outside Director of REE Automotive LTD
Nov. 2022
Outside Director of Tenneco Inc. (present post)
Reappointment
6
Number of Board of
Directors’ meetings
attended during the
fiscal year under
review
9/9
Number of years since
appointment as a
director
9 years (at the
conclusion of this
meeting)
(Significant concurrent positions)
Outside Directors of O-I GLASS Inc., Chairman of the Board of Sintercom
India., Outside Director of Tenneco Inc.
Reasons for nomination as a candidate for Director
Mr. Hari Nair has provided appropriate advice on the Company’s
management as its Outside Director based on his extensive experience and
a high level of knowledge based on 35 years of combined corporate Board
experience with several public companies across multiple regions and his
previous senior management roles in Overseas Automotive parts
Companies, including as COO and interim CEO. The Company believes
that he will continue to supervise the Company’s management based on
his experience and knowledge, and requests his election as Outside
Director.
0
7
Apr. 1997
Entered SBC Warburg Japan Ltd. (currently UBS
Securities Japan Co., Ltd.)
Dec. 2001
Entered UBS Securities Japan Co., Ltd.
Mar. 2006
Keisuke Tomimatsu
(May 2, 1974)
General Manager/Executive Director, Financial Products
Equities Dept. of UBS Securities Japan Co., Ltd.
Aug. 2008
Managing Director, Equities Dept. of Credit Suisse
Securities (Japan) limited.
Reappointment
Nov. 2009
Executive Director, Equities Dept. of Morgan Stanley
Japan Securities (currently Morgan Stanley MUFG
Securities Co., Ltd.)
Jun. 2013
Audit & Supervisory Board Member of the Company
Jun. 2014
Outside Director of IR Japan Inc.
Feb. 2015
Outside Director of IR Japan Holdings, Ltd.
Jun. 2015
Outside Director serving as an Audit and Supervisory
Committee Member of the Company
Jun. 2017
Outside Director of the Company (present post)
Number of Board of
Directors’ meetings
attended during the
fiscal year under
review
9/9
Number of years since
appointment as a
director
11 years (at the
conclusion of this
meeting)
Reasons for nomination as a candidate for Director
Mr. Keisuke Tomimatsu has extensive experience at various companies in the
global securities and AI industries, considerable financial and accounting
knowledge, and a deep understanding of the Company’s business and
management challenges cultivated through his previous professional
experience. Incorporating perspectives from the capital markets and investors,
he has provided appropriate advice on the Company’s management as its
Outside Director. The Company believes that he will continue to supervise the
Company’s management based on his experience and knowledge, and
therefore requests his election as Outside Director.
115,100
8
Apr. 1998
Entered Morgan Bank. (currently JP Morgan Bank)
Feb. 2000
Entered Goldman Sachs Asset Management Co., Ltd.
Apr. 2011
Same as above COO of Asia Pacific management Division
(traditional assets)
Sep. 2016
Same as above chief of the stewardship promotion
Emi Onozuka
(May 28, 1974)
Apr. 2017
Same as above manager of the stewardship promotion
Apr. 2020
Entered Japan Catalyst, Inc.
Reappointment
May. 2020
Same as above Executive Vice President COO
May. 2022
Director, President and CEO of Eminent Group Inc.
(present post)
May. 2022
Representative Director of Future Creation Initiative
through Science and Finance(present post)
Jun. 2022
Director of the Company (present post)
Jun. 2023
Outside Director of Daiwa Asset Management Co.Ltd.
(present post)
Jun. 2024
Outside Director of PRONEXUS INC. (present post)
Number of Board of
Directors’ meetings
attended during the
fiscal year under
review
9/9
Number of years since
appointment as a
director
4 years (at the
conclusion of this
meeting)
10,600
(Significant concurrent positions)
Director, President and CEO of Eminent Group Inc., Representative
Director of general Incorporated Association Initiative for Creating the
Future through Science and Finance, Outside Director of Daiwa Asset
Management Co.Ltd., Outside Director of PRONEXUS INC.
Reasons for nomination as a candidate for Director
Ms. Emi Onozuka has extensive experience over more than 20 years in a
variety of positions at investment management firms and in the
management of investment advisory firms as well as global knowledge and
experience, including expertise in ESG. Based on such experience and
knowledge. The Company believes that she will supervise the Company’s
management based on her experience and knowledge, and requests her
election once again as Outside Director.
Notes:
2
3.
There are no special interests between the Company and the candidates.
.
Mr. Yoshie Munakata, Mr. Goro Kamino, Mr. Hari N. Nair, Mr. Keisuke Tomimatsu, and Ms. Emi Onozuka are candidates for Outside Director.
The Company, with respect to liability under Article 423, paragraph 1 of the Companies Act, entered into an
agreement with Mr. Yoshie Munakata, Mr. Goro Kamino, Mr. Hari N. Nair, Mr. Keisuke Tomimatsu, and Ms. Emi Onozuka limiting the total
amount of the liability to the amount stipulated in Article 425, paragraph 1 of the same Act. Should their election be
approved, the Company plans to continue the aforementioned agreements limiting liability.
The Company has entered into a liability insurance contract with an insurance company for directors and officers,
etc., as stipulated in Article 430-3, Paragraph 1 of the Companies Act, covering the insured persons including directors
of the Company. The insurance policy will cover damages arising from the assumption of responsibility by the
directors and officers, etc. for the performance of their duties or from the receipt of claims related to the pursuit of
such responsibility. If each candidate is elected and assumes office as a director, he or she will be insured under the
relevant insurance policy. The said insurance policy is scheduled to be renewed with the same contents at the next
renewal.
The Company registered Mr. Yoshie Munakata, Mr. Goro Kamino, Mr. Hari N. Nair, Mr. Keisuke Tomimatsu, and Ms.
Emi Onozuka as independent officers with the Tokyo Stock Exchange and the Nagoya Stock Exchange, pursuant to the
guidelines thereof. Should their election be approved, the Company would continue his service as Independent
Officer. Although the Company has transactions etc. with Sala Corporation and Sala Energy Co., Ltd. in which Mr. Goro
Kamino serves concurrently. However, the average annual transaction amount of the last three fiscal years relating
thereto accounts for less than 2% of the average sales of both the Company and them over that period, and the
annual transaction amount relating thereto accounts for less than 1% of sales of both the Company and them, we
believe that there would be no conflicts of interest with general shareholders.
Proposal 3:
Election of One(1) Director Serving as Audit and Supervisory Committee Members
The terms of office of One (1) of the three (3) Directors serving as Audit and Supervisory Committee
Members shall expire upon the conclusion of this Annual Meeting of Shareholders (Mr. Kazutaka Okubo).
Therefore, considering the composition of the Board of Directors as a whole, we request the election of One
(1) Directors serving as Audit and Supervisory Committee Members. This proposal has been submitted with
prior consent by the Audit and Supervisory Committee.
The candidates for Director serving as Audit and Supervisory Committee Members are as follows:
No.
Name
(Date of birth)
Kazutaka Okubo
(March 22, 1973)
Reappointment
1
Career summary, positions and areas of responsibility in the Company,
and significant concurrent positions
Nov. 1995
Entered Century Audit Corporation (currently Ernst &
Young ShinNihon LLC)
Apr. 1999
Registered as certified public accountant
Oct. 2003
Director of ShinNihon Integrity Assurance Inc. (currently
Ernst & Young Sustainability Co., Ltd.)
Feb. 2005
Managing Director of ShinNihon Integrity Assurance Inc.
(currently Ernst & Young Sustainability Co., Ltd.)
Jun. 2006
Partner of Ernst & Young ShinNihon LLC
Jul. 2012
Senior Partner of Ernst & Young ShinNihon LLC
Number of years since Feb. 2016
appointment as a
director
Jun. 2019
6 years (at the
conclusion of this
Jun. 2019
meeting)
Senior Managing Director and General Manager of ERM
Division of Ernst & Young ShinNihon LLC
Jun. 2019
Outside Director of Sun Frontier Fudousan Co., Ltd. (present post)
Sep. 2019
Outside Audit & Supervisory Board Member of BrainPad
Inc.
Dec. 2019
Outside Director of LIFULL Co., Ltd. (present post)
Feb. 2020
Outside Director of Sala Corporation(present post)
Jun. 2020
Outside Director of The Shoko Chukin Bank Ltd. (present post)
Jun. 2020
Outside Director Serving as Audit and Supervisory
Committee Members of the Company (present post)
Sep. 2021
Outside Director Serving as Audit and Supervisory
Committee Members of BrainPad Inc.
Jun. 2022
Outside Director Serving as Audit and Supervisory
Committee Members of SEGA SAMMY HOLDINGS INC.
(present post)
Number of Board of
Directors’ meetings
attended during the
fiscal year under
review
9/9
Number of Audit and
Supervisory
Committee attended
during the fiscal year
under review
12/12
Number of the
Company’s
shares held
President and Representative Director of Okubo
Associates Inc. (present post)
Outside Audit & Supervisory Board Member of SEGA
SAMMY HOLDINGS INC.
(Significant concurrent positions)
President and Representative Director of Okubo Associates Inc., Outside
Director of SEGA SAMMY HOLDINGS INC., Outside Director of Sun Frontier
Fudousan Co., Ltd., Outside Director of LIFULL Co., Ltd., Outside Director of
Sala Corporation, Outside Director of The Shoko Chukin Bank Ltd.,
3,700
Reasons for nomination as a candidate for Director
Mr. Kazutaka Okubo has extensive financial and accounting knowledge
gained from his audit experience as a certified public accountant. He is also
familiar with governance and finance and has an abundance of insight and
experience in the fields of compliance and CSR, having served particularly
as a member on various expert panels in the public sector. The Company
believes that he is capable of performing the functions of supervision and
audit drawing on such extensive experience and his high level of specialized
knowledge, and requests his election as Outside Director.
Notes:
1.
2.
3.
4.
There are no special interests between the Company and the candidate.
Mr. Kazutaka Okubo is a candidate for Outside Directors serving as Audit and Supervisory Committee Members.
Mr. Kazutaka Okubo is currently an Outside Director serving as an Audit and Supervisory Committee Member of the
Company and his term of office will be 6 years at the conclusion of this Annual Meeting of Shareholders.
The Company, with respect to liability under Article 423, paragraph 1 of the Companies Act, entered into an agreement
with Mr. Kazutaka Okubo limiting the total amount of the liability to the amount stipulated in Article 425, paragraph 1 of
the same Act. Should his election be approved, the Company plans to continue the aforementioned agreements limiting
liability.
The Company has entered into a liability insurance contract with an insurance company for directors and officers, etc., as
stipulated in Article 430-3, Paragraph 1 of the Companies Act, covering the insured persons including directors of the
Company. The insurance policy will cover damages arising from the assumption of responsibility by the directors and
officers, etc. for the performance of their duties or from the receipt of claims related to the pursuit of such responsibility.
If each candidate is elected and assumes office as a director, he or she will be insured under the relevant insurance policy.
The said insurance policy is scheduled to be renewed with the same contents at the next renewal.
The Company registered Mr. Kazutaka Okubo as independent officers with the Tokyo Stock Exchange and the Nagoya Stock
Exchange, pursuant to the guidelines thereof. Should his election be approved, the Company would continue his service as
Independent Officer.
(Reference1) Composition of the Board of Directors [Scheduled to be effective on June 26, 2026]
The abilities of the Directors of the Company are listed below.
Directors
Areas in
charge
Corporate
manageme
nt
Manufactur
ing and
engineering
R&D
Hiroshi
Otsuka
●
Tracey
Sivill
●
Kenji
Morisaki
●
●
●
Yoshie
Munakata
Outside
Director.
●
Goro
Kamino
Outside
Director.
●
Hari N.
Nair
Outside
Director.
●
Keisuke
Tomimatsu
Outside
Director.
Emi
Onoduka
Outside
Director.
Makiko
Yamamoto
Outside
Director
Kazutaka
Okubo
Outside
Director
Takashi
Watanabe
Outside
Director
Sales and
marketing
IT and
DX
Legal and
risk
managem
ent
●
●
●
ESG
and
sustainability
Global
experience
●
●
●
●
●
●
●
●
●
●
●
●
●
●
●
●
●
●
●
●
●
●
●
●
Audit and
Supervisory
Committee
Member
Audit and
Supervisory
Committee
Member
Audit and
Supervisory
Committee
Member
Financial
affairs and
financing
●
●
●
●
●
●
●
●
●
Definition of skills
Skills
Corporate management
Manufacturing and
engineering
R&D
Sales and marketing
IT and DX
Financial affairs and
financing
Legal and risk management
ESG
and sustainability
Global experience
Reason for selection of the skill
In order to enhance sustainable corporate value, it is essential to have "steering management" that drives the transformation
from existing businesses to new areas. In line with this, advanced decision-making and supervisory capabilities are required to
optimize the business portfolio and enhance the effectiveness of governance.
The Company has been strong in advanced manufacturing technologies such as precision forging, but responding to
electrification and CASE in the automotive industry has become an urgent need. For sustainable growth, skills and experience
in manufacturing, technology, and research and development that enable us to lead the creation of innovative technologies
are essential.
In order to capture the changes in market structure and the transformation into new areas brought about by the electrification
of the automotive industry, as well as to acquire new customers and propose added value to existing customers, experience
and expertise in sales and marketing are necessary.
For business transformation and enhancing competitiveness through the use of digital and generative AI technologies, such as
realizing smart factories and promoting data-driven management, IT and DX skills are essential.
To promote an optimal capital policy that balances strategic investment in growth areas with shareholder returns, and to
improve capital efficiency, solid knowledge and experience in finance and accounting are necessary.
This skill is necessary in order to effectively address management risks, such as geopolitical risks, while also complying with the
laws and regulations of various countries and establishing compliance systems for global business operations.
This skill is necessary in order to oversee effective initiatives that place ESG issues demanded by investors and society, such as
addressing carbon neutrality, promoting human capital management, and respecting human rights throughout the supply
chain, at the core of management.
In order to strengthen governance at overseas bases and promote business strategies tailored to each region’s market
characteristics, the members of the Board of Directors with extensive international experience are essential.
(Reference 2) Independence criteria for Outside Officers
If the Outside Officers of the Company are judged to have fulfilled the requirements set out below, the
Board of Directors deems them to be sufficiently independent of the Company.
- They are not currently an executive, etc.<Note 1> of the Group, nor have they in the past been an
executive, etc. or an Audit & Supervisory Board Member of the Group (excluding Outside Audit &
Supervisory Board Members).
Also, none of their close relations, etc. <Note 2> shall have been executives, etc. of the Group within the
past three years.
- They shall not come under any of the following categories currently, or within the past three years.
- Executives, etc. of other companies affiliated to the Company, or of other affiliated company groups
- Executives, etc. of major shareholders of the Company <Note 3>
- Executives, etc. of companies in which the Company is a major shareholder
- Executives, etc. of major business partners of the Company <Note 4>, or executives, etc. of companies
that consider the Company a major business partner
- Individuals who execute duties for organizations that have received substantial <Note 5> donations or
aid from the Group
- Executives, etc. of companies that have conducted mutual exchanges with the Group of Directors, Audit
& Supervisory Board Members, or Executive Officers
- Executives, etc. of the Group’s major lenders
- Certified Public Accountants (or Tax Accountants) who are Financial Auditors to the Group, or audit
corporations (or tax accountant corporations) that are Financial Auditors to the Group, or partners, or
others who are directly in charge of the Company in terms of being Financial Auditors to the Group
- Individuals who have received substantial monies or other financial profits, excluding Directors’
remuneration, from the Group
- Individuals who are partners, etc. of specialist advisory firms, such as legal firms, that consider the
Group a major business partner, but do not belong to categories 8) or 9) above, who are directly in charge
of the Company.
- None of their close relations currently fall under categories 2-1 to 2-10.
<Notes>
- Executives, etc.: Directors (excluding Outside Directors), Executives, Executive Officers
- Close relations: Spouse, or other relative within the second degree of kinship, or family member who is
living in the same household with the person
- Major shareholder: A company, etc. holding shares with 10% or more of total voting rights
- Major business partner: A company to which 2% or more of annual consolidated net sales of the Company
were paid on average in the past three fiscal years
- Substantial: Cases in which the amounts involved have exceeded 10 million yen annually on average over
the previous three fiscal years
Proposal 4:
Election of One (1) Substitute Director Serving as Audit and Supervisory
Committee Member
In preparation for a shortage in the number of Directors serving as Audit and Supervisory Committee
Members as stipulated by laws and regulations, we request the election of one (1) Director as a substitute for
all Directors serving as Audit and Supervisory Committee Members, in advance.
This proposal has been submitted with prior consent by the Audit and Supervisory Committee.
The candidate for substitute Director serving as Audit and Supervisory Committee Member is as follows:
No.
Name
(Date of birth)
Career summary, positions and areas of responsibility in the Company,
and significant concurrent positions
Feb. 2014
Entered Ernst & Young ShinNihon LLC (currently Ernst &
Young ShinNihon LLC)
Feb. 2018
Entered PwC Advisory LLC
May. 2018
Registered as a Certified Public Accountant
Mar. 2019
Entered H.I.S International Tours (NY) Inc.
Number of the
Company’s
shares held
General Manager of Accounting and Finance Dept. of
H.I.S International Tours (NY) Inc.
1
Atsushi Okamoto
(May 2, 1986)
Mar. 2022
Representative Director of Okamoto & Partners (present
post)
May. 2022
Representative of Okamoto Certified Public Accountant
and Tax Accountant Office (present post)
(Significant concurrent positions)
Representative Director of Okamoto & Partners, Representative of
Okamoto Certified Public Accountant and Tax Accountant Office
0
Reasons for nomination as a candidate for Director
Mr. Atsushi Okamoto has experience and knowledge in finance and
accounting from his experience as a certified public accountant, certified
tax accountant, and as general manager of the accounting and finance
department of a company. The Company believes that he is capable of
performing the functions of supervision and audit based on such
experience and his high level of specialized expertise, and requests his
election as substitute Outside Director serving as an Audit and Supervisory
Committee Member.
Note:
- Mr. Atsushi Okamoto is a candidate for substitute Director serving as an Audit and Supervisory Committee
Member.
- Should the election of Mr. Atsushi Okamoto be approved and he assume the position of Director serving as an
Audit and Supervisory Committee Member, the Company, with respect to liability under Article 423, paragraph
1 of the Companies Act, plans to enter into an agreement with him limiting the total amount of the liability to
the amount stipulated in Article 425, paragraph 1 of the same Act.
- Should the election of Mr. Atsushi Okamoto be approved and he assume the position of Director serving as an
Audit and Supervisory Committee Member, the Company plans to register him as an independent officer with
the Tokyo Stock Exchange and the Nagoya Stock Exchange, pursuant to the guidelines thereof
Proposal 5:
Determination of Remuneration for Granting Restricted Shares to Directors Serving as Audit
and Supervisory Committee Members
The maximum amount of remuneration for Directors serving as Audit and Supervisory Committee Members
(hereinafter referred to as the “Eligible Directors”) was approved as 80 million yen per year at the Company’s
88th Annual Meeting of Shareholders held on June 23, 2015.
The Company hereby requests approval for the payment of remuneration for granting restricted shares to
the Eligible Directors separately from the above remuneration framework, for the purpose of providing the
Eligible Directors with an incentive to enhance the corporate value of the Group[A1.1] and further promoting
value sharing with shareholders. In cases such as where an Eligible Director is a non-resident of Japan, the
Company shall pay such Eligible Director monetary remuneration of an amount linked to the Company’s
share price or other such benchmark in lieu of remuneration provided for the sake of granting restricted
shares, taking into consideration the above purpose.
For an overview of such remuneration, please refer to “(Overview of Remuneration for Granting Restricted
Shares)” below.
The total amount of monetary remuneration to be paid to the Eligible Directors for the granting of restricted
shares and the above monetary remuneration linked to the Company’s share price or other such benchmark
under this proposal shall be no more than 20 million yen per year, which the Company considers reasonable
in light of the above purpose. The specific timing and allocation of such remuneration to the Eligible
Directors shall be determined through consultation among the Eligible Directors following deliberation by
the Nomination and Remuneration Committee.
The number of Eligible Directors is currently three.
Note
(Overview of Remuneration for Granting Restricted Shares)
・In the case of granting restricted shares
As a general rule, every fiscal year, based on consultation among the Eligible Directors, the Company shall
grant monetary remuneration claims to the Eligible Directors for the allotment of restricted shares, and
require that they provide the same monetary remuneration claims to the Company as property contributed
in kind. In turn, the Company shall issue or dispose of its common shares, which will be held by them. The
total number of the common shares of the Company to be accordingly issued or disposed of shall be no
more than 20,000 shares per year (however, in cases where the total number of issued shares of the
Company increases or decreases due to a share consolidation, a share split, and a gratis allotment of shares,
etc., this upper limit and the number of shares to be delivered to the Eligible Directors shall be reasonably
adjusted according to the ratio thereof).
The amount to be paid in per share shall be determined by the Board of Directors within a range not
specially advantageous to the Eligible Directors subscribing the Company’s common shares, based on factors
such as the closing price of the Company’s common shares on the Tokyo Stock Exchange on the business day
immediately preceding the day on which each resolution of the Board of Directors is made (if there is no
closing price on such date, the closing price of the closest preceding trading day). In addition, upon the
issuance or disposal of the common shares of the Company pursuant thereto, the Company and the Eligible
Directors shall enter into an agreement on allotment of restricted shares (hereinafter referred to as the
“Allotment Agreement”), the outline of which shall include the following provisions.
(1) The Eligible Directors shall not transfer, create a security interest on, reserve an offer as security, or
otherwise dispose of (hereinafter referred to as the “Transfer Restriction”) the common shares of the
Company allotted under the Allotment Agreement (hereinafter referred to as the “Allotted Shares”) for a
period of three years from the date on which the common shares of the Company are delivered pursuant to
this system (hereinafter referred to as the “Transfer Restriction Period”).
(2) In the event that an Eligible Director resigns or retires from the position of Director or Executive Officer of
the Company or Director of a subsidiary prior to the expiration of the Transfer Restriction Period, the
Company shall automatically acquire the Allotted Shares without contribution, unless the Board of Directors
of the Company recognizes that there is a justifiable reason therefor.
(3) Notwithstanding the provisions of (1) above, the Company shall lift the Transfer Restriction on all of the
Allotted Shares at the time of expiration of the Transfer Restriction Period, on the condition that the Eligible
Director has continuously held the position of Director or Executive Officer of the Company or Director of a
subsidiary of the Company throughout the Transfer Restriction Period. Provided, however, that in the event
that such Director resigns or retires from any of the positions set forth in (2) above prior to the expiration of
the Transfer Restriction Period for a justifiable reason recognized by the Board of Directors of the Company
as set forth in (2) above, the number of Allotted Shares with respect to which the Transfer Restriction is lifted
and the timing of lifting the Transfer Restriction shall be reasonably adjusted as necessary.
(4) The Company shall automatically acquire without contribution any of the Allotted Shares for which the
Transfer Restriction has not been lifted pursuant to the provisions of (3) above at the time of expiration of
the Transfer Restriction Period.
(5) Notwithstanding the provisions of (1) above, if matters concerning a merger agreement in which the
Company becomes the dissolving company, a share exchange agreement or share transfer plan in which the
Company becomes a wholly-owned subsidiary, or other organizational restructuring, etc., are approved at a
Meeting of Shareholders of the Company (provided, however, that in cases where approval by the
Company’s Meeting of Shareholders is not required for such organizational restructuring, etc., such approval
shall be given by the Company’s Board of Directors), the Company shall, by resolution of its Board of
Directors, lift the Transfer Restriction prior to the effective date of such organizational restructuring, etc.,
with respect to a number of Allotted Shares reasonably determined based on the period from the
commencement date of the Transfer Restriction Period to the date of approval of such organizational
restructuring, etc.
(6) In the cases specified in paragraph (5) above, the Company, as a matter of course, shall automatically
acquire without contribution any Allotted Shares for which the Transfer Restriction has not yet been lifted as
of the time immediately following the lifting of the Transfer Restriction pursuant to the provisions of
paragraph (5) above.
・In the case of paying monetary remuneration linked to the Company’s share price or other such
benchmark
Based on the terms of the restricted share allotment agreement described above (in the case of granting
restricted shares), the Company and the Eligible Directors shall enter into an agreement, the outline of which
shall include the following provisions.
(1) The Company shall pay monetary remuneration in an amount linked to the Company’s share price or
other such benchmark to the Eligible Directors after the expiration of a three-year period from the date on
which the Company’s common shares are delivered as described above (in the case of granting restricted
shares), on the condition that the Eligible Directors have continuously held the position of Director or
Executive Officer of the Company or Director of a subsidiary of the Company throughout such period.
Provided, however, that if an Eligible Director resigns or retires from any of the positions set forth above
prior to the expiration of such period for a justifiable reason recognized by the Board of Directors of the
Company, the amount and timing of payment shall be reasonably adjusted as necessary.
(2) In the event that an Eligible Director resigns or retires from any of the positions set forth in (1) above
prior to the expiration of such period, no monetary remuneration shall be paid unless the Board of Directors
of the Company recognizes that there is a justifiable reason therefor.
(Attached materials)
Business Report
(April 1, 2025 to March 31, 2026)
- Overview of the Group
(1) Business results for the fiscal year ended March 31, 2025
- Progress and results of business
[The economic environment for the fiscal year ended March 31, 2026]
In the fiscal year under review (April 1, 2025 to March 31, 2026), the global economy continued to recover
moderately, although some regions showed signs of weakness. At the same time, the impact of U.S. tariff policies
became increasingly evident, particularly in the automotive industry. By region, the U.S. economy expanded
moderately, supported by a resilient labor market and steady personal consumption. In Europe, the prolonged
slump in the manufacturing sector, centered on Germany, caused the economic recovery to level off. In China,
while government stimulus measures provided some level of support, prolonged adjustments in the real estate
market resulted in a moderate slowdown. In Asia, India maintained an expansionary trend backed by solid
domestic demand, continuing to drive the regional economy. Against the backdrop of these international
developments and fluctuations in financial markets, the global economy has transitioned into a multipolarized
phase characterized by divergent trends across regions, ushering in a new era marked by heightened uncertainty.
[Automotive industry trends]
In the automotive industry, the reassessment of global EV strategies continued. In major markets including China
and Europe, growth in demand for battery electric vehicles (BEVs) fell short of initial expectations. In Europe,
growth slowed amid a review of subsidy policies, while in North America, there was a shift back from BEVs to
hybrid electric vehicles (HEVs), highlighting a clear trend toward multipolarization across regions. On the other
hand, demand for HEVs remained solid worldwide. Against this market backdrop, automakers are advancing
powertrain portfolio strategies encompassing a diverse range of options, including BEVs, HEVs, and plug-in hybrid
electric vehicles (PHEVs). Moreover, advances in software-defined vehicles (SDVs) have further highlighted the
trend toward the value of the automobile itself being redefined from hardware-centric to software-centric. It was
also a year in which the need to adapt quickly to change became acutely apparent, including in response to
geopolitical risks and temporary production adjustments in the supply chain.
[Group initiatives and results]
To adapt to this rapidly changing business environment, the Group has been working vigorously to strengthen its
management foundation and transform its business portfolio.
■ Strengthening of the management foundation
In October 2025, the Group opened its Tokyo office to serve as a core hub for strategic planning and global
expansion, thereby putting in place a framework to further develop its existing businesses and accelerate growth
in new business areas.
■ Mobility business
<Establishment of an optimal portfolio for the four-wheeled vehicle business>
In the four-wheeled vehicle business, orders remained solid for Differentials, key products for which the Group
holds a top global market share, as well as components used in BEVs and HEVs. As customers restructure their
production and supply systems, demand for shifting to local production has been increasing, leading to a growing
number of inquiries directed at the Company.
<Growth and a shift to electrification in the two-wheeled vehicle business>
In the two-wheeled vehicle business, sales were strong for transmission assemblies, for which the Group holds a
top global market share, as well as components for internal combustion engine (ICE) vehicles, with the Indian
market showing particularly significant growth. In India, the range of vehicle models equipped with the Group's eAxle (EV drive unit) expanded. In addition, initiatives to promote the adoption of two-wheeler EVs in Kenya and
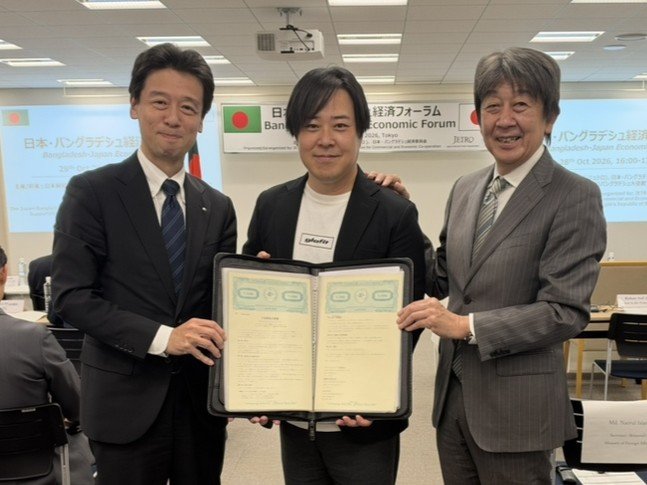
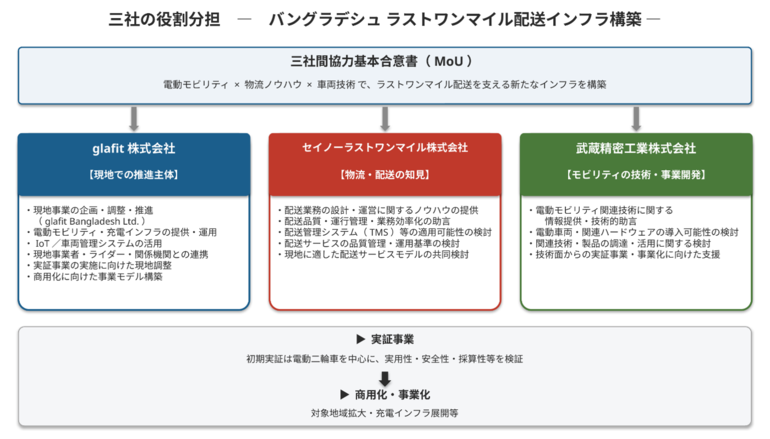
Ethiopia were selected for the Ministry of Economy, Trade and Industry’s “Global South Future-Oriented CoCreation Project,” and collaboration began with a startup in Bangladesh, accelerating business expansion in
emerging markets.
■ Energy Solution business
In response to the rapidly expanding demand for AI data centers driven by the explosive growth of
generative AI, the Group is strengthening its supply capabilities for hybrid supercapacitors (HSCs), which
feature high input/output capacity and a long service life. In addition to expanding capacity at the Hokuto
Plant in Yamanashi Prefecture, the Group is constructing a new plant in Minami-Alps City and is steadily
making preparations for the commencement of operations. To accelerate business development in North
America, the Group opened the Austin R&D Center in Texas, USA, in December 2025.
In the above environment, the Company’s consolidated net sales increased 0.0% year on year to
347,200 million yen during the fiscal year under review. In terms of profit, consolidated operating profit
increased 4.1% year on year to 20,538 million yen and consolidated ordinary profit increased 12.5% year
on year to 20,230 million yen, while profit attributable to owners of parent decreased 83.8% year on
year to 1,264 million yen due to the recording of structural reform expenses and other factors.
2) Segment Overview
In Japan, net sales increased 4.1% year on year to 41,541 million yen and segment profit decreased
19.8% to 3,517 million yen. This was mainly due to increased upfront investment costs for the Energy
Solution business, despite solid sales. In the Americas, net sales increased 6.2% year on year to
111,006 million yen and segment profit decreased 6.6% to 5,911 million yen. This was mainly due to
temporary production adjustments caused by semiconductor shortages at customers, despite
continued strong business performance since the previous year. In Asia, net sales decreased 1.5% year
on year to 80,657 million yen and segment profit increased 4.7% to 9,592 million yen. This wasmainly
because, while sales for two-wheeled vehicles remained solid, sales for four-wheeled vehicles failed
to gain momentum. In China, net sales decreased 7.8% year on year to 29,074 million yen and
segment profit increased 103.2% to 1,103 million yen. This was mainly due to rigorous cost
management, despite continued lackluster sales of Japanese-brand vehicles. In Europe, net sales
decreased 4.9% year on year to 84,920 million yen and segment profit amounted to 290 million yen
(versus a segment loss of 740 million yen in the previous fiscal year). This was mainly due to
continued improvement measures, including cost management, despite the weak overall automotive
market.
3) Group sales by product
(Unit: million yen)
Item
The 98th fiscal
year ended
March 31, 2025
Composition
Amount
ratio
(%)
The 99th fiscal
year ended
March 31, 2026
Composition
Amount
ratio
(%)
Increase/ Decrease
Year on Year
(%)
Amount
PT Business
221,082
63.7
217,083
62.5
△3,999
△1.8
L&S Business
32,154
9.3
31,676
9.1
△468
△1.5
Motorcycle
Business
93,959
27.0
98,440
28.4
4,481
4.8
Total
347,196
100.0
347,200
100.0
4
0.0
Note:
Figures are presented with amounts less than one million yen truncated.
- Status of capital investment
During the fiscal year under review, the Group implemented capital investments totaling 27,700
million yen, for such purposes as manufacturing newly ordered products and responding to
increases in output by customers.
- Status of fund procurement
In the fiscal year under review, procurements of funds from financial institutions were conducted
for routine purposes only, and there were no fund procurements made by means of capital
increases or issuance of corporate bonds.
- Initiatives toward achieving sustainability
Providing continuous value to society and fulfilling our corporate social responsibility toward the
realization of a sustainable society is considered a significant matter for the Musashi Group’s
medium- to long-term growth.
The Group has defined its Our Purpose commitment of “we contribute to enriched Harmony
between our lives and Earth, using our Passion for technology and Wisdom for innovation.”
We will accordingly contribute to sustainable growth and the realization of a sustainable society by
engaging in business activities underpinned by the Musashi Philosophy.
We have also launched an ESG Policy/Data page on our corporate website. We will continue to
strive to disclose ESG information in the future so that you can see the latest status and results of
our efforts.
(2) Issues to be addressed
(1) Management philosophy and policy
The Group operates its business based on the Musashi Philosophy, which consists of Our Origin, Our
Purpose, and Our Way. We will inherit the DNA of taking on challenges that we have cultivated over
our long history and realize our long-term vision of “Go Far Beyond!
Break barriers and go on
adventures!”
(2) Priority issues to be addressed
The business environment surrounding the Company has entered a new phase where uncertainty has
become the norm. The global economy has transitioned into a multipolarized phase characterized by
divergent trends across regions, requiring companies to respond flexibly to change and demonstrate
the vision and execution capabilities to forge their own path forward. In terms of hardware, major
finished vehicle manufacturers are beginning to reevaluate their EV strategies. In terms of software,
the advancement of software-defined vehicles (SDVs) is beginning to redefine the very value of
automobiles. At the same time, the dramatic evolution of generative AI is compelling companies to
pursue new business opportunities and transform the very nature of work. To adapt flexibly to these
changes in the business environment, the Company will address the following priority issues from the
perspective of “selection and concentration.”
1.Mobility business: Establishment of a resilient and flexible business structure
To respond promptly to a rapidly changing market environment, we will maximize the use of our
unique technological capabilities and global production infrastructure to implement a diverse product
portfolio strategy.
[Establishment of an optimized portfolio for the four-wheeled vehicle business]
Powertrain (PT) business
We will establish a stable revenue base across all powertrain domains (ICE, HEV, and BEV) with refined
development capabilities and technological expertise.
Linkage & suspension (L&S) business
We will drive next-generation growth by increasing orders received for high-performance ball joints
and other components capable of supporting the heavy vehicle weight of BEVs.
[Growth and a shift to electrification in the two-wheeled vehicle business]
In the two-wheeled vehicle markets of Southeast Asia and India, we will achieve further business
growth by leveraging the production infrastructure and design and machining technologies we have
cultivated over many years.
We will accelerate the production and sales expansion of EV drive units (e-Axles) in India and Africa to
firmly capture the trend toward electrification.
[Execution of optimal strategies tailored to regional characteristics]
We will promote local production for local consumption initiatives tailored to regional needs, such as
expanding HEV production capacity in North America, strengthening sales efforts with domestic
manufacturers in China, and accelerating the growth of the e-Mobility business in India.
In the European market, in light of the challenging market environment, we are implementing
structural reforms centered on optimizing production capacity and reorganizing our bases. We aim to
transform our business structure into one capable of generating stable profits.
2. Energy Solutions business: Creation of a new growth pillar to support AI data centers
With the explosive growth of generative AI, global electricity demand and the need for stability are
rapidly expanding. We have identified this field as our next growth pillar.
[Rising demand for hybrid supercapacitors (HSC)]
• Our HSCs are highly regarded for their high input/output capacity and long service life, which are
well-suited to the complex and massive electrical loads unique to AI data centers. Tighter regulations
aimed at stabilizing electricity supply are also acting as a tailwind.
[Expansion of supply system]
To meet the full-scale increase in demand expected from 2027 onward, we will expand capabilities at
the Hokuto Plant and construct a new plant in Minami-Alps City to strengthen our supply system at an
early stage.
3. Strengthening organizational capabilities: Marketing enhancement and business transformation
based on AI
To succeed in these uncertain times, we will fundamentally strengthen our organizational capabilities
by focusing on both “people” and “processes.”
[Shift to a product strategy driven by market changes and customer needs]
We will shift our product strategy from a “product-out” approach centered on our own technologies
and products to a “market-driven” approach centered on market changes and customer needs. We will
refine the three key elements of proposal capabilities, cost, and speed to build the competitiveness
needed to remain successful in a rapidly changing global market.
[Reforming of business processes with AI and digital technology]
We will promote the automation of business processes and the integration of engineering chains to
achieve faster and higher-quality decision-making while creating an environment where employees
can focus on more creative tasks.
[Fostering of an organizational culture that encourages taking on challenges autonomously]
We will foster a culture in which diverse talent can thrive and take on challenges autonomously. We
aim to become a globally recognized “Great Place to Work” through continuous improvement of the
workplace environment.
(3) Status of Group assets and income
(million yen, except for per share amounts)
The 98th fiscal
The 99th fiscal
Year ended
Year ended
March 31, 2025
March 31, 2026
The 96the fiscal
Year ended
March 31, 2023
The 97th fiscal
Year ended
March 31, 2024
301,500
349,917
347,196
347,200
Operating income
7,677
18,374
19,720
20,538
Ordinary income
7,030
15,560
17,981
20,230
Profit attributable to owners of
parent
2,436
7,921
7,782
1,264
Item
Net sales
Earnings per share
¥
37.32
¥
121.24
¥
118.80
¥
19.29
Total assets
269,278
290,339
285,126
301,614
Net assets
114,432
125,391
123,969
131,252
Notes: 1 Net sales, operating income, ordinary income, profit attributable to owners of parent, total assets,
and net assets are presented with amounts less than one million yen truncated.
(4) Status of parent company and major subsidiaries
- Status of the parent company
No items to report
- Matters concerning to transactions with the parent company, etc.
With regard to transactions with Honda Motor Co., Ltd., a company defined as “other affiliate” of
the Company, prices are determined similarly to ordinary transactions through negotiations based
on market values. In addition, the Company’s Board of Directors deems that decisions pertaining to
the business operation and management of the Company are made by its independent managerial
determination, securing its independence, and therefore the interest of the Company is not
impeded in transactions with the parent company, etc.
- Status of major subsidiaries
Furthermore, to supplement the supervisory function of the Board of Directors, the Company has
established a Nomination and Remuneration Committee and a Governance Committee, both of
which have a majority of outside directors.
The
Company’s
ownership
ratio
(%)
Location
Capital
(million)
Kumamoto
JPY
100
100.0
Kyoto
JPY
45
100.0
Musashi Energy Solutions Co., Ltd.
Yamanashi
JPY
300
100.0
Musashi Auto Parts Michigan Inc.
USA
USD
40
89.5
Manufacturing of automobile parts
Musashi Auto Parts Canada Inc.
Canada
CAD
20
100.0
Manufacturing of automobile parts
Musashi Auto Parts Mexico, S.A. de C.V.
Mexico
USD
12.3
100.0
Manufacturing of automobile parts
Musashi do Brasil Ltda.
Brazil
BRL
105.1
74.9
Musashi da Amazonia Ltda.
Brazil
BRL
109
100.0
Musashi Auto Parts Co., Ltd.
Thailand
THB
200
82.3
P.T. Musashi Auto Parts Indonesia
Indonesia
USD
14
80.0
Musashi Auto Parts India Pvt. Ltd.
India
INR
10,100
100.0
Vietnam
USD
19
100.0
China
USD
94.76
(100.0)
Manufacturing of automobile parts
Musashi Auto Parts (Nantong) Co., Ltd.
China
USD
30
(100.0)
Manufacturing of automobile parts
Musashi Seimitsu Investment
(Zhongshan) Co., Ltd.
China
USD
94.76
100.0
Regional Headquarters in China
Musashi Auto Parts (Tianjin) Co., Ltd.
China
USD
20
(100.0)
Manufacturing of automobile parts
Musashi Bockenau GmbH & Co.KG
Germany
EUR
15
(100.0)
Manufacturing of automobile parts
Musashi Bad Sobernheim GmbH&Co.KG
Germany
EUR
0.001
(100.0)
Manufacturing of automobile parts
Musashi Luechow GmbH
Germany
EUR
(100.0)
Manufacturing of automobile parts
Musashi Hann. Muenden Holding GmbH
Germany
EUR
6.6
(100.0)
Manufacturing of automobile parts
Musashi Hungary Fuzesabony Kft.
Hungary
EUR
0.065
(100.0)
Manufacturing of automobile parts
Spain
EUR
8.7
(100.0)
Manufacturing of automobile parts
100.0
Holding shares of subsidiaries
conducting manufacturing and
sales businesses relating to
automobile parts
Company name
Kyushu Musashi Seimitsu Co., Ltd.
Musashi Casting Co., Ltd..
Musashi Auto Parts Vietnam Co., Ltd.
Musashi Auto Parts (Zhongshan) Co., Ltd.
Musashi Spain Villalba S.L
Musashi Holdings Europe GmbH
Germany
EUR
320
Principal business
Manufacturing of motorcycle and
general-purpose engine parts
Manufacturing of ductile cast iron
material
Development, manufacturing and
sales of equipment related to
lithium ion capacitors and energy
storage devices
Manufacturing of motorcycle and
general-purpose engine parts
Manufacturing of motorcycle and
general-purpose engine parts
Manufacturing of motorcycle and
general-purpose engine parts
Manufacturing of motorcycle and
general-purpose engine parts
Manufacturing of motorcycle and
general-purpose engine parts
Manufacturing of motorcycle and
general-purpose engine parts
Company name
Musashi Hungary Manufacturing, Ltd.
Location
Hungary
The
Company’s
ownership
ratio
(%)
Capital
(million)
EUR
20.1
100.0
Principal business
Manufacturing of automobile parts
Manufacture and sale of AI visual
inspection machines, etc.
Manufacture and sale of AI visual
Musashi AI North America Inc.
Canada
CAD
8.2
80.8
inspection machines, etc.
Various development, prototyping,
and mass production contract
Musashi WIRED Co., Ltd
Niigata
JPY
40.0
60.0
manufacturing utilizing laser
processing technology.
Development, manufacturing and
Musashi Energy Solutions North America,
sales of equipment related to
USA
USD
0.1
100.0
Inc
lithium ion capacitors and energy
storage devices
Note: The figures shown in parentheses show the ownership ratio when including ownership by subsidiaries.
Musashi AI Ltd.
Aichi
JPY
4.0
51.0
(5) Principal business (As of March 31, 2026)
The principal business of the Group consists of the manufacturing and sales of automobile power
train parts, suspension parts, steering parts and transmission parts, among others, of which the main
products are listed below.
PT
Planetary gear assemblies, differential gear assemblies, bevel gears, ring gears, camshafts, balance
shafts, Reduction gears, transmission gears, Reduction gear units
L&S
Suspension arm assemblies, suspension ball joints, steering ball joints, various connection joints
Motorcycle
Motorcycle transmission gear assemblies, motorcycle camshafts, motorcycle kickstarter parts, other
motorcycle power train parts and general-purpose engine parts
(6) Principal business locations and plants (As of March 31, 2026)
- Musashi Seimitsu Industry Co., Ltd.
Head Office and Ueta Plant
Akemi Plant #1
Akemi Plant #2
Horai Plant
Suzuka Plant
(Aichi)
(Aichi)
(Aichi)
(Aichi)
(Mie)
- Principal subsidiaries
For the information on the major subsidiaries and their location, etc., please refer to “(4) Status of
parent company and major subsidiaries 3) Status of major subsidiaries.”
(7) Status of employees (As of March 31, 2026)
- Employees of the Group
Number of employees
Change from previous fiscal year-end
△193(△102)
12,227(3,928)
Note: Number of employees means the number of full-time employees currently at work only, and the average number of parttime and temporary employees for the year is indicated in parentheses.
- Employees of the Company
Number of employees
Change from previous
fiscal year-end
1,111(142)
18(0)
Average age
Average years of service
42.3 years old
17.2 Years
Note: Number of employees means the number of full-time employees currently at work only, and the average number of parttime and temporary employees for the year is indicated in parentheses.
(8) Status of major lenders (As of March 31, 2026)
Balance of borrowings
(million yen)
Lender
Sumitomo Mitsui Banking Corporation
34,592
Mizuho Bank, Ltd.
28,816
The Bank of Mitsubishi UFJ, Ltd.
11,384
The Aichi Bank, Ltd.
9,150
Development Bank of Japan Inc.
8,000
Note: The balance of borrowings is the sum total by lender group.
- Status of the Company
(1) Status of shares (As of March 31, 2026)
- Total Number of Shares Authorized to be Issued
- Total Number of Issued Shares
- Number of Shareholders
- Major Shareholders (Top 10)
140,000,000
65,581,861
7,705
Number of shares
(thousand shares)
Shareholder name
Ownership ratio
(%)
Honda Motor Co., Ltd.
16,364
24.9
The Master Trust Bank of Japan, Ltd. (Trust Account)
4,979
7.5
Custody Bank of Japan, Ltd. (Trust Account)
4,349
6.6
Joint Stock Company Otsuka Holdings
2,603
3.9
MISAKI ENGAGEMENT MASTER FUND
2,555
3.8
STATE STREET BANK AND TRUST COMPANY 505001
2,441
3.7
Hiroshi Otsuka
1,513
2.3
BNP PARIBUS LUXEMBOURG/2S/JASDEC/FIM/LUXEMBOURG
FUNDS/UCITS ASSETS
1,450
2.2
CGML PB CLIENT ACCOUNT/COLLATERAL
1,446
2.2
STATE STREET BANK AND TRUST COMPANY 505301
1,233
1.8
Notes:
Shares less than one thousand have been truncated.
Ownership ratio is calculated excluding treasury shares (35,825shares).
- Status of shares granted to the Company’s officers during the fiscal year under review as
consideration for the execution of duties
Number of Shares
(shares)
Number of
recipients
Directors (excluding Outside Directors and Audit and
10,100
2
Supervisory Committee Members)
Outside Directors (excluding Audit and Supervisory
5,600
4
Committee Members)
Directors serving as Audit and Supervisory Committee
Member
Notes: Details on the Company’s share-based remuneration are presented under section “3.(2) 2) Remuneration for Directors” on
the Business Report.
(2) Policy on Determination of Dividends from Surplus, etc.
Alongside the enhancement of corporate value through business growth, we recognize the return of
profits to all shareholders to be a key management issue. Our basic policy on returning profits to
shareholders is to secure enough capital for medium- and long-term business growth and make
every effort to ensure a sound financial position while continuing to pay stable dividends in line with
earnings growth.
With regard to the dividend payout ratio, we will target a level of 30%.
3 Status of Corporate Governance
(1) Overview of corporate governance
- Basic concept on corporate governance
Based on the Musashi Philosophy, which is composed of Our Origin, Our Purpose, and Our Way, the
Company positions the enhancement of corporate governance as its highest management priority in
advancing its business activities.
Based on the basic concept on corporate governance, we have established the “Basic Policy for
Musashi Corporate Governance” to achieve sustainable growth and enhance medium- to long-term
corporate value.
- Overview of corporate governance structure, etc.
The Company has adopted the institutional design of a company with an Audit and Supervisory
Committee in order to strengthen the auditing and supervisory functions over the execution of
duties by directors and to enhance the effectiveness of internal controls. In addition, outside
directors, including those serving as Audit and Supervisory Committee members, participate in
decision-making at the Board of Directors, thereby improving the transparency and soundness of
management. Furthermore, to supplement the supervisory function of the Board of Directors, the
Company has established a Nomination and Remuneration Committee and a Governance
Committee, both of which have a majority of outside directors.
Meanwhile, by delegating authority over certain matters resolved by the Board of Directors to the
Management Committee and other internal bodies, the Company can accelerate decision-making
and business execution, thereby enhancing the agility of management decisions.
- Efforts to strengthen the governance structure
Governance Committee
The Company is committed to strengthening its corporate governance structure. At the same time,
the pace of change in the business environment is faster than ever before, and we believe that more
sophisticated management decision-making is crucial for expanding new businesses. Furthermore, to
lead the review of the Basic Policy for Musashi Corporate Governance and initiatives to enhance the
effectiveness of the Board of Directors, and to ensure the continuous enhancement of corporate
governance, the Company has established a Governance Committee as an advisory and
recommending body to the Board of Directors. The Committee performs the following functions. The
Committee will perform the following functions:
- Oversight of corporate governance framework
- Ensuring the effectiveness of the Board of Directors
- Oversight of risk management and compliance
- Building relationships with shareholders and stakeholders
(Reference) Our corporate governance structure is shown below.
(2) Status of Corporate Officers
- Status of the Directors (As of March 31, 2026)
Position
Name
President and
Representative Director
Hiroshi Otsuka
Vice President and
Representative Director
Tracey Sivill
Vice President and
Representative Director
Kenji Morisaki
Director
Yoshie Munakata
Director
Goro Kamino
Director
Hari N. Nair
Director
Keisuke Tomimatsu
Director
Emi Onozuka
Director (Audit and
Supervisory Committee
Member)
Makiko Yamamoto
Director (Audit and
Supervisory Committee
Member)
Kazutaka Okubo
Director (Audit and
Supervisory Committee
Member)
Takashi Watanabe
Notes:
Areas of responsibility in the Company
and significant concurrent positions
CEO (Chief Executive Officer),
CESO (Chief Energy Solution Business Officer)
CFO (Chief Financial Officer),
CHO (Chief Human resource Officer),
In charge of Global IT strategy
COO (Chief Operation Officer), Regional CEO Japan,
Chief Risk Management Officer
Chair of the Board of Directors,
Representative Director of B.Grove Inc.
Representative Director and President of Sala Corporation and Group CEO
Chairman and Representative Director of Sala Energy Co., Ltd.
Outside Director of O-I GLASS Inc.
Chairman of the Board of Sintercom India.
Outside Director of Tenneco Inc.
Director, President and CEO of Eminent Group Inc., Representative
Director of general Incorporated Association Initiative for Creating the
Future through Science and Finance,
Outside Director of Daiwa Asset Management Co.Ltd., Outside Director of
PRONEXUS INC.
Attorney at law (TMI Partners Legal Professional Corporation)
TMI Associates London LLP Managing Partner
Outside Director of SUSMED, Inc (Audit and Supervisory Committee Members)
Certified public accountant
President and Representative Director of Okubo Associates Inc.
Outside Director of SEGA SAMMY HOLDINGS INC.
Outside Director of Sun Frontier Fudousan Co., Ltd.,
Outside Director of LIFULL Co., Ltd.
Outside Director of Sala Corporation
Outside Director of The Shoko Chukin Bank Ltd.,
Outside Director of CL Holdings Inc.,
Outside Director of CARTA HOLDINGS, INC.,
President and Representative Director of Freedom One Corporation,
Outside Director of CREEK & RIVER Co., Ltd.
Directors Yoshie Munakata Goro Kamino, Hari N. Nair, Keisuke Tomimatsu, Emi Onozuka and Directors (Audit and
Supervisory Committee Members) Makiko Yamamoto, Kazutaka Okubo and Takashi Watanabe are Outside Directors.
Director (Audit and Supervisory Committee Member) Makiko Yamamoto is qualified as a lawyer with high level of
specialized knowledge in corporate legal affairs and compliance.
Director (Audit and Supervisory Committee Member) Kazutaka Okubo is a certified public accountant and has a high
level of expertise in finance and accounting.
The Company has established a secretariat for the Audit and Supervisory Committee to ensure sufficient information
gathering from Directors (excluding those serving as Audit and Supervisory Committee Members) and from important
in-house meetings, and close coordination with the internal audit section, thereby strengthening the auditing and
supervisory functions of the Audit and Supervisory Committee. For this reason, the Company has not appointed a
full-time Audit and Supervisory Committee Member.
The Company designated Messrs. Yoshie Munakata, Goro Kamino, Hari N. Nair, Keisuke Tomimatsu, Emi Onozuka,
Makiko Yamamoto, Kazutaka Okubo and Takashi Watanabe as Independent Officers pursuant to the regulations of the
Tokyo Stock Exchange and the Nagoya Stock Exchange, and registered them as such.
Director serving as Audit and Supervisory Committee Member Michi Miyasawa retired upon the expiration of her
term of office at the conclusion of the 98th Annual Meeting of Shareholders held on June 26, 2025.
(Ref.) The Company has adopted the executive officer system. The executive officers as of April 1, 2026 are as follows.
Areas of responsibility in the Company
Position
Name
and significant concurrent position
President and
Hiroshi Otsuka
CEO (Chief Executive Officer),
Representative Director
Vice President and
CFO (Chief Financial Officer)
Tracey Sivill
Representative Director
CHO (Chief Human resource Officer)
Vice President and
COO (Chief Operation Officer), Regional CEO Japan,
Kenji Morisaki
Representative Director
Risk Management Officer
Vice President and
Haruhisa Otsuka
CESO (Chief Energy Solution Business Officer)
Executive Officers
Executive Officers
Matthew Barron
Regional CEO America
Executive Officers
Takayuki Miyata
Regional CEO Europe
Executive Officers
Hideki Suzuta
Regional Deputy CEO Europe , Regional COO Europe
Executive Officers
Yoshinori Mizuhuchi
Regional CEO Asia, Regional CEO China
Executive Officers
Naoya Nishimura
Regional CEO India & Africa
Executive Officers
Hideaki Asakura
Managing Director of Kyushu Musashi Seimitsu Co., Ltd.
Executive Officers
Yoichi Sugiura
Executive Officers
Masaru Maeda
Executive Officers
Takeshi Isaku
Executive Officers
Satomi Ishikawa
Executive Officers
Motohiro Ouchi
CSO (Chief Sales Officer)
Executive Officers
Toshihisa Otsuka
CPO (Chief Purchasing Officer)
Executive Officers
Koji Horibe
CQO (Chief Quality Officer)
Executive Officers
Hiroki Matsuda
Deputy CFO (Deputy Chief Financial Officer)
Executive Officers
Naresh Vohra
CITO (Chief IT Officer)
Executive Officers
Masaya Ito
CAO (Chief Audit Officer)
Deputy CESO (Deputy Chief Energy Solution Business
Officer),
MD of Musashi Energy Solutions Co., Ltd
CEMO (Chief e-Mobility Business Officer) ,
CRO (Chief R&D Officer),
Compliance Officer
CIO:Chief Innovation Officer
In Charge of Public Relations
CMO (Chief Marketing Officer),
In Charge of Corporate Planning
- Remuneration for Directors
A. Policy on determining officer remuneration
The Company adopted its decision-making policy for determining content of remuneration for
individual Directors at Board of Directors Meetings.
In addition, the Board of Directors confirmed that decision-making method for determining the
content of remuneration for individual Directors and the determined content of such
remuneration are in alignment with the aforementioned decision-making policy, and that the
findings reported by the Remuneration Committee have been duly regarded, and deems that the
remuneration for individual Directors for the fiscal year under review is in line with the
aforementioned decision-making policy.
The Content of the decision-making policy for the content of remuneration for individual Directors
is as follows.
i. Basic policy
As a matter of basic policy, when it comes to remuneration for the Company’s Directors (excluding
Directors serving as Audit and Supervisory Committee Members; same shall apply hereafter), the
Company shall enlist a remuneration structure that links such remuneration to shareholder
interests so that such remuneration will adequately serve as incentive for the recipient to
persistently increase corporate value, and furthermore the Company shall set standards that
appropriately factor in respective duties when making decisions on remuneration for individual
Directors. Specifically, remuneration for Directors is to consist of base remuneration serving as
fixed remuneration, performance-linked remuneration, and share-based remuneration.
Meanwhile, the Company shall pay base remuneration and share-based remuneration to its
Outside Directors who undertake supervisory functions, upon having taken into account
respective duties.
ii. Policy on determining individual amounts of base remuneration (monetary remuneration;
including policies on determining dates and conditions for granting remuneration)
Base remuneration for Directors of the Company is to take the form of fixed remuneration on a
monthly basis, the amount of which is to be determined upon having comprehensively placed
consideration on positions and roles of respective officers, taking into account peer-company
remuneration levels and other such factors.
iii. Policy on determining content of performance-linked remuneration, non-monetary
remuneration, and other benefits, as well as determining methods for calculating amounts and
quantities thereof (including policies on determining dates and conditions for granting
remuneration)
The Company shall pay performance-linked remuneration at certain times every year in the form
of bonuses and cash remuneration of amounts calculated per assessment of the Company’s
financial results and based on levels of achievement both of the Company’s performance targets
and its strategic benchmarks from a medium- to long-term perspective. The following benchmark
constituents are calculated based on coefficients determined by the Board of Directors.
Assessment
viewpoint
Reasons for selection
Assessment weighting
Assessment item
30%
Gross profit
30%
EBITA
10%
ROIC
To achieve a link with medium-
10%
Transformation benchmarks
Strategic
to long-term strategic
10%
Orders received for EVs
benchmarks
benchmarks and greater social
Financial
To achieve a link with annual
benchmarks
performance targets
value
10%
Level of ESG benchmark
achievement
With respect to the restricted share-based remuneration, as a general rule and pursuant to a
meeting of the Company’s Board of Directors, the Company shall grant an amount of monetary
remuneration claims, commensurate to position and responsibilities, for the allotment of
restricted shares to the eligible Directors every fiscal year, and require that they provide the same
to the Company as property contributed in kind. In turn, the Company shall issue or dispose of its
common shares, which will be held by them. The total number of the common shares of the
Company to be accordingly issued or disposed is to be no more than 200,000 shares per year
(however, in cases where the total number of issued shares of the Company increases or
decreases due to a share consolidation, a share split, a gratis allotment of shares, etc., this upper
limit and the number of shares delivered to the eligible Directors shall be reasonably adjusted
according to the ratio thereof).
The amount to be paid in per share shall be determined by the Board of Directors within a range
not specially advantageous to the eligible Directors subscribing the Company’s common shares
based on factors such as the closing price of the Company’s common shares on the Tokyo Stock
Exchange on the business day immediately before the day on which each resolution of the Board
of Directors is made (if there is no closing price on such date, the closing price of the closest
preceding trading day).
When it comes time for the issuance or disposal of the common shares of the Company, the
Company and the eligible Directors shall enter into an agreement on allotment of the restricted
shares, encompassing content stipulating that the eligible Directors may not transfer, create a
security interest on, reserve an offer as security or otherwise dispose of the common shares of
the Company for a period of three years from the date on which the common shares of the
Company were delivered.
Such agreement is intended to ensure that the restricted share-based remuneration appropriately
serves as incentive to the Directors by containing provisions to the effect that the Company may
automatically acquire the allotted shares without contribution prior to expiration of the transfer
restriction period on the grounds that a Director did not fulfill his or her duties as expected of a
Director of the Company, under scenarios that include situations where an eligible Director: has
retired from the position of director without just cause; has violated laws and regulations, or has
otherwise engaged in improper conduct, or; has engaged in competing business.
In cases such as where an eligible Director is a non-resident of Japan, the Company shall pay such
eligible Director monetary remuneration of an amount linked to the Company’s share price or
other such benchmark in lieu of remuneration provided for the sake of granting restricted shares.
iv. Policy on determining proportional mix of monetary remuneration amounts, performancelinked remuneration amounts, and non-monetary remuneration amounts, relative to amounts of
remuneration for individual Directors
To ensure that the remuneration structure serves as an incentive appropriate to the Directors, the
proportional mix of Director remuneration components by type is to be determined based on
assumptions regarding basic standards with respect to proportions of remuneration components
presented in the table below. The Remuneration Committee shall consider such matters on the
basis of remuneration level benchmarks with respect to corporations that belong to related
industries and categories of business and are similar to the Company in terms of their scale of
operations.
The Board of Directors (the Representative Director and President entrusted with authority per
section v, below) shall duly regard findings of the Nomination and Compensation Committee and
accordingly determine the content of remuneration for individual Directors such that is within a
range with respect to the proportional mix of remuneration by remuneration type as indicated by
such findings.
Base remuneration
Performance-linked
remuneration, etc.
Non-monetary
remuneration, etc.
Representative Directors
50~55%
25~30%
15~25%
Directors
60~70%
25~30%
10~15%
Outside Directors
60~70%
30~40%
v. Matters related to content of remuneration for individual Directors
With respect to amounts of remuneration for individual Directors, the Nomination and
Compensation Committee shall assess Directors who engage in business affairs in terms of factors
such as the appropriate execution of their duties, which is to involve comparing the Company’s
financial results with those of peer companies while taking into account the business
environment. Meanwhile, the Representative Director and President shall be entrusted with
decisions regarding specific amounts of remuneration for individual Directors, basing such
decisions on findings of such assessment.
B. Total amount of remuneration of Directors for the fiscal year under review
Classification
Amount
paid
(million
yen)
Total amount of remuneration, etc. by
type
Performanc
NonBase
e-linked
monetary
remunerati
remunerati remunerati
on
on, etc.
on, etc.
Number of
payees
Directors (excluding Directors serving as Audit and
Supervisory Committee Members)
361
189
67
103
8
(Outside Director of the above)
(95)
(44)
(15)
(36)
(5)
Directors (Audit and Supervisory Committee
Members)
31
31
4
(Outside Director of the above)
(26)
(26)
(-)
(-)
(3)
Total
392
221
67
103
12
(Outside Officers of the above)
(122)
(70)
(15)
(36)
(8)
Notes: 1. The maximum amount of remuneration of Directors (excluding Directors serving as Audit and Supervisory Committee
Members) was determined as 400 million yen per year (of which, 80 million yen or less for Outside Directors;
provided, however, that this excludes the portion of employee salaries for Directors who serve concurrently as
employees) by resolution at the 88th Annual Meeting of Shareholders held on June 23, 2015. The number of
Directors (excluding Directors serving as Audit & Supervisory Board Members) as of the close of this Annual Meeting
of Shareholders is six (6) (including one Outside Director). And apart from this, for the Company’s Directors (excluding
Directors serving as Audit and Supervisory Committee Members), it was approved at the 90th Annual Meeting of
Shareholders held on June 23, 2017, a resolution was adopted that the monetary remuneration to grant shares with
transfer restrictions and monetary remuneration in an amount linked to the aforementioned share price, etc. shall be
not more than 250 million yen per year (of which not more than 40 million yen per year shall be for Outside
Directors; however, this excludes the portion of employee salaries of Directors serving concurrently as employees).
The number of Directors (excluding Directors serving as Audit & Supervisory Board Members) as of the close of this
Annual Meeting of Shareholders is nine (9) (including three (3) Outside Directors).
2. The maximum amount of remuneration of Directors (Audit and Supervisory Committee Members) was determined as
80 million yen per year by resolution at the 88th Annual Meeting of Shareholders held on June 23, 2015. The number
of Directors (Audit and Supervisory Board Members) as of the close of this Annual Meeting of Shareholders is four
(4).
3. The total amount of remuneration of Directors does not include the portion of employee salaries for Directors who
serve concurrently as employees.
4. The total amount of remuneration paid includes the provision for Directors’ bonuses for the fiscal year under review.
5. The Company enlists certain performance indicators linked to financial results in the form of financial indicators in
order to help ensure linkage with annual performance targets, adopting the degree of achievement of operating
profit, EBITDA, and ROIC against the budget at the beginning of the fiscal year. In addition, the Company uses
strategic indicators in order to ensure linkage with efforts to enhance corporate value over the medium to long term.
To this end, it adopts the degree of achievement of a transformation indicator, orders received for EVs, and ESG
indicators (E: CO2 emissions, S: safety, G: ratios of women and non-Japanese employees, etc.) relative to targets set
at the beginning of the period. Actual results for FY2025 were as follows: operating profit of 20.5 billion yen, EBITDA
of 38.8 billion yen, and for the ESG indicator, an actual CO2 emissions reduction of 16.1% against the 20% target
reduction (due to energy-saving measures, introduction of renewable energy, and production volume impact). From
FY2025, for reasons related to sales policies and competitive strategy, the actual figures for ROIC, the transformation
indicator, and orders received for EVs will not be disclosed. While the actual figures for these metrics are not
disclosed externally, the Company has confirmed that the Nomination and Remuneration Committees have
determined the specific amounts of performance-linked remuneration, etc., based on these actual figures.
6. The non-monetary remuneration consists of shares of the Company, allotted subject to the conditions set forth under
section “A. Policy on determining officer remuneration.” The status of shares granted during the fiscal year under
review is presented under section “2.(1)5) Status of shares granted to the Company’s officers during the fiscal year
under review as consideration for the execution of duties.”
7. The Board of Directors has entrusted Representative Director and President (CEO) Hiroshi Otsuka with decisions on
amounts of remuneration for individual Directors. He has been entrusted with this authority because the Company
deems that the Representative Director is qualified for the task of assessing Directors who engage in business affairs
in terms of factors such as the appropriate execution of their duties while also placing consideration on the
Company’s overall financial results and other performance indicators. In making decisions regarding content
entrusted to him, the Remuneration Committee shall assess Directors who engage in business affairs in terms of
factors such as the appropriate execution of their duties, which is to involve comparing the Company’s financial
results with those of peer companies while taking into account the business environment.
8. The total amount of remuneration above includes the amount paid to Directors (Audit and Supervisory Committee
Members) who retired during the fiscal year under review.
- Matters regarding Outside Officers
A. Main activities during the fiscal year under review and overview of duties involving roles expected
of Outside Directors
- Mr. Yoshie Munakata, Director, attended 9 out of the 9 Board of Directors Meetings held during the
fiscal year under review and has utilized his abundant experience of company management and
the deep insights cultivated over many years in the industry to actively contribute to the
deliberation of resolutions by the Board of Directors.
- Mr. Goro Kamino, Director, attended 9 out of the 9 Board of Directors Meetings held during the
fiscal year under review. Based on his extensive experience and high level of knowledge gained
from leading business restructuring and governance reforms as a corporate manager of listed
companies, as well as his deep understanding of local economies and communities, he
appropriately fulfilled his role in ensuring the validity and suitability of decision-making by
actively contributing as required to the deliberation of resolutions by the Board of Directors
based on the Company’s business foundation.
- Mr. Hari N. Nair, Director, attended 9 out of the 9 Board of Directors Meetings held during the fiscal
year under review and in addition to his experience of more than 35 years as a Director at listed
companies in various regions, he has served in key executive posts, including Chief Operating
Officer (COO) and provisional CEO of an overseas auto part manufacturer. He has utilized his
abundant experience and deep cultivated insights to actively contribute as required to the
deliberation of resolutions by the Board of Directors.
- Mr. Keisuke Tomimatsu, Director, attended 9 out of the 9 Board of Directors Meetings held during
the fiscal year under review. Based on his extensive experience in the securities and AI industries,
considerable financial and accounting knowledge, and deep understanding of the Company’s
business and management challenges cultivated through his previous professional experience, he
appropriately fulfilled his role in ensuring the validity and suitability of decision-making by
actively contributing as required to the deliberation of resolutions by the Board of Directors from
the perspectives of the capital markets and investors.
*Ms. Emi Onozuka, Director, attended 9 out of the 9 Board of Directors Meetings held during the
fiscal year under review and based on her abundant experience and deep insights cultivated over
20 years in a variety of positions at investment management firms and as the COO of an
investment advisory firm, she appropriately fulfilled her role in ensuring the validity and
suitability of decision-making by actively contributing as required to the deliberation of
resolutions by the Board of Directors.
- Ms. Makiko Yamamoto, Director (Audit and Supervisory Committee Member) attended 9 out of the
9 Board of Directors Meetings held during the fiscal year under review where she raised
questions and provided advice whenever appropriate from a professional perspective as a lawyer.
Also, she has attended 12 out of 12 meetings of the Audit and Supervisory Committee held
during the fiscal year under review and has voiced his opinions on audit methods and on other
matters related to the duties of the Audit and Supervisory Committee.
- Mr. Kazutaka Okubo, Director (Audit and Supervisory Committee Member) attended 9 of the 9
Board of Directors Meeting held during the fiscal year under review where he raised questions
and provided advice whenever appropriate from a professional perspective as a certified public
accountant. Also, she has attended 12 out of 12 meetings of Audit and Supervisory Committee
held during the fiscal year under review and has voiced his opinions on audit methods and on
other matters related to the duties of the Audit and Supervisory Committee.
- Mr. Takashi Watanabe, Director (Audit and Supervisory Committee Member), attended 7 of the 7
Board of Directors Meetings held during the fiscal year under review. Based on his extensive
experience in corporate management over many years and highly specialized expertise, he
appropriately fulfilled his role in ensuring the validity and suitability of decision-making by the
Board of Directors by raising questions and offering advice as necessary. Also, he attended 9 out of
9 meetings of the Audit and Supervisory Committee held during the fiscal year under review and
voiced his opinions on audit methods and other matters related to the duties of the Audit and
Supervisory Committee Members.
Note: The above reflects attendance records since assuming office on June 26, 2025.
B. Status of significant concurrent positions at other companies, etc. and relationship between such
companies with the Company
- Mr. Goro Kamino, Director, also serves as Representative Director and President of Sala
Corporation and Group CEO and as Representative Director and Sala Energy Co., Ltd. The
Company has transactions etc. with Sala Corporation and Sala Energy Co., Ltd. However, the
average annual transaction amount of the last three fiscal years relating thereto accounts for less
than 2% of the average sales of both the Company and them over that period, and the annual
transaction amount relating thereto accounts for less than 1% of sales of both the Company and
them.
Note: There are no special interests between the other directors and the Company.
- Overview of limited liability agreements
- The Company and the Outside Directors entered into limited liability agreements that limit the
amount of liability under Article 423, paragraph 1 of the Companies Act, pursuant to the
provisions of Article 427, paragraph 1 of the same Act. The maximum amount of liability for
damages under these agreements is the amount stipulated in Article 425, paragraph 1 of the
same Act.
- Overview of directors and officers liability insurance policy
The Company has entered into a directors and officers liability insurance policy with an insurance
company as stipulated in Article 430-3, paragraph 1 of the Companies Act, listing as insured
parties the Company’s Directors (including Outside Directors), as well as Directors and Audit and
Supervisory Board Members of the Company’s subsidiaries (excluding Musashi Europe GmbH and
its subsidiaries. The insurance policy provides coverage for officers, etc. for damages arising upon
having incurred liability regarding their execution of duties or otherwise arising upon having
become subject to a claim in pursuit of such liability.
(3) Financial Auditor
- Name: KPMG AZSA LLC
- Amount of remuneration, etc.
Amount paid
(million yen)
Remuneration, etc. of the Financial Auditor for the fiscal year under review
97.0
Total economic benefits, including money, that should be paid to the Financial
Auditor by the Company and its subsidiaries
97.0
Notes:
Subsidiaries of the Company are audited by audit corporations other than the Financial Auditor of the Company.
In the audit agreement between the Company and the Financial Auditor, a distinction is not made between the
remuneration for auditing based on the Companies Act and that for auditing based on the Financial Instruments and
Exchange Act, nor is such distinction effectively possible. Therefore, the amount of the remuneration, etc. of the
Financial Auditor for the fiscal year under review includes the amount of remuneration, etc. for auditing based on the
Financial Instruments and Exchange Act.
The Audit and Supervisory Committee gives consent regarding the remuneration etc. of the Financial Auditor
pursuant to Article 399, paragraph 1 of the Companies Act, after it has obtained necessary materials and received
reports from the Directors, relevant departments within the Company and the Financial Auditor, confirmed the
performance of financial audits etc. by the Financial Auditor and reviewed the details of the audit plan of the
Financial Auditor and the calculation basis for the estimated amount of remuneration etc. for the fiscal year under
review.
- Policy Regarding Dismissal or Non-Re-Employment of Financial Auditor
In the case that the financial auditor is recognized to have committed a serious legal infraction, sharply lowered the
quality of its audit services, or otherwise shown grounds for determining it is inappropriate for employment as a financial
auditor, the Company’s Audit Committee shall dismiss the financial auditor in accordance with procedures stipulated in the
Companies Act, or decide on proposals concerning the dismissal or non re-employment of the financial auditor to be
submitted to the general meetings of shareholders.
(4) Systems necessary to ensure proper operations and overview of operational status of the
systems
⚫ Basic policy concerning the establishment of internal control system
The board of directors has resolved the following basic policy regarding the systems to ensure
that the execution of duties by directors complies with applicable laws and regulations and the
Articles of Incorporation, as well as other systems designed to ensure the appropriateness and
soundness of the Company’s business operations.
- Systems to ensure that the duties of directors and employees are executed in compliance
with laws and regulations and the Articles of Incorporation, and other systems to ensure
proper operations
̵ The Company shall appoint an executive officer responsible for promoting compliance and
shall establish a framework for systematic initiatives.
̵ The Company shall establish a committee to deliberate on matters related to corporate ethics
and compliance.
̵ The Company shall formulate and disseminate “Our Compliance” as a shared code of conduct
to be observed by each employee of the Group in their dealings with customers and society.
̵ The Company shall establish an internal reporting (whistleblowing) system to address issues
related to corporate ethics.
- Systems for the storage and management of information concerning the execution of duties
of directors
̵ The Company shall develop a framework for information management by appropriately
retaining and managing documents and other information related to the execution of
duties by directors in accordance with the document management regulations.
- Regulations and other systems concerning risk management
̵ The Company shall appoint an executive officer responsible for promoting risk
management and develop a risk management framework for systematic initiatives.
̵ The Company shall establish “Crisis Management Regulations,” under which each
department shall endeavor to prevent and mitigate risks arising from business
activities, and the Company shall manage company-wide crises and responses thereto,
including large-scale disasters, the outbreak of infectious diseases, and cyberattacks.
̵ With respect to risk management across the Group, the Company shall strengthen its
risk management framework through discussions among its officers.
- Systems to ensure the efficient execution of duties by directors.
̵ The Company shall develop a framework under which the Board of Directors supervises
global business execution based on a Chief Officer structure.
̵ In regional business operations and various executive functions, the Company shall
ensure prompt and optimal management decision-making tailored to each region and
operational site, while achieving efficient and effective business operations.
̵ The Management Committee shall deliberate on important management matters
within the scope of authority delegated by the Board of Directors.
̵ The Company shall establish a Management Strategy Committee to share the Group
policies, identify issues for achieving management plans and discuss appropriate
responses thereto, thereby enhancing the optimality and efficiency of business
execution across the Group.
- Systems to ensure the appropriateness of operations within the corporate group consisting
of the Company and its parent company and subsidiaries
̵ The Company shall establish regulations for the management of affiliated companies in
order to ensure the proper execution of operations by each Group company, manage
each Group company in accordance with such regulations, and receive reports from
each Group company.
̵ The Company shall establish the “Musashi Global Policy” to build an effective
management structure for the Group and enhance corporate governance across the
Group.
̵ Each Group company shall conduct periodic self-assessments based on checklists.
̵ The Internal Audit Office, an independent internal audit section of the Company, and
the global auditors stationed in each region conduct audits on the status of the
business execution of each section of the Company and each Group company, and
works to enhance the quality of these internal audits.
̵ The Corporate Audit Department shall report the results of internal audits to the
audited departments and companies, request the formulation of improvement
measures for identified issues, periodically monitor the progress of such measures, and
report the status to the Board of Directors as appropriate.
6) Matters concerning directors and employees who assist the duties of the Audit and
Supervisory Committee, and matters concerning the independence of such directors and
employees from other directors (excluding directors who are members of the Audit and
Supervisory Committee (the “Audit and Supervisory Committee Members”)
̵ The Company shall have the internal audit department assist with the duties of the
Audit and Supervisory Committee, and shall, while ensuring the independence of the
internal audit department, deepen coordination with the Audit and Supervisory
Committee and contribute to the establishment of an efficient and effective audit
framework.
7) Systems for reporting by directors (excluding Audit and Supervisory Committee Members)
and employees to the Audit and Supervisory Committee, and other systems for reporting to
the Audit and Supervisory Committee
・The Company shall provide for periodic reporting to the Audit and Supervisory
Committee on the status of business operations of the Company and its subsidiaries,
as well as the development and operation of internal control systems, including
compliance and risk management, and shall report any matters that may have a
significant impact on the Company.
・Audit and Supervisory Committee Members shall have no obligation to disclose to
third parties any information obtained from directors (excluding Audit and Supervisory
Committee Members) or employees and may request such directors to disclose the
reasons for any personnel changes, performance evaluations, or disciplinary actions
concerning the employees who have made such reports.
8) Other systems to ensure the effectiveness of audits by the Audit and Supervisory Committee
˗ The Audit and Supervisory Committee and the Corporate Audit Department, as the
internal audit function, shall work closely together to conduct audits of the Company
and its subsidiaries, and Audit and Supervisory Committee Members shall attend
management meetings and other important meetings.
-
The Company shall respond to any request by Audit and Supervisory Committee
Members for advance payment of expenses or reimbursement of expenses incurred,
or for the settlement of liabilities incurred, in connection with the execution of their
duties, unless it can be demonstrated that such expenses or liabilities were not
incurred in connection with the execution of their duties.
-
44 -
⚫ Operational status of internal control system
The principal matters regarding the operation of the systems for ensuring the
appropriateness of operations during the fiscal year under review are as follows.
- Systems to ensure that the execution of duties by directors and employees complies with
laws and regulations and the Articles of Incorporation, as well as other systems to ensure the
appropriateness of operations
˗ The Company has appointed a Compliance Officer to promote compliance initiatives and
established an Internal Control Committee to deliberate on matters related to corporate
ethics and compliance.
˗ The Company conducts compliance training based on the code of conduct “Our
Compliance” for all employees, thereby enhancing corporate ethics.
˗ The Company operates the Musashi Corporate Ethics Reporting Desk, an internal
whistleblowing contact point, to receive reports on issues related to corporate ethics and
compliance. In addition to internal contact points, the Company has established an
external contact point with outside legal counsel and a contact point with the Audit and
Supervisory Committee Members, thereby creating an environment that facilitates
reporting and enhancing the effectiveness of the system. Furthermore, to enhance the
effectiveness of the whistle-blowing system in the Group, the Company works to
redevelop the system of each Group company and strengthen its operation, and monitors
the status of each company.
- Systems for the storage and management of information related to the execution of duties
by directors
˗ The Company has established rules concerning document management, including
document retention periods, and appropriately retains and manages information in
accordance with such rules.
˗ With respect to information related to the execution of duties by directors, the Company
also sets retention periods in accordance with the document management rules and
ensures proper management, including the designation of confidentiality classifications in
accordance with the confidentiality management rules.
˗ The Company periodically reviews its rules on document management and confidentiality
of internal documents and promotes the appropriate management of business-related
information.
- Systems for risk management
˗ The Company has appointed a Risk Management Officer to promote risk management
initiatives and established a BCM Committee to deliberate on business continuity risks and
countermeasures and has developed business continuity plans (BCPs).
˗ The Company continuously conducts BCP drills in preparation for large-scale earthquakes,
which are identified as the most significant risk.
˗ In accordance with the Crisis Management Regulations, the Company and its Group
companies assess operational risks and business continuity risks, identify and analyze risks
across the Group, and discuss risk management matters at the Sustainability Strategy
Committee attended by directors.
4) Systems to ensure the efficient execution of duties by directors
˗ The Board of Directors determines the allocation of duties of directors and appoints
executive officers, thereby ensuring the efficient operation of business. It also actively
discusses Group-wide management strategies and medium- to long-term management
plans, thereby enhancing corporate value.
˗ As a company with an Audit and Supervisory Committee, the Company, in accordance with
the Articles of Incorporation, delegates a part of important business execution to the
Management Committee by resolution of the Board of Directors, thereby enabling efficient
and agile decision-making in management
˗ Business execution is carried out in a timely manner under the clear execution
responsibility of executive officers.
˗ The Company shares policies with each Group company and holds a Corporate Strategy
Committee to discuss issues and other matters necessary for achieving business plans. In
addition, the Company is enhancing its global platform, centered on the renewal of its core
systems. Furthermore, by promoting data utilization and improving visibility, the Company
is accelerating management decision-making in order to optimize and streamline business
execution across the Group.
5) Systems to ensure the appropriateness of operations within the corporate group, including
the Company, its parent company, and subsidiaries
˗ The Board of Directors establishes basic policies for the development of internal control
systems and supervises the establishment and operational status of the Group’s
framework.
˗ The Company has established regulations for the management of affiliated companies,
which set forth matters to be reported from Group companies to the head office, and
manages Group companies in accordance with such regulations.
˗ The Company is working to ensure that the shared rules (global policies) drawn up to
contribute to the efficient management and the unified administration of the Group as a
whole take root, and strives to enhance operational efficiency and governance through
regular policy reviews.
˗ Each Group company conducts periodic self-assessments using checklists regarding
compliance with applicable laws and regulations and risks that should be addressed in
their operations, and issues identified from such assessments are deliberated by the
Internal Control Committee as matters to be addressed across the Group.
˗ The Internal Audit Office, an independent internal audit section of the Company, and the
global auditors stationed in each region periodically audit each section of the Company
and each Group company.
-
Matters concerning directors and employees who assist the duties of the Audit and
Supervisory Committee, and matters concerning the independence of such directors and
employees from other directors (excluding directors who are members of the Audit and
Supervisory Committee (the “Audit and Supervisory Committee Members”))
˗ The Corporate Audit Department, which is independent from operational divisions,
assists the Audit and Supervisory Committee and strengthens the audit function. The
Corporate Audit Department is organizationally independent from other operational
divisions and, in performing its duties to assist the Audit and Supervisory Committee,
operates under the direction of the Audit and Supervisory Committee.
-
Systems for reporting by directors (excluding Audit and Supervisory Committee Members)
and employees to the Audit and Supervisory Committee, and other systems for reporting to
the Audit and Supervisory Committee
˗ In order to enable the Audit and Supervisory Committee to obtain information
necessary for its audits, the internal audit function, the internal control function, and
other operational divisions regularly report to the Audit and Supervisory Committee.
In addition, the Internal Audit Office and global internal auditors practice dual
reporting with the Representative Director, such as by promptly reporting audit results
and the status of implementation of audit improvement recommendations to the
Audit and Supervisory Committee.
-
Other systems to ensure the effectiveness of audits by the Audit and Supervisory Committee
˗ In addition to conducting regular audits, the Audit and Supervisory Committee
endeavors to understand the circumstances surrounding the Company and develops
an environment to enhance the effectiveness of audits, including through coordination
with the Corporate Audit Department and opportunities for information sharing
among Audit and Supervisory Committee Members.
˗ Audit and Supervisory Committee Members attend management meetings and other
important meetings to monitor the status of business execution. In addition, at
meetings of the Board of Directors, they actively express opinions from a supervisory
and audit perspective, thereby strengthening the Board’s supervisory functions.
˗ Audit and Supervisory Committee Members conduct audits in cooperation with the
Corporate Audit Department, including by attending audits conducted by the
Corporate Audit Department.
Consolidated Balance Sheet
(As of March 31, 2026)
(Unit: million yen)
Account title
Amount
Account title
Amount
Assets
301,614
Liabilities
170,361
Current assets
150,052
Current liabilities
Notes and accounts payable –
trade
117,857
Short-term loans payable
45,206
Cash and bank deposits
Notes and accounts receivable –
trade
32,651
50,204
13,066
20,892
Work in process
12,543
Current portion of long-term
loans payable
Accounts payable – other
Raw materials and supplies
31,931
Accrued expenses
10,307
Others
11,162
Income taxes payable
2,511
Allowance for doubtful accounts
△1,506
Provision for bonuses
3,565
151,561
Provision for directors’ bonuses
51
128,947
Provision for product warranties
22
29,046
Allowance for loss on
guarantees
Allowance for loss on litigation
Merchandise and finished goods
Non-current assets
Property, plant and equipment
Buildings and structures
Machinery, equipment and vehicles
Tools, furniture and fixtures
60,751
4,204
Land
10,234
Construction in progress
24,710
Intangible assets
Goodwill
Customer relationship assets
Provisionfor business
restructuring
Others
Non-current liabilities
16,734
6,339
200
662
6,108
5,252
52,504
2,988
Long-term loans payable
36,796
586
Deferred tax liabilities
3,929
1,189
Liabilities on employees’
retirement benefits
Others
8,451
Software
761
Software in progress
15
Net assets
131,252
Others
435
96,897
Investments and other assets
19,626
Shareholders’ equity
Capital stock
Investment securities
9,798
Capital surplus
Investments in capital
1,648
Retained earnings
124
Treasury shares
Long-term loans receivable
Deferred tax assets
Others
5,192
2,863
Accumulated other comprehensive
income
Valuation difference on availablefor-sale securities
Foreign currency translation
adjustment
Remeasurements of defined
benefit plan
Non-controlling interests
Total assets
301,614 Total liabilities and net assets
Note: Figures are presented with amounts less than one million yen truncated.
3,327
5,675
73
91,156
△8
25,132
3,017
21,644
470
9,223
301,614
Consolidated Statement of Income
(April 1, 2025 - March 31, 2026)
(Unit: million yen)
Account title
Amount
Net sales
347,200
Cost of sales
291,749
Gross profit
55,451
Selling, general and administrative expenses
34,913
Operating income
20,538
Non-operating income
3,423
Interest income
571
Dividend income
400
Gain on valuation of investment securities
7
Gain on sale of investment securities
3
Foreign exchange gains
1,910
Subsidy income
4
Compensation received
82
Others
443
Non-operating expenses
3,730
Interest expenses
2,187
Loss on valuation of investment securities
70
Share of loss of entities accounted for using equity method
239
Provision for allowance for doubtful accounts
875
Others
358
Ordinary income
20,230
Extraordinary income
100
Gain on sales of non-current assets
74
Gain on termination of retirement benefit plan
25
Extraordinary losses
11,057
Loss on sales of non-current assets
Note:
4
Loss on retirement of non-current assets
141
Loss on valuation of investment securities
3,111
Provision for loss on litigation
459
Business restructuring costs
7,340
Profit before income taxes
9,273
Income taxes – current
8,187
Income taxes – deferred
△1,260
Profit
2,346
Profit attributable to non-controlling interests
1,082
Profit attributable to owners of parent
1,264
Figures are presented with amounts less than one million yen truncated.
Consolidated Statement of Changes in Net Assets
(April 1, 2025 - March 31, 2026)
(Unit: million yen)
Shareholders’ equity
Capital stock
Balance at April 1, 2025
Capital surplus
5,639
37
35
35
Retained earnings
Treasury shares
Total shareholders’
equity
93,157
△8
98,826
Changes of items during
period
Share issuance
Dividends of surplus
Profit attributable to
owners of parent
Changes due to changes
in the fiscal year end of
consolidated subsidiaries
Net changes of items other
than shareholders’ equity
Total changes of items during
period
Balance at March 31, 2026
△3,276
71
△3,276
1,264
1,264
11
11
―
35
35
△2,000
―
△1,929
5,675
73
91,156
△8
96,897
Noncontrolling
interests
Accumulated other comprehensive income
Balance at April 1, 2025
Valuation
difference on
available-forsale securities
Foreign currency
translation
adjustment
Remeasurem
ents of
defined
benefit plan
Total accumulated
other
comprehensive
income
3,221
12,350
362
15,935
9,208
Total net assets
123,969
Changes of items during
period
71
Share issuance
△3,276
Dividends of surplus
Profit attributable to
owners of parent
Changes due to changes
in the fiscal year end of
consolidated subsidiaries
Net changes of items
other than shareholders’
equity
Total changes of items
during period
Balance at March 31, 2026
1,264
11
△204
9,294
107
9,197
15
9,212
△204
9,294
107
9,197
15
7,283
3,017
21,644
470
25,132
9,223
131,252
Note: Figures are presented with amounts less than one million yen truncated.
Notes to Consolidated Financial Statements
- Notes relating to the assumptions of the going concern
No items to report
- Significant matters that serve as the basis for the preparation of consolidated financial statements
(1) Matters relating to the scope of consolidation
- Status of consolidated subsidiaries
i) Number of consolidated subsidiaries:
37
ii) Names of consolidated subsidiaries:
Kyushu Musashi Seimitsu Co., Ltd.
Musashi Casting Co., Ltd..
Musashi Energy Solutions Co., Ltd.
Musashi Auto Parts Michigan Inc.
Musashi Auto Parts Canada Inc.
Musashi Auto Parts Mexico, S.A. de C.V.
Musashi do Brasil Ltda.
Musashi da Amazonia Ltda.
Musashi Auto Parts Co., Ltd.
P.T. Musashi Auto Parts Indonesia
Musashi Auto Parts India Pvt. Ltd.
Musashi Auto Parts Vietnam Co., Ltd.
Musashi Auto Parts (Zhongshan) Co., Ltd.
Musashi Auto Parts (Nantong) Co., Ltd.
Musashi Seimitsu Investment (Zhongshan) Co., Ltd.
Musashi Auto Parts (Tianjin) Co., Ltd
Musashi Bockenau GmbH & Co.KG
Musashi Bad Sobernheim GmbH & Co.KG
Musashi Luechow GmbH
Musashi Hann. Muenden Holding GmbH
Musashi Hungary Fuzesabony Kft.
Musashi Spain Villalba S.L.
Musashi Holdings Europe GmbH
Musashi Hungary Manufacturing, Ltd.
Musashi AI Ltd.,
Musashi AI North America Inc.
Musashi WIRED Co., Ltd
Musashi Energy Solutions North America, Inc
(iii) Change in the scope of consolidation
Effective from the fiscal year under review, Musashi Energy Solutions North America, Inc., a newly
established company, has been included in the scope of consolidation.
- Status of non-consolidated subsidiaries:
i) Names of principal non-consolidated subsidiaries:
Musashi Auto Parts UK Ltd.
ii) Reason for exclusion from the scope of consolidation
Non-consolidated subsidiaries are excluded from the scope of consolidation because their
respective total assets, net sales, profit or loss, and retained earnings do not have a material
effect on the consolidated financial statements.
(2) Matters concerning application of equity method
- Status of non-consolidated subsidiaries and associates for which the equity method is applied
i) Number of non-consolidated subsidiaries and associates for which the equity method is applied: 3
ii) Name of principle subsidiaries, etc.;
Waphyto Inc. , 634 AI Ltd, Musashi Delta e-Axle India Private Limited
- Status of non-consolidated subsidiaries and associates for which the equity method is not applied
i) Names of principal companies, etc.:
Musashi Auto Parts UK Ltd.
ii) Reason for not applying equity method
Since non-consolidated subsidiaries and associates for which the equity method is not applied
have an immaterial effect based on profit and loss (amount proportional to the ownership),
retained earnings (amount proportional to the ownership) and others even if they are not
accounted for by the equity method, and they also do not have a material effect on overall
operations, they are excluded from the scope of the equity method.
(3) Items relating to the fiscal years, etc. of consolidated subsidiaries
The account closing date of the 7 consolidated subsidiaries of the Company is December 31. These 7
companies carry out settlement by provisional settlement on the consolidated settlement date.
Musashi WIRED Co., Ltd., a consolidated subsidiary whose fiscal year-end was previously February
28, had been using the non-consolidated financial statements as of that date and making necessary
adjustments for significant transactions occurring between that date and the consolidated fiscal yearend. However, effective from the fiscal year under review, the company has changed its fiscal year-end
to March 31. Consequently, the profit and loss of this consolidated subsidiary for the period from
March 1, 2025, to March 31, 2025, has been adjusted as a change in retained earnings. The impact of
this change on the consolidated financial statements is immaterial.
(4) Matters regarding accounting policies
- Valuation basis and method for significant assets
i) Securities
Available-for-sale securities
- Securities other than shares, etc. without market value
Market value method based on the market price as of the accounts settlement date (the full
amount of the valuation difference is charged to net assets using the direct transfer to capital
method, with the disposal cost determined by the moving average method)
- Shares without market value
Stated at cost using the moving average method
ii) Derivatives
Market value method
iii) Inventories
The Company and consolidated subsidiaries mainly state inventories at cost using the moving
average method (figures on the balance sheet are adjusted by writing down the book value
where the profitability declines), however, some overseas consolidated subsidiaries use the lower
of cost or market method by the first-in first-out method or weighted average method.
- Depreciation methods for material depreciable assets
i) Property, plant and equipment (excluding leased assets)
Depreciated using the straight-line method. Please note that the main useful lives are as follows.
Buildings and structures
20 to 50 years
Machinery, equipment
5 to 20 years
and vehicles
ii) Intangible assets (excluding leased assets)
The straight-line method is applied. However, for software for internal use, the straight-line
method is applied based on the expected usable period within the Group (mainly 5 years).
Furthermore, straight-line method is applied for customer relationship assets based on the
expected usable period (5 to11 years).
iii) Leased assets
Leased assets related to ownership transfer finance lease transactions
We use the same depreciation method applied to our own non-current assets.
Leased assets in non-ownership-transfer finance lease transactions
Depreciation is calculated on the straight-line method over the lease term as the useful life with
no residual value.
iv) Right-of-use assets
For some of our overseas consolidated subsidiaries, we prepare financial statements in
accordance with International Financial Reporting Standards, and we applied International
Financial Reporting Standards No. 16 “Leases” (hereinafter referred to as “IFRS 16”). According to
IFRS 16, all lessees of a lease are required to be recorded as assets and liabilities on the balance
sheet. As for the depreciation method of right-of-use assets recorded as assets, we adopted a
method of using the period of the lease period or the useful life of the asset, whichever is
shorter, with the residual value being calculated as zero.
- Accounting policy for significant provisions
i) Allowance for doubtful accounts
To provide for losses due to bad debt, the Group reserves an estimated bad debt allowance on
ordinary receivables based on historical bad debt ratios and on highly doubtful receivables and
other specified debt based on the recoverability from individual receivables.
ii) Provision for bonuses
To provide for the future payment of employee bonuses, the Company and some consolidated
subsidiaries report the anticipated amount of bonus payments.
iii) Provision for directors’ bonuses
To provide for the future payment of directors’ bonuses, the Company and some consolidated
subsidiaries report the anticipated amount of bonus payments.
iv) Provision for product warranties
To provide for product warranty expenses, the Group reports the anticipated amount of warranty
expenses.
ⅴ) Allowance for loss on guarantees
In order to prepare for losses on guarantees, we take into account the financial position, etc. of
the guaranteed party on an individual basis and record the estimated amount of loss to be
borne. expenses.
ⅵ) Provision for structural reform
To prepare for losses arising from structural reforms, the estimated amount of such losses has
been recorded.
4) Accounting policy for revenue and expenses
The Group recognizes revenue based on the following five step approach.
Step 1: Identify contract(s) with customer
Step 2: Identify the performance obligations in the contract(s)
Step 3: Determine the transaction price
Step 4: Allocate the transaction price to the performance obligations in the contract(s)
Step 5: Recognize revenue when (or as) the entity satisfies a performance obligation
The Group primarily manufactures and sells automotive parts. Since the performance obligation is
mainly identified as the delivery of the finished product to the customer, and control over the
product is transferred to the customer at the time of delivery of the product, it is thus judged that
the performance obligation is satisfied. We recognize revenue at the time of the delivery of the
product. Consideration for these performance obligations is collected within approximately three
months after the fulfillment of the performance obligations in accordance with separately
stipulated payment terms, and does not include material financial elements. Revenue is measured
by deducting discounts, etc., from the consideration promised in the contract with the customer.
5) Accounting policy for translating significant assets or liabilities denominated in foreign currencies into
Japanese currency
Foreign currency-denominated receivables and payables are converted to yen at the spot exchange
rate on the consolidated closing date and the translation adjustment is treated as a profit or loss.
Please note that assets and liabilities of overseas subsidiaries and others are converted into yen
based on the spot exchange rate on the day of consolidated closing date, and revenue and
expenses are converted into yen by using the average exchange rate during the fiscal year, while the
difference arising from the conversion is shown as foreign currency translation adjustment and noncontrolling interests.
6) Hedge accounting method
i) Hedge accounting method
Deferred hedge accounting is used for derivative transactions satisfying hedge accounting
requirements. However, appropriation accounting is applied to forward foreign exchange
contracts and currency swap transactions that satisfy requirements for appropriation accounting,
and special treatment is applied to the interest-rate swap transactions that meet the
requirements for special treatment.
ii) Hedging instruments and hedged items
Hedging instruments
Forward foreign exchange contracts, currency swap
transactions, and interest-rate swap transactions
Hedged items
Foreign currency denominated borrowings and foreign
currency denominated trade receivables and payables
iii) Hedging policy
To avoid foreign exchange fluctuation risk for receivables and payables denominated in foreign
currencies, the Group uses forward foreign exchange contracts and currency swap transactions.
To avoid interest-rate fluctuation risk for borrowings, the Group uses interest-rate swap
transactions.
It is our policy that these derivative transactions are carried out in accordance with its internal
rules which stipulate authorization and limitation amount of transactions, and used to avoid
foreign currency exchange and interest-rate fluctuation risks, and no speculative transactions are
allowed.
iv) Hedge effectiveness evaluation method
The effectiveness of hedges is evaluated by comparing the cumulative cash flow fluctuations of
hedged items or market fluctuations with cumulative cash flow fluctuations of the hedging
method or market fluctuations based on the changes of both.
Please note that this assessment is omitted for interest-rate swaps subject to special treatment.
7) Other significant matters that serve as the basis for the preparation of consolidated financial
statements
i) Accounting treatment for retirement benefits
A. The attribution of benefits to periods of service
For the calculation of projected benefit obligation, the Group adopts the plan’s benefit formula
for the attribution of benefits to the end the fiscal year under review.
B. Accounting method of actuarial gains and losses and past service costs
Past service costs are amortized using the straight-line method over a certain period (mainly, 14
years), which is within the average remaining service period of the employees, when they are
recognized.
Actuarial gains and losses will be amortized over a certain period (mainly, 14 years), which is
within the average remaining service period of the employees, using the straight-line method,
from the following fiscal year when the actuarial gains and losses is recognized.
ii) Method and period for amortization of goodwill
Straight-line method is applied for a period of 5 to 15 years.
iii) Application of the Group Totalization System
The Company and certain consolidated subsidiaries in Japan apply the group totalization system.
3. Notes relating to accounting estimates
Reasonable amounts for the accounting estimates have been calculated based on information available
when preparing the consolidated financial statements. Accordingly, within the amounts based on
accounting estimates and recorded in the consolidated financial statements for the fiscal year under
review, the following items pose risk of significantly affecting the consolidated financial statements for
the subsequent fiscal year.
(1) Impairment of non-current assets
- Amounts ascribed to Musashi Auto Parts (Zhongshan) Co., Ltd. non-current assets recorded in the
consolidated financial statements for the fiscal year under review.
Property, plant and equipment
Intangible assets.
Fiscal year ended March 31, 2026 (million yen)
9,048
0
- Information that contributes to understanding on the content of accounting estimates
i) Calculation method
Non-current assets of overseas subsidiaries are evaluated for whether or not there is any indication
showing that non-current assets may be impaired based on the International Financial Reporting
Standards. If there is any indication of impairment, impairment testing is performed. The Company
reduces the book value to the recoverable amount upon consequently determining the necessity of
recognizing an impairment loss after performing impairment testing, and accordingly recognizes that
amount of decrease as an impairment loss.
The recoverable amount is calculated as the value in use of property, plant and equipment, which is the
discounted present value of future cash flows during the expected period of the estimated remaining life
of use.
In the fiscal year under review, indications of impairment were identified on non-current assets at
Musashi Auto Parts (Zhongshan) Co., Ltd. due to a decline in operating income or loss as a result of a
decrease in orders received from customers in line with a change in the Chinese automobile market.
However, as the recoverable amount calculated based on the value in use exceeded the book value, no
impairment loss was recognized.
ii) Major assumptions
Future cash flows, which are used to calculate the value in use, are calculated based on future business
plans. The future business plans factor in major assumptions such as future net sales of products.
Assumptions for future net sales of products are based on unofficial information from customers and
premised on increasing volume of sales to Chinese customers. However, since the expected increase in
the sales volume of products in the Chinese automobile market whose environment changes rapidly
involves uncertainty, judgment on these assumptions significantly affects the estimate of future cash
flows.
In addition, in estimating the discount rate used to measure the value in use, to select the calculation
method and input data, a high level of expertise in evaluation is required.
iii) Effects on consolidated financial statements for the next fiscal year
If there is a change in the conditions on which the estimate was based or in the assumptions used due
to a significant change in the business environment in the following fiscal year, an impairment loss may
be recognized.
(2) Valuation of shares without market value
- Amounts ascribed to share that do not have a market value recorded in the consolidated financial
statement for the fiscal year under review
Investment securities:3,523 million yen
2)Information that contribute to understanding the content of accounting estimates
i) Calculation method
The Company records shares that do not have a market value at their acquisition cost on the balance
sheet, and reviews the possibility of recognizing impairment if such shares become subject to
significant decrease in actual value. Among these shares, as for shares that the Company acquired at a
price considerably higher than the net assets per share of the investee companies in anticipation of
their excess earnings power, such as investment in start-up companies, if the excess earnings power,
etc. has been impaired and the substantive value has declined significantly, an impairment loss will be
recognized.
ii) Major assumptions
Examination of whether or not excess earnings power, etc. has been impaired requires understanding
of the market environment to which the investee belongs and the status of product development, etc.
as well as judgment on the possibility of achieving the investee’s business plans. The business plans
factor in important assumptions such as an increase in net sales of the investee, and the achievement
of the business plans involves high uncertainty. In addition, judgment of whether or not the excess
earnings power, etc. for the shares has been impaired requires analysis of factors in the case where the
business plans differ from actual results, and accordingly involves significant judgment.
iii) Impact on the consolidated financial statements for the following consolidated fiscal year
For shares without a market price, we believe that the amount of impairment loss recognized in the
event of a significant decline in intrinsic value due to a deterioration in excess earning power, etc., is
likely to be significant.
4. Notes to the consolidated balance sheet
(1) Amount of accumulated depreciation for property, plant and equipment
328,257 million yen
Accumulated depreciation includes accumulated impairment loss.
(2) Provision for structural reform
The consolidated fiscal year under review
Early retirement lump-sum payments, legal fees associated with structural reforms in the European
segment, and other items have been recorded as provisions based on the expected amounts.
5. Notes to the consolidated statement of changes in net assets
(1) (Application of “Practical Solution on the Accounting for and Disclosure of Current Taxes Related to
the Global Minimum Tax Rules, etc.”)
The Group has applied Paragraph 7 of the “Practical Solution on the Accounting for and Disclosure of
Current Taxes Related to the Global Minimum Tax Rules, etc.” (ASBJ PITF No. 46, March 22, 2024) and
has not recognized corporate income taxes related to the international minimum tax for the fiscal year
under review.
(2) Provision for structural reform
Provisions and expenses based on the expected amounts of early retirement lump-sum payments, legal
fees associated with structural reforms in the European segment, and other items.
6. Notes to the Consolidated Statement of Changes in Shareholders' Equity
(1) Matters concerning total number of issued shares
Types of shares
Common shares
April 1, 2025
Increase
65,556
Decrease
25
(thousand shares)
March 31, 2026
–
65,581
Note: The breakdown of the increase in the number of common shares is as follows:
- Increase due to the insurance of new shares as share-based remuneration with transfer restrictions: 25 thousand shares
(2) Matters concerning number of treasury shares
Types of shares
Common shares
April 1, 2025
35,825
(shares)
Increase
Decrease
5,165
Note: The breakdown of the increase in the number of common shares is as follows:
March 31, 2026
–
40,990
(3) Matters concerning dividends of surplus
- Paid amount of dividends
i) Matters concerning dividends resolved at the 98th Annual Meeting of Shareholders held on June 26,
2025
- Total dividends
- Dividends per share
- Record date
- Effective date
1,638 million yen
25 yen
March 31, 2025
June 27, 2025
ⅱ) Matters concerning dividends based on the resolution of the Board of Directors held on November
10, 2025
- Total dividends
- Dividends per share
- Record date
- Effective date
1,638 million yen
25 yen
September 30, 2025
November 28, 2025
- Dividends whose record date falls within the current consolidated fiscal year but whose effective date
falls in the following fiscal year
The following matters will be proposed as follows at the 99th Annual Meeting of Shareholders to be
held on June 26, 2026.
- Total dividends
- Dividends per share
- Record date
- Effective date
- Source of dividends
983million yen
15 yen
March 31, 2026
June 29, 2026
Retained earnings
- Notes concerning financial instruments
(1) Matters concerning the conditions of financial instruments
The Group procures necessary capital through loans from banks and other financial institutions and
through bond issuances. Temporary surplus funds are managed only as short-term deposits.
Credit risk of customers in terms of notes and accounts receivable – trade are mitigated according to
the Sales Management Rules. Investment securities are mainly shares, and we quarterly monitor the
market prices of listed stock.
Borrowings are used as working capital and capital investment funds. Forward foreign exchange
contracts and currency swap contracts are used against the exchange fluctuation risk for foreigndenominated borrowings, and interest rate swap contracts are used against interest rate fluctuation
risk. Please note that derivative transactions are conducted only in the scope of actual demand
according to internal rules.
(2) Matters concerning fair values, etc. of financial instruments
Amounts on the consolidated balance sheet, fair values and their differences at March 31, 2026 are
as follows.
(Unit: million yen)
Consolidated
balance sheet
amount
Fair value
Difference
(1) Investment securities(*2)
6,274
6,274
-
Total assets
6,274
6,274
-
(2) Long-term loans payable (*4)
53,530
52,593
△937
Total liabilities
53530
52,593
△937
(*1) Notes have been omitted for “cash and bank deposits,” “notes and accounts receivable – trade,” “notes and accounts
payable – trade,” “short-term loans payable,” “accounts payable – other,” “accrued expenses,” and “income taxes payable,”
because the fair values approach the book values given their short-term settlement.
(*2) Shares that do not have a market value, etc. are not included in “(1) Investment securities.” Book values of the
financial instruments on the consolidated balance sheet are as follows.
Category
Fiscal year ended March 31, 2026 (million yen)
Unlisted equity securities, etc.
3,523
(*3) Among investments in capital recorded on the consolidated balance sheet at the end of the fiscal year under review,
investments in partnerships, etc., in which an amount equivalent to equity is recorded as a net amount, are not subject to
market value disclosure in accordance with the treatment stipulated in paragraph 24-16 of the “Implementation Guidance
on Accounting Standard for Fair Value Measurement” (ASBJ Guidance No. 31, June 17, 2021). In addition, the total amount
recorded on the consolidated balance sheet of the relevant financial instruments as of the end of the fiscal year under
review was 1,583 million yen.
(*4) Includes current portion of long-term loans.
(3) Matters regarding the breakdown of financial instruments by each fair value level
The fair values of financial instruments are categorized into the following three levels, in accordance with
the observability and materiality of the inputs used in the fair value measurement.
Level 1 fair value: Fair value is calculated using the market price of the asset or liability that forms in an
active market and is subject to such fair value measurement, among those observable
inputs subject to fair value measurement
Level 2 fair value: Fair value is calculated using inputs subject to fair value measurement other than Level
1 inputs, among those observable inputs subject to fair value measurement
Level 3 fair value: Fair value calculated using unobservable inputs subject to fair value measurement
(1) Financial instruments recorded in the consolidated balance sheet at fair value
Category
Investment securities
Available-for-sale
securities
Shares
Convertible bonds
Total assets
Fair value (million yen)
Level2
Level3
Level1
6,234
6,234
Total
40
40
6,234
40
6,274
(2) Financial instruments other than financial instruments recorded in the consolidated balance sheet at fair
value
Fair value (million yen)
Level2
Level3
Long-term loans payable
52,593
Total liabilities
52,593
Note1: Explanation of the valuation methods and inputs used in fair value measurement
Category
Level1
Total
52,593
52,593
Investment securities
Listed shares are valued using market price. Listed shares are categorized as Level 1 fair value because they
are traded on active markets.
Convertible bonds with stock acquisition rights are calculated using valuation techniques such as the
discounted cash flow method, and are classified as the Level 3 fair value.
Long-term loans payable
Long-term loans payable is categorized as Level 2 fair value, the fair value of which is calculated at the
present value equal to the total of capital and interests discounted by an interest rate reflecting the
remaining terms adjusted for credit risk.
Please note that, for loans requiring interest rate renewals at certain periods, their fair value is roughly
equal to book value, and therefore they are determined by the relevant book value.
Note 2: The note has been omitted due to the lack of significance of the information on the Level 3 fair value of the financial assets
and liabilities, which are recorded on the consolidated balance sheet at the fair value.
- Notes concerning revenue recognition
(1) Information on disaggregation of revenue arising from contracts with customers
(Unit: million yen)
Honda Motor Co., Ltd. and its
subsidiaries and associates
Global Customer
Revenue from contracts with
customers
Other revenues
Net sales to external
customers
Japan
America
Asia
China
Europe
Total
23,094
88,278
55,869
8,833
16
176,092
18,446
222,650
24,787
20,240
84,904
171,030
41,541
110,928
80,657
29,074
84,920
347,122
-
78
-
-
-
78
41,541
111,006
80,657
29,074
84,920
347,200
Note:Other income consists of lease income based on Corporate Accounting Standard No. 13, “Accounting Standard for Lease
Transactions.”
(2) Basic information for understanding revenue
Basic information for understanding revenue is stated in “2. Significant matters that serve as the basis for the
preparation of consolidated financial statements, (4) Matters regarding accounting policies, 4) Accounting policy
for revenue and expenses.”
(3) Information about the relationship between the satisfaction of performance obligations under contracts with
customers and cash flows from such contracts, and the amount and timing of revenue expected to be
recognized from contracts with customers that existed at the end of the fiscal year under review in the following
fiscal year and thereafter
- Balance of contract assets and contract liabilities, etc.
No items to report.
- Transaction price allocated to remaining performance obligations
Since the Group does not have any significant transactions with an expected contract period of more than one
year on an individual basis, we omit the description of information on remaining performance obligations.
Please note that there is no significant amount of consideration arising from a contract with a customer that is
not included in the transaction price.
- Per share information
(1) Net assets per share:
(2) Earnings per share:
1,861.88yen
19.29yen
- Notes concerning significant subsequent events
No items to report.
Non-consolidated Balance Sheet
(As of March 31, 2026)
Account title
Assets
Amount
149,831
Current assets
39,246
Account title
Liabilities
Current liabilities
Electronically recorded obligations –
operating
Accounts payable – trade
57,234
29,511
Cash and bank deposits
1,856
Accounts receivable – trade
10,481
Finished goods
1,130
Work in process
1,676
Raw materials and supplies
1,444
Short-term loans payable
Current portion of long-term loans
payable
Lease obligations
Short-term loans receivable
Current portion of long-term loans
receivable
25,750
Accounts payable – other
Prepaid expenses
Accounts receivable – other
Others
Allowance for doubtful accounts
Non-current assets
Property, plant and equipment
Buildings
Structures
Machinery and equipment
1,804
Accrued expenses
Income taxes payable
296
Deposits received
1,198
Provision for bonuses
643
1,267
4,811
16,150
38
102
2,665
673
240
1,291
△7,036
Provision for directors’ bonuses
51
110,584
Provision for product warranties
1
11,741
Allowance for loss on guarantees
200
3,242
Notes payable – facilities
110
Others
111
4,757
Vehicles
55
Tools, furniture and fixtures
483
Land
(Unit: million yen)
Amount
87,097
Non-current liabilities
Long-term loans payable
Long-term loans payable from
affiliates
Lease obligations
2,995
117
29,862
29,000
300
71
95
Deferred tax liabilities
338
Intangible assets
643
Long-term accounts payable – other
71
Goodwill
357
Asset retirement obligations
80
Construction in progress
Technology-related assets
60
Net assets
62,734
Software
217
Shareholders’ equity
59,932
7
Capital stock
5,675
Capital surplus
5,416
Others
Investments and other assets
Investment securities
Shares of subsidiaries and associates
Investments in capital
Long-term loans receivable from
subsidiaries and associates
Investments in capital of
subsidiaries and associates
Long-term prepaid expenses
Others
Allowance for doubtful accounts
98,200
2,152
Legal capital surplus
65,629
Retained earnings
1,593
12,560
18,439
124
94
Legal retained earnings
306
Other retained earnings
48,542
General reserve
23,500
Retained earnings brought forward
25,042
Treasury shares
△2,394
Valuation and translation adjustments
Valuation difference on available-forsale securities
Total assets
149,831
Total liabilities and net assets
Note: Figures are presented with amounts less than one million yen truncated.
5,416
48,849
△8
2,801
2,801
149,831
Non-consolidated Statement of Income
(April 1, 2025 - March 31, 2026)
(Unit: million yen)
Account title
Amount
Net sales
58,677
Cost of sales
44,319
Gross profit
14,358
Selling, general and administrative expenses
9,331
Operating income
5,027
Non-operating income
17,321
Interest income
690
Dividend income
14,330
Foreign exchange gains
1,413
Gain on valuation of investment securities
7
Gain on sale of investment securities
3
Others
875
Non-operating expenses
4,731
Interest expenses
715
Loss on valuation of investment securities
97
Provision for doubtful accounts
3,710
Taxes and dues
140
Others
67
Ordinary income
17,616
Extraordinary income
1
Gain on sales of non-current assets
1
Extraordinary loss
3,941
Loss on retirement of non-current assets
16
Loss on valuation of investment securities
3,924
Profit before income taxes
13,676
Income taxes – current
3,234
Income taxes – deferred
△30
Profit
10,473
Note: Figures are presented with amounts less than one million yen truncated.
Non-consolidated Statement of Changes in Net Assets
(April 1, 2025 - March 31, 2026)
(Unit: million yen)
Shareholders’ equity
Capital
surplus
Capital
stock
Balance at April 1, 2025
5,639
Retained earnings
Legal
capital
surplus
Legal
retained
earnings
5,380
306
Other retained
earnings
Total
Retained
retained
General earnings
earnings
reserve brought
forward
23,500
17,846 41,652
Treasur
y
shares
Total
sharehold
ers’ equity
△8
52,664
-
Changes of items during period
Share issuance
35
35
71
Dividends of surplus
Profit
Net changes of items other than
shareholders’ equity
Total changes of items during period
Balance at March 31, 2026
Balance at April 1, 2025
△3,276
△3,276
△3,276
10,473
10,473
10,473
-
35
35
-
-
7,196
7,196
-
7,268
5,675
5,416
306
23,500
25,042
48,849
△8
59,932
Valuation and translation adjustments
Valuation difference on
Total valuation and
available-for-sale
translation adjustments
securities
3,054
3,054
Total net assets
55,718
-
Changes of items during period
Share issuance
71
△3,276
Dividends of surplus
Profit
Net changes of items other than
shareholders’ equity
Total changes of items during period
10,473
△252
△252
△252
△252
△252
7,015
Balance at March 31, 2026
2,801
2801
62,734
Note: Figures are presented with amounts less than one million yen truncated.
Notes to Non-consolidated Financial Statements
- Notes relating to the assumptions of the going concern
No items to report
- Matters pertaining to significant accounting policies
(1) Valuation basis and method for securities
- Shares of subsidiaries and associates
Stated at cost using the moving average method
- Available-for-sale securities
- Securities with market value
Market value method based on the market price as of the accounts settlement date (the full
amount of the valuation difference is charged to net assets using the direct transfer to capital
method, with the disposal cost determined by the moving average method)
- Securities without market value
Stated at cost using the moving average method
(2) Valuation basis and method for derivative transactions
Market value method
(3) Valuation basis and method for inventories
- Finished goods, work in process and raw materials
Cost using the moving average method (figures on the balance sheet are adjusted by writing down
the book value where the profitability declines)
However, machinery purchased for sale and in-house manufactured machinery are recorded at cost
using the individual method
- Supplies of metal molds
Stated at cost using the individual method
- Other supplies
Stated at cost using the final purchase cost method
(4) Depreciation method for non-current assets
- Property, plant and equipment (excluding leased assets)
Straight-line method
Please note that the main useful lives are as follows.
Buildings
31 to 47 years
Machinery and equipment
9 years
- Intangible assets (excluding leased assets)
i) Software for internal use
The straight-line method is applied based on the expected usable period within the Company (5
years).
ii) Other intangible assets
Straight-line method
- Leased assets
Leased assets in non-ownership-transfer finance lease transactions
Depreciation is calculated on the straight-line method over the lease term as the useful life with no
residual value.
(5) Accounting policy for provisions
- Allowance for doubtful accounts
To provide for losses due to bad debt, the Company reserves an estimated bad debt allowance on
ordinary receivables based on historical bad debt ratios and on highly doubtful receivables and
other specified debt based on the recoverability from individual receivables.
- Provision for bonuses
To provide for the future payment of employee bonuses, the Company reports the anticipated
amount of bonus payments.
- Provision for directors’ bonuses
To provide for the future payment of directors’ bonuses, the Company reports the anticipated
amount of bonus payments.
- Provision for product warranties
To provide for product warranty expenses, the Company reports the anticipated amount of
warranty expenses.
- Allowance for loss on guarantees
In order to prepare for losses on guarantees, we take into account the financial position, etc. of the
guaranteed party on an individual basis and record the estimated amount of loss to be borne.
(6) Basis for conversion of assets and liabilities denominated in foreign currencies into Japanese currency
Foreign currency-denominated assets and liabilities are converted to yen at the spot exchange rate
on the closing date and the translation adjustment is treated as a profit or loss.
(7) Accounting policy for revenue and expenses
The Group recognizes revenue based on the following five step approach.
Step 1: Identify contract(s) with customer
Step 2: Identify the performance obligations in the contract(s)
Step 3: Determine the transaction price
Step 4: Allocate the transaction price to the performance obligations in the contract(s)
Step 5: Recognize revenue when (or as) the entity satisfies a performance obligation
The Group primarily manufactures and sells automotive parts. Since the performance obligation is
mainly identified as the delivery of the finished product to the customer, and control over the
product is transferred to the customer at the time of delivery of the product, it is thus judged that
the performance obligation is satisfied. We recognize revenue at the time of the delivery of the
product. Consideration for these performance obligations is collected within approximately three
months after the fulfillment of the performance obligations in accordance with separately stipulated
payment terms, and does not include material financial elements. Revenue is measured by deducting
discounts, etc., from the consideration promised in the contract with the customer.
(8) Hedge accounting method
- Hedge accounting method
Deferred hedge accounting is used for derivative transactions satisfying hedge accounting
requirements. However, appropriation accounting is applied to forward foreign exchange contracts
and currency swap transactions that satisfy requirements for appropriation accounting, and special
treatment is applied to the interest-rate swap transactions that meet the requirements for special
treatment.
- Hedging instruments and hedged items
Hedging instruments
Forward foreign exchange contracts, currency swap
transactions and interest-rate swap transactions
Hedged items
Foreign currency denominated borrowings and foreign
currency denominated trade receivables and payables
- Hedging policy
To avoid foreign exchange fluctuation risk for receivables and payables denominated in foreign
currencies, the Company uses forward foreign exchange contracts and currency swap transactions.
To avoid interest-rate fluctuation risk for borrowings, the Company uses interest-rate swap
transactions. It is our policy that these derivative transactions are carried out in accordance with its
internal rules which stipulate authorization and limitation amount of transactions, and used to
avoid foreign currency exchange and interest-rate fluctuation risks, and no speculative transactions
are allowed.
- Hedge effectiveness evaluation method
The effectiveness of hedges is evaluated by comparing the cumulative cash flow fluctuations of
hedged items or market fluctuations with cumulative cash flow fluctuations of the hedging method
or market fluctuations based on the changes of both.
Please note that this assessment is omitted for interest-rate swaps subject to special treatment.
(9) Other significant matters that serve as the basis for the preparation of financial statements
- Method and period for amortization of goodwill
Straight-line method is applied for a period of 5 years.
- Notes relating to significant accounting estimates
(1) Valuation of shares without market value
- Amount recorded in the consolidated financial statements for the fiscal year under review
Investment securities: 2,090 million yen
- Information that contributes to understanding on the content of accounting estimates
The information is the same as the content of “4. Notes relating to accounting estimates, (2) Valuation
of shares without market value, 2) Information that contributes to understanding the content of
accounting estimates” in the notes to the consolidated financial statements.
- Notes to the non-consolidated balance sheet
(1) Claims and obligations with respect to subsidiaries and associates
Short-term cash credit
36,500 million yen
Long-term cash credit
12,585 million yen
Short-term cash debt
15,997 million yen
Long-term cash debt
300 million yen
(2) Amount of accumulated depreciation for property, plant and equipment
44,041 million yen
(3) Contingent liabilities
Guarantee obligations
The following guarantees are made with respect to loans from financial institutions of subsidiaries and
associates
(Unit: million yen)
Company name
Guarantee balance
Musashi Europe GmbH
31,551
Musashi Energy Solutions Co., Ltd.
3,000
Musashi Auto Parts (Zhongshan) Co., Ltd.
261
Musashi da Amazonia Ltda.
20
Total
34,832
- Notes to the non-consolidated statement of income
Transactions with subsidiaries and associates
Net sales
Purchases
Transactions other than operational transactions
45,980 million yen
19,047 million yen
15,788 million yen
(shares)
- Notes to the non-consolidated statement of changes in net assets
Matters concerning number of treasury shares
Types of shares
Common shares
April 1, 2025
35,825
Increase
Decrease
5,165
March 31, 2026
–
40,990
Notes: The breakdown of the increase in the number of common shares is as follows:
- Increase due to expiration of restricted stock incentive: 5,165 shares
- Notes concerning tax effect accounting
(1) Breakdown of major causes for the occurrence of deferred tax assets and deferred tax liabilities
(Unit: million yen)
Deferred tax assets
Payable for enterprise tax refund
86
Provision for bonuses
339
Provision for directors' bonuses
16
Accrued social security premiums
67
Inventories, etc.
245