2026年3月期期末 決算説明資料 Fiscal Year Ending March , 2026 Financial Results 2026年5月15日 「エフテック」で検索 https://www.ftech.co.jp Copyright(c) 2026 F-TECH INC. All Rights Reserved 株式会社エフテック 証券コード:7212 1 アウトライン Outline…
2026年3月期期末
決算説明資料
Fiscal Year Ending March , 2026
Financial Results
2026年5月15日
「エフテック」で検索
https://www.ftech.co.jp
Copyright(c) 2026 F-TECH INC. All Rights Reserved
株式会社エフテック
証券コード:7212
1
アウトライン Outline
1 決算概要
Financial Summary
2 業績予想
Earnings Forecast
3 15次中計総括
15 th Mid-Term Business
Plan Summary
4 16次中計概要
16 th Mid-Term Business
Plan Summary
Copyright(c) 2026 F-TECH INC. All Rights Reserved
2
アウトライン Outline
1 決算概要
Financial Summary
2 業績予想
Earnings Forecast
3 15次中計総括
15 th Mid-Term Business
Plan Summary
4 16次中計概要
16 th Mid-Term Business
Plan Summary
Copyright(c) 2026 F-TECH INC. All Rights Reserved
3
Consolidated Financial Results Overview(Year-over-Year)
(Unit: Million yen)
FY Mar.2025 Actual
FY Mar.2026 Actual
Change
Sales
Operating profit
Ordinary profit
300,831
5,481
3,047
100.0%
1.8%
1.0%
291,866
8,405
7,495
100.0%
2.9%
2.6%
▲8,965
2,924
4,448
▲3.0%
53.3%
146.0%
Net income attributable to
parent company
shareholders
▲6,925
▲2.3%
4,726
1.6%
11,651
-
Earnings per share(YEN)
▲372.97
-
254.50
-
627.47
-
FY Mar.2025 Actual
1US$
1CAN$
1CNY¥
152.61 Yen
109.36 Yen
21.131 Yen
FY Mar.2026 Actual
Change
151.10 Yen
109.45 Yen
20.876 Yen
▲1.51 Yen
0.09 Yen
▲0.255 Yen
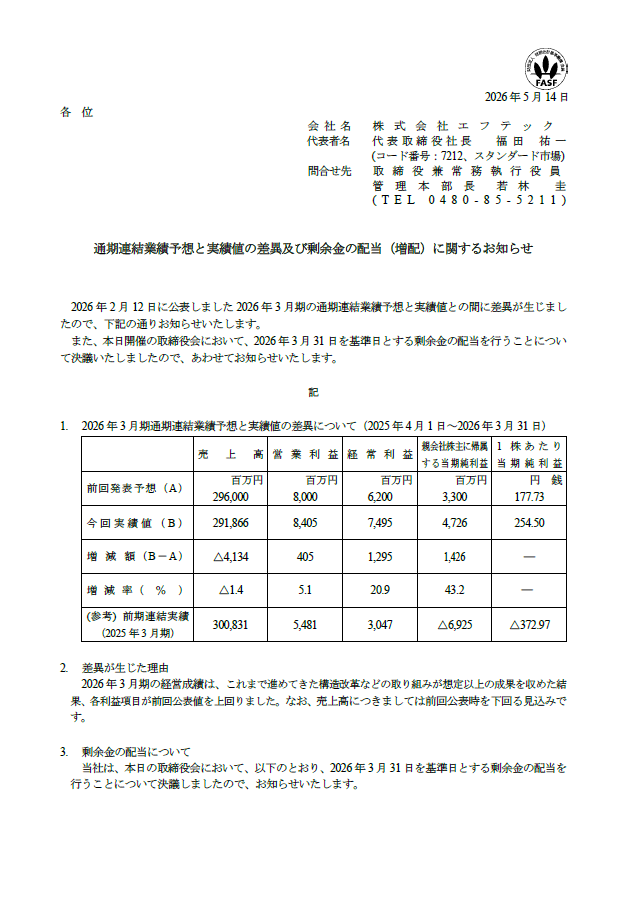
Lower Sales, Higher Profit; Profit Increase Driven by Structural Reforms in China
Copyright(c) 2026 F-TECH INC. All Rights Reserved
4
Consolidated Sales(Year-over-Year)
(Unit:Million Yen)
400,000
300,000
200,000
100,000
0
Consolidated Sales by Segment
300,831
291,866
Japan, 30,100
Japan, 29,453
Sales Share(%)
Japan, 10.0%
Japan, 10.1%
North
North
North
North
America,
America,
America,
America,
75.2%
76.3%
226,241
222,616
Asia, 44,489
Asia, 39,797
Asia, 14.8%
Asia, 13.6%
FY Mar.2025 Actual
FY Mar.2026 Actual
FY Mar.2025 Actual
FY Mar.2026 Actual
FY Mar.2025
FY Mar.2026
Change
Change(%)
Japan
30,100
29,453
▲647
▲2.2%
North
America
226,241
222,616
▲3,625
Asia
44,489
39,797
Consolidated
300,831
291,866
FX Impact
(Unit:%)
(Japan)
0.1% Increase
(North America)
1.1% Increase
(ASIA)
1.2% Decrease
Real Change
Change(%)
ー
▲647
▲2.2%
▲1.6%
▲1,703
▲1,922
▲0.8%
▲4,692
▲10.5%
▲232
▲4,460
▲10.0%
▲8,965
▲3.0%
▲1,935
▲7,030
▲2.3%
Sales decreased due to semiconductor supply shortages in North America and production cuts in China.
Copyright(c) 2026 F-TECH INC. All Rights Reserved
5
Consolidated Operating Profit by Segment( Year-over-Year )
(Unit:Million yen)
FY
FY
Mar.2025 Mar.2026
Actual
Actual
Change
Amount
FX
Impact
Change
(%)
Real Change
Amount
Change
(%)
Japan
▲1,093
618
1,712
ー
ー
1,712
ー
North
America
8,024
5,938
▲2,086
▲26.0%
▲81
▲2,005
▲26.0%
Asia
▲1,609
1,665
3,275
ー
0
3,275
ー
Total
5,321
8,222
2,901
54.5%
▲81
2,982
54.5%
Adjustment
160
183
22
14.2%
ー
22
13.8%
Consolidated
5,481
8,405
2,924
53.3%
▲81
3,005
53.3%
All segments achieved profitability.
Copyright(c) 2026 F-TECH INC. All Rights Reserved
6
Segment Consolidated Operating Performance (Japan)
(Unit:Million yen)
Sales
30,100
29,453
Mar.2025
Mar.2026
Change
▲647
Change %
▲2.2%
FX Impact
ー
Real
Change
▲647
Real
Change %
▲2.2%
Operating Profit
▲1,093
Decline in product sales
2
1,712
Change %
-
FX Impact
-
Real
Change
Mar.2025
1,712
Real
Change %
Mar.2026
-
Reasons for Change
Reasons for Change
1
618
Change
▲2,392
1
Impact of decline in product sales
Increase in Machinery & Tools sales (sales of die &
mold equipment to group companies)
2,007
2
Impact of increase in Machinery & Tools sales
3
Impact of increase in technology income
1,047
3
Increase in technology income (royalties,
development fees, etc.)
1,095
4
Impact of decline in domestic subsidiary sales
▲53
4
Decline in domestic subsidiary sales
▲502
5
Decrease in SG&A expenses
740
5
Consolidation adjustments
▲855
Total
1,712
Total
7,440 7,158
7,873 7,501
Mar.2025
Mar.2026
7,872 7,991
2Q
3Q
4Q
Mar.2025
Mar.2026
Quarterly Trend
130
62
▲ 215
1Q
377
▲647
Quarterly Trend
6,915 6,801
▲399
1Q
673
12
▲ 423
2Q
32
▲ 745
3Q
4Q
Profit increased despite lower product sales, supported by higher tooling and royalty sales
to overseas group companies and reduced SG&A expenses.
Copyright(c) 2026 F-TECH INC. All Rights Reserved
7
Segment Consolidated Operating Performance (North America)
Sales
226,241
222,616
Mar.2025
Mar.2026
Change
▲3,625
Change %
▲1.6%
FX Impact
▲1,703
Real Change
▲1,922
Real
Change %
▲0.8%
Operating Profit
8,024
5,938
Mar.2025
Mar.2026
Reasons for Change
Changes in product sales
2
Changes in Machinery & Tools sales
3
FX impact (USD/JPY appreciation: 152.61 →
151.10)
▲6,116
4,194
Total
2Q
Change %
▲26.0%
FX Impact
▲81
Real
Change
▲2,005
Real
Change %
▲26.0%
▲1,703
Impact of changes in product sales
2
Impact of changes in Machinery & Tools sales
3
Cost reduction
514
4
FX Impact
▲81
57,600 49,850
3Q
▲3,706
1,187
Total
Mar.2025
Mar.2026
▲2,086
Mar.2025
Mar.2026
Quarterly Trend
4,596
59,588 63,186
1,780
▲ 14
1Q
▲2,086
1
▲3,625
Quarterly Trend
53,142 56,160
Change
Reasons for Change
1
55,910 53,418
(Unit:Million yen)
980
3,768
1,383
1,795
▲ 325
4Q
Significant decrease in profit due to production cuts caused by semiconductor shortages
Copyright(c) 2026 F-TECH INC. All Rights Reserved
8
Segment Consolidated Operating Performance (Asia)
Sales
39,797
44,489
Mar.2025
Mar.2026
Change
▲4,692
Change %
▲10.5%
FX Impact
▲1,609
FX Impact
0
Real
Change
▲4,460
Real
Change
Real
Change %
▲10.0%
Mar.2025
2
Change in Asia Segment
▲221
3
FX Impact
▲232
Total
Real
Change %
Mar.2026
1
Impact of lower product sales in China
2
Impact of changes in product sales and machinery &
tools sales in Asia
3
Impact of structural reforms in China
4
FX Impact
-
3,033
3,275
Mar.2025
Mar.2026
Quarterly Trend
11,666 11,644
1,049
417
228
▲ 62
▲ 718
3Q
943
Total
Mar.2025
Mar.2026
10,421 9,597
▲701
0
▲4,692
Quarterly Trend
2Q
3,275
Reasons for Change
▲4,238
1Q
3,275
▲232
Change in China Segment
10,490 9,184
Change
-
1
9,369
(Unit:Million yen)
Change %
Reasons for Change
11,911
Operating Profit
1,665
▲ 28
▲ 684
▲ 146
4Q
In China, profit increased despite continued decline in production volume, due to the effects of structural
reforms implemented in the previous fiscal year. The Asia region also showed improvement.
Copyright(c) 2026 F-TECH INC. All Rights Reserved
9
アウトライン Outline
1 決算概要
Financial Summary
2 業績予想
Earnings Forecast
3 15次中計総括
15 th Mid-Term Business
Plan Summary
4 16次中計概要
16 th Mid-Term Business
Plan Summary
Copyright(c) 2026 F-TECH INC. All Rights Reserved
10
Consolidated Sales Forecast ( Year-over-Year )
(Unit:Million yen)
FY Mar.2026 Actual
Sales
Operating
profit
Ordinary profit
Net income attributable
to parent company
shareholders
Earnings per
share(YEN)
1US$
1CAN$
1CNY¥
FY Mar.2027 Forecast
Change
291,866
100.0%
288,000
100.0%
8,405
2.9%
5,500
1.9%
▲2,905 ▲34.6%
7,495
2.6%
4,100
1.4%
▲3,395 ▲45.3%
4,726
1.6%
800
0.3%
▲3,926 ▲83.1%
254.50
-
43.07
-
▲211.43 ▲83.1%
FY Mar.2026 Actual
151.10 Yen
109.45 Yen
20.876 Yen
FY Mar.2027 Forecast
150.00 Yen
110.00 Yen
21.000 Yen
▲3,866
▲1.3%
Change
▲1.10 Yen
0.55 Yen
0.124 Yen
The decline in sales and profit was attributable to the suspension of BEV projects by the
major customer.
Copyright(c) 2026 F-TECH INC. All Rights Reserved
11
Consolidated Sales Forecast (Compared to 2026 Actual)
(Unit:Million Yen)
(Unit:Million Yen)
Sales Share(%)
Consolidated Sale by Segment (AMT)
350,000
Japan 10.1%
Japan 10.2%
(Japan)
0.1% Increase
North
North America
North America
America
America
76.3%
78.9%
(North America)
2.6% Increase
222,616
227,309
Asia 39,797
Asia 31,471
Asia 13.6%
Asia 10.9%
Mar.2026
Mar.2027
Mar.2026
Mar.2027
291,866
288,000
Japan 29,453
Japan 29,220
200,000
North
150,000
100,000
300,000
250,000
50,000
0
Changes
in
Consolidated Sales
March.2026
Japan
North
America
Asia
Consolidat
ed
March.2027
Change
Change(%)
FX Impact
(Asia)
2.7% Decrease
Real Change
Change(%)
29,453
29,220
▲233
▲0.8%
-
▲233
▲0.8%
222,616
227,308
4,692
2.1%
▲320
5,012
2.3%
39,797
31,471
▲8,326
▲20.9%
303
▲8,629
▲21.7%
291,866
288,000
▲3,866
▲1.3%
▲17
▲3,849
▲1.3%
Sales increased in North America, while Asia saw a significant decline.
Copyright(c) 2026 F-TECH INC. All Rights Reserved
12
Consolidated Operating Profit Forecast by Segment ( Compared to 2026 Actual)
(Unit:Million yen)
Mar.2026 Mar.2027
Actual
Change
Forecast
Amount
Change
(%)
FX
Impact
Real Change
Amount
Change
(%)
Japan
618
509
▲109
▲17.6%
-
▲109
▲17.6%
North
America
5,938
4,818
▲1,120
▲18.9%
3
▲1,123
▲18.9%
Asia
1,665
76
▲1,589
▲95.4%
5
▲1,594
▲95.4%
Total
8,222
5,404
▲2,818
▲34.3%
8
▲2,826
▲34.3%
Adjustment
183
97
▲86
▲47.0%
-
▲86
▲47.0%
Consolidated
8,405
5,500
▲2,904
▲34.6%
8
▲2,913
▲34.6%
North America recorded lower profit due to BEV production cuts, while Asia declined due to
13
production cuts by major customers.
Copyright(c) 2026 F-TECH INC. All Rights Reserved
Sales Changes by Customer
(Unit:Million yen)
100.0%
90.0%
80.0%
70.0%
7.0%
3.4%
10.9%
9.1%
9.3%
8.9%
9.4%
8.3%
4.5%
5.4%
7.2%
7.2%
7.4%
9.3%
7.9%
7.9%
6.5%
9.6%
8.4%
8.1%
9.3%
5.6%
7.5%
9.4%
60.0%
Others
R(EV)
YAMAHA
S
50.0%
40.0%
30.0%
TOYOTA
71.9%
66.8%
66.2%
64.3%
63.2%
60.4%
GM
20.0%
Te
10.0%
Honda
0.0%
Mar.2022
Mar.2023
Mar.2024
Mar.2025
Mar.2026
Mar.2027 Forecast
March.2022
March.2023
March.2024
March.2025
March.2026
128,269
157,846
182,244
190,166
187,720
190,581
Te
14,317
24,549
28,590
28,778
24,473
23,421
GM
17,791
29,900
29,954
24,280
22,935
18,722
TOYOTA
8,563
14,033
21,440
21,531
20,994
21,410
S
4,002
7,369
8,097
4,956
5,373
6,586
18
1,607
1,768
1,972
2,163
2,591
R(EV)
1,526
1,500
808
2,523
669
878
Others
17,406
24,351
25,860
26,626
27,540
23,811
191,892
Copyright(c) 2026 F-TECH INC. All Rights
Reserved
261,156
298,759
300,832
291,866
288,000
Honda
YAMAHA
March.2027 Forecast
14
Financial Position
250,000
Total Asset
Capital Investment
Interes-Bearing Ebt
Interest Bearing Debt Ratio
Depreciation
50.0%
200,000
40.0%
150,000
30.0%
100,000
20.0%
50,000
10.0%
0
Mar.2022
Mar.2023
Mar.2024
Mar.2025
Mar.2026
Mar.2027
Forecast
Total Asset
160,931
176,137
191,772
177,555
182,636
179,502
Capital Investment
16,651
16,907
7,629
9,329
11,306
10,917
Depreciation
10,581
13,112
14,559
14,920
12,789
10,286
Interes-Bearing Ebt
64,867
73,925
76,064
72,592
68,954
66,229
Interest Bearing Debt Ratio
40.3%
42.0%
39.7%
40.9%
37.8%
36.9%
Copyright(c) 2026 F-TECH INC. All Rights Reserved
0.0%
15
Status of Dividend
¥30.00
Dividend(yen)
¥25.00
¥20.00
¥20.00
¥5.00
¥20.00
4Q
¥20.00
4Q, ¥14.00
¥15.00
¥10.00
¥20.00
¥24.00
2Q
4Q, ¥10.00
4Q, ¥10.00
4Q, ¥10.00
4Q, ¥10.00
4Q, ¥10.00
2Q, ¥10.00
2Q, ¥10.00
2Q, ¥10.00
2Q, ¥10.00
2Q, ¥10.00
Mar.2022
Mar.2023
Mar.2024
Mar.2025
Mar.2026
Mar.2027
¥10.00
¥0.00
Dividend
Policy
F.tech’s basic policy on profit distribution is to return profits to shareholders in line with business performance.
We place significant emphasis on shareholder returns while strengthening our financial position, and aim to provide
returns from a long-term perspective, taking into account earnings performance and future business development.
Based on this policy, and in light of the upward revision to our full-year earnings forecast for the fiscal year ending
March 2026, we have revised the year-end dividend per share upward by JPY 4 to JPY 14.
Copyright(c) 2026 F-TECH INC. All Rights Reserved
16
アウトライン Outline
1 決算概要
Financial Summary
2 業績予想
Earnings Forecast
3 15次中計総括
15 th Mid-Term Business
Plan Summary
4 16次中計概要
16 th Mid-Term Business
Plan Summary
Copyright(c) 2026 F-TECH INC. All Rights Reserved
17
The 15th Mid-Term business plan(2023/4-2026/3) ~Overview/KPIs~
KPIs for the 15th Mid-term Plan
Key
Figures
FY
2023/3
FY
2024/3
FY
2025/3
2,870
2,980
3,000
56
70
80
Operating
profit ratio
2.0%
2.3%
2.7%
Net Debt
/ EBITDA
3.6x
or less
3.2x
or less
3.1x
or less
EPS
80 yen
or more
100 yen
or more
175 yen
or more
( billions of
yen)
Sales
Operating profit
Copyright(c) 2026 F-TECH INC. All Rights Reserved
18
Progress of the 15th Medium-Term Business Plan (2023/4-2026/3)
Achieve the targets of the 15th Medium-Term Business Plan through structural
and operational reforms and various improvement initiatives in line with the
production volumes of major customers.
FY ended Mar. 2023
Actual Results
Sales
Operating profit
Operating profit ratio
Copyright(c) 2026 F-TECH INC. All Rights Reserved
Final-Year Target
Actual Results
261.1 billion yen
300 billion yen
291.8 billion yen
2 billion yen
8 billion yen
8.4 billion yen
0.7%
2.7%
2.9%
3.1x or less
2.37x
175 yen or more
254.50 yen
Net Debt / EBITDA
EPS
FY ended Mar. 2026
93 yen
19
Performance Trends of the 15th Medium-Term Business Plan(2023/4-2026/3)
Net Sales (JPY 100 million)
60
3000
20
291.8
billion
yen
1000
FY2023/3
FY2024/3
FY2025/3
-20
-40
-60
-80
FY2026/3
Posted Record60 High Profit level
3
80
40
20
FY2023/3
FY2024/3
FY2025/3
2.5
2
8.4
1.5
billion 1
yen 0.5
FY2026/3
Period of the 15th MediumTerm Business Plan
Copyright(c) 2026 F-TECH INC. All Rights Reserved
billion
yen
0
Operating Profit (JPY 100 million) / Operating Profit Ratio
0
4.7
40
2000
0
Profit Attributable to Owners of Parent (JPY 100 million)
0
Impairment of Fixed
Assets in China
FY2023/3
FY2024/3
FY2025/3
FY2026/3
EPS (yen)
300
200
100
0
254.50
yen
-100
-200
-300
-400
-500
FY2023/3
FY2024/3
FY2025/3
FY2026/3
Period of the 15th MediumTerm Business Plan
20
Key Initiatives of the 15th Medium-Term Business Plan (2023/4-2026/3)
~Back to Basics~
Main Activities
Actual Results
・Dispatched expert personnel to other Group sites to provide
・Organize and run councils
to address issues
・Enhance the strengths of our own
Enhance Earning Power
locations/departments, and
provide improvement support
across various areas at locations
facing challenges
(press, welding, painting, assembly)
improvement support
(About 100 personnel dispatched over three years;
average annual improvements of ¥500 million)
・Achieved the full-year operating profit target(Actual: ¥8.4 billion)
・Contributed to talent exchange across sites
※FY2025 FX rate:
¥151.1/USD
・Cross-border personnel exchanges
between locations
Create a fulfilling work environment
・Human Capital Enhancement
・Launch a working team aimed at
promoting women’s empowerment
and improving employee well
-being
・Expand the number of departments
adopting the flextime system
Copyright(c) 2026 F-TECH INC. All Rights Reserved
・Established the Human Capital Development Section
・Established the talent development vision and policy
・Implemented various initiatives led by the working team
(Improved workplace environment, internal systems,
and held seminars by internal and external executives)
・Introduced a flextime system for the production division
21
15th Mid-term business plan(2023/4~2026/3)Main initiatives ~Back to Basics~
Main initiatives
Achievements
・Return on Investment
Revenue from the Mexico
Plant in FY2025
in the 14 th-Mid Plan
(Invested by US$100Mil to
Mexico Plant in FY2022th )
Improving Financial Health
※FX Rate
2022 FY:1US$=¥136
2025 FY:1US$=¥151.1
Compared to FY2022
・ Revenue increased by
14 billion yen
・ Operating profit up by
3 billion yen
2,000
1,500
Reduction of
Int. Bearing
Debt
1,000
500
0
・Restraint on
investment
・Strengthening the
Financial Monitoring
System
Copyright(c) 2026 F-TECH INC. All Rights Reserved
15 th-Mid Term Business Plan
14 th-Mid
2023 March
2024 March
2025 March
2026 March
Total Asset
1,761
1,917
1,775
1,826
Capital Investment
169
76
93
113
Depreciation
131
145
149
127
total depreciation expenses
(7.6 to 11.3 billion yen/ear)
Int.Bearing Debt
739
760
725
689
・Operating Profit Target
5
Investment amount will
be kept within the Group’s
Achieved (8.4 billion yen)
・Net Debt/EBITDA
Total Asset
Capital Investment
Depreciation
◆Net Debt/EBITDA RATIO
Int.Bearing Debt
Actual
4
3
Target achieved (2.37times)
2
*Net Debt/EBITDA Ratio= (Interestbearing debt - Cash )÷ (Operating
income + Depreciation and amortization)
1
15Mid-Plan
5
3.1
4
2.37
0
3
2
1
0
2023 March
2024 March
2025 March
2026 March
22
15th Mid-term business plan(2023/4~2026/3)Main initiatives ~Challenge for New~
Main initiatives
Pursuing strategic growth opportunities
・Meeting Customer Needs
・Sales efforts targeting local
automakers
Challenging New Fields
・Development of a Trailer House
Achievements
・Establishment of a New Sales Office in Anjo City, Aichi Prefecture (Aiming to Strengthen
Sales Operations in the Tokai and Kansai Regions and Expand Order Volume)
・ We secured orders for two models from a new Chinese manufacturer, as well as orders
from other domestic and international sources.
・Development has begun following certification under Saitama
Prefecture’s “Circular Design Leading Model Development
Support Grant”
Equipped with Repurposed Batteries
・ Prototype completed in
・Improving Development Efficiency
Through Global R&D Collaboration
Successfully secured early entry into the development sector for
three Japanese automakers (three companies, three models)
・Development and Implementation
of F-Tech's Original Non-Destructive
Inspection Equipment for Welded
Joints
※LCA:ライフサイクルアセスメント
Copyright(c) 2026 F-TECH INC. All Rights Reserved
February 2026
U.S. Operations
Automation of NonDestructive Testing
Kuki Office
Non-destructive testing equipment
currently undergoing trial operation
23
New orders and Production started
Expanding Value Through Strategic Sales Activities
in the 15th Mid-Term Plan (2023/4– 2026/3)
Orders for new models are expected to contribute to
an increase in sales of approximately 32 billion yen
JAPAN
22models
11models
Copyright(c) 2026 F-TECH INC. All Rights Reserved
North
AMERICA
7models
15models
ASIA
16models
21models
*New Orders in the RED
Start of Production in the BLUE
24
15th Mid-term business plan(2023/4~2026/3)Main initiatives ~Challenge for New~
Main initiatives
Building a Sustainable Business Model
・Establish the Sustainability Promotion Department
・Establish the Sustainability Committee
・Identifying Materialities
・Development of a Sustainability Roadmap
・Publication of the Integrated Report
Achievements
Sustainability Roadmap
Integrated Report
Identifying Materialities
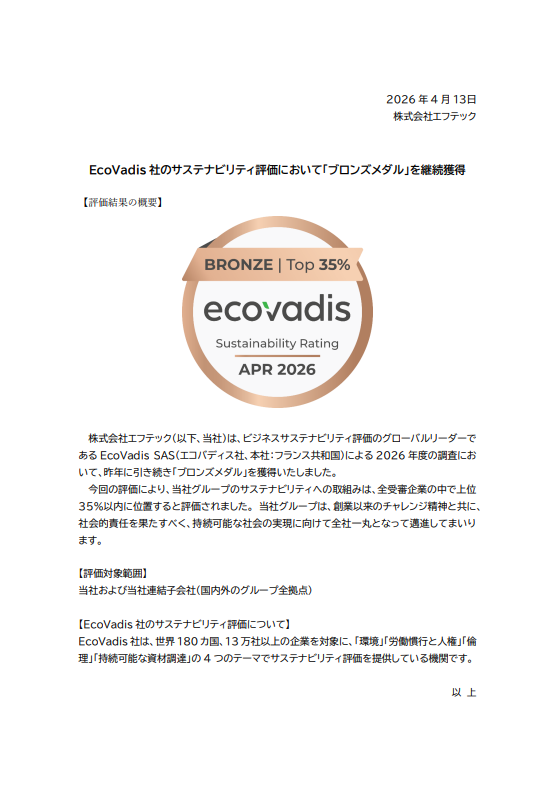
EcoVadis
For the second consecutive year,
following 2025 Bronze Medal
( Ranked in the top 35% of approximately 150,000
companies worldwide )
・Third-party evaluation
CDP
Climate Change
For the third consecutive year,
following 2023 Grade B
Saitama Prefecture
Registration
as an “SDGs Partner”
・Promoting Carbon Neutrality
Copyright(c) 2026 F-TECH INC. All Rights Reserved
・ Installation of Solar Panels at Factories
in Kameyama City, Mie Prefecture; China; and Thailand
・ Implementation of Energy Visualization in Manufacturing Processes
25
Promoting Carbon Neutrality
For A SUSTAINABLE FUTURE
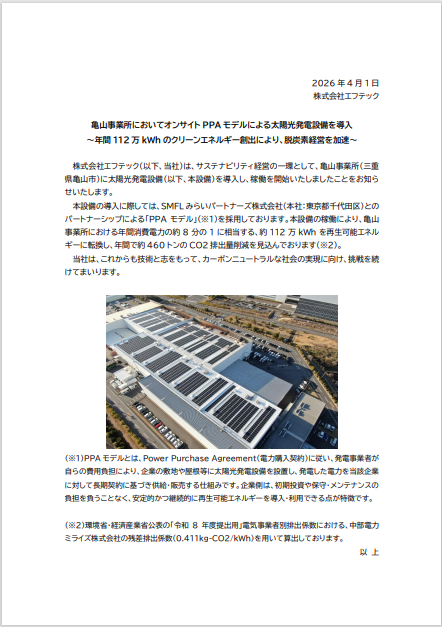
~A Challenge for the Future: Kameyama Plant Solar Power Project~
Contributions
To the Environment
Generation of
1.12 million kWh
of clean electricity per year
CO2 reduction equivalent to
13,000 cedar trees
“Visualization Monitor”
(Currently installed at the Kameyama Plant)
Installation of Solar Panels at the Kameyama Plant
Copyright(c) 2026 F-TECH INC. All Rights Reserved
26
Awards Received in Fiscal Year 2025
Stakeholder Evaluation Improvement
Certificate of Appreciation for Excellent Quality (Japan)
From Nissan Motor Co., Ltd.
Awarded to F-Tech (Japan Region)
GM Supplier of the Year Award
From General Motors
Awarded to F-TECH(Global)
Quality and Delivery Excellence Award
From Honda Development and Manufacturing of America
Awarded to F&P MEXICO (Mexico facility)
Quality Award
From General Motors
Awarded to F&P MEXICO(Mexico)
Quality and Delivery Excellence Award, Service Parts Category Award
From Honda Development and Manufacturing of America
Awarded to F&P (Canada)
Service Parts Platinum Award
From General Motors
Awarded to F&P(Canada)
TOYOTA Excellent Quality Performance Award
From Toyota Motor North America
Awarded to F&P (Canada)
Excellent Delivery Performance Award
From Toyota Motor Philippines
Awarded to F-TECH PHILIPPINES(PHILIPPINES)
Monthly Outstanding Quality Partner Award
From Guangzhou Automobile
Awarded to F.tech Zhongshan Inc. (China)
Best Safety Slogan Award
From Toyota Suppliers Club
Awarded to F-TECH PHILIPPINES(PHILIPPINES)
Overall Performance Award
From Denso Haryana
Awarded to INDIA STEEL SUMMIT(India)
ZERO PPM Award
From Ford Motor Company
Awarded to F-TECH THAILAND(THAILAND)
Best Supplier for QCD
From TOYOTA BOSHOKU AUTOMOTIVE INDIA
Awarded to INDIA STEEL SUMMIT(India)
Excellence Quality with Zero Defect
From Mitsubishi Motors Thailand
Awarded to F-TECH THAILAND(THAILAND)
Copyright(c) 2026 F-TECH INC. All Rights Reserved
27
アウトライン Outline
1 決算概要
Financial Summary
2 業績予想
Earnings Forecast
3 15次中計総括
15 th Mid-Term Business
Plan Summary
4 16次中計概要
16 th Mid-Term Business
Plan Summary
Copyright(c) 2026 F-TECH INC. All Rights Reserved
28
第16次中期経営計画
基本方針
Direction of the 16th
Mid-Term Business Plan (April 2026–March 2029)
Company
policy
Building Agility for Sustainable Corporate Growth
Goals
Operating Profit
Net income
※Net income attributable to owners of the parent
ROE
Back to Basics
Challenge for New
Strengthen financial health
by improving earnings power
Building a Foundation
for Sustainable Growth
-
Pursue the essence of Monozukuri
(Manufacturing)
-
Reinforce sales and development capabilities
to expand sales
-
Generate maximum returns with minimal
investment
-
Utilize new technologies and explore new fields
-
Reinforce governance
-
Realize Carbon Neutrality
-
Establish human capital management
Copyright(c) 2026 F-TECH INC. All Rights Reserved
-
Expand business in India
29
Stronger Sales & Development / New Technologies & New Fields
Strengthen sales and development capabilities
Use new technologies and explore new business fields
Pursue all-around business opportunities beyond existing business boundaries
Orders for New
Models from
Existing OEMs
Honda, GM, Toyota, U.S. EV makers, Suzuki, etc.
Development and
Evolution of New
Technologies
Goals
Secure over 25 billion
yen in new business
within three years
New OEM
Development and
Order Acquisition
Business
Development
in New Fields
Use of AI in Basic
Design Concepts
European, Chinese, and Other Manufacturers
Copyright(c) 2026 F-TECH INC. All Rights Reserved
30
Development and Expansion of New Technologies
~F-Tech Original Non-Destructive Testing Machine for Welded Joints~
Develop in-house non-destructive testing machines for product welds
Refine this technology and expand its implementation within the group
Basic Research
Prototype Introduction
Fully Automated System
Group-wide Rollout
In-house developed
non-destructive
testing machine
Non-destructive
testing operations at
our U.S. site
Automation of nondestructive testing
using robots at our
U.S. site
Currently conducting a trial
run of non-destructive
testing machine at the Kuki
factory in Japan
Already implemented
in production for U.S.based automakers
Currently under trial
operation in production for
Japanese automakers
Non-destructive
testing machine
In-house scoring
software
OK
NG
Copyright(c) 2026 F-TECH INC. All Rights Reserved
31
Next Step in Business Expansion in India
Establish a Cross-Functional Team to Promote India Business Strategy
Kick off to Establish R&D Center in India
Outline
Step1
~2026
Step2
~2026
Copyright(c) 2026 F-TECH INC. All Rights Reserved
Strengthening the
manufacturing structure
of partner companies
Support for improvement and
cost reduction
Japanese manufacturers
Ongoing and new orders
New Orders
Secure production capacity
Step3
~2027
Establishment of
R&D
Step4
~2028
New orders from
Indian automakers
Entry into the development area of existing
business partners
Establish Sales, Engineering, and Development
evaluation system for local automakers
Expand business by the collaboration with Indian
subsidiaries and JV companies
Secure production capacity with new TA and JV
partners
32
The F-TECH Carbon Neutral Challenge
Roadmap To Achieving Carbon Neutrality by 2050
Phase
product initiatives
Strengthening cooperation with
companies in other industries and
members of the supply chain
Scope 1 and 2 by 2035
Achieve carbon neutrality in the manufacturing domain
To date
・ Improvement
of product fuel
efficiency (weight
reduction)
Manufacturing area
To date
・ Energy conservation
initiatives
・ Adoption of ISO
50001
・ Partial introduction of
low-CO2 electricity
2022
Copyright(c) 2026 F-TECH INC. All Rights Reserved
Contribution to the
mobility society
Collaboration between
development and
manufacturing in
our integrated processing
system
Decarbonization of
business domains
Decarbonization
challenge
Scope 3 by 2050
Achieve neutrality
Respond to
customer needs
Achieve carbon neutrality
in the materials and
logistics domains
Expand into supply chain (SC) domain
Electrification of gas combustion facilities /
Switching to alternative fuels
Achieve carbon neutrality by 2050
Design, development,
and engineering areas
The F-TECH Carbon Neutral Challenge
Target
Energy-saving, high-efficiency/
Increased take-up of renewable energy
2035
2050
33
Well-being Mid-to-Long-Term Roadmap
Foundation Building
Fiscal
Year
2025-2026
Details
Current Status Survey
Issue Identification
Policy
Planning/Implementation
・Employee survey (satisfaction/challenges/needs)
・Inter-company exchanges/information gathering
System Establishment
2027
Establishment and
Expansion
2028
Flexible Work system
Health Support System
Career Support
Cultural Cultivation
Psychological Safety
Dialogue Culture
Social Events
Results and
Integration
2029
2030
Well-being Culture Entrenchment
Being Happy!
Realization
Community Engagement
Activities
Internal Sharing of Well-being Definition Internal Integration of Philosophy
Experiencing the Values of Philosophy
Initiatives
g
n
i
e
b
Well-
Promoting Women's Advancement
Skill Enhancement/CareerDevelopment Training
Proper Evaluation System Operation
Optimization of Workload
Work Environment Improvement
・External Training for Women
Communication Enhancement
・External training for managers
・Career lectures/roundtable discussions
・Employee roundtables
Target
Strengthening the
Domestic Base
Domestic Expansion /
Modeling
Global Expansion Begins
Expansion of Overseas sites
We define well-being as the state where the F-TECH Philosophy Embed throughout the company,
and embodying and experiencing its values defines our concept of well-being.
*Well-being refers to a state where individual rights and self-actualization are guaranteed, and one is in a favorable physical, mental, and social condition.
(Source: Ministry of Health, Labour and Welfare "Summary of the Employment Policy Research Group Report")
Copyright(c) 2026 F-TECH INC. All Rights Reserved
34
ご清聴ありがとうございました
Thank you for your attention!
本資料で記述している将来予測及び業績予想は、現時点で入手可能な情報に基づき当社が判断した予想であり、
潜在的なリスクや不確実性が含まれています。
そのため、様々な要因の変化により、実際の業績と記述としている将来見通しは、大きく異なる可能性があることを
御承知おき下さい。
The future outlook and earnings forecasts in this document are made based on the information
available at the moment, and they include potential risks and uncertainties.
As a result, please bear in mind that actual business performance may substantially differ from
the stated future forecasts due to changes in various factors.
「エフテック」で検索
https://www.ftech.co.jp
IR情報のお問い合わせ、取材お申し込みは
For inquiries on IR information, please contact:
株式会社エフテック 管理本部総務部/経理部
F-TECH INC.
Management Planning Division General Affairs Department/Finance and Accounting Department
代表TEL
Copyright(c) 2026 F-TECH INC. All Rights Reserved
0480-85-5211
Mail
[email protected]
Copyright(c) 2026 F-TECH INC. All Rights Reserved
Appendix
Consolidated Balance Sheet (FY2026 Year-End Actual)
Copyright(c) 2026 F-TECH INC. All Rights Reserved
Appendix Consolidated Cash Flow Statement (FY2026 Year-End Actual)
Copyright(c) 2026 F-TECH INC. All Rights Reserved
Appendix
~ Corporate Overview ~
Company Name
F-TECH INC.
Listing
Tokyo Stock Exchange, Standard Market(7212)
Capital
6.79 Billion Yen
President & CEO
Yuichi Fukuda
SALES
(Consolidated)
291.8 Billion Yen(Mar. 2026 )
Number of Employees
(Consolidated)
8,961( *971 )*Non-consolidated : only F-tech ( not included subsidiaries , expats)
Established
July 1,1947
Address
19 Showanuma, Shobucho, Kuki, Saitama, 346-0194 Japan
Main Customers
HONDA, GM, TOYOTA, NISSAN, etc.
Main Products
Suspension, Sub-frame, Axle beam, Pedal Control Parts for
As of Mar. 2026
automobiles, etc.
Copyright(c) 2026 F-TECH INC. All Rights Reserved
Appendix
~ F-TECH’s History ~
Established
AUTO Parts
Founding
(1947‐1964)
(1965‐1987)
Business Diversification
(1988‐1999)
Global Expansion
(2000‐ Today)
1986
2014
R&D NA Europe Branch Est.
1999
Daihatsu
1964
Name Changed to
FUKUDA Press
1997
Dyna-Mig Est.
F&P Mfg.
(Canada)Est.
1978
1996 Start OTC
1995
Nissan Shatai
1959
Honda Business
Start
1994
Start Motorcycle
Business
1947
FUKUDA
Seisakusho
Established
2011
F-TECH R&D Guangzhou Est.
F-tech Philippine Est.
1993
2006 F-TECH MFG(THAILAND)Est.
TSE 1st LISTED
2004 F-TECH WUHAN Est.
Kameyama Plant
1965
F&P America Est.
1988
1991
Mitsubishi Motors
Auto parts
Start
Company Name Change
To F-TECH
Copyright(c) 2026 F-TECH INC. All Rights Reserved
2012
F&P MFG.DE MEXICO Est.
2008
F-tech R&D Philippines Est.
Yantai Fuyan Est.
Head Office to KUKI
1967
2013
PT.F.TECH INDNESIA Est.
Michigan/R&D NA Office Est.
2003 R&D North America Est.
2002 F-TECH ZHONGSHAN Est.
2001 TOYOTA North America
Suzuki
TSE 2ND LISTED
2000 Nissan
F&P Georgia Mfg., Inc Est.
2023
TSE Standard
2023
F-TECH NORTH AMERICA
INC. Est.
2022
India Steel Summit Private
Limited M&A
TSE Prime
2021
TOYOTA
2020
Invest to VEE GEE Auto Components
Pvt Ltd.
2018
F-TECH AUTOMOTIVE COMPONENTS PRIVATE
LIMITED Est.
Appendix ~ Our Vehicle Components ~
Suspension Parts
Control parts
RR
FR
Mounted
Components
Module Assy
Our products are critical automotive safety components that perform the fundamental functions of
driving, turning, and stopping. We propose optimal specifications by considering higher operational
stability, riding comfort, and safety in the event of a collision.
Copyright(c) 2026 F-TECH INC. All Rights Reserved
Appendix
~ Our Business Outline(Chassis Parts Development and Production) ~
Product
Development
Forming
Welding
Painting
Assembly
All processes, from product planning and development to mass production, are handled
through our proprietary integrated processing system, allowing us to quickly deliver highly
competitive products.
Copyright(c) 2026 F-TECH INC. All Rights Reserved
Appendix
~ F-TECH Group Companies in Japan ~
【Facilities】
Head Office・Kuki Plant
Kameyama Plant
Haga Technical Center
Equipment Center
【Group Companies】
Fukuda Engineering
Kyushu F.tech Inc.
Reterra Inc.
Johnan
Manufacturing Inc.
Johnan Kyushu
Manufacturing Inc.
【Affiliated Companies】
Johnan Manufacturing Inc.
Johnan Kyushu Manufacturing Inc.
Reterra Inc.
(Chichibu)
Haga Technical Center
Kyushu F.tech Inc.
Equipment Center (Kazo)
Head Office・Kuki Plant
Kameyama
Plant
Copyright(c) 2026 F-TECH INC. All Rights Reserved
Fukuda Engineering Co., Ltd
(Kazo)
Appendix -F-TECH Group Overseas Subsidiaries
Dyna-Mig, A division of
YANTAI FUYAN MOULD
F&P Mfg.,Inc.
CO.,LTD
F-Tech WUHAN Inc.
F&P AMERICA MFG.,INC.
F&P Georgia, A division of
F&P America Mfg.,Inc.
F-Tech Zhongshan Inc.
F-TECH AUTOMOTIVE
COMPONENTS Pvt. Ltd.
India Steel Summit
Private Limited
F-TECH MFG.
(THAILAND)LTD.
F.tech
R&D(Guangzhou)Inc.
F.TECH PHILIPPINES, MFG.,INC.
F.tech R&D Philippines Inc.
PT.F.TECH
INDONESIA
(As of April 1, 2026)
F&P MFG.,INC.
Michigan/R&D NA Office
F-TECH NORTH
AMERICA INC.
F.TECH R&D
NORTH AMERICA INC.
F&P MFG DE MEXICO,
S.A. DE CV.
F.E.G. DE QUERETARO
S.A. DE C.V.
Production plants
R&D, Sales facilities
North America (6)
China (2)
Asia (4)
North America (3)
China(2)
Asia (2)
F-TECH operates 12 production bases and 7 R&D and sales facilities in 8 countries.
Copyright(c) 2026 F-TECH INC. All Rights Reserved
Appendix
~ Affiliates and Alliances ~
( As of April 1, 2026 )
Johnan Wuhan Inc.
Shanghai Huizhong
JV OZAUTO-AUSTEM L.L.C.
POS-AUSTEM Yantai
Automotive Co. Ltd.
JOHNAN AMERICA INC.
SMC Co.,Ltd.
PROGRESSIVE TOOLS &
COMPONENTS(P) Ltd.
VEE GEE Auto Components
Private Limited.
VEEGEE Industrial
Enterprises PVT. LTD
ERECT ENGINEERING
PRESSWORKS SDN.BHD.
DELLOYD Industries
(M) Sdn Bhd
CHEN IEU INDUSTRY CO., LTD.
POS-AUSTEM Wuhan
Automotive Co. Ltd.
JOHNAN F.TECH
(THAILAND)LTD.
PT.JFD INDONESIA
JOHNAN DE MEXICO,
S.A.DE C.V.
COSMA DO BRAZIL
Affiliates
Alliances
North America (2)
Asia (4)
China (1)
South America (2)
Asia (6)
China (3)
GESTAMP BRAZIL
We have established a global supply system for our products through partnerships in 6 countries
and 1 region.
Copyright(c) 2026 F-TECH INC. All Rights Reserved